PASS Sample Size Software
|
|
|
- Agnes Adams
- 6 years ago
- Views:
Transcription
1 Chapter 850 Introduction Cox proportional hazards regression models the relationship between the hazard function λ( t X ) time and k covariates using the following formula λ log λ ( t X ) ( t) 0 = β1 X1 + β2 X 2+ + β k X where λ 0 ( t ) is the baseline hazard. Note that the covariates may be discrete or continuous. k of survival This procedure calculates power and sample size for testing the hypothesis that β 1 = 0 versus the alternative that β 1 = B. Note that β 1 is the change in log hazards for a one-unit change in X 1 when the rest of the covariates are held constant. The procedure assumes that this hypothesis will be tested using the Wald (or score) statistic z = β Var 1 ( β1) Power Calculations Suppose you want to test the null hypothesis that β 1 = 0 versus the alternative that β 1 = B. Hsieh and Lavori (2000) gave a formula relating sample size, α, β, and B when X 1 is normally distributed. The sample size formula is D = ( z1 α / 2 + z1 β ) ( 1 R ) σ B where D is the number of events, σ 2 is the variance of X 1, and R 2 is the proportion of variance explained by the multiple regression of X 1 on the remaining covariates. It is interesting to note that the number of censored observations does not enter in to the power calculations. To obtain a formula for the sample size, N, we inflate D by dividing by P, the proportion of subjects that fail. Thus, the formula for N is N = ( z1 α / 2 + z1 β ) P( 1 R ) σ B This formula is an extension of an earlier formula for the case of a single, binary covariate derived by Schoenfeld (1983). Thus, it may be used with discrete or continuous covariates
2 Assumptions It is important to note that this formulation assumes that proportional hazards model with k covariates is valid. However, it does not assume exponential survival times. Procedure Options This section describes the options that are specific to this procedure. These are located on the Design tab. For more information about the options of other tabs, go to the Procedure Window chapter. Design Tab The Design tab contains most of the parameters and options that you will be concerned with. Solve For Solve For This option specifies the parameter to be solved for from the other parameters. Under most situations, you will select either Power for a power analysis or Sample Size for sample size determination. Select Sample Size when you want to calculate the sample size needed to achieve a given power and alpha level. Select Power when you want to calculate the power of an experiment. Test Alternative Hypothesis Specify whether the test is one-sided or two-sided. When a two-sided hypothesis is selected, the value of alpha is halved by PASS. Everything else remains the same. Note that the accepted procedure is to use the Two Sided option unless you can justify using a one-sided test. Power and Alpha Power This option specifies one or more values for power. Power is the probability of rejecting a false null hypothesis, and is equal to one minus Beta. Beta is the probability of a type-ii error, which occurs when a false null hypothesis is not rejected. In this procedure, a type-ii error occurs when you fail to reject the null hypothesis of equal probabilities of the event of interest when in fact they are different. Values must be between zero and one. Historically, the value of 0.80 (Beta = 0.20) was used for power. Now, 0.90 (Beta = 0.10) is also commonly used. A single value may be entered here or a range of values such as 0.8 to 0.95 by 0.05 may be entered. Alpha This option specifies one or more values for the probability of a type-i error (alpha). A type-i error occurs when you reject the null hypothesis of equal probabilities when in fact they are equal. Values of alpha must be between zero and one. Historically, the value of 0.05 has been used for alpha. This means that about one test in twenty will falsely reject the null hypothesis. You should pick a value for alpha that represents the risk of a type-i error you are willing to take in your experimental situation. You may enter a range of values such as or 0.01 to 0.10 by
3 Sample Size N (Sample Size) This option specifies the total number of observations in the sample. You may enter a single value or a list of values. Note that when the Overall Event Rate is set to 1.0, the sample size becomes the number of events. P (Overall Event Rate) Enter one or more values for the event rate. The event rate is the proportion of subjects in which the event of interest occurs during the duration of the study. This is the proportion of non-censored subjects. Since the values entered here are proportions, they must be in the range 0 < P 1. Note that when this value is set to 1.0, the sample size is the number of events (deaths). Effect Size Hazard Ratio B (Log Hazard Ratio) This procedure calculates power or sample size for testing the hypothesis that β 1 = 0 versus the alternative that β 1 = B in a Cox regression. Enter one or more values of B here. B is the predicted change in log (base e) hazards corresponding to a one unit change in X1 when the other covariates are held constant. Thus, if you want to detect a hazard ratio of 1.5, enter ln(1.5) = Although any non-zero value may be entered, common values are between -3 and 3. Effect Size Covariates (X1 is the Variable of Interest) R-Squared of X1 with Other X s This is the R-Squared that is obtained when X1 is regressed on the other X s (covariates) in the model. Use this to account for the influence on power and sample size of adding other covariates. Note that the number of additional variables does not matter in this formulation. Only their overall relationship with X1 through this R-Squared value is used. Of course, this value is restricted to being greater than or equal to zero and less than one. Use zero when there are no other covariates. S (Standard Deviation of X1) Enter an estimate of the standard deviation of X1, the predictor variable of interest. The formulation used here assumes that X1 follows the normal distribution. However, you can obtain approximate results for non-normal variables by putting in the correct value here. For example, if X1 is binary, the standard deviation is given by p ( 1 p) where p is the proportion of either of the binary values in the population of X1. If you don t have an estimate, you can press the SD button to obtain a window that will help you determine a rough estimate of the standard deviation
4 Example 1 Power for Several Sample Sizes Cox regression will be used to analyze the power of a survival time study. From past experience, the researchers want to evaluate the sample size needs for detecting regression coefficients of 0.2 and 0.3 for the independent variable of interest. The variable has a standard deviation of The R-squared of this variable with seven other covariates is The event rate is thought to be 70% over the 3-year duration of the study. The researchers will test their hypothesis using a 5% significance level with a two-sided Wald test. They decide to calculate the power at sample sizes between 5 and 250. Setup This section presents the values of each of the parameters needed to run this example. First, from the PASS Home window, load the procedure window by clicking on Regression, and then clicking on Cox Regression. You may then make the appropriate entries as listed below, or open Example 1 by going to the File menu and choosing Open Example Template. Option Value Design Tab Solve For... Power Alternative Hypothesis... Two-Sided Alpha N (Sample Size)... 5 to 250 by 40 P (Overall Event Rate) B (Log Hazard Ratio) R-Squared of X1 with Other X s S (Standard Deviation of X1) Annotated Output Click the Calculate button to perform the calculations and generate the following output. Numeric Results R-Squared Sample Reg. S.D. Event X1 vs Two- Size Coef. of X1 Rate Other X's Sided Power (N) (B) (SD) (P) (R2) Alpha Beta
5 Report Definitions Power is the probability of rejecting a false null hypothesis. It should be close to one. N is the size of the sample drawn from the population. B is the size of the regression coefficent to be detected. SD is the standard deviation of X1. P is the event rate. R2 is the R-squared achieved when X1 is regressed on the other covariates. Alpha is the probability of rejecting a true null hypothesis. Beta is the probability of accepting a false null hypothesis. Summary Statements A Cox regression of the log hazard ratio on a covariate with a standard deviation of based on a sample of 5 observations achieves 6% power at a significance level to detect a regression coefficient equal to The sample size was adjusted since a multiple regression of the variable of interest on the other covariates in the Cox regression is expected to have an R-Squared of The sample size was adjusted for an anticipated event rate of This report shows the power for each of the scenarios. Plots Section 850-5
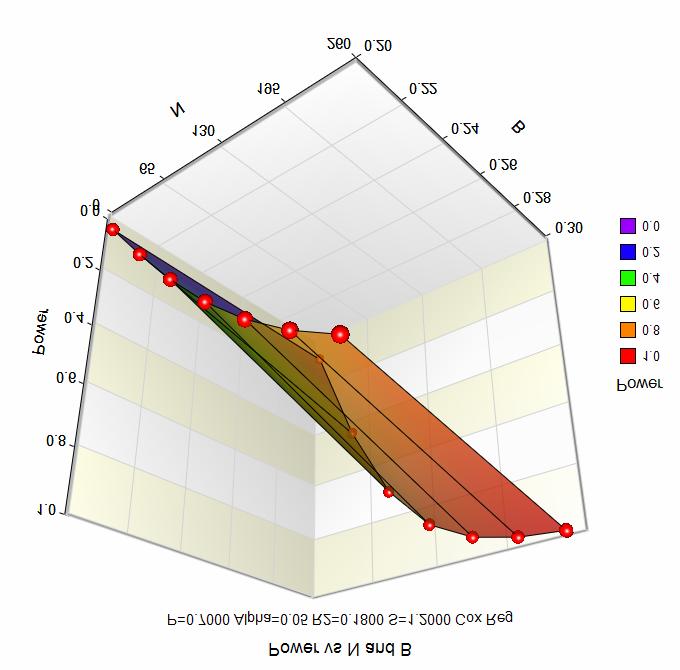
6 850-6
7 Example 2 Validation using Hsieh Hsieh and Lavori (2000) present an example which we will use to validate this program. In this example, B = 1.0, S = , R2 = , P = 0.738, one-sided alpha = 0.05, and power = They calculated N = 107. Setup This section presents the values of each of the parameters needed to run this example. First, from the PASS Home window, load the procedure window by clicking on Regression, and then clicking on Cox Regression. You may then make the appropriate entries as listed below, or open Example 2 by going to the File menu and choosing Open Example Template. Option Value Design Tab Solve For... Sample Size Alternative Hypothesis... One-Sided Power Alpha P (Overall Event Rate) B (Log Hazard Ratio) R-Squared of X1 with Other X s S (Standard Deviation of X1) Output Click the Calculate button to perform the calculations and generate the following output. Numeric Results R-Squared Sample Reg. S.D. Event X1 vs One- Size Coef. of X1 Rate Other X's Sided Power (N) (B) (SD) (P) (R2) Alpha Beta Note that PASS calculated 106 rather than the 107 calculated by Hsieh and Lavori (2000). The discrepancy is due to the intermediate rounding that they did. To show this, we will run a second example from Hsieh and Lavori in which R2 = 0 and P = 1.0. In this case, N = 64. Numeric Results with R2 = 0 and P = 1.0 R-Squared Sample Reg. S.D. Event X1 vs One- Size Coef. of X1 Rate Other X's Sided Power (N) (B) (SD) (P) (R2) Alpha Beta Note that PASS also calculated 64. Hsieh and Lavori obtained the 107 by adjusting this 64 for P first and then for R2. PASS does both adjustments at once, obtaining the 106. Thus, the difference is due to intermediate rounding
8 Example 3 Validation for Binary X1 using Schoenfeld Schoenfeld (1983), page 502, presents an example for the case when X1 is binary. In this example, B = ln(1.5) = , S = 0.5, R2 = 0.0, P = 0.71, one-sided alpha = 0.05, and power = Schoenfeld calculated N = 212. Setup This section presents the values of each of the parameters needed to run this example. First, from the PASS Home window, load the procedure window by clicking on Regression, and then clicking on Cox Regression. You may then make the appropriate entries as listed below, or open Example 3 by going to the File menu and choosing Open Example Template. Option Value Design Tab Solve For... Sample Size Alternative Hypothesis... One-Sided Power Alpha P (Overall Event Rate) B (Log Hazard Ratio) R-Squared of X1 with Other X s S (Standard Deviation of X1) Output Click the Calculate button to perform the calculations and generate the following output. Numeric Results R-Squared Sample Reg. S.D. Event X1 vs One- Size Coef. of X1 Rate Other X's Sided Power (N) (B) (SD) (P) (R2) Alpha Beta Note that PASS also obtains N =
Tests for One Variance
 Chapter 65 Introduction Occasionally, researchers are interested in the estimation of the variance (or standard deviation) rather than the mean. This module calculates the sample size and performs power
Tests for Two Variances
 Chapter 655 Tests for Two Variances Introduction Occasionally, researchers are interested in comparing the variances (or standard deviations) of two groups rather than their means. This module calculates
Tests for Intraclass Correlation
 Chapter 810 Tests for Intraclass Correlation Introduction The intraclass correlation coefficient is often used as an index of reliability in a measurement study. In these studies, there are K observations
Non-Inferiority Tests for the Ratio of Two Means in a 2x2 Cross-Over Design
 Chapter 515 Non-Inferiority Tests for the Ratio of Two Means in a x Cross-Over Design Introduction This procedure calculates power and sample size of statistical tests for non-inferiority tests from a
Tests for Two Exponential Means
 Chapter 435 Tests for Two Exponential Means Introduction This program module designs studies for testing hypotheses about the means of two exponential distributions. Such a test is used when you want to
Tests for the Odds Ratio in a Matched Case-Control Design with a Binary X
 Chapter 156 Tests for the Odds Ratio in a Matched Case-Control Design with a Binary X Introduction This procedure calculates the power and sample size necessary in a matched case-control study designed
Non-Inferiority Tests for Two Means in a 2x2 Cross-Over Design using Differences
 Chapter 510 Non-Inferiority Tests for Two Means in a 2x2 Cross-Over Design using Differences Introduction This procedure computes power and sample size for non-inferiority tests in 2x2 cross-over designs
Tests for the Difference Between Two Linear Regression Intercepts
 Chapter 853 Tests for the Difference Between Two Linear Regression Intercepts Introduction Linear regression is a commonly used procedure in statistical analysis. One of the main objectives in linear regression
Non-Inferiority Tests for the Ratio of Two Means
 Chapter 455 Non-Inferiority Tests for the Ratio of Two Means Introduction This procedure calculates power and sample size for non-inferiority t-tests from a parallel-groups design in which the logarithm
Tests for Two Means in a Multicenter Randomized Design
 Chapter 481 Tests for Two Means in a Multicenter Randomized Design Introduction In a multicenter design with a continuous outcome, a number of centers (e.g. hospitals or clinics) are selected at random
Group-Sequential Tests for Two Proportions
 Chapter 220 Group-Sequential Tests for Two Proportions Introduction Clinical trials are longitudinal. They accumulate data sequentially through time. The participants cannot be enrolled and randomized
Tests for Two ROC Curves
 Chapter 65 Tests for Two ROC Curves Introduction Receiver operating characteristic (ROC) curves are used to summarize the accuracy of diagnostic tests. The technique is used when a criterion variable is
Equivalence Tests for the Difference of Two Proportions in a Cluster- Randomized Design
 Chapter 240 Equivalence Tests for the Difference of Two Proportions in a Cluster- Randomized Design Introduction This module provides power analysis and sample size calculation for equivalence tests of
Tests for Paired Means using Effect Size
 Chapter 417 Tests for Paired Means using Effect Size Introduction This procedure provides sample size and power calculations for a one- or two-sided paired t-test when the effect size is specified rather
Tests for Two Means in a Cluster-Randomized Design
 Chapter 482 Tests for Two Means in a Cluster-Randomized Design Introduction Cluster-randomized designs are those in which whole clusters of subjects (classes, hospitals, communities, etc.) are put into
Mendelian Randomization with a Binary Outcome
 Chapter 851 Mendelian Randomization with a Binary Outcome Introduction This module computes the sample size and power of the causal effect in Mendelian randomization studies with a binary outcome. This
Tests for the Difference Between Two Poisson Rates in a Cluster-Randomized Design
 Chapter 439 Tests for the Difference Between Two Poisson Rates in a Cluster-Randomized Design Introduction Cluster-randomized designs are those in which whole clusters of subjects (classes, hospitals,
Mixed Models Tests for the Slope Difference in a 3-Level Hierarchical Design with Random Slopes (Level-3 Randomization)
") Chapter 375 Mixed Models Tests for the Slope Difference in a 3-Level Hierarchical Design with Random Slopes (Level-3 Randomization) Introduction This procedure calculates power and sample size for a three-level
Chapter 375 Mixed Models Tests for the Slope Difference in a 3-Level Hierarchical Design with Random Slopes (Level-3 Randomization) Introduction This procedure calculates power and sample size for a three-level
Equivalence Tests for the Ratio of Two Means in a Higher- Order Cross-Over Design
 Chapter 545 Equivalence Tests for the Ratio of Two Means in a Higher- Order Cross-Over Design Introduction This procedure calculates power and sample size of statistical tests of equivalence of two means
Equivalence Tests for Two Correlated Proportions
 Chapter 165 Equivalence Tests for Two Correlated Proportions Introduction The two procedures described in this chapter compute power and sample size for testing equivalence using differences or ratios
Superiority by a Margin Tests for the Ratio of Two Proportions
 Chapter 06 Superiority by a Margin Tests for the Ratio of Two Proportions Introduction This module computes power and sample size for hypothesis tests for superiority of the ratio of two independent proportions.
One-Sample Cure Model Tests
 Chapter 713 One-Sample Cure Model Tests Introduction This module computes the sample size and power of the one-sample parametric cure model proposed by Wu (2015). This technique is useful when working
Confidence Intervals for the Difference Between Two Means with Tolerance Probability
 Chapter 47 Confidence Intervals for the Difference Between Two Means with Tolerance Probability Introduction This procedure calculates the sample size necessary to achieve a specified distance from the
Two-Sample T-Tests using Effect Size
 Chapter 419 Two-Sample T-Tests using Effect Size Introduction This procedure provides sample size and power calculations for one- or two-sided two-sample t-tests when the effect size is specified rather
Non-Inferiority Tests for the Ratio of Two Proportions
 Chapter Non-Inferiority Tests for the Ratio of Two Proportions Introduction This module provides power analysis and sample size calculation for non-inferiority tests of the ratio in twosample designs in
Mendelian Randomization with a Continuous Outcome
 Chapter 85 Mendelian Randomization with a Continuous Outcome Introduction This module computes the sample size and power of the causal effect in Mendelian randomization studies with a continuous outcome.
Non-Inferiority Tests for the Odds Ratio of Two Proportions
 Chapter Non-Inferiority Tests for the Odds Ratio of Two Proportions Introduction This module provides power analysis and sample size calculation for non-inferiority tests of the odds ratio in twosample
Confidence Intervals for an Exponential Lifetime Percentile
 Chapter 407 Confidence Intervals for an Exponential Lifetime Percentile Introduction This routine calculates the number of events needed to obtain a specified width of a confidence interval for a percentile
Two-Sample Z-Tests Assuming Equal Variance
 Chapter 426 Two-Sample Z-Tests Assuming Equal Variance Introduction This procedure provides sample size and power calculations for one- or two-sided two-sample z-tests when the variances of the two groups
Tests for the Matched-Pair Difference of Two Event Rates in a Cluster- Randomized Design
 Chapter 487 Tests for the Matched-Pair Difference of Two Event Rates in a Cluster- Randomized Design Introduction Cluster-randomized designs are those in which whole clusters of subjects (classes, hospitals,
Confidence Intervals for Paired Means with Tolerance Probability
 Chapter 497 Confidence Intervals for Paired Means with Tolerance Probability Introduction This routine calculates the sample size necessary to achieve a specified distance from the paired sample mean difference
Equivalence Tests for One Proportion
 Chapter 110 Equivalence Tests for One Proportion Introduction This module provides power analysis and sample size calculation for equivalence tests in one-sample designs in which the outcome is binary.
Conover Test of Variances (Simulation)
") Chapter 561 Conover Test of Variances (Simulation) Introduction This procedure analyzes the power and significance level of the Conover homogeneity test. This test is used to test whether two or more population
Chapter 561 Conover Test of Variances (Simulation) Introduction This procedure analyzes the power and significance level of the Conover homogeneity test. This test is used to test whether two or more population
Equivalence Tests for the Odds Ratio of Two Proportions
 Chapter 5 Equivalence Tests for the Odds Ratio of Two Proportions Introduction This module provides power analysis and sample size calculation for equivalence tests of the odds ratio in twosample designs
Tests for Multiple Correlated Proportions (McNemar-Bowker Test of Symmetry)
") Chapter 151 Tests for Multiple Correlated Proportions (McNemar-Bowker Test of Symmetry) Introduction McNemar s test for correlated proportions requires that there be only possible categories for each outcome.
Chapter 151 Tests for Multiple Correlated Proportions (McNemar-Bowker Test of Symmetry) Introduction McNemar s test for correlated proportions requires that there be only possible categories for each outcome.
Tests for Two Independent Sensitivities
 Chapter 75 Tests for Two Independent Sensitivities Introduction This procedure gives power or required sample size for comparing two diagnostic tests when the outcome is sensitivity (or specificity). In
Non-Inferiority Tests for the Difference Between Two Proportions
 Chapter 0 Non-Inferiority Tests for the Difference Between Two Proportions Introduction This module provides power analysis and sample size calculation for non-inferiority tests of the difference in twosample
Confidence Intervals for Pearson s Correlation
 Chapter 801 Confidence Intervals for Pearson s Correlation Introduction This routine calculates the sample size needed to obtain a specified width of a Pearson product-moment correlation coefficient confidence
Confidence Intervals for One-Sample Specificity
 Chapter 7 Confidence Intervals for One-Sample Specificity Introduction This procedures calculates the (whole table) sample size necessary for a single-sample specificity confidence interval, based on a
Conditional Power of One-Sample T-Tests
 ASS Sample Size Software Chapter 4 Conditional ower of One-Sample T-Tests ntroduction n sequential designs, one or more intermediate analyses of the emerging data are conducted to evaluate whether the
Conditional Power of Two Proportions Tests
 Chapter 0 Conditional ower of Two roportions Tests ntroduction n sequential designs, one or more intermediate analyses of the emerging data are conducted to evaluate whether the experiment should be continued.
Point-Biserial and Biserial Correlations
 Chapter 302 Point-Biserial and Biserial Correlations Introduction This procedure calculates estimates, confidence intervals, and hypothesis tests for both the point-biserial and the biserial correlations.
One Proportion Superiority by a Margin Tests
 Chapter 512 One Proportion Superiority by a Margin Tests Introduction This procedure computes confidence limits and superiority by a margin hypothesis tests for a single proportion. For example, you might
**BEGINNING OF EXAMINATION** A random sample of five observations from a population is:
 **BEGINNING OF EXAMINATION** 1. You are given: (i) A random sample of five observations from a population is: 0.2 0.7 0.9 1.1 1.3 (ii) You use the Kolmogorov-Smirnov test for testing the null hypothesis,
Financial Econometrics Review Session Notes 4
 Financial Econometrics Review Session Notes 4 February 1, 2011 Contents 1 Historical Volatility 2 2 Exponential Smoothing 3 3 ARCH and GARCH models 5 1 In this review session, we will use the daily S&P
Gamma Distribution Fitting
 Chapter 552 Gamma Distribution Fitting Introduction This module fits the gamma probability distributions to a complete or censored set of individual or grouped data values. It outputs various statistics
Tolerance Intervals for Any Data (Nonparametric)
") Chapter 831 Tolerance Intervals for Any Data (Nonparametric) Introduction This routine calculates the sample size needed to obtain a specified coverage of a β-content tolerance interval at a stated confidence
Chapter 831 Tolerance Intervals for Any Data (Nonparametric) Introduction This routine calculates the sample size needed to obtain a specified coverage of a β-content tolerance interval at a stated confidence
1. You are given the following information about a stationary AR(2) model:
 model:") Fall 2003 Society of Actuaries **BEGINNING OF EXAMINATION** 1. You are given the following information about a stationary AR(2) model: (i) ρ 1 = 05. (ii) ρ 2 = 01. Determine φ 2. (A) 0.2 (B) 0.1 (C) 0.4
Fall 2003 Society of Actuaries **BEGINNING OF EXAMINATION** 1. You are given the following information about a stationary AR(2) model: (i) ρ 1 = 05. (ii) ρ 2 = 01. Determine φ 2. (A) 0.2 (B) 0.1 (C) 0.4
7. For the table that follows, answer the following questions: x y 1-1/4 2-1/2 3-3/4 4
 7. For the table that follows, answer the following questions: x y 1-1/4 2-1/2 3-3/4 4 - Would the correlation between x and y in the table above be positive or negative? The correlation is negative. -
INSTITUTE AND FACULTY OF ACTUARIES. Curriculum 2019 SPECIMEN EXAMINATION
 INSTITUTE AND FACULTY OF ACTUARIES Curriculum 2019 SPECIMEN EXAMINATION Subject CS1A Actuarial Statistics Time allowed: Three hours and fifteen minutes INSTRUCTIONS TO THE CANDIDATE 1. Enter all the candidate
Fall 2004 Social Sciences 7418 University of Wisconsin-Madison Problem Set 5 Answers
 Economics 310 Menzie D. Chinn Fall 2004 Social Sciences 7418 University of Wisconsin-Madison Problem Set 5 Answers This problem set is due in lecture on Wednesday, December 15th. No late problem sets will
Risk Analysis. å To change Benchmark tickers:
 Property Sheet will appear. The Return/Statistics page will be displayed. 2. Use the five boxes in the Benchmark section of this page to enter or change the tickers that will appear on the Performance
CHAPTER 12 EXAMPLES: MONTE CARLO SIMULATION STUDIES
 Examples: Monte Carlo Simulation Studies CHAPTER 12 EXAMPLES: MONTE CARLO SIMULATION STUDIES Monte Carlo simulation studies are often used for methodological investigations of the performance of statistical
Lecture 8: Single Sample t test
 Lecture 8: Single Sample t test Review: single sample z-test Compares the sample (after treatment) to the population (before treatment) You HAVE to know the populational mean & standard deviation to use
Analysis of 2x2 Cross-Over Designs using T-Tests for Non-Inferiority
 Chapter 235 Analysis of 2x2 Cross-Over Designs using -ests for Non-Inferiority Introduction his procedure analyzes data from a two-treatment, two-period (2x2) cross-over design where the goal is to demonstrate
STA2601. Tutorial letter 105/2/2018. Applied Statistics II. Semester 2. Department of Statistics STA2601/105/2/2018 TRIAL EXAMINATION PAPER
 STA2601/105/2/2018 Tutorial letter 105/2/2018 Applied Statistics II STA2601 Semester 2 Department of Statistics TRIAL EXAMINATION PAPER Define tomorrow. university of south africa Dear Student Congratulations
sociology SO5032 Quantitative Research Methods Brendan Halpin, Sociology, University of Limerick Spring 2018 SO5032 Quantitative Research Methods
 1 SO5032 Quantitative Research Methods Brendan Halpin, Sociology, University of Limerick Spring 2018 Lecture 10: Multinomial regression baseline category extension of binary What if we have multiple possible
Two-Sample T-Test for Superiority by a Margin
 Chapter 219 Two-Sample T-Test for Superiority by a Margin Introduction This procedure provides reports for making inference about the superiority of a treatment mean compared to a control mean from data
Data Analysis and Statistical Methods Statistics 651
 Data Analysis and Statistical Methods Statistics 651 http://www.stat.tamu.edu/~suhasini/teaching.html Lecture 10 (MWF) Checking for normality of the data using the QQplot Suhasini Subba Rao Checking for
Two-Sample T-Test for Non-Inferiority
 Chapter 198 Two-Sample T-Test for Non-Inferiority Introduction This procedure provides reports for making inference about the non-inferiority of a treatment mean compared to a control mean from data taken
Homework Assignment Section 3
 Homework Assignment Section 3 Tengyuan Liang Business Statistics Booth School of Business Problem 1 A company sets different prices for a particular stereo system in eight different regions of the country.
Practice Exam 1. Loss Amount Number of Losses
 Practice Exam 1 1. You are given the following data on loss sizes: An ogive is used as a model for loss sizes. Determine the fitted median. Loss Amount Number of Losses 0 1000 5 1000 5000 4 5000 10000
Applied Macro Finance
 Master in Money and Finance Goethe University Frankfurt Week 2: Factor models and the cross-section of stock returns Fall 2012/2013 Please note the disclaimer on the last page Announcements Next week (30
REGIONAL WORKSHOP ON TRAFFIC FORECASTING AND ECONOMIC PLANNING
 International Civil Aviation Organization 27/8/10 WORKING PAPER REGIONAL WORKSHOP ON TRAFFIC FORECASTING AND ECONOMIC PLANNING Cairo 2 to 4 November 2010 Agenda Item 3 a): Forecasting Methodology (Presented
GARCH Models. Instructor: G. William Schwert
 APS 425 Fall 2015 GARCH Models Instructor: G. William Schwert 585-275-2470 schwert@schwert.ssb.rochester.edu Autocorrelated Heteroskedasticity Suppose you have regression residuals Mean = 0, not autocorrelated
Intro to GLM Day 2: GLM and Maximum Likelihood
 Intro to GLM Day 2: GLM and Maximum Likelihood Federico Vegetti Central European University ECPR Summer School in Methods and Techniques 1 / 32 Generalized Linear Modeling 3 steps of GLM 1. Specify the
Confidence Intervals for One Variance using Relative Error
 Chapter 653 Confidence Interval for One Variance uing Relative Error Introduction Thi routine calculate the neceary ample ize uch that a ample variance etimate will achieve a pecified relative ditance
Lecture 21: Logit Models for Multinomial Responses Continued
 Lecture 21: Logit Models for Multinomial Responses Continued Dipankar Bandyopadhyay, Ph.D. BMTRY 711: Analysis of Categorical Data Spring 2011 Division of Biostatistics and Epidemiology Medical University
Washington University Fall Economics 487
 Washington University Fall 2009 Department of Economics James Morley Economics 487 Project Proposal due Tuesday 11/10 Final Project due Wednesday 12/9 (by 5:00pm) (20% penalty per day if the project is
Advisor Proposal Generator. Getting Started
 Advisor Proposal Generator Getting Started After logging in, Press the New Proposal button 2 P a g e Either press the Select from list button to choose a previously entered Household or enter information
Time Invariant and Time Varying Inefficiency: Airlines Panel Data
 Time Invariant and Time Varying Inefficiency: Airlines Panel Data These data are from the pre-deregulation days of the U.S. domestic airline industry. The data are an extension of Caves, Christensen, and
Confidence Intervals for One Variance with Tolerance Probability
 Chapter 65 Confidence Interval for One Variance with Tolerance Probability Introduction Thi procedure calculate the ample ize neceary to achieve a pecified width (or in the cae of one-ided interval, the
COMM 324 INVESTMENTS AND PORTFOLIO MANAGEMENT ASSIGNMENT 2 Due: October 20
 COMM 34 INVESTMENTS ND PORTFOLIO MNGEMENT SSIGNMENT Due: October 0 1. In 1998 the rate of return on short term government securities (perceived to be risk-free) was about 4.5%. Suppose the expected rate
Maximum Likelihood Estimates for Alpha and Beta With Zero SAIDI Days
 Maximum Likelihood Estimates for Alpha and Beta With Zero SAIDI Days 1. Introduction Richard D. Christie Department of Electrical Engineering Box 35500 University of Washington Seattle, WA 98195-500 christie@ee.washington.edu
Building and Checking Survival Models
 Building and Checking Survival Models David M. Rocke May 23, 2017 David M. Rocke Building and Checking Survival Models May 23, 2017 1 / 53 hodg Lymphoma Data Set from KMsurv This data set consists of information
Finance 100: Corporate Finance
 Finance 100: Corporate Finance Professor Michael R. Roberts Quiz 2 October 31, 2007 Name: Section: Question Maximum Student Score 1 30 2 40 3 30 Total 100 Instructions: Please read each question carefully
Jacob: The illustrative worksheet shows the values of the simulation parameters in the upper left section (Cells D5:F10). Is this for documentation?
. Is this for documentation?") PROJECT TEMPLATE: DISCRETE CHANGE IN THE INFLATION RATE (The attached PDF file has better formatting.) {This posting explains how to simulate a discrete change in a parameter and how to use dummy variables
PROJECT TEMPLATE: DISCRETE CHANGE IN THE INFLATION RATE (The attached PDF file has better formatting.) {This posting explains how to simulate a discrete change in a parameter and how to use dummy variables
SFSU FIN822 Project 1
 SFSU FIN822 Project 1 This project can be done in a team of up to 3 people. Your project report must be accompanied by printouts of programming outputs. You could use any software to solve the problems.
Chapter 6 Confidence Intervals
 Chapter 6 Confidence Intervals Section 6-1 Confidence Intervals for the Mean (Large Samples) VOCABULARY: Point Estimate A value for a parameter. The most point estimate of the population parameter is the
Duration Models: Parametric Models
 Duration Models: Parametric Models Brad 1 1 Department of Political Science University of California, Davis January 28, 2011 Parametric Models Some Motivation for Parametrics Consider the hazard rate:
Variance clustering. Two motivations, volatility clustering, and implied volatility
 Variance modelling The simplest assumption for time series is that variance is constant. Unfortunately that assumption is often violated in actual data. In this lecture we look at the implications of time
Additional Case Study One: Risk Analysis of Home Purchase
 Additional Case Study One: Risk Analysis of Home Purchase This case study focuses on assessing the risk of housing investment. The key point is that standard deviation and covariance analysis can be effectively
Washington University Fall Economics 487. Project Proposal due Monday 10/22 Final Project due Monday 12/3
 Washington University Fall 2001 Department of Economics James Morley Economics 487 Project Proposal due Monday 10/22 Final Project due Monday 12/3 For this project, you will analyze the behaviour of 10
The University of Chicago, Booth School of Business Business 41202, Spring Quarter 2009, Mr. Ruey S. Tsay. Solutions to Final Exam
 The University of Chicago, Booth School of Business Business 41202, Spring Quarter 2009, Mr. Ruey S. Tsay Solutions to Final Exam Problem A: (42 pts) Answer briefly the following questions. 1. Questions
STATISTICS 110/201, FALL 2017 Homework #5 Solutions Assigned Mon, November 6, Due Wed, November 15
 STATISTICS 110/201, FALL 2017 Homework #5 Solutions Assigned Mon, November 6, Due Wed, November 15 For this assignment use the Diamonds dataset in the Stat2Data library. The dataset is used in examples
Key Objectives. Module 2: The Logic of Statistical Inference. Z-scores. SGSB Workshop: Using Statistical Data to Make Decisions
 SGSB Workshop: Using Statistical Data to Make Decisions Module 2: The Logic of Statistical Inference Dr. Tom Ilvento January 2006 Dr. Mugdim Pašić Key Objectives Understand the logic of statistical inference
Oracle Financial Services Market Risk User Guide
 Oracle Financial Services User Guide Release 8.0.4.0.0 March 2017 Contents 1. INTRODUCTION... 1 PURPOSE... 1 SCOPE... 1 2. INSTALLING THE SOLUTION... 3 2.1 MODEL UPLOAD... 3 2.2 LOADING THE DATA... 3 3.
Tests for Two Correlations
 PASS Sample Sze Software Chapter 805 Tests for Two Correlatons Introducton The correlaton coeffcent (or correlaton), ρ, s a popular parameter for descrbng the strength of the assocaton between two varables.
Final Exam Suggested Solutions
 University of Washington Fall 003 Department of Economics Eric Zivot Economics 483 Final Exam Suggested Solutions This is a closed book and closed note exam. However, you are allowed one page of handwritten
Econometric Methods for Valuation Analysis
 Econometric Methods for Valuation Analysis Margarita Genius Dept of Economics M. Genius (Univ. of Crete) Econometric Methods for Valuation Analysis Cagliari, 2017 1 / 25 Outline We will consider econometric
Panel Data with Binary Dependent Variables
 Essex Summer School in Social Science Data Analysis Panel Data Analysis for Comparative Research Panel Data with Binary Dependent Variables Christopher Adolph Department of Political Science and Center
Two hours. To be supplied by the Examinations Office: Mathematical Formula Tables and Statistical Tables THE UNIVERSITY OF MANCHESTER
 Two hours MATH20802 To be supplied by the Examinations Office: Mathematical Formula Tables and Statistical Tables THE UNIVERSITY OF MANCHESTER STATISTICAL METHODS Answer any FOUR of the SIX questions.
Non-Inferiority Tests for the Ratio of Two Correlated Proportions
 Chater 161 Non-Inferiority Tests for the Ratio of Two Correlated Proortions Introduction This module comutes ower and samle size for non-inferiority tests of the ratio in which two dichotomous resonses
John Hull, Risk Management and Financial Institutions, 4th Edition
 P1.T2. Quantitative Analysis John Hull, Risk Management and Financial Institutions, 4th Edition Bionic Turtle FRM Video Tutorials By David Harper, CFA FRM 1 Chapter 10: Volatility (Learning objectives)
Data screening, transformations: MRC05
 Dale Berger Data screening, transformations: MRC05 This is a demonstration of data screening and transformations for a regression analysis. Our interest is in predicting current salary from education level
The University of Chicago, Booth School of Business Business 41202, Spring Quarter 2010, Mr. Ruey S. Tsay Solutions to Final Exam
 The University of Chicago, Booth School of Business Business 410, Spring Quarter 010, Mr. Ruey S. Tsay Solutions to Final Exam Problem A: (4 pts) Answer briefly the following questions. 1. Questions 1
Financial Mathematics III Theory summary
 Financial Mathematics III Theory summary Table of Contents Lecture 1... 7 1. State the objective of modern portfolio theory... 7 2. Define the return of an asset... 7 3. How is expected return defined?...
Portfolio Risk Management and Linear Factor Models
 Chapter 9 Portfolio Risk Management and Linear Factor Models 9.1 Portfolio Risk Measures There are many quantities introduced over the years to measure the level of risk that a portfolio carries, and each
Expected Return Methodologies in Morningstar Direct Asset Allocation
 Expected Return Methodologies in Morningstar Direct Asset Allocation I. Introduction to expected return II. The short version III. Detailed methodologies 1. Building Blocks methodology i. Methodology ii.
Logit Models for Binary Data
 Chapter 3 Logit Models for Binary Data We now turn our attention to regression models for dichotomous data, including logistic regression and probit analysis These models are appropriate when the response