V Time Varying Covariance and Correlation. Covariances and Correlations
|
|
|
- Marylou Benson
- 6 years ago
- Views:
Transcription
1 V Time Varying Covariance and Correlation DEFINITION OF CORRELATIONS ARE THEY TIME VARYING? WHY DO WE NEED THEM? ONE FACTOR ARCH MODEL DYNAMIC CONDITIONAL CORRELATIONS ASSET ALLOCATION THE VALUE OF CORRELATION INFORMATION AND ITS RELATION TO RISK MANAGEMENT Covariances and Correlations CORRELATIONS MEASURE THE DEGREE TO WHICH TWO SERIES MOVE TOGETHER THEORETICAL DEFINITION: Let r and r be mean zero random variables, then ,2 1 2 E r r E r E r, and 1,2 E rr Er2 E r 1
2 Unconditional Covariances and Correlations Data {r 1,t,r 2,t } Calculation taking out means: Covariance: ˆ T 1 r t r r t r 1,2 1, 1 2, 2 T t1 Correlation: ˆ 1,2 1 T T r1, t r1 r2, t r2 t1 ˆ ˆ Y_00 0 Y_ X X Y_ Y X X 2
3 10 YEARS OF LARGE CAP RETURNS MMM HD MO MMM HD MO AXP JPM INTC MSFT MRK AXP JPM INTC MSFT MRK 3
4 Are correlations/covariances time varying? Yes Correlations are time varying Derivative prices of correlation sensitive products imply changes (dispersion trade). Derivatives on correlation now are traded (correlation swaps). Time series estimates change. There are many varieties. Recall that for a single asset, we defined the conditional variance as the variance of the unpredictable part. That is, if rt t t then the conditional 2 variance is given by ht Et 1 t. Hence if there is predictability in the mean, we don t include that variation in the conditional variance, we remove it first. 4
5 The same is true for the conditional variance covariance matrix. We define the conditional variance covariance matrix for the part of y t that is not predictable. The conditional variance covariance matrix is given by t and is the variance covariance matrix of If the mean is zero and has no dynamics then y t t ε y μ t t t If mean returns are not predictable then y t = t and a two dimensional covariance matrix looks like: E t r r r 2 2 1, t 1, t 2, t 1, t 1,2, t t1 2 2 r1, tr2, t r 2, t 1,2, t 2, t Conditional Covariance: E r r 1, t 2, t Ft 1 Conditional Variances 5
6 CONDITIONAL CORRELATIONS Conditional correlations are then given by 1,2, t 1,2, t 1, t 2, t E t1r1, tr2, t 2 2 E r E r t1 1, t t 1 2, t ESTIMATION HISTORICAL CORRELATIONS Use a rolling window of N observations for both covariances and variances. EXPONENTIAL SMOOTHING Use an exponential smoother for both covariances and variances using the same smoothing parameter. 6
7 day historical correlations between AXP and GE C100_AXP_GE WHY DO WE NEED CORRELATIONS? 7
8 WHY DO WE NEED CORRELATIONS? CALCULATE PORTFOLIO RISK FORM OPTIMAL PORTFOLIOS PRICE HEDGE AND TRADE DERIVATIVES PORTFOLIO VARIANCE WITH TWO ASSETS HISTORICAL VARIANCE Look at historical variance of w 1 r 1t +w 2 r 2t CALCULATE VARIANCE portfolio w w 2ww ,2 CALCULATE DYNAMIC VARIANCE w w 2ww portfolio, t 1 1, t 2 2, t 1 2 1,2, t 1, t 2, t 8
9 FINDING THE OPTIMAL PORTFOLIO Minimize portfolio variance subject to a required return. Markowitz With covariance matrix and expected excess returns above a riskless rate of μ min st.. w' w 0 w' w 1 μ 1 0 μ' μ In a time varying setting conditionally optimal weights look like: w t μ 0 μ' μ 1 t 1 t 9
10 MULTIVARIATE MODELS SOME MODELS ONE FACTOR MODEL MANY FACTOR MODEL MULTIVARIATE GARCH DYNAMIC CONDITIONAL CORRELATION 10
11 ONE FACTOR ARCH One factor model such as CAPM There is one market factor with fixed betas and constant variance idiosyncratic errors independent of the factor. The market has 2 some type of GARCH with variance mt,. r r e it, i mt, it, it, i mt, i If the market has asymmetric volatility, then individual stocks will too. CORRELATIONS Between stock i and stock j assuming idiosyncracies are uncorrelated. 2 i, j, t i j mt, i, j, t 2 i j mt, i imt, j jmt, Assuming betas are both positive, correlations range from zero to one and increase with market volatility. Returns will have lower tail dependence if the market is negatively skewed. 11
12 CALCULATIONS VOLATILITY OF INDIVIDUAL STOCK = it, i mt, i Notice that we can do this either in daily vols or annualized vols. Whatever we use for inputs, we will get the same for an answer. CORRELATION = 2 i j mt, i, j, t i i mt, j j mt, CALCULATION Find the correlation between two stocks with betas and annualized idiosyncratic volatilities given by: Beta1=1, Beta2=2 Sig1=20%, Sig2=30% When Market vol = 10% Volatility 1 = Volatility 2 = Correlation= When Market vol = 40% Volatility 1 = Volatility 2 = Correlation= 12
13 PORTFOLIO VARIANCE AND VaR For a $1,000,000 portfolio with 60% in the first asset and 40% in the second find the portfolio volatility and 1% VaR for each of these market volatilities. Assume normality for the VaR. When market vol = 10% When market vol = 40% HOW TO ESTIMATE A ONE FACTOR MODEL FIT THE VOLATILITY OF THE MARKET PORTFOLIO ESTIMATE THE BETAS OF THE STOCKS AND THE VARIANCE OF THE IDIOSYNCRACIES CALCULATE THE TIME VARYING CORRELATIONS CALCULATE THE Volatility and VaR 13
14 MARKET VOLATILITY Conditional Standard Deviation CALCULATE DYNAMIC CORRELATIONS t h ht 1 2ht 2 t 14
15 AXP AND GE AGAIN C4_AXP_GE Dynamic Conditional Correlation o DCC is a new type of multivariate GARCH model that is particularly convenient for big systems. See Engle(2002) or Engle(2005). o Engle s text came out in
16 DYNAMIC CONDITIONAL CORRELATION OR DCC 1. Estimate volatilities for each asset and compute the standardized residuals or volatility adjusted returns. 2. Estimate the time varying covariances between these using a maximum likelihood criterion and one of several models for the correlations. 3. Form the correlation matrix and covariance matrix. They are guaranteed to be positive definite. HOW IT WORKS When two assets move in the same direction, the correlation is increased slightly. This effect may be stronger in down markets (asymmetry in correlations). When they move in the opposite direction it is decreased. The correlations often are assumed to only temporarily deviate from a long run mean 16
17 CORRELATIONS UPDATE LIKE GARCH Approximately, z z t 1, t1 2, t1 t1 1 Unconditional correlation z it r it This is the standardized residual for asset i. h it An asymmetric model allows correlations to increase more when both prices move down together (like our asymmetric GARCH models. z z z z ( I )( I ) t 1, t1 2, t1 1, t1 2, t1 z 0 z 0 t1 1t 2t 17
18 .9 DCC Correlations C9_AXP_GE C100_AXP_GE C4_AXP_GE C9_AXP_GE 18
19 Application: Asymmetric Dynamic Correlations of Global Equity and Bond Returns Lorenzo Capiello, Robert Engle and Kevin Sheppard Journal of Financial Econometrics (2006) Data Weekly $ returns Jan 1987 to Feb 2002 (785 observations) 21 Country Equity Series from FTSE All-World Index 13 Datastream Benchmark Bond Indices with 5 years average maturity 19
20 Europe AUSTRIA* BELGIUM* DENMARK* FRANCE* GERMANY* IRELAND* ITALY THE NETHERLANDS* SPAIN SWEDEN* SWITZERLAND* NORWAY UNITED KINGDOM* Australasia AUSTRALIA HONG KONG JAPAN* NEW ZEALAND SINGAPORE Americas CANADA* MEXICO UNITED STATES* *with bond returns GARCH Models (asymmetric in orange) GARCH AVGARCH NGARCH EGARCH ZGARCH GJR-GARCH APARCH AGARCH NAGARCH 3EQ,8BOND 0 1BOND 6EQ,1BOND 8EQ,1BOND 3EQ,1BOND 0 1EQ,1BOND 0 20
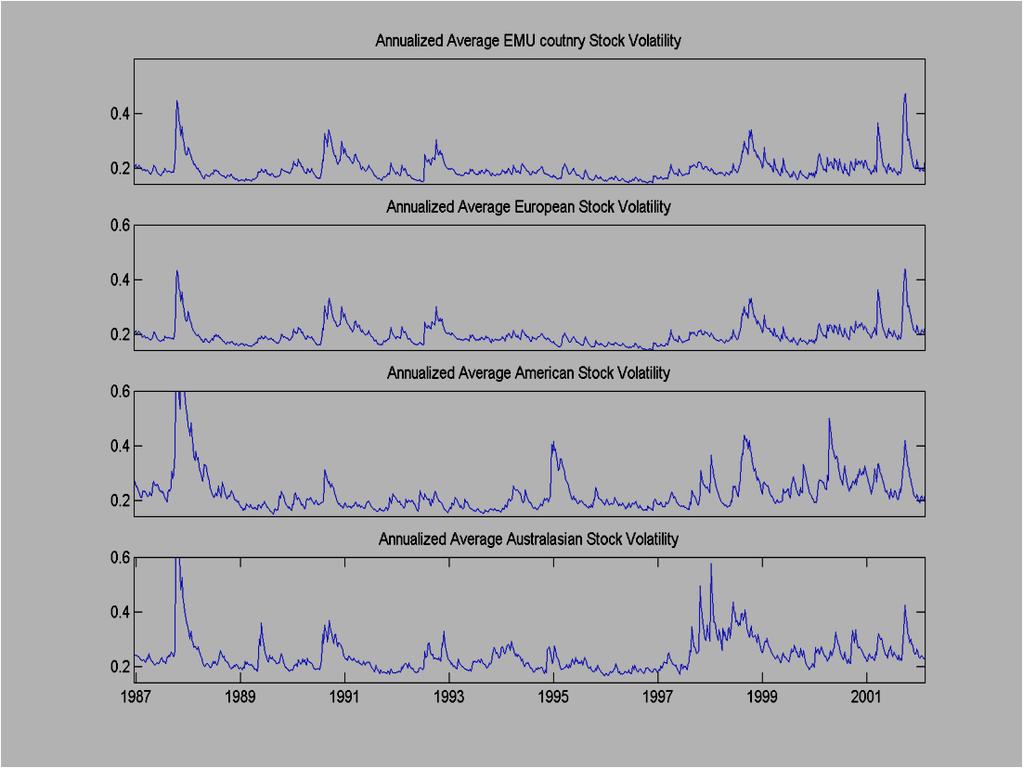

21 21
22 AVERAGE EMU COUNTRY BOND RETURN CORRELATION RESULTS Asymmetric Correlations correlations rise after negative returns Shift in level of correlations with formation of Euro Correlations are rising not just within EMU EMU Bond correlations are especially high 22
Downside Risk: Implications for Financial Management Robert Engle NYU Stern School of Business Carlos III, May 24,2004
 Downside Risk: Implications for Financial Management Robert Engle NYU Stern School of Business Carlos III, May 24,2004 WHAT IS ARCH? Autoregressive Conditional Heteroskedasticity Predictive (conditional)
Market Overview As of 1/31/2019
 Asset Class Leadership Periodic Table Worst Best 78.51 58.21 41.45 37.21 34.47 27.45 26.46 20.58 19.69 29.09 27.58 2 18.88 16.71 15.51 15.12 15.06 11.15 7.84 7.28 4.98 2.64 2.11 0.39-2.91-5.50-13.71 20.14
Market Overview As of 4/30/2018
 Asset Class Leadership Periodic Table Worst Best 5.24-26.16-28.92-36.85-37.00-37.34-38.44-38.54-45.53 78.51 58.21 41.45 37.21 34.47 27.45 26.46 20.58 19.69 29.09 27.58 24.50 18.88 16.71 15.51 15.12 15.06
Market Overview As of 11/30/2018
 Asset Class Leadership Periodic Table Worst Best 5.24-26.16-28.92-36.85-37.00-37.34-38.44-38.54-45.53 78.51 58.21 41.45 37.21 34.47 27.45 26.46 20.58 19.69 29.09 27.58 24.50 18.88 16.71 15.51 15.12 15.06
1000G 1000G HY
 Asset Class Leadership Periodic Table Worst Best 5.24-26.16-28.92-36.85-37.00-37.34-38.44-38.54-45.53 78.51 58.21 41.45 37.21 34.47 27.45 26.46 20.58 19.69 29.09 27.58 24.50 18.88 16.71 15.51 15.12 15.06
Market Overview As of 8/31/2017
 Asset Class Leadership Periodic Table Worst Best 39.42 16.65 11.81 7.05 6.97 5.49 1.87-0.17-9.78 5.24-26.16-28.92-36.85-37.00-37.34-38.44-38.54-45.53 78.51 58.21 41.45 37.21 34.47 27.45 26.46 20.58 19.69
Market Overview As of 10/31/2017
 Asset Class Leadership Periodic Table Worst Best 39.42 16.65 11.81 7.05 6.97 5.49 1.87-0.17-9.78 5.24-26.16-28.92-36.85-37.00-37.34-38.44-38.54-45.53 78.51 58.21 41.45 37.21 34.47 27.45 26.46 20.58 19.69
Implied Volatility Correlations
 Implied Volatility Correlations Robert Engle, Stephen Figlewski and Amrut Nashikkar Date: May 18, 2007 Derivatives Research Conference, NYU IMPLIED VOLATILITY Implied volatilities from market traded options
Investigating the Intertemporal Risk-Return Relation in International. Stock Markets with the Component GARCH Model
 Investigating the Intertemporal Risk-Return Relation in International Stock Markets with the Component GARCH Model Hui Guo a, Christopher J. Neely b * a College of Business, University of Cincinnati, 48
Table 1: Foreign exchange turnover: Summary of surveys Billions of U.S. dollars. Number of business days
 Table 1: Foreign exchange turnover: Summary of surveys Billions of U.S. dollars Total turnover Number of business days Average daily turnover change 1983 103.2 20 5.2 1986 191.2 20 9.6 84.6 1989 299.9
A longitudinal study on Portfolio Optimization: Is the Success Time Dependent?
 1 A longitudinal study on Portfolio Optimization: Is the Success Time Dependent? Gyöngyi Bugár University of Pécs, Faculty of Business and Economics Máté Uzsoki Budapest University of Technology and Economics
Bank of Canada Triennial Central Bank Survey of Foreign Exchange and Over-the-Counter (OTC) Derivatives Markets
 Derivatives Markets") Bank of Canada Triennial Central Bank Survey of Foreign Exchange and Over-the-Counter (OTC) Derivatives Markets Turnover for, and Amounts Outstanding as at June 30, March, 2005 Turnover data for, Table
Bank of Canada Triennial Central Bank Survey of Foreign Exchange and Over-the-Counter (OTC) Derivatives Markets Turnover for, and Amounts Outstanding as at June 30, March, 2005 Turnover data for, Table
Algorithmic Order Guide
 Algorithmic Order Guide STRATEGIES SUPPORTED MARKETS... 3 VWAP... 4 TWAP... 5 WITH VOLUME... 6 IMPLEMENTATION SHORTFALL... 7 PRE-MARKET LIMIT... 8 ICEBERG... 9 RELOAD...10 DARK....11 2 / 11 SUPPORTED MARKETS
Quarterly Investment Update First Quarter 2018
 Quarterly Investment Update First Quarter 2018 Dimensional Fund Advisors Canada ULC ( DFA Canada ) is not affiliated with [insert name of Advisor]. DFA Canada is a separate and distinct company. Market
Econometric Game 2006
 Econometric Game 2006 ABN-Amro, Amsterdam, April 27 28, 2006 Time Variation in Asset Return Correlations Introduction Correlation, or more generally dependence in returns on different financial assets
Quarterly Investment Update First Quarter 2017
 Quarterly Investment Update First Quarter 2017 Market Update: A Quarter in Review March 31, 2017 CANADIAN STOCKS INTERNATIONAL STOCKS Large Cap Small Cap Growth Value Large Cap Small Cap Growth Value Emerging
CARRY TRADE: THE GAINS OF DIVERSIFICATION
 CARRY TRADE: THE GAINS OF DIVERSIFICATION Craig Burnside Duke University Martin Eichenbaum Northwestern University Sergio Rebelo Northwestern University Abstract Market participants routinely take advantage
Corporate Governance and Investment Performance: An International Comparison. B. Burçin Yurtoglu University of Vienna Department of Economics
 Corporate Governance and Investment Performance: An International Comparison B. Burçin Yurtoglu University of Vienna Department of Economics 1 Joint Research with Klaus Gugler and Dennis Mueller http://homepage.univie.ac.at/besim.yurtoglu/unece/unece.htm
San Francisco Retiree Health Care Trust Fund Education Materials on Public Equity
 M E K E T A I N V E S T M E N T G R O U P 5796 ARMADA DRIVE SUITE 110 CARLSBAD CA 92008 760 795 3450 fax 760 795 3445 www.meketagroup.com The Global Equity Opportunity Set MSCI All Country World 1 Index
Lecture Note 9 of Bus 41914, Spring Multivariate Volatility Models ChicagoBooth
 Lecture Note 9 of Bus 41914, Spring 2017. Multivariate Volatility Models ChicagoBooth Reference: Chapter 7 of the textbook Estimation: use the MTS package with commands: EWMAvol, marchtest, BEKK11, dccpre,
Research Division Federal Reserve Bank of St. Louis Working Paper Series
 Research Division Federal Reserve Bank of St. Louis Working Paper Series Investigating the Intertemporal Risk-Return Relation in International Stock Markets with the Component GARCH Model Hui Guo and Christopher
Sovereign Bond Yield Spreads: An International Analysis Giuseppe Corvasce
 Sovereign Bond Yield Spreads: An International Analysis Giuseppe Corvasce Rutgers University Center for Financial Statistics and Risk Management Society for Financial Studies 8 th Financial Risks and INTERNATIONAL
DFA Global Equity Portfolio (Class F) Quarterly Performance Report Q2 2014
 Quarterly Performance Report Q2 2014") DFA Global Equity Portfolio (Class F) Quarterly Performance Report Q2 2014 This presentation has been prepared by Dimensional Fund Advisors Canada ULC ( DFA Canada ), manager of the Dimensional Funds.
DFA Global Equity Portfolio (Class F) Quarterly Performance Report Q2 2014 This presentation has been prepared by Dimensional Fund Advisors Canada ULC ( DFA Canada ), manager of the Dimensional Funds.
Quarterly Investment Update
 Quarterly Investment Update Second Quarter 2017 Dimensional Fund Advisors Canada ULC ( DFA Canada ) is not affiliated with The CM Group DFA Canada is a separate and distinct company Market Update: A Quarter
Does an Optimal Static Policy Foreign Currency Hedge Ratio Exist?
 May 2015 Does an Optimal Static Policy Foreign Currency Hedge Ratio Exist? FQ Perspective DORI LEVANONI Partner, Investments Investing in foreign assets comes with the additional question of what to do
DFA Global Equity Portfolio (Class F) Performance Report Q2 2017
 Performance Report Q2 2017") DFA Global Equity Portfolio (Class F) Performance Report Q2 2017 This presentation has been prepared by Dimensional Fund Advisors Canada ULC ( DFA Canada ), manager of the Dimensional Funds. This presentation
DFA Global Equity Portfolio (Class F) Performance Report Q2 2017 This presentation has been prepared by Dimensional Fund Advisors Canada ULC ( DFA Canada ), manager of the Dimensional Funds. This presentation
DFA Global Equity Portfolio (Class F) Performance Report Q3 2018
 Performance Report Q3 2018") DFA Global Equity Portfolio (Class F) Performance Report Q3 2018 This presentation has been prepared by Dimensional Fund Advisors Canada ULC ( DFA Canada ), manager of the Dimensional Funds. This presentation
DFA Global Equity Portfolio (Class F) Performance Report Q3 2018 This presentation has been prepared by Dimensional Fund Advisors Canada ULC ( DFA Canada ), manager of the Dimensional Funds. This presentation
DFA Global Equity Portfolio (Class F) Performance Report Q4 2017
 Performance Report Q4 2017") DFA Global Equity Portfolio (Class F) Performance Report Q4 2017 This presentation has been prepared by Dimensional Fund Advisors Canada ULC ( DFA Canada ), manager of the Dimensional Funds. This presentation
DFA Global Equity Portfolio (Class F) Performance Report Q4 2017 This presentation has been prepared by Dimensional Fund Advisors Canada ULC ( DFA Canada ), manager of the Dimensional Funds. This presentation
DFA Global Equity Portfolio (Class F) Performance Report Q3 2015
 Performance Report Q3 2015") DFA Global Equity Portfolio (Class F) Performance Report Q3 2015 This presentation has been prepared by Dimensional Fund Advisors Canada ULC ( DFA Canada ), manager of the Dimensional Funds. This presentation
DFA Global Equity Portfolio (Class F) Performance Report Q3 2015 This presentation has been prepared by Dimensional Fund Advisors Canada ULC ( DFA Canada ), manager of the Dimensional Funds. This presentation
Relationship between Correlations and Volatilities of Global Equity Returns: An Empirical Study of the Eurozone Debt Crisis
 International Business Research; Vol. 7, No. 6; 214 ISSN 1913-94 E-ISSN 1913-912 Published by Canadian Center of Science and Education Relationship between Correlations and Volatilities of Global Equity
Bank of Canada Triennial Central Bank Surveys of Foreign Exchange and Over-the-Counter (OTC) Derivatives Markets Turnover for April, 2007 and Amounts
 Derivatives Markets Turnover for April, 2007 and Amounts") Bank of Canada Triennial Central Bank Surveys of Foreign Exchange and Over-the-Counter (OTC) Derivatives Markets Turnover for April, 2007 and Amounts Outstanding as at June 30, 2007 January 4, 2008 Table
Bank of Canada Triennial Central Bank Surveys of Foreign Exchange and Over-the-Counter (OTC) Derivatives Markets Turnover for April, 2007 and Amounts Outstanding as at June 30, 2007 January 4, 2008 Table
VOLATILITY. Time Varying Volatility
 VOLATILITY Time Varying Volatility CONDITIONAL VOLATILITY IS THE STANDARD DEVIATION OF the unpredictable part of the series. We define the conditional variance as: 2 2 2 t E yt E yt Ft Ft E t Ft surprise
Global Dividend-Paying Stocks: A Recent History
 RESEARCH Global Dividend-Paying Stocks: A Recent History March 2013 Stanley Black RESEARCH Senior Associate Stan earned his PhD in economics with concentrations in finance and international economics from
2013 Global Survey of Accounting Assumptions. for Defined Benefit Plans. Executive Summary
 2013 Global Survey of Accounting Assumptions for Defined Benefit Plans Executive Summary Executive Summary In broad terms, accounting standards aim to enable employers to approximate the cost of an employee
FRESNO COUNTY EMPLOYEES' RETIREMENT ASSOCIATION Franklin Templeton International Equity - Country Allocation & Returns Period Ending: June 30, 2007
 FRESNO COUNTY EMPLOYEES' RETIREMENT ASSOCIATION Franklin Templeton International Equity - Country Allocation & Returns Period Ending: June 30, 2007 Franklin MSCI EAFE Index Difference % Countries Weight
1. Global Money Market Fund
 1. Global Money Market Fund Conservative investment approach Higher return than overseas bank account - minimal risk, lower entry levels Focus is on retention of capital Invests in short-term interest
Is Economic Growth Good for Investors? Jay R. Ritter University of Florida
 Is Economic Growth Good for Investors? Jay R. Ritter University of Florida What (modern day) country had the highest per capita income, in the following years? 1500 1650 1800 1870 1900 1920 It is widely
Jesús Crespo-Cuaresma Vienna University of Economics and Business. Octavio Fernández-Amador Johannes Kepler University Linz
 Business Cycle Convergence in EMU: A Second Look at the Second Moment Jesús Crespo-Cuaresma Vienna University of Economics and Business Octavio Fernández-Amador Johannes Kepler University Linz OUTLINE
Financial Ampli cation of Foreign Exchange Risk Premia 1
 Financial Ampli cation of Foreign Exchange Risk Premia 1 Tobias Adrian, Erkko Etula, Jan Groen Federal Reserve Bank of New York Brussels, July 23-24, 2010 Conference on Advances in International Macroeconomics
DIVERSIFICATION. Diversification
 Diversification Helps you capture what global markets offer Reduces risks that have no expected return May prevent you from missing opportunity Smooths out some of the bumps Helps take the guesswork out
Final Exam Suggested Solutions
 University of Washington Fall 003 Department of Economics Eric Zivot Economics 483 Final Exam Suggested Solutions This is a closed book and closed note exam. However, you are allowed one page of handwritten
Tangerine Investment Funds
 Tangerine Investment Funds Simplified Prospectus Tangerine Balanced Income Portfolio Tangerine Balanced Portfolio Tangerine Balanced Growth Portfolio Tangerine Dividend Portfolio Tangerine Equity Growth
At the end of this report, we summarize some important Year-End Considerations which employers should be prepared to address.
 Global Report December 2009 Retirement Plan Accounting Assumptions at 2009 This report supplements our June 2009 Global Report, which presented the results of Hewitt Associates global survey of 2008 year-end
Carry. Ralph S.J. Koijen, London Business School and NBER
 Carry Ralph S.J. Koijen, London Business School and NBER Tobias J. Moskowitz, Chicago Booth and NBER Lasse H. Pedersen, NYU, CBS, AQR Capital Management, CEPR, NBER Evert B. Vrugt, VU University, PGO IM
High Idiosyncratic Volatility and Low Returns. Andrew Ang Columbia University and NBER. Q Group October 2007, Scottsdale AZ
 High Idiosyncratic Volatility and Low Returns Andrew Ang Columbia University and NBER Q Group October 2007, Scottsdale AZ Monday October 15, 2007 References The Cross-Section of Volatility and Expected
Calamos Phineus Long/Short Fund
 Calamos Phineus Long/Short Fund Performance Update SEPTEMBER 18 FOR INVESTMENT PROFESSIONAL USE ONLY Why Calamos Phineus Long/Short Equity-Like Returns with Superior Risk Profile Over Full Market Cycle
Lecture 6: Non Normal Distributions
 Lecture 6: Non Normal Distributions and their Uses in GARCH Modelling Prof. Massimo Guidolin 20192 Financial Econometrics Spring 2015 Overview Non-normalities in (standardized) residuals from asset return
Table 1. Statutory tax rates on capital income.
 Table 1. Statutory tax rates on capital income. Tax rate on retained corporate income (%) 1 Top personal tax rate on interest income (%) 2 1985 1999 Change 1985-99 1985 1998 Change 1985-98 Small Countries
Digital Currency Risk
 International Journal of Economics and Finance; Vol. 10, No. 2; 2018 ISSN 1916-971X E-ISSN 1916-9728 Published by Canadian Center of Science and Education Digital Currency Risk Scott Gilbert 1 & Hio Loi
COMPARISON OF RIA SYSTEMS IN OECD COUNTRIES
 COMPARISON OF RIA SYSTEMS IN OECD COUNTRIES Nick Malyshev, OECD Conference on the Further Development of Impact Assessment in the European Union Brussels, RIA SYSTEMS IN OECD COUNTRIES Regulatory Impact
Financial Econometrics
 Financial Econometrics Volatility Gerald P. Dwyer Trinity College, Dublin January 2013 GPD (TCD) Volatility 01/13 1 / 37 Squared log returns for CRSP daily GPD (TCD) Volatility 01/13 2 / 37 Absolute value
Questions and answers about Russell Tax-Managed Model Strategies allocation changes
 MAY 11, 2015 Questions and answers about Russell Tax-Managed Model Strategies allocation changes Summary The global financial markets are dynamic, never constant nor predictable. We believe investors should
Structural GARCH: The Volatility-Leverage Connection
 Structural GARCH: The Volatility-Leverage Connection Robert Engle 1 Emil Siriwardane 1 1 NYU Stern School of Business MFM Macroeconomic Fragility Fall 2013 Meeting Leverage and Equity Volatility I Crisis
Structural GARCH: The Volatility-Leverage Connection
 Structural GARCH: The Volatility-Leverage Connection Robert Engle 1 Emil Siriwardane 1 1 NYU Stern School of Business University of Chicago: 11/25/2013 Leverage and Equity Volatility I Crisis highlighted
Assicurazioni Generali: An Option Pricing Case with NAGARCH
 Assicurazioni Generali: An Option Pricing Case with NAGARCH Assicurazioni Generali: Business Snapshot Find our latest analyses and trade ideas on bsic.it Assicurazioni Generali SpA is an Italy-based insurance
Income smoothing and foreign asset holdings
 J Econ Finan (2010) 34:23 29 DOI 10.1007/s12197-008-9070-2 Income smoothing and foreign asset holdings Faruk Balli Rosmy J. Louis Mohammad Osman Published online: 24 December 2008 Springer Science + Business
Past performance is not a guarantee of future results. Indices are not available for direct investment. Index performance does not reflect the
 Q1 Past performance is not a guarantee of future results. Indices are not available for direct investment. Index performance does not reflect the expenses associated with the management of an actual portfolio.
Introductory Econometrics for Finance
 Introductory Econometrics for Finance SECOND EDITION Chris Brooks The ICMA Centre, University of Reading CAMBRIDGE UNIVERSITY PRESS List of figures List of tables List of boxes List of screenshots Preface
Market Risk Analysis Volume II. Practical Financial Econometrics
 Market Risk Analysis Volume II Practical Financial Econometrics Carol Alexander John Wiley & Sons, Ltd List of Figures List of Tables List of Examples Foreword Preface to Volume II xiii xvii xx xxii xxvi
Social Security Benefits Around the World,
 Social Security Benefits Around the World, 197-2 Prepared by The Population Reference Bureau for the NIA P-3 Coordinating Center at the Michigan Center on the Demography of Aging, University of Michigan
Bank of Canada Triennial Central Bank Survey of Foreign Exchange and Over-the-Counter (OTC) Derivatives Markets Turnover for April, 2010 and Amounts
 Derivatives Markets Turnover for April, 2010 and Amounts") Bank of Canada Triennial Central Bank Survey of Foreign Exchange and Over-the-Counter (OTC) Derivatives Markets Turnover for April, 2010 and Amounts Outstanding as at June 30, 2010 December 20, 2010 Table
Bank of Canada Triennial Central Bank Survey of Foreign Exchange and Over-the-Counter (OTC) Derivatives Markets Turnover for April, 2010 and Amounts Outstanding as at June 30, 2010 December 20, 2010 Table
Direct Foreign Investment (DFI)
") Direct Foreign Investment (DFI) DFI Definition: A DFI is a controlling ownership in a business enterprise in one country by an entity based in another country. DFI is different from portfolio investing
Direct Foreign Investment (DFI) DFI Definition: A DFI is a controlling ownership in a business enterprise in one country by an entity based in another country. DFI is different from portfolio investing
Historical Price Returns
 ANNUITIES SINGLE PREMIUM DEFERRED Brighthouse Shield Level 10 SM Annuity Historical Price Returns Over the long term, history has shown that equities can be a powerful way to help grow your assets and
FEES SCHEDULE (COPPER / GOLD)
") FEES SCHEDULE (COPPER / GOLD) Applicable from April 208 excluding discretionary management agreement and investment advisory agreement CBP Quilvest LU EN Fees Schedule Excluding Management April 208 /5
FEES SCHEDULE (COPPER / GOLD) Applicable from April 208 excluding discretionary management agreement and investment advisory agreement CBP Quilvest LU EN Fees Schedule Excluding Management April 208 /5
The University of Chicago, Booth School of Business Business 41202, Spring Quarter 2017, Mr. Ruey S. Tsay. Solutions to Final Exam
 The University of Chicago, Booth School of Business Business 41202, Spring Quarter 2017, Mr. Ruey S. Tsay Solutions to Final Exam Problem A: (40 points) Answer briefly the following questions. 1. Describe
JP Morgan Diversified Factor Global Developed Equity Index
 FTSE Russell Factsheet JP Morgan Diversified Factor Global Developed Equity Index FEATURES Data as at: 31 January 2019 bmktitle1 The JP Morgan Diversified Factor Indexes are comprised of large and mid-cap
Insights from Morningstar Investment Services. Market Volatility: A Guide to Riding the Waves
 Insights from Morningstar Investment Services Market Volatility: A Guide to Riding the Waves If you ve invested for almost any length of time, you ve experienced at least one of those don t-look-at-your
Reporting practices for domestic and total debt securities
 Last updated: 27 November 2017 Reporting practices for domestic and total debt securities While the BIS debt securities statistics are in principle harmonised with the recommendations in the Handbook on
Strategic Asset Allocation
 Strategic Asset Allocation Caribbean Center for Monetary Studies 11th Annual Senior Level Policy Seminar May 25, 2007 Port of Spain, Trinidad and Tobago Sudhir Rajkumar ead, Pension Investment Partnerships
Monetary policy regimes and exchange rate fluctuations
 Seðlabanki Íslands Monetary policy regimes and exchange rate fluctuations The views are of the author and do not necessarily reflect those of the Central Bank of Iceland Thórarinn G. Pétursson Central
FEES SCHEDULE (SILVER/PLATINUM)
") FEES SCHEDULE (SILVER/PLATINUM) Applicable from April 208 under an Investment Advisory Agreement CBP Quilvest LU EN Investment Advisory Fees Schedule April 208 /5 ADVISORY MANAGEMENT, CUSTODY FEES AND
FEES SCHEDULE (SILVER/PLATINUM) Applicable from April 208 under an Investment Advisory Agreement CBP Quilvest LU EN Investment Advisory Fees Schedule April 208 /5 ADVISORY MANAGEMENT, CUSTODY FEES AND
Open Access Asymmetric Dependence Analysis of International Crude Oil Spot and Futures Based on the Time Varying Copula-GARCH
 Send Orders for Reprints to reprints@benthamscience.ae The Open Petroleum Engineering Journal, 2015, 8, 463-467 463 Open Access Asymmetric Dependence Analysis of International Crude Oil Spot and Futures
Global Equity Country Allocation: An Application of Factor Investing Timotheos Angelidis a and Nikolaos Tessaromatis b,*
 Global Equity Country Allocation: An Application of Factor Investing Timotheos Angelidis a and Nikolaos Tessaromatis b,* a Department of Economics, University of Peloponnese, Greece. b,* EDHEC Business
International Income Smoothing and Foreign Asset Holdings.
 MPRA Munich Personal RePEc Archive International Income Smoothing and Foreign Asset Holdings. Faruk Balli and Rosmy J. Louis and Mohammad Osman Massey University, Vancouver Island University, University
MSCI EAFE Index. An index that provides access to developed markets outside the United States. Nationwide New Heights Fixed Indexed Annuities
 Nationwide New Heights Fixed Indexed Annuities International Index Option Guide MSCI EAFE Index An index that provides access to developed markets outside the United States MSCI EAFE The MSCI EAFE Index
Axioma Risk Monitor Developed Europe 2 May 2018
 Axioma Risk Monitor Developed Europe 2 May 2018 1. Global volatility hotspots 2. Global correlation hotspots www.axioma.com Greater than 1% rise over last week Greater than 1% fall over last week Greater
List of tables List of boxes List of screenshots Preface to the third edition Acknowledgements
 Table of List of figures List of tables List of boxes List of screenshots Preface to the third edition Acknowledgements page xii xv xvii xix xxi xxv 1 Introduction 1 1.1 What is econometrics? 2 1.2 Is
12. Conditional heteroscedastic models (ARCH) MA6622, Ernesto Mordecki, CityU, HK, 2006.
 MA6622, Ernesto Mordecki, CityU, HK, 2006.") 12. Conditional heteroscedastic models (ARCH) MA6622, Ernesto Mordecki, CityU, HK, 2006. References for this Lecture: Robert F. Engle. Autoregressive Conditional Heteroscedasticity with Estimates of Variance
12. Conditional heteroscedastic models (ARCH) MA6622, Ernesto Mordecki, CityU, HK, 2006. References for this Lecture: Robert F. Engle. Autoregressive Conditional Heteroscedasticity with Estimates of Variance
1 Volatility Definition and Estimation
 1 Volatility Definition and Estimation 1.1 WHAT IS VOLATILITY? It is useful to start with an explanation of what volatility is, at least for the purpose of clarifying the scope of this book. Volatility
VOLATILITY. Finance is risk/return trade-off.
 VOLATILITY RISK Finance is risk/return trade-off. Volatility is risk. Advance knowledge of risks allows us to avoid them. But what would we have to do to avoid them altogether??? Imagine! How much should
Second Quarter Trading Update 9 July 2010
 Second Quarter Trading Update 9 July 2010 Michael Page International Second Quarter Trading Update 2010 2 Group gross profit Constant Group gross profit m m Reported exchange 2010 vs 2009 111.5 83.8 +33.1%
MFS Investment Management 500 Boyleston Street Boston, Massachusetts 02116
 Investment Management 500 Boyleston Street Boston, Massachusetts 02116 MANAGER'S INVESTMENT PROCESS RISK CONSIDERATIONS Bottom-up idea generation within a sector-neutral framework, managed by a team of
Sources of Government Revenue in the OECD, 2016
 FISCAL FACT No. 517 July, 2016 Sources of Government Revenue in the OECD, 2016 By Kyle Pomerleau Director of Federal Projects Kevin Adams Research Assistant Key Findings OECD countries rely heavily on
UBC FACULTY PENSION PLAN PENSION FORUM M R. J O O S T B L O M, C H A I R, B O A R D O F T R U S T E E S M S. O R L A C O U S I N E A U, E X E C U T I
 UBC FACULTY PENSION PLAN PENSION FORUM M R. J O O S T B L O M, C H A I R, B O A R D O F T R U S T E E S M S. O R L A C O U S I N E A U, E X E C U T I V E D I R E C T O R, P E N S I O N S M R. M I K E L
Amath 546/Econ 589 Univariate GARCH Models: Advanced Topics
 Amath 546/Econ 589 Univariate GARCH Models: Advanced Topics Eric Zivot April 29, 2013 Lecture Outline The Leverage Effect Asymmetric GARCH Models Forecasts from Asymmetric GARCH Models GARCH Models with
IMPLICATIONS OF LOW PRODUCTIVITY GROWTH FOR DEBT SUSTAINABILITY
 IMPLICATIONS OF LOW PRODUCTIVITY GROWTH FOR DEBT SUSTAINABILITY Neil R. Mehrotra Brown University Peterson Institute for International Economics November 9th, 2017 1 / 13 PUBLIC DEBT AND PRODUCTIVITY GROWTH
Nasdaq Global ex-australia Sector Indexes Methodology
 Nasdaq Global ex-australia Sector Indexes Methodology Index Description Australia Sector Indexes are designed to track the performance of global ex-australian companies that are in the Bank, Healthcare
Financial Econometrics Jeffrey R. Russell. Midterm 2014 Suggested Solutions. TA: B. B. Deng
 Financial Econometrics Jeffrey R. Russell Midterm 2014 Suggested Solutions TA: B. B. Deng Unless otherwise stated, e t is iid N(0,s 2 ) 1. (12 points) Consider the three series y1, y2, y3, and y4. Match
Have euro area government bond risk premia converged to their common state?
 Have euro area government bond risk premia converged to their common state? Lorenzo Pozzi Guido Wolswijk October 30, 2009 Abstract We derive a model in which a standard international capital asset pricing
Robert Engle and Emil Siriwardane Volatility Institute of NYU Stern 6/24/2014 STRUCTURAL GARCH AND A RISK BASED TOTAL LEVERAGE CAPITAL REQUIREMENT
 Robert Engle and Emil Siriwardane Volatility Institute of NYU Stern 6/24/2014 STRUCTURAL GARCH AND A RISK BASED TOTAL LEVERAGE CAPITAL REQUIREMENT SRISK How much additional capital would a firm expect
GARCH vs. Traditional Methods of Estimating Value-at-Risk (VaR) of the Philippine Bond Market
 of the Philippine Bond Market") GARCH vs. Traditional Methods of Estimating Value-at-Risk (VaR) of the Philippine Bond Market INTRODUCTION Value-at-Risk (VaR) Value-at-Risk (VaR) summarizes the worst loss over a target horizon that
GARCH vs. Traditional Methods of Estimating Value-at-Risk (VaR) of the Philippine Bond Market INTRODUCTION Value-at-Risk (VaR) Value-at-Risk (VaR) summarizes the worst loss over a target horizon that
RAFI Multi-Factor Index Series RAFI Dynamic Multi-Factor Indices RAFI Multi-Factor Indices RAFI Factor Indices
 Methodology & Standard Treatment 10.31.2017, v. 1.4 RAFI Multi-Factor Index Series RAFI Dynamic Multi-Factor Indices RAFI Multi-Factor Indices RAFI Factor Indices Introduction... 1 1. Index Specifications...
NASDAQ Global Index. More information about the Index can be found at
 NASDAQ Global Index The NASDAQ Global Index is a float adjusted market capitalization-weighted index designed to track the performance of global equities covering over 98% of the entire listed market capitalization
Key Issues in the Design of Capital Gains Tax Regimes: Taxing Non- Residents. 18 July 2014
 Key Issues in the Design of Capital Gains Tax Regimes: Taxing Non- Residents 18 July 2014 How do we tax non-residents on capital income? Domestic design issues Tax treaty issues Interrelationship between
MANDATORY PROVIDENT FUND SCHEMES AUTHORITY. Guidelines on Recognized Exchanges
 Guidelines III.4 MANDATORY PROVIDENT FUND SCHEMES AUTHORITY III.4 Guidelines on Recognized Exchanges INTRODUCTION Section 2 of the Mandatory Provident Fund Schemes (General) Regulation ( the Regulation
DEALING AND TREASURY SERVICE
 FEE SCHEDULE - STONEHAGE FLEMING DEALING AND TREASURY SERVICE ASSET CLASS Below does not include any third party fees, VAT, stamp duty, taxes or charges FOREIGN EXCHANGE UP TO SPOT Band in GBP % of Spot
Financial Econometrics Notes. Kevin Sheppard University of Oxford
 Financial Econometrics Notes Kevin Sheppard University of Oxford Monday 15 th January, 2018 2 This version: 22:52, Monday 15 th January, 2018 2018 Kevin Sheppard ii Contents 1 Probability, Random Variables
TEACHERS RETIREMENT BOARD. INVESTMENT COMMITTEE Item Number: 11
 TEACHERS RETIREMENT BOARD INVESTMENT COMMITTEE Item Number: 11 SUBJECT: Special Mandate Low Carbon Strategies CONSENT: ATTACHMENT(S): 2 ACTION: X DATE OF MEETING: / 20 mins. INFORMATION: PRESENTER(S):
Axioma Risk Monitor Developed Europe 4 July 2018
 Axioma Risk Monitor Developed Europe 4 July 2018 1. Global volatility hotspots 2. Global correlation hotspots www.axioma.com Greater than 1% rise over last week Greater than 1% fall over last week Greater
WHAT DOES THE HOUSE PRICE-TO-
 WHAT DOES THE HOUSE PRICE-TO- INCOME RATIO TELL US ABOUT THE HOUSING AFFORDABILITY: A THEORY AND INTERNATIONAL EVIDENCE (THIS VERSION: AUG 2016) Charles Ka Yui LEUNG City University of Hong Kong Edward