Section 4: Marketing
|
|
|
- Cody Burke
- 5 years ago
- Views:
Transcription

1 Section 4: Marketing
2 Beef Cattle Handbook BCH-8040 Product of Extension Beef Cattle Resource Committee Ranchers Guide to Custom Cattle Feeding Donald Gill, Animal Scientist, Oklahoma State University Kent Barnes, Animal Scientist, Oklahoma State University Keith Lusby, Animal Scientist, Oklahoma State University Derrell S. Peel, Ag Economist, Oklahoma State University Custom cattle feeding refers to sending cattle to a commercial feedyard that specializes in feeding and managing cattle until they are ready for processing. This practice should be considered by ranchers as a means to evaluate the performance of cattle or as a marketing alternative. At times, custom cattle feeding can be a tool to increase the dollar return to a cow-calf or stocker program. At other times, it may be better to simply sell feeder cattle or calves. The rancher should consider custom cattle feeding when it is likely to increase net returns. Some ranchers feed some of their cattle each year regardless of profit potential just to see how their cattle perform in the feedlot. This may become more important as feeders require evidence of superior cattle performance before paying top-market price. Cattle producers who would like to try cattle feeding but are uneasy about sending 100 or more head of cattle to a feedlot for the first time, may want to consider participating in a feedout program. Many states offer similar programs that allow a producer to contribute five to fifteen head to a feedout trial in order to get performance and carcass data on the animals. Examples of these programs include: Georgia s Beef challenge; Idaho s A to Z Retained Ownership Company; North Dakota s Badlands Performance Steer Test; Oklahoma s OK Steer Feedout; South Dakota s Retained Ownership Demonstration; and Texas Ranch to Rail Program. Selection of Cattle For Feeding One key to successful feeding lies in the makeup of the cattle that constitute a pen. Cattle should be as uniform as possible in weight, body type, age, breeding, and in previous nutritional background. When these conditions are met, the cattle feeder can feed and sell the cattle to achieve optimum feed efficiency and market value of the cattle. When careful control is started on the producing ranch, uniformity in the cattle nearly always results in a 5 to 10 percent advantage in efficiency over carefully put together cattle. Steers and heifers can be fed, but not in the same pen. Often heifers are discounted more as feeder calves in marketing channels more than they should be, and custom feeding may be a means to realize better prices for the rancher. When selecting a feedlot for heifers, be sure to find a feedlot that can feed and market heifers. Evaluating a Custom Feeding Opportunity Value Your Cattle Put a realistic value on your cattle and calves at home. This is usually either the local auction price, less costs and shrinks involved in getting cattle to market, or a bid at your scales, less a possible pencil shrink. Cattle shrink and pencil shrink are very important. When considering shipping cattle to custom feedlots with a ten- hour haul, it is likely they will shrink three to eight percent from ranch weights. Please refer to Table 1 to estimate cattle shrinkage. Examples of figuring cattle costs: A buyer offers you $68/cwt. for your steers with a three percent pencil shrink. In reality, he offered you 97 percent of $68.00, or $ You need to value your cattle for custom feeding in BCH
3 a lot 300 miles from home. The cattle will shrink about 5.5 percent (from Table 1) from ranch weight during the haul. Thus, your cattle would have to cost $69.80 [65.96 x (100/94.5) = 69.80] laid into a feedlot to net you the $65.96 at home. Keeping records of a few actual shipments under specific conditions will establish the appropriate percentage of shrink for your operation. Table 1. Shrinkage Loss Due to Different Handling Conditions. Conditions Percent Shrink 8-hour drylot stand hour drylot stand hour drylot stand hours in moving truck hours in moving truck hours in moving truck 8.9 Freight Costs Usually, a semi-trailer truck equipped to handle cattle is the most economical way to move cattle. These trucks will haul from 48,000 to 52,000 pounds of cattle. Hauling rates range from $1.75 to $2.00 per mile. Typical current rates are about $2.00 per mile to a custom feedlot. Shipment of cattle 300 miles with a 50,000-lb. load will add about $1.20/cwt. to the cost of the cattle. If you could get $68, less three percent shrink at home, figure that you could lay your cattle into a feedlot 300 miles away for $69.80 plus $1.20 freight for a total of $ Feedlot Costs Custom cattle feeders provide feed and services for a price. Good feedlot managers can estimate how much it will cost to feed your cattle from feedlot In Weight to final Pay Weight. Estimates of lot costs, excluding yardage, can be made by multiplying feed conversion ratios (given in Table 2) times the cost of feed on a 100 percent dry matter basis. Yardage and Other Costs Some feedlots charge a yardage fee (usually 5 cents per head per day) in addition to the feed cost. In addition to the yardage, a rancher should inquire about other fees such as processing, hay, insurance, taxes, and check-offs. Cattle producers who feed cattle in a number of custom lots report that the fees other than yardage are quite variable, ranging from zero to over $14 per head. The fee structure should be spelled out and included in the budget. Table percent Dry Matter Feed Conversions on Average Cattle Types from Pay Weight to Pay Weight, Assuming High Concentrate Rations. Cattle In Wght Mrkt Wght Conversion Ratio Steers Heifers Some feedlot rations are priced on an as is basis. They may be adjusted to a zero percent moisture basis (or 100 percent dry matter) by dividing the as is price by the dry matter content of the ration (expressed as a decimal) If, for example, a feedlot ration containing 28 percent moisture costs $5.40 per hundred, its zero- percent moisture cost will be $5.40/0.72 = $7.50. Medical Costs Most healthy yearling cattle incur medical costs (including processing and implants) of $4 to $8 per head during feeding. Sickly calves can at times incur costs as much as $25 per head. All good feedlots can inform a rancher of steps necessary to keep health costs to a minimum. Death Loss It is normal to figure one-half to one percent death loss in yearling cattle in feedlots. Cattle placed on feed during late fall and early winter are most susceptible to high losses. Death losses in calves are potentially quite high if management of the calves prior to and during shipment and receiving is lacking. Usual death losses are about three percent, with a range of about one to ten percent. Most death losses in calves can be traced back to stale-sale barn calves moved during adverse weather. If a rancher intends to feed calves, it is wise to hold the cattle 20 to 30 days following weaning before shipping. Coordinate this preshipping program with the feedlot s veterinarian. Death losses that are incurred soon after arrival at the feedlot are not as costly as losses later in the feeding period. Poor gains and conversions generally accompany high death losses. A high death loss is of less significance with low-priced cattle than with highpriced cattle. Any rancher feeding his own cattle should include a provision in his budget for death losses. With 2 Beef Cattle Handbook
4 yearling cattle, experienced feeders whose average death loss is one-half percent will often feed five or six pens without a death and then lose three head out of a hundred on the next. Feedlots will notify the cattle owner of death losses and the cause of death. Pen Sizes and Risk Sharing Feedlot cattle are usually fed in pens of 100 to 140 head. However, many feedlots have pens as small as 25 head to as large as several hundred. Several ranchers each having 100 steers to feed may find it desirable to pool their cattle into many pens, often started on feed at different times. Each rancher may own portions of each pen. This technique helps iron out peaks and valleys in both feeder and fed-cattle prices. One drawback to this approach is that the rancher may not get specific performance and carcass information on cattle. Cattle should be carefully sorted so that each pen has the same size and type of cattle. Cattle type refers to the ultimate mature size. Charolais X Hereford crosses are usually a much larger type than Hereford X Angus crosses. Many feedlot managers prefer to feed Hereford X Angus cross steers because they are usually easy to sell at top market price when finished. Some exotic cross heifers make good feeders in high plains feedlots because they finish at more desirable weight for that market than do small type heifers. Feedlots in different regions sometimes specialize in different types of cattle. Thus, by shopping around, a rancher may locate a feedlot more comfortable with a particular type of cattle. As a rule, the more uniform that cattle are in background, type and weight, the better job the feedlot can do in terms of minimizing costs and obtaining top price. Cattle that do not grade when finished are usually destined to be overfed and to sell for discount prices. Fed Cattle Marketing Feedlots make no separate charge for selling a customer s cattle. They do provide market advice and will sell according to producer instructions. Feedlot cattle are usually sold at the feedlot (FOB) on actual weights less a pencil shrink (for example, 4 percent in the Southern Plains). In this case, the buyer of the cattle is responsible for the freight and any possible condemnations (i.e. carcasses lost in the plant due to disease or injury). Sometimes it is to the cattleman s advantage to sell on a dressed weight basis ( in the beef ) or on a dressed weight and grade ( grade and yield ) basis. When cattle are sold in this manner, the cattle owner pays for the freight to the packing plant and also stands the risk of any condemnations. Cattle with a high dressing percentage often bring more net money to the cattleman when sold on a carcass or dressed weight basis. With in the beef selling, the packer/buyer takes the grading risk. When cattle are sold on a grade and yield basis, the cattleman benefits when cattle have both a high dressing percentage and high quality grade percentage. Interest and Financing Methods of financing cattle feeding ventures are quite flexible. It is usually best to use your normal sources of financing when carrying your cattle through the feedlot. If the rancher has adequate financing to cover the cattle costs throughout the period required to finish the cattle, he can usually obtain additional local financing to cover feed bills. Feedlots usually bill for feed and services twice monthly. These bills can be sent either to the owner, or, a cooperating financial agent for payment. Another option frequently available is to make arrangements to have the feedlot finance the feed bill. When this is done, feed bill and finance charges are deducted at the time cattle are sold. It is important that the rancher check local interest rates against those of the feedlot s financing plan and select the least-costly plan. Refinancing cattle at the time they are placed on feed is another alternative. In this case, cattle are appraised for value and the owner can receive cash for the difference between their appraised value and the loan margin required by the lender. Margin amounts are dependent on the owner s financial statement, and possible risk that the lender sees in the loan. Current margins range from $50, to as much as $150 per head, depending on the risk to the lending agency. Interest costs are a significant item in the cost of feeding cattle. Total interest costs may be estimated as in the following example: A. Cattle cost at $300 for 120 days at 10 percent $300 X (.10/360 a ) X 120 = $10 B. Feed cost at $1.50 per day for 120 days = $180 $180 X.5 b X (.10/360 a ) X 120 = $3 a Bankers year (360 days) b Assuming feed is charged when fed Prepaid Feed A rancher can insure himself against unexpected rises in feed costs at times by purchasing sufficient quantities of grain through a feedlot either before or at the time cattle are placed on feed. At times of uncertainty about feed supplies and feed prices, a prepurchase of feed commodities offers a hedge against rising feed prices. The cost of the prepaid feed commodities are deducted from the normal ration price at each billing period. If feeds are purchased early, interest costs on feed may be much higher depending on the timing. The above formula for estimating interest costs on feed was based on the assumption that feed is not paid for until it is fed. Most, but not all, feedlots can handle prepaid commodities through their billing system. Alternatively, the basic commodities that make up a feedlot diet (i.e., corn and soybean meal) can be hedged with futures or options contracts for price protection. Managing Fed Cattle Price Risk A rancher with cattle in a custom feedlot has several alternatives to help manage the price risk of future cattle BCH
5 sales. The need for price-risk protection will largely depend on the rancher s cattle price outlook, before and after placing cattle on feed, and may be influenced by financing or other considerations. Cattle on feed may be forward priced with a cashforward contract. This may be a fixed price contract but is more often a basis contract. A basis contract specifies that cattle will be priced at a fixed level above or below the futures price for a specific futures contract month. Typically, the rancher can decide what day s futures market price will be used to fix the price of the cattle. The rancher can usually price the cattle any time between the contract date and the beginning of the futures contract month that is tied to the basis contract. If the rancher sets the price immediately, the basis contract is converted to a fixed-price contract. Cash-forward contracts usually specify the month of delivery, with the packer choosing the actual delivery date. Until the rancher pulls the trigger and sets the price, a basis contract does not reduce cattle price risk. However, a rancher could buy an option in conjunction with a basis contract to set a minimum price for the cattle, and subsequently, fix the cash price at a higher level if the futures market rises before the cattle are marketed. In some cases, basis contracts also specify that the cattle owner is responsible for freight to the packing plant. In that case, the basis level in the contract should reflect both the relationship between cash and futures prices, plus the freight cost between the feedlot and the packing plant. A rancher may also establish an expected fixed or minimum price for the cattle by hedging the cattle with futures or options. A simple hedge with futures or options does not eliminate all market risk but replaces price risk with basis risk, which is usually lower. As noted above, a basis contract can be combined with futures or options to establish a fixed or minimum price for the cattle. The major factor influencing a rancher s decision to use price-risk management alternatives will be the rancher s view of market outlook and the risk of price declines. However, price-risk management may affect the feasibility and/or profitability of the custom feeding enterprise by reducing the interest rate and/or equity requirements for financing feedlot cattle. Check with your lender to see if use of risk management tools will improve the financial arrangements available to you. Steps Required to Feed Cattle There is little justification for putting cattle on feed except to make a profit. Step one in deciding whether or not to feed cattle is to calculate either the necessary selling price to break even, or to figure potential profit. Step two pertains to arranging the financing for the cattle, feed bills, and contract margins, and to develop a reasonable cash flow so that money is available when needed. Table 3. Feedlot Budget # Example Your Values 1. Ranch weight of cattle (lbs). = Ranch value of animals ($/cwt). = $78 3. Estimated shrink from ranch to feedlot (%). = Transportation cost from ranch to feedlot ($/cwt). = $ Laid-in cattle price. a.($/cwt) #2/(1-(#3/100))+#4 = $83.74 b.($/hd) #5a*(#1/100) = $ Estimated gain (lbs/day). = Estimated feed conversion (lbs feed/lb gain). = Estimated days to market. = 140 days 9. Estimated final weight. #6*#8+(#1*(1-(#3/100))) = 1, Interest rate on capital (%). = Death loss: a. (%), b. ($/hd). #5b*(#12a/100) = $4.40 (#11a=0.75) 12. Veterinary and processing costs. = $ Estimated feed price, 0% moisture ($/cwt). = $ Estimated feed cost ($hd). #6*#7*#8*(#13/100) = $ Yardage cost: a. ($/hd/day), b. ($/hd). #8*#15a = $7.00 (#15a=.05) 16. Interest on cattle and vet ($/hd). (#5b+#12)*(#10/100)*(#8/360) = $ Interest on feed and yardage ($/hd). (#14+#15b)*0.5*(#10/100)*(#8/360) = $ Total cost per animal ($/hd). #5b+#11b+#12+#14+#15b+#16+#17 = $ Pay weight: a. shrink (%), b. (lbs). #9*(1-(#19a/100)) = 1,071.8 (19a=4) 20. Break even cost. #18/#19b = $78.14/cwt. 21. Expected selling price ($/cwt). = $ Expected profit ($/hd). #21-#20*(#19b/100) = $9.22/head 4 Beef Cattle Handbook
6 Authors: Donald Gill, Animal Scientist, Oklahoma State University Kent Barnes, Animal Scientist, Oklahoma State University Keith Lusby, Animal Scientist, Oklahoma State University Derrell S. Peel, Ag Economist, Oklahoma State University This publication was prepared in cooperation with the Extension Beef Cattle Resource Committee and its member states and produced in an electronic format by the University of Wisconsin-Extension, Cooperative Extension. Issued in furtherance of Cooperative Extension work, ACTS of May 8 and June 30, BCH-8040 Ranchers Guide to Custom Cattle Feeding BCH
7 Beef Cattle Handbook BCH-8050 Product of Extension Beef Cattle Resource Committee Factors Affecting Cattle Feeding Profitability and Cost Of Gain Martin L. Albright, Ag Economist, Kansas State University Michael R. Langemeier, Ag Economist, Kansas State University James R. Mintert, Ag Economist, Kansas State University Ted C. Schroeder, Ag Economist, Kansas State University Cattle feeding is a risky business. The variability in cattle feeding profit for steers in two western Kansas feedyards placed on feed from January, 1980, through May, 1991 is illustrated in Figure 1. Monthly average steer feeding profit ranged from a loss of $100 per head to a gain of $165 per head. The monthly average cost of gain for the same group of steers varied from $38 cwt. to $65 cwt. Changes in cattle prices, feed prices, and performance are significant factors contributing to fluctuations in cattle finishing cost of gains and profits. Approximately 93 percent of the variability in cost of gain over time can be explained by changes in corn prices, feed conversions, and daily gains (1). Further, 93 to 94 percent of steer feeding profit risk can be accounted for by fed steer prices, feeder prices, corn prices, interest rates, feed conversions, and daily gains (1). Because all of these factors are important in explaining the risks of cattle feeding, producers should consider them when developing budgets, calculating break-even points, or placing cattle on feed. Feedyard Closeout Study Results from the recent study (1) conducted at Kansas State University (KSU) can be used to identify the most important factors affecting cost of gain and profitability. This study utilized closeout data on 6,696 pens of steers at two western Kansas custom feedyards placed on feed from January, 1980, through May, Only pens of steers weighing between 600 and 899 lbs. at placement were used. The steers were divided into three 100-lb. placement weight categories. Information collected from the closeouts included placement date, feeder cattle purchase price, placement weight, days on feed, total gain, daily gain, sale weight, feed conversion (as fed), yardage charges, feed cost, feed consumption (as fed), feeding PROFIT ($/hd) YEAR AND MONTH PLACED ON FEED Figure 1. Monthly average steer profit for steers placed at lbs. cost per pound of gain, fed cattle sale price, and processing date. The feeder steer price was not available for all closeouts, so the average Dodge City, Kansas cattle auction price (4) for the week the steers were placed was used. Average corn prices during the placement month were obtained from Agricultural Prices (3). Interest rates on feeder cattle loans were obtained from the Federal Reserve Bank of Kansas City (2). Profits averaged from $25.38 to $27.28 per head for the three placement weight groups in the KSU study. Feed conversion ranged from 8.24 lbs. of feed for lighter BCH
8 placements to 8.57 lbs. of feed per lb. of gain for heavier weight placements, reflecting the reduced feed efficiency of feeding heavier weight cattle. The heavier placed steers gained 3.25 lbs. per day, while the rate of gain for lighter placed steers was 3.06 lbs. per head per day. Average feeding cost of gain ranged from $48.66 to $50.08 cwt. for the three placement weight groups. Cost of Gain Feeding cost of gain consists of feed costs, veterinary costs, processing and yardage fees, interest charges, and miscellaneous costs. The primary performance factors affecting cost of gain are average daily gain, feed conversion, and death loss. Cattle performance, feed grain prices, and forage prices all influence feed costs the largest component of cost of gain. Feed costs will rise as a result of higher feed conversion rates or death loss. Conversely, feed costs decline as rate of gain increases. Increases in veterinary costs and cattle health problems both increase feeding cost of gain. Factors Affecting Variability in Cost of Gain Approximately 93 percent of the variability in steer feeding cost of gain over time was explained by corn price, feed conversion, and average daily gain. The relative contribution of these factors to the volatility of steer feeding cost of gain are shown in Table 1. Changes in corn prices explained the greatest amount of cost of gain variability for all placement weights. Corn price accounted for 67 percent of the variability in cost of gain for steers placed at lbs. and 58 percent for steers placed at lbs. Corn price is relatively more percent of the variation in cost of gain for lightweight placements and 33 percent for heavier placed steers. Feed conversion is more crucial to heavyweight steers because they are not as efficient as lighter weight steers. Finally, average daily gain accounted for 2.6 percent to 3.1 percent of the volatility in cost of gain. The daily rate of gain is more important for lighter placed steers as they are on feed for a longer period of time. Steer Feeding Profitability Net returns to steer feeding are susceptible to risks from fluctuating feeder and fed cattle prices, feed prices, cattle performance, and interest rates. These factors should be considered when determining budget projections and contemplating placing cattle on feed. Rising feeder cattle prices, feed grain prices, interest rates, and poor cattle performance increase costs and break-even levels. A depressed fed cattle market will decrease the amount of gross revenue a producer will receive. The profit distributions across the three placement weight categories for the January, 1980, through May, 1991 placement period are depicted in Figure 2. Profits ranged from a negative $134 per head to a positive $199 per head. Average profits were in the $0 to $100 per head range in approximately 58 to 65 percent of the 137 months in the study. During 5 percent of the months, steer feeding profits for lb. placements averaged more than $100 per Percent of Months (%) 600 to 699 lb. Placements 15 Table 1. Percent of Steer Feeding Cost of Gain Variability Over Time Attributable to Selected Factors, January May Explanatory Placement Weight Variable 600/ / /899 lbs. lbs. lbs % Corn Price Feed Conversion Daily Gain Total Explained a Unexplained Variability b to 799 lb. Placements 800 to 899 lb. Placements a Total explained variability is cost of gain variability explained by the explanatory variables. b Unexplained variability is 100 minus total explained important for lighter placed steers as they require more grain to reach processing weight than heavier placed steers. Feed conversion is the second most important factor in determining cost of gain variability. It explained Profit ($/head) Figure 2. Monthly average fed steer profit distributions by weight category. 2 Beef Cattle Handbook
9 head. Profits for lb. placements were greater than $100 per head during 7 percent of the months. Downside risk varied among placement weight categories. In 34 percent of the months, lb. placements were not profitable; in 32 percent of the months, lb. placements realized losses, as did 29 percent of the months for the lightest weight category. Factors Affecting Profit Variability About 93 to 94 percent of the variability in steer feeding profit over time was explained by fed price, feeder steer price, corn price, interest rates, feed conversion, and average daily gain. Table 2 reports the relative contributions of these factors to the risks associated with steer feeding profitability by placement weight. Together, fed and feeder steer prices explain 71 to 80 percent of profit risk. This emphasizes the importance producers need to place on cattle prices when developing budgets and preparing procurement and marketing strategies. Further, management of purchase prices is more important for heavyweight steers since the impact of purchase price on profitability increases as placement weight increases. Conversely, the effect of fed cattle price is greater for lighter placements as they require more days on feed, allowing for greater fluctuations in fed cattle price. The next most important factor in explaining profit risk is corn price. Movements in corn price had the greatest impact on the profitability of lightweight steers, as they will consume more feed during the finishing period than heavyweight cattle. Feed conversion was the next most important element, accounting for 3 to 5 percent of net return risk. Finally, the combination of average daily gain and interest rates explains 2 to 4 percent of profit variability. Rate of gain is more important for heavier placements as they need to gain the last expensive pounds as quickly as possible. Management Recommendations Cattle prices, feed prices, and performance are important in accounting for the risks of feeding cattle. Thus, producers should consider these factors when developing budgets, calculating break-even points, or placing cattle on feed. Break-even price calculations should be calculated for a range of feeder cattle prices, corn prices, and performance measures when placing cattle. The information from this sensitivity analysis can be incorporated into production and marketing plans. Because 38 to 54 percent of the variation in profits is attributable to movement in sale prices, cattle feeders should consider actively managing fed cattle price risk through forward cash contracts, hedging, or the use of options. Moreover, anecdotal evidence suggests that many cattle feeders do not attempt to manage feeder cattle or feed price risk. Results from the KSU study indicate that 33 to 48 percent of the variation in cattle feeding margins is attributable to movement in feeder cattle prices and corn prices. As a result, cattle feeders should strongly consider attempting to manage their Table 2. Percent of Total Explained Steer Feeding Net Return Variability over Time Attributable to Selected Factors, January May Explanatory Placement Weight Variable 600/ / /899 lbs. lbs. lbs % Fed Price Feeder Price Corn Price Interest Rate Feed Conversion Daily Gain Total Explained a Unexplained Variability b a Total percentage of variability in net return explained by variability in the explanatory variables. b Unexplained variability is 100 minus total explained. input price risk. Acknowledgements The authors acknowledge the generosity of the two anonymous feedyard managers for providing data. References 1. Albright, M.L., T.C. Schroeder, M.R. Langemeier, J.R. Mintert, and F. Brazle Cattle Feeding Profit and Cost of Gain Variability Determinants. The Professional Animal Scientist, 9: Federal Reserve Bank of Kansas City. Various Issues. Regional Economic Digest. 3. Kansas Agricultural Statistics. Various Issues. Agricultural Prices. 4. United States Department of Agriculture, Agricultural Marketing Service. Various Issues. LS- 214, Dodge City, Kansas. BCH
10 Authors: Martin L. Albright, Ag Economist, Kansas State University Michael R. Langemeier, Ag Economist, Kansas State University James R. Mintert, Ag Economist, Kansas State University Ted C. Schroeder, Ag Economist, Kansas State University This publication was prepared in cooperation with the Extension Beef Cattle Resource Committee and its member states and produced in an electronic format by the University of Wisconsin-Extension, Cooperative Extension. Issued in furtherance of Cooperative Extension work, ACTS of May 8 and June 30, BCH-8050 Factors Affecting Cattle Feeding Profitability and Cost Of Gain 4 Beef Cattle Handbook
11 L-5356 (RM 1-9.0) 5-00 Beef Cattle Marketing Alliances James D. Sartwelle, III, Ernest E. Davis, James Mintert and Rob Borchardt* Risk Management Education Ever-tightening profit margins and recurring cyclical downturns in cattle and calf markets have forced many cattle producers to search for ways to make their operations more profitable. Of course, cutting the costs of production is one way. However, a new concept called strategic alliance, a way to increase revenues through vertical affiliations, is being widely discussed as a route to a more financially stable ranching operation. Alliance is defined by Webster as an association to further the common interests of the members. In the past 10 years many producer groups have worked to secure marketing agreements with beef packers. Many of these agreements, or alliances, are available to many beef cattle producers. Beef carcass alliances (BCAs) can be grouped into three broad categories: breed association-sponsored, commercial, and natural/implant-free. In addition to these categories, two types of beef carcass targets have emerged. One is a high quality grade target with an acceptably muscled carcass. The other target includes animals that excel in red meat production with acceptable quality grades. BCAs will be identified here by category and the appropriate carcass target. Carcass Alliances Endorsed by Breed Associations Several purebred cattle associations have established programs to encourage commercial cattlemen to use their breed s bulls by providing additional marketing angles for their progeny. This category was dominated by British breeds (Angus, Hereford, Red Angus) for several years; recently, however, some Continental breeds have entered the field. Most of these programs target high quality beef production. The American Hereford Association (Certified Hereford Beef), American- International Charolais Association (Beef-Charolais), Red Angus Association of America (Red Angus Feeder Cattle Certification Program/Supreme Angus Beef), American Gelbvieh Association (Gelbvieh Alliance), and North American Limousin Foundation (Limousin Grid) all offer direct access to carcass pricing devices that are at least partially negotiated by association personnel. (For a sample carcass pricing grid and a more detailed introduction to the concept, please see Fed Cattle Grid Pricing, RM in this series.) Certified Angus Beef (CAB, established by the American Angus Association in 1978) is one of the oldest and best known of the BCAs. This program is dissimilar from most breed association programs in that CAB doesn t directly price cattle on a grid system. Rather, it identifies carcasses that meet several criteria for CAB designation and allows other value-oriented marketing programs to use CAB as a valuation tool. In addition to fed cattle marketing programs, most beef breed associations have developed commercial marketing programs that range from listing feeder cattle for sale to sponsoring group marketing ventures such as special sales. Judging from the proliferation of marketing services launched in the past few years, stiffening competition among *Extension Program Specialist-Risk Management, and Professor and Extension Economist, The Texas A&M University System; Extension Agricultural Economist, Kansas State University; and Extension Program Page 76 of 104 Specialist-Risk Management, The Texas A&M University System.
12 breeds for commercial bull buyers will ensure a healthy array of options in the future. Commercial Carcass Alliances Many firms now offer BCAs to cattle producers. These firms offer grids or marketing arrangements that fit the high quality beef target and/or the red meat yield target. Most of these firms create their niche with cattlemen who are likely to produce certain types of carcasses and beef procurers who merchandise that type of beef. The firms that put such alliances together are usually paid for this service by producers, with fees for feedlot performance information and/or carcass quality information. Firms/alliances in this category include Angus America, Angus GeneNet, Farmland Supreme Beef Alliance, HiPro Producer s Edge, U.S. Premium Beef, and Western Beef Alliance. In addition to providing access (for a fee) to a beef processor s carcass pricing mechanism, some of the firms/alliances offer other services to members. These include discounted semen or bull purchases from carcass-proven sires, membersonly replacement heifer and feeder cattle sales, and listings of approved feedyards. Natural/Implant-Free Carcass Alliances BCAs that target all-natural, implant-free beef production were among the first programs. Many of them have been in existence more than 10 years. Their business has greatly increased in recent years and many of their innovations have been adopted by other programs. While these alliances are all offered by commercial interests, their all-natural orientation places them in a different classification. Generally, these agreements aim for the red meat yield target. Examples of these alliances are Coleman s Natural Meats, Laura s Lean Beef, Maverick Ranches Beef, and B3R Country Meats. Common features of these marketing programs are prohibitions against various commonly used medications or growth enhancers (implants). Some programs also ban the use of ionophores and other feed additives. Targeting health-conscious consumers, the grid pricing structures encourage the production of lean carcasses. Significant premiums are given for Yield Grade 1 and 2 carcasses. Some programs even discount carcasses that grade USDA Prime. What Else Could Alliances Offer? While most alliances have concentrated on marketing and price enhancement strategies, producer groups might also organize input procurement, production cost analysis, performance data analysis, and improved herd management programs. Producers might work together to cut production costs and effect an even greater change in profitability. For example, some alliance managers are developing connections between seedstock producers and commercial cow-calf operators who market cattle through their alliances. One program has offered bonus coupons worth $3 per head for each source-verified animal, consigned and fed on a retained ownership basis, that grades Prime and/or qualifies for the Certified Angus Beef program. Those bonuses can be used toward the purchase of bulls at an alliance-affiliated seedstock sale. Services such as these will likely be common in the future. The Future of Beef Carcass Alliances One difficulty with natural/implant-free BCAs is the trade-off between all-natural beef production and feedlot performance. The producer who joins one of these BCAs must weigh increased animal morbidity and mortality (because of the prohibition of antibiotics) and decreased feedlot gain and feed efficiencies (because of the lack of growth-promoting implants and/or feed additives) against potential carcass premiums for the cattle that actually fulfill alliance specifications. USDA has recently mandated that entities claiming to market a source-verified product must file and maintain a Product Quality Control protocol. This requirement could affect BCAs that market breed-specific products. Breed association-sponsored BCAs would seem to have the upper hand in verifying the parentage of individual animals. In time, BCAs that require (or limit) a certain percentage of different breeds or breed types will have to prove to the USDA that they can verify the sources of their participating cattle. Although the number of head currently slaughtered under alliance programs is a very small portion of the total slaughter, most alliance marketing managers report that the number of cattle enrolled in their programs is increasing. BCAs that consistently return higher prices than cash markets to participating producers will most likely continue to expand. However, most, if not all, BCAs rely on the regular production of sufficient quantities of cattle that meet narrow live and carcass specifications and, in turn, satisfy supply quotas with the packer. If a producer is to prosper in the long run by marketing cattle under these types of premium and discount schedules, he must be able to fine tune the genetic makeup of the cowherd to hit the specs with a degree of regularity while maintaining flexibility in the cowherd to adjust to Page 77 of 104
13 changing trends. More consistent, improved genetics does not come without a cost, and producers must weigh these costs against the potential benefits of participating in these programs. Advice to the Producer: Maintain Flexibility Many producers have the attitude that they will produce specific cattle for specific carcass targets if, and only if, there are clear economic incentives. Other producers are refining their herds genetic makeups with full faith that carcass price premiums already exist. One fact upon which all producers can agree is that formula pricing systems, whether based on quality or red meat yield, are constantly changing. Genetic change, however, does not happen quickly. The average producer will turn only six or seven generations in his herd in his lifetime. Producers cannot be expected to constantly change the genetics of their herds in hopes of hitting some specification marketing program that may or may not exist in the future. Producers must maintain flexibility while developing the herd genetics that appears to be the most economically viable in the short term. In short, producers might be best served by developing cattle that can produce progeny for either the high quality target or the red meat yield target, as situations dictate. This is not contradictory. On the Great Plains, for example, a producer could develop a cowherd of moderate framed, Angus x Hereford Black Baldy females selected for maternal and fertility traits. On the Gulf Coast, a producer could develop a Brahman x Hereford or Brahman x Angus based herd. If market trends indicate premiums for high quality targets, either producer could breed those cows to British bulls with high marbling traits. If the signals indicate premiums for cattle that excel in lean, red meat production, the producers could breed the same cows to heavy muscled, Continental sires. With at least a 2- year lag between making breeding decisions and marketing finished steers and heifers, it is apparent that a producer must have a sound understanding of industry trends and directions. Beef Carcass Alliances and Risk Under grid pricing programs, performance risk lies with the cattle feeder/seller. That is, premiums and discounts are not assessed until the live cattle have been processed and carcasses evaluated. Sound risk management dictates that producers have some idea how their cattle are likely to perform, both in the feedlot and at the carcass level, before enrolling a significant portion of their production in an alliance. There are Extension programs across the country that can help producers send sample calves through feedlots and get information on feeding performance and carcass quality. While no sample is perfect, many producers have learned a lot about the cattle they produce through such programs. This could be the first step in determining whether you have the type of cattle to fit certain alliance programs and their pricing grids. When comparing different pricing structures, remember that different grids use different base prices (for example, plant average prices versus USDA-reported regional prices) and different base grades (for example, one grid uses USDA Choice as a base and discounts cattle that grade USDA Select, while another grid uses Select as a base and awards premiums to cattle that grade Choice). Examine the pricing structures and make sure you are making accurate comparisons. The same performance and financial risks faced by a producer considering traditional retained ownership programs also face a producer considering a BCA. Please consult Retained Ownership Strategies for Cattlemen, RM1-3.0 in this series, for more information. Many breed associations and commercial entities maintain listings of alliance program contact information on their web sites. One such site is This is the official site of the Amercian Shorthorn Association. Page 78 of 104
14 Partial funding support has been provided by the Texas Wheat Producers Board, Texas Corn Producers Board, Texas Farm Bureau and the Houston Livestock Show and Rodeo. Page 79 of 104
15 L-5246 RM Retained Ownership Strategies for Cattlemen Ernest E. Davis, James McGrann and James Mintert* Risk Management Education Market Integration Market integration, or retained ownership, involves carrying over a production activity into the next phase of preparation for the marketplace. There are certain advantages associated with this production and marketing strategy. Retained ownership through the stocker/feeder and finishing phase eliminates some trading points, which can lower procurement, transportation and selling costs. Cattle or calves may still be moved, but without the stress of being cycled through regular market channels. Such cattle can be shipped directly to the place where they will be grazed, backgrounded or finished in a feedlot. Retained ownership also allows producers to spread risk from one production activity to another and from one period of time to another. Cattle producers should seriously investigate the possibilities of retained ownership and then elect the alternative that most closely meets their profit objectives. History reveals that between birth and slaughter, someone will often profit from cattle before they reach slaughter weight. One of the objectives of retained ownership is to take advantage of this tendency. During certain periods and conditions, retaining ownership can be, and has been, more profitable than selling calves at weaning. Ranchers must carefully evaluate each decision period, because by retaining ownership they are assuming more production and marketing risks. If the producer misjudges future market conditions, or if the cattle are not properly contracted, retaining ownership can cause an accumulation of losses rather than profits. There are other important conditions to consider when deciding whether to retain ownership. First, retaining ownership will increase management and decision-making requirements. More capital will be required for the additional production expenses. The cattle producer s cash flow will change because retained ownership delays income and adds production costs. Producer Size Many cattle producers do not have enough calves of similar kind at one time to use the retained ownership strategy. Usually 100 head are required for a pen at most commercial feedyards. But this should not deter you from using this strategy when trying to make a profit. Producers can form marketing associations, cooperatives or partnerships to put together the necessary cattle. In some cases, it may be feasible to sort and commingle calves or feeder cattle into lots large enough to achieve this minimum size, thus making retained ownership a feasible alternative. *Professors and Extension Economists, The Texas A&M University System; and Extension Agricultural Economist, Kansas State University Agricultural Experiment Station and Cooperative Extension Service.
16 The First Decision Point The most important piece of information for making marketing decisions comes from you, the producer. It s important to know your individual production costs for each stage of production. Sometimes cattle producers pass up profit opportunities because they do not know their own production costs and, as a result, are unable to project profitability accurately in the next production phase. For example, if at weaning time a cow-calf producer determines that a profit is not available on the cash market, nor has it been locked in by contracting calf sales, the logical strategy is to maximize returns from that point on. Although the initial production phase, in this case the cow-calf stage, may not be profitable, it s possible the cattle enterprise s total profitability may be improved by retaining ownership into the next production phase. But to accurately assess profitability, you need to be able to project costs for the next production phase. Buy-Sell Price Relationships One reason some cattle producers have not used retained ownership strategies more often is to avoid the adverse buy-sell price situations associated with buying lighter calves and selling heavier cattle. Generally, as cattle gain more weight their price per pounds drops, or as a term commonly used in the industry implies, the price rolls-back. This means that producers will generally sell heavier weight feeder cattle at a price per hundredweight that is lower than the price per hundredweight they are accustomed to receiving for lighter weight calves. Cost Considerations Even with price roll-backs, retained ownership programs can be profitable. An important consideration in determining whether or not to retain ownership of a group of cattle is the relationship between calf prices and cost of gain. Knowing this enables you to determine the required price relationship between the beginning and end of the production period. For example, if expected costs of gain exceed weaned calf prices, the sale price at the end of the production period will need to be above the weaned calf price at the program s outset. If costs of gain are less than weaned calf prices, some roll-back in prices of feeder cattle can be endured without suffering a loss. Table 1 illustrates the effects of cost of gain and total pounds of gain on cattle break-even prices. The table assumes you are grazing or backgrounding a 500-pound stocker calf with a value at the program s outset of $80 per hundredweight. Costs of gain are given in units of $5 per hundredweight, beginning at $35 and increasing to $55. If, for example, the stocker gained 200 pounds during this period at a cost of $40 per hundredweight, the break-even price at the program s end would be $70.29 per hundredweight, including interest charges on the calf and other feeding costs. As one would expect, the price per hundredweight required to break even is below the calf s per hundredweight price at the program s outset because of the lower cost of gain. Also note that as the total pounds of gain during the feeding program increase, you can tolerate a larger price rollback. Table 1. Break-even prices for a 500-pound calf grazed to different endpoint weights at various costs of gain. 1 Costs of gain $/cwt. Pounds gained Break-even prices $/cwt pound calf at $80.00 per cwt.; costs of gain include all production, management, marketing, finance and transportation costs.
17 Table 2 provides break-even prices for 750- pound feeders entering a feedlot at a price of $68 per hundredweight. Once again, costs of gain and total weight gain are allowed to vary. Finishing a 750-pound animal to 1,150 pounds at $55 direct cost of gain would require a $65.45 break-even price with interest. Interest is charged on the full cost of the feeder and all other costs, adjusted for the time the cattle are on feed. Table 2. Break-even prices for a 750-pound feeder fed to different endpoint weights at different costs. 1 Costs of gain $/cwt. Pounds gained Break-even prices $/cwt pound calf at $68.00 per cwt.; costs of gain include all production, management, marketing, finance and transportation costs. Average daily gain of 3 lbs. per day assumed. Information Sources It is essential that cattlemen have good information on current conditions and trends in the livestock, grain and meat sectors as they become involved with retained ownership strategies. They must also be current on consumer eating trends, as well as the general conditions of the U.S. and world economies. Trends in domestic cattle numbers and prices should be considered before deciding whether or not to retain ownership. Cattlemen should be aware of the size of the U.S. cow herd and the calf crop and also have some knowledge of the current cattle cycle. Perhaps the most important piece of market information to consider is whether cattle prices are expected to rise or fall, as a function of the cattle cycle. Generally, retained ownership strategies will work best when cattle prices are expected to rise cyclically over the course of the feeding period, although retained ownership can still be profitable even without a significant rise in price level. It may at first appear to be a difficult task to access such information, but it is not. Much of the information is available at little or no cost through the U.S Department of Agriculture, the Extension Service or cattlemen s associations. The next step is to determine what factors are having the most impact on the current market and to watch those trends carefully. One of the simplest ways to monitor market conditions is to subscribe to weekly or monthly newsletters with analyses of current trends and factors that affect the markets. Such newsletters are available through Extension Services or various commercial consulting firms. These resources may help you fine-tune your market awareness and decision-making skills. Examples of these newsletters are the K-State Ag Update from the Kansas State University Cooperative Extension Service (via subscription, or free on the Internet at livestock), and Texas Livestock Roundup ( from the Texas Agricultural Extension Service. Financial Considerations Retained ownership increases capital requirements and delays income. This must be considered and some adjustment to cash flow expectations must be made if retained ownership is going to be successful. You may need to prepare a balance sheet, projected income statement, cash flow, and a marketing plan before the lender will provide the additional capital required for increased production costs and delayed income. Some lenders may require that a portion of the cattle be hedged before lending additional capital. Feeding Arrangements In today s cattle industry, leased grazing and custom feeding are options available to most cattlemen. In both options there are various arrangements for assessing charges. The two most common methods are a fixed charge based on cost of gain, and the sale of feed and services. These two approaches differ primarily in the way risk is shared between the feeder and cattle owner. Under a fixed cost of gain arrangement, the cattle owner shares in the risks of death loss and assumes all the risks of falling cattle prices, whereas the custom grazier or feeder shares in the death risks and assumes all the risks of poor cattle performance, bad weather, poor facilities, sickness, rising feed costs,
18 weight shrink and management. If the feeder simply sells feed and services to the cattle owner, virtually all of the risks are shifted away from the feeder to the cattle owner. Very few commercial cattle feeders will feed cattle for a fixed cost of gain, but it is not uncommon for custom graziers or custom backgrounders to offer a fixed cost of gain program. The relative merits of the two approaches to custom feeding depend on the individual situation, but be aware of the big difference in the risk profile under the two approaches. Tax Advantages Retained ownership also offers cattle producers some flexibility in managing their annual income tax liabilities. By retaining ownership, a producer may transfer taxable income from one year to the next. This may be especially useful in years when sales have been high. It is possible that some sales can be carried over to the next year at reduced risk by using futures or options contracts. It is important to discuss these options with your financial advisor. If cattle are being fed in one year and sold in the next, prepayment of feed and production expenses, not to exceed 50 percent of the total, may be charged against income received during the year the cattle were placed on feed. This allows cattlemen some flexibility in planning their taxable income and tax liabilities from one year to the next. Decision Aids The Texas Agricultural Extension Service has computer software that helps prepare financial statements, set up retained ownership budgeting, and summarize closeouts. This software can be obtained from Extension livestock marketing and management economists or on the Internet at For estimating returns in a cattle feeding program, you may obtain a copy of publication C-734, Seasonality in Steer Feeding Profitability, Prices and Performance, from the Kansas State University Cooperative Extension Service. It is available at county Extension offices in Kansas or on the Internet at edu/livestock. Partial funding support has been provided by the Texas Wheat Producers Board, Texas Corn Producers Board, and the Texas Farm Bureau. Produced by AgriLife Communications & Marketing, The Texas A&M System Extension publications can be found on the Web at: Educational programs of the Texas AgriLife Extension Service are open to all citizens without regard to race, color, sex, disability, religion, age or national origin. Issued in furtherance of Cooperative Extension Work in Agriculture and Home Economics, Acts of Congress of May 8, 1914, as amended, and June 30, 1914, in cooperation with the United States Department of Agriculture. Texas AgriLife Extension Service, The Texas A&M System. 1.5M, Reprint ECO
19 E-557 RM Risk Management Grid Pricing of Fed Cattle Robert Hogan, Jr., David Anderson and Ted Schroeder* Grid prices, or value-based marketing, refers to pricing cattle on an individual animal basis. Prices differ according to the underlying value of the beef and by-products produced from each animal. Schroeder et al. have reported that pricing fed cattle on averages is detrimental to the industry because it does not send appropriate price signals to cattle feeders, stockers and, ultimately, cow-calf producers. However, incentives to sell cattle on averages and problems associated with identifying beef quality have inhibited the development of value-based pricing. Both cattle feeders and packers have been reluctant to change from a live animal pricing system to a carcass pricing system. Opportunities to profit from better matching fed cattle prices to value have encouraged packers, alliances and producers to use carcass-based pricing. Now, there are several value-based fed cattle pricing systems, including formula pricing, price grids and alliances. Is there one best pricing method? How are live weight, dressed weight and grid or formula prices related? The purpose of this publication is to help producers decide which form of fed cattle pricing may be most profitable for them. Is Carcass Merit Pricing For You? Should you market your cattle on a carcass merit basis? If so, does it matter which pricing system you use or which packer or alliance you sell to? The answer to both questions is, It depends. The most critical factors that influence the profitability of these decisions include: 1) the quality and dressing percent of the cattle you produce; 2) the Choice-Select market price spread; 3) production and feeding cost differences associated with targeting your cattle to a particular price grid or packer; and most important 4) your knowledge about the price/ quality distribution of your cattle and your (or the feeder s) ability to sort your cattle to meet the criteria for a particular grid or formula. The following analyses focus on the price/ cattle quality relationship, without considering production costs. This is not to imply that production costs associated with attaining a particular quality-related price incentive are not important. They are critical to profitability. However, production costs differ with producers and cattle types and are not explicitly evaluated here. Cattle Pricing Methods Fed cattle usually are priced in one of three ways: 1) live; 2) dressed weight or in the beef; or 3) carcass grade and yield or grid pricing. Live Cattle Pricing When fed cattle are priced on a live basis, price is generally negotiated between the packer and the feedlot based upon the expected *Assistant Professor and Extension Economist Management, and Professor and Extension Economist Livestock and Food Marketing, The Texas A&M System; and Professor and Extension Economist, Kansas State University.
20 1 It s important to note that the packer is not guaranteed a profit. The cattle market is a competitive market where packers still have to bid to get the cattle. That bidding sometimes is easier or harder. Packers do lose money, at times, when market conditions dictate that they pay more for the cattle than was profitable. value of the cattle when processed (a 4 percent pencil shrink on the cattle from the feedlot to the packing plant is usually included). To establish a buy order, the packer starts with a base Choice carcass price and then adds or subtracts expected quality and yield grade premiums and discounts associated with quality traits the pen of cattle are expected to exhibit when processed. The adjusted carcass price is converted to a live animal price by multiplying it by the expected dressing percentage. This live price is adjusted with by-product and hide values and further adjusted for slaughter costs, transportation costs, and the packer s profit margin 1 to establish an estimated live animal bid price. If packers can purchase a large number of cattle from one location at one time, they may increase their bid price to reflect reduced transactions and procurement costs. Pricing cattle on a live basis is appealing to some cattle feeders who want to maintain complete flexibility in cattle pricing until the transaction price is established. Live pricing may also be preferred if the producer does not know the characteristics of the cattle or expects the dressing percentage, quality grade or yield grade to be below average. However, because meat quality and carcass dressing percentage are difficult to predict accurately on live animals, premiums and discounts paid on a live basis generally do not reflect the true value of the final product. In other words, high-quality cattle are often undervalued and low-quality cattle often overvalued. This gives producers no incentive to invest in better genetics and produce a better product. Dressed Weight Pricing When cattle are marketed on a dressed-weight basis, the cattle seller assumes the risk of dressing percentage. Price is based upon the actual hot carcass weight. The dressed price offered is similar to the live price bid in that the buyer starts with a base Choice carcass price and adjusts it for expected quality and yield grade, weight premiums and discounts, by-products, slaughter costs (seller generally pays transportation on dressed cattle sales), and the packer s profit. In principle, the dressed-weight price will be comparable to a live price adjusted for dressing percentage for the same pen of cattle. In practice, the dressed price (after transportation costs) may be higher or lower because there are no errors in estimating dressing percentage. Over time, across a large number of pens, the average dressed price should be greater than the average dressing percentage-adjusted live price, other things being equal. Grid Pricing Pricing cattle on a grade and yield or grid basis is essentially the same as pricing on a dressedweight basis, except that in addition to dressing percentage, the seller assumes the risk of the quality and yield grade of each animal in the pen. Many beef packers offer cattle producers the opportunity to price cattle on a carcass grid basis. Most packer grids list a base price for a Choice, yield grade 3, 550- to 900-pound steer carcass. For example, a typical price premium and discount schedule offered by beef packers is shown in Table 1. Table 1. Example grid, as presented by a packer ($/dressed cwt). Choice YG to 900-lb Base price Prime-Choice Premium 6.00 CAB-Choice Premium 1.00 Choice-Select Discount Choice-Standard Discount Yield Grade I 2.00 Yield Grade II 1.00 Yield Grade IV Yield Grade V Light Carcasses (<550 lb) Heavy Carcasses (>900 lb) Dark Cutters Bullocks/Stags
21 The assorted premiums and discounts are then simply copied into the grid as shown in Table 2. Table 2. Example of grid premiums and discounts. Quality Yield grade grades ($/cwt carcass) Prime 6.00 CAB 1.00 Choice Base Select Standard CARCASS WEIGHTS lb Base (105.00) OTHER Less than 550 lb More than 900 lb Dark Cutter, etc. Bullock/Stags The rest of the grid is now filled in typically by just adding premiums and discounts. For example, to get the premium for Prime-Yield Grade 1, add the $6.00 Prime premium and the $2.00 Yield Grade 1 premium to get $8.00. As another example, to compute the discount for Select-Yield Grade 5, add the $9.00 Select discount and the $20.00 Yield Grade 5 discount to get $ The entire grid is shown in Table 3. Table 3. Example grid premiums and discounts. Quality Yield grade grades ($/cwt carcass) Prime CAB N.A. N.A. Choice Base Select Standard CARCASS WEIGHTS lb Base (105.00) Less than 550 lb More than 900 lb OTHER Dark Cutter, etc. Bullock/Stags The price received for each carcass is the base price plus the particular premiums and discounts. For example, if the Choice, yield grade 3, 550- to 900-pound carcass price is $105.00/cwt, a Select, yield grade 4, 700-pound carcass would receive a price of $81/cwt ($105.00/cwt - $24.00/cwt, the Select-yield grade 4 discount). The USDA reports a weekly survey summarizing selected beef packer grid premium and discount schedules. This report is on the internet at (National Weekly Direct Slaughter Cattle Premiums and Discounts). The LM CT155 report is useful for understanding average grid price premiums and discounts being offered by packers, and for raising awareness of the range of discounts and premiums. Table 3 illustrates how quickly net price can decrease with yield grades 4 and 5 and with quality grades below Choice (Select and Standard). In this example, the discount from Choice to Select is a relatively severe $9/cwt. The discounts between Choice and Select quality grades typically range from $1.00/cwt to $12.00/cwt, depending on the supplies of Choice versus Select carcasses, the demand for each, and seasonal purchasing patterns and habits. (The weekly Choice-Select spread has been as large as $23.08 and as small as $0.68 over the past 5 years.) There are usually large discounts for Standard grade carcasses, dark cutter carcasses, and carcasses lighter than 550 pounds or heavier than 900 to 950 pounds. Some grids also offer premiums and discounts for hide quality. For many packers grids, price premiums and discounts are additive. That is, the base price is adjusted in an additive manner for the associated characteristics of the carcass (as in our example above). For some packers, not all premiums and discounts in their price grid are additive. For example, some packers quote the same price for all Standard grade cattle regardless of yield grade. The USDA grid summary report assumes additive discounts and premiums. In addition, this report is not volume-weighted and includes only packerstated grids, not actual purchases. As a result, the report does not represent market average grid prices. This is important to understand when interpreting the USDA price report and comparing it with any particular packers grids you may be considering. 3
22 Summary of Pricing Methods Table 4 summarizes and compares issues associated with typical fed cattle pricing arrangements. Differences in the various methods are important because they use different kinds of information and cause prices to differ even for the same pen of cattle. The key is that as a producer moves from live cattle pricing to dressed-weight to grid pricing, it is increasingly important to understand the type of cattle being marketed and the pricing system being used, and to assess probable net price received. Over time, average cattle or cattle with little background information may sell better with live pricing. A somewhat better class of cattle may sell better with dressed pricing. First rate classes of cattle whose characteristics are known by the producer may sell better by pricing on the grid. Table 4. Assessing ways to sell fed cattle. Cattle pricing method Producer pricing attribute Live Dressed Grid Pricing level pen level pen level animal level Paid for quality No No Yes Paid for yield No No Yes Paid for dressing % No Yes Yes Who pays trucking? Buyer Seller Seller Formulas: Importance of Base Price When fed cattle are priced on formula, an important consideration, in addition to the premium/discount structure, is the base price. In interviews with packers and cattle feeders, Schroeder et al. discovered several different types of base prices being used. One was the average price of cattle purchased by the plant where the cattle were to be slaughtered. The average price of cattle was usually for the week prior to, or the week of, slaughter. Other base prices were specific market reports such as highest reported price for a specific market for the week prior to, or week of, slaughter. One base price was tied to live cattle futures prices. Some base prices were negotiated. Some base prices were on a carcass weight basis, whereas others were on a live weight basis based upon yields of the cattle slaughtered. Many packers have established base prices using plant average quality grades and dressing percentages of cattle slaughtered during the week. Before agreeing to deliver cattle to a particular packer on formula or grid, the producer should understand in detail how the base price is calculated and obtain some base price quotes over time from several packers. The producer does not want any surprises at this point. Importance of Grid Premium/Discounts When selling cattle on price grids, in addition to considering base prices, cattle producers should carefully evaluate the price premium/discount structures of various packers grids and determine which grid is most advantageous to them. Different grids may offer significantly different prices for the same quality of cattle. In addition, packers value traits differently. For example, one packer might not discount select cattle and another packer might not discount Yield Grade 4 as much as another packer. Pens of cattle that are fairly uniform generally bring similar prices with different packer grids. However, pens with even small percentages of higher or lower grade carcasses, heavier or lighter animals, or more than the average number of out cattle (dark cutters, stags, bullocks, etc.) have much more variable prices. For this reason, it is important for cattle producers to know their cattle, sort their cattle carefully for uniformity, and target them for specific packers. Grid Price Determinants over Time In addition to variability in prices across grids, it is important that producers understand determinants of price differences over time. Small changes in dressing percentage alter the relative advantages of selling on either a live or dressed basis. For example, with a $65/cwt live steer price and a $102.50/cwt dressed carcass price, cattle dressing higher than 63.4 percent will receive a higher price per head if sold dressed than if sold live, and cattle with a lower dressing percentage will receive a higher price on a live basis. With 4
23 these prices, a 1200-pound live steer will gain $6/head in value for each 0.5 percent increase in dressing percentage. Over time, one of the most important determinants of price grid premiums and discounts is the Choice-Select carcass price spread. The greater the Choice-Select spread, the greater the price discount for lower quality cattle. The Choice-Select price spread varies over time as the cattle supply and demand for specific quality grades change. There is a seasonal pattern to the Choice- Select spread. It typically is the widest in May- June and narrowest in February and again in August. The Choice-Select spread widens and narrows based on seasonal patterns in relative supplies of Choice and Select cattle. Seasonal demand patterns for different cuts and qualities also affect the spread. Yield grade premiums and discounts have remained relatively stable over time for all packer grids. Therefore, this pricing factor is expected to remain more predictable than the Choice-Select price spread. References Schroeder, T.C., C.E. Ward, J. Mintert and D.S. Peel. Beef Industry Price Discovery: A Look Ahead. Research Institute on Livestock Pricing, Research Bulletin 1-98, March Partial funding support has been provided by the Texas Corn Producers, Texas Farm Bureau, and Cotton Inc. Texas State Support Committee. Produced by AgriLife Communications, The Texas A&M System Extension publications can be found on the Web at: Visit Texas AgriLife Extension Service at Educational programs of the Texas AgriLife Extension Service are open to all people without regard to race, color, sex, disability, religion, age, or national origin. Issued in furtherance of Cooperative Extension Work in Agriculture and Home Economics, Acts of Congress of May 8, 1914, as amended, and June 30, 1914, in cooperation with the United States Department of Agriculture. Edward G. Smith, Director, Texas AgriLife Extension Service, The Texas A&M System.
24 L Using a Slide in Beef Cattle Marketing Rick Machen and Ronald Gill* Selling cattle well in advance of their delivery date, or forward contracting, is a marketing option available to beef producers. Such a transaction requires the seller to estimate the weight of the cattle prior to delivery. Weights estimated at the time of sale and those recorded upon delivery often differ. Therefore, to ensure fair market value upon delivery, an adjustment of the sale price is often necessary. The slide is a predetermined adjustment in the sale price of cattle and is included in the contract (forward contracting) or in the description of the cattle (video or Internet marketing) being offered for sale. It is based on the difference between the weight estimated prior to consignment or contracting and the actual pay weight. Pay weight is the actual live weight of the cattle upon delivery minus a pencil shrink. This pencil shrink is negotiable and normally ranges from 2 to 4 percent. Three slides are used: up, down or both ways. The seller decides the magnitude and direction. Liveweight and the magnitude of the slide are inversely related; as liveweights increase, the slide will usually decrease. Calves (less than 600 pounds) often are sold with a two-way slide. Sliding cattle both ways is particularly useful when environmental conditions such as rainfall and forage availability can drastically affect weaning weights. The two-way slide protects the buyer if the cattle deliver heavier than expected, and ensures the seller will receive a fair market price if the cattle are lighter than expected. The weight of yearling cattle is more predictable; therefore, yearlings are usually offered with an up slide only. *Extension Livestock Specialists, The Texas A&M University System. Up Slide An up slide is exercised when the weight of the cattle upon delivery is heavier than expected. Selling with an up slide locks in a maximum price (dollars per hundredweight or $/cwt) that will be paid for the cattle. Example A In a mid-july sale, 600-pound calves consigned for November delivery sell for $80/cwt. The slide is $5/cwt. Calves will be weighed at the ranch with a 2 percent shrink. Upon delivery in November, the cattle average 630 pounds per head. slide = $5/cwt slide weight = 600 lbs. shrink = 2% sale price = $80/cwt delivered weight = 630 lbs. The slide will be exercised because the cattle were heavier than expected at delivery. shrink = 630 lbs. x 2% = 12.6 or 13 lbs. pay weight = 630 lbs. 13 lbs. = 617 lbs. weight subject to slide = = 17 lbs. 17 lbs. = 0.17 cwt 0.17 cwt x $5/cwt = $0.85/cwt $80/cwt $0.85/cwt = $79.15/cwt The extra 17 pounds (expressed as cwt) is multiplied by the slide, yielding $0.85/cwt. The $0.85/cwt is then subtracted from the sale price of $80/cwt to yield the actual price of $79.15 per hundredweight. The actual price paid for the cattle under this agreement is $ per head cwt (617 lbs.) x $79.15/cwt = $488.36
25 Down Slide A down slide is exercised when the delivered weight of the cattle is less than expected at the time of sale (contract). Selling with a down slide locks in the minimum price ($/cwt) to be paid for the cattle. Example B In a mid-june sale, 500-pound calves consigned for October delivery sell at $90/cwt. The slide is $10/cwt. Calves will be weighed at the ranch with a 3 percent shrink. Upon delivery in October, the cattle average 480 pounds per head. slide = $10/cwt slide weight = 500 lbs. shrink = 3 % sale price = $90/cwt delivered weight = 480 lbs. The down slide will be exercised because the cattle weighed less than expected upon delivery. pay weight = 480 lbs. 3% = 466 lbs. 500 lbs. 466 lbs. = 34 lbs. This 34-pound (.34 cwt) difference is multiplied by the slide ($10/cwt) to get $3.40/cwt, which is added to the sale price of $90/cwt to obtain the actual price of $93.40 per hundredweight. 34 lbs. = 0.34 cwt 0.34 cwt x $10/cwt = $3.40/cwt $90/cwt + $3.40/cwt = $93.40/cwt $93.40/cwt x 4.66 cwt (466 lbs.) = $ Therefore, the actual price received for the cattle is $ per head. A worksheet for evaluating the use of a down slide (line A is greater than line E) follows. Contract (Expected) Values A. Expected weight lbs. B. Price $/cwt C. Pencil shrink % D. Slide $/cwt Expected value [(A/100) C] x B $/hd Actual Values E. Scale weight (avg.) lbs. F. Pay weight (E/100) C G. Weight subject to slide (A/100) F H. Slide adjustment G x D J. Adjusted sale price B + H K. Price received F x J cwt cwt $/cwt $/cwt $/head To evaluate an up slide (line A is less than line E), calculations in lines G and J change as shown. G. Weight subject to slide F (A/100) J. Adjusted sale price B H cwt $/cwt???????????????????????????????????????????????????????????????? Educational programs of the Texas Agricultural Extension Service are open to all people without regard to race, color, sex, disability, religion, age or national origin.?????????????????????????????????????????????????????????????????????????????????????????????????????????????????????????????????????????????????????????????????????????????????????????????????????????????????????????????????????????????????????????????????????????????????????????????????????????
26 E-496 RM Risk Management Introduction To Futures Markets James Mintert and Mark Welch* Futures trading has a long history, both in the U.S. and around the world. Futures trading on a formal futures exchange in the U.S. originated with the formation of the Chicago Board of Trade (CBOT) in the middle of the 19th Century. Grain dealers in Illinois were having trouble financing their grain inventories. The risk of grain prices falling after harvest made lenders reluctant to extend grain dealers credit to purchase grain for subsequent sale in Chicago. To reduce their risk exposure, grain dealers began selling To Arrive contracts, which specified the future date (usually the month) a specified quantity of grain would be delivered to a particular location at a price identified in the contract. Fixing the price in advance of delivery reduced the grain dealer s risk and made it easier to obtain credit to finance grain purchases from farmers. The To Arrive contracts were a forerunner of the futures contracts traded today. Although dealers found it advantageous to trade what essentially were forward cash contracts in various commodities, they soon found these forward cash contract markets inadequate and formed futures exchanges. The first U.S. futures exchange was the Chicago Board of Trade (CBOT), formed in Other U.S. exchanges also began in the last half of the 1800s. For example, the Kansas City Board of Trade (KCBT) traces its roots to January 1876 when a precursor to today s hard red wheat futures contract was first traded. Similarly, a forerunner of the Chicago Mercantile Exchange (CME) was formed in 1874 when the Chicago Product Exchange was organized to trade butter. In each case the exchanges were formed because commercial dealers in corn, wheat and butter needed a way to reduce some of their price risk, which hampered the day-to-day management of their businesses. Sellers wanted to rid themselves of the price risk associated with owning inventories of grain or butter and buyers wanted to establish prices for these products in advance of delivery. In recent years futures contracts have proliferated, particularly in the financial arena, as businesses become more aware of the price risks they face and seek ways to reduce them. What Is A Futures Contract? A futures contract is a binding agreement between a seller and a buyer to make (seller) and to take (buyer) delivery of the underlying commodity (or financial instrument) at a specified future date with agreed upon payment terms. Most futures contracts don t actually result in delivery of the underlying commodity. Instead, most traders find it advantageous to settle their futures market obligation by selling the contract (in the case of a contract that was purchased initially) or by buying it back (in the case of a contract that was sold initially). The trader then completes the actual cash transaction in his or her local cash market. Futures contracts are standardized with respect to the delivery month; the commodity s quantity, quality, and delivery location; and the *Professor and Extension Agricultural Economist, Kansas State University Agricultural Experiment Station and Cooperative Extension Service, and Assistant Professor and Extension Economist Grain Marketing, The Texas A&M System.
27 payment terms. The fact that the terms of futures contracts are standardized is important because it enables traders to focus their attention on one variable, price. Standardization also makes it possible for traders anywhere in the world to trade in these markets and know exactly what they are trading. This is in sharp contrast to the cash forward contract market, in which changes in specifications from one contract to another might cause price changes from one transaction to another. One reason futures markets are considered a good source of commodity price information is because price changes are attributable to changes in the commodity s price level, not changes in contract terms. Unlike the forward cash contract market, futures exchanges provide: Rules of conduct that traders must follow or risk expulsion An organized market place with established trading hours by which traders must abide Standardized trading through rigid contract specifications, which ensure that the commodity being traded in every contract is virtually identical A focal point for the collection and dissemination of information about the commodity s supply and demand, which helps ensure all traders have equal access to information A mechanism for settling disputes among traders without resorting to the costly and often slow U.S. court system Guaranteed settlement of contractual and financial obligations via the exchange clearinghouse The Purpose of Futures Markets Futures markets serve two primary purposes. The first is price discovery. Futures markets provide a central market place where buyers and sellers from all over the world can interact to determine prices. The second purpose is to transfer price risk. Futures give buyers and sellers of commodities the opportunity to establish prices for future delivery. This price risk transfer process is called hedging. Changes in a Futures Contract s Value A futures contract s value is simply the number of units (bushels, hundredweight, etc.) in each contract times the current price. Each contract specifies the volume of grain or livestock it covers. Both Chicago and Kansas City Board of Trade grain and oilseed futures contracts cover 5,000 bushels. The CME s live cattle futures contract covers 40,000 pounds (400 hundredweight) of live weight steers. The lean hogs futures contract covers 40,000 pounds (400 hundredweight) of carcass weight pork and the feeder cattle futures contract covers 50,000 pounds (500 hundredweight) of feeder steers. To determine both contract value and changes in contract value, examine the July KCBT wheat futures contract on a day when the settlement price is $6.00 per bushel. The total contract value would simply be 5,000 bushels times $6.00 or $30,000. If the July KCBT wheat futures price changes to $6.10 per bushel the next day, the new contract value is 5,000 bushels times $6.10 or $30,500. The change in contract value is $30,500 minus $30,000, or $500. Alternatively, you can compute the change in contract value by simply multiplying the price change per unit ($6.10-$6.00=$0.10/bushel) times the number of units in the contract ($0.10/bushel x 5,000 bushels= $500). The effect of a change in contract value depends on whether you previously sold or purchased a futures contract. A decrease in contract value (a price decline) is a loss to anyone who previously purchased a futures contract, but a gain for a trader who previously sold a futures contract. Conversely, an increase in contract value (a price increase) is a gain to anyone who previously purchased a futures contract (i.e., is long), but is a loss for a trader who previously sold a futures contract (i.e., is short). One trader s loss is another trader s gain. For example, in the previous wheat futures example, a trader who purchased July KCBT wheat futures at $6.00/ bushel saw the value of his futures market account increase by $500 when the price rose to $6.10; a trader who sold a futures contract at $6.00/bushel saw the value of his futures market 2
28 account decline by $500. The $500 gain earned by the futures contract buyer came from the futures contract seller s $500 loss via the exchange clearinghouse, as outlined in Figure 1. Futures contract performance is guaranteed by the exchange through an institution known as the exchange clearinghouse, which tracks the value of each trader s position and ensures that sufficient funds are available to cover each trader s obligations. The exchange clearinghouse requires that traders (via the futures Figure 1. Marking-to-Market Buyer and Seller Accounts at Exchange Clearinghouse. Buyer (Long) contract (typically less than 5 percent of contract value), traders of futures contracts are relieved of the responsibility of worrying that the trader on the other side of the contract will default on his or her financial obligations by the mark-to-market margin system and by a series of checks and balances put in place by the exchange to ensure that sufficient funds are available to cover each account s risk exposure. Futures Trading Terminology To trade futures contracts you must become familiar with the terminology used in the trade. Here are some terms and definitions. Date Action Price Day 1 Buy at $6.00/bu Day 2 Seller (Short) No action (but price increases) $6.10/bu Date Action Price $0.10/bu gain x 5,000 bu $500 gain from day 1 Day 1 Sell at $6.00/bu Day 2 No action (but price increases) $6.10/bu $0.10/bu loss x 5,000 bu $500 loss from day 1 commission merchant or broker) deposit money before a trade to ensure contract performance. This deposit is usually referred to as the initial margin deposit. Each trader s margin money is maintained in a separate margin account, which is adjusted daily to reflect the gain or loss in contract value that occurred that day. This process is sometimes referred to as Marking-to-Market, because the account is adjusted to reflect its current market value based on that day s closing or settlement price. Although the margin requirements are small relative to the total value of the Long Short Bull Bear Market order Limit order Stop order A buyer of a futures contract. Someone who buys a futures contract is often referred to as being long that particular contract. A seller of a futures contract. Someone who sells a futures contract is often referred to as being short that particular contract. A person who expects a commodity s price to increase. If you are bullish about wheat prices you expect them to increase. A person who expects a commodity s price to decline. If you are bearish about wheat prices you expect them to decline. An order to buy or sell a futures contract at the best available price. A market order is executed by the broker immediately. Sell one July KCBT wheat, at the market is an example of a market order. An order to buy or sell a futures contract at a specific price, or at a price that is more favorable than the price specified. For example, Buy one March KCBT wheat at $6.30 limit means buy one March KCBT wheat contract at $6.30 or less. In this example, the order will not be executed at a price higher than $6.30. An order which becomes a market order if the market reaches a specified price. A stop order to buy a futures contract would be placed with the stop price set above the current futures price. Conversely, a stop order to sell a futures contract would be placed with the stop price set below the current futures price. 3
29 Using Futures Contracts in a Farm Marketing Program There are a number of ways futures contracts can be used in a farm marketing program. Futures contracts can be useful when marketing grain or livestock because they can be a temporary substitute for an intended transaction in the cash market that will occur at a later date. This is a working definition of hedging. For example, if you plan on selling wheat for cash at harvest, but would like to lock in the futures price ahead of harvest, you could sell a KCBT July wheat futures contract as a temporary substitute for the cash grain you plan to sell in the future. When you actually make the cash grain sale at harvest, you will no longer need the temporary substitute, which was your sale of the wheat futures contract. Thus, as soon as you sell the cash wheat you would exit your temporary substitute contract by buying a KCBT July wheat futures contract. Doing so means you no longer have an open position on the futures exchange. Your actual net sale price for the wheat would be the amount you received for the cash wheat at the elevator, plus any gain or minus any loss on the futures transaction. Futures contract prices also can be used as a source of price forecasts. A futures contract price represents today s opinion of what a commodity s value will be when the futures contract expires. If a history of the difference between a commodity s futures contract and cash prices, for a particular grade and specific location of interest (known as the basis) is available, it can be used to estimate a futures market-based cash price forecast. For example, assume that on March 15 the KCBT July wheat futures contract is trading at $6.00 per bushel, and your local cash market price at harvest is generally $0.40 per bushel below the KCBT July wheat futures contract price (i.e., a basis of negative $0.40 per bushel). In this case, a futures-based local cash price forecast at harvest time would be $5.60/ bushel. This forecast can be compared with price forecasts from other sources such as university Extension economists, market advisory services, and the U.S. Department of Agriculture when preparing budgets and making marketing decisions. For more details on basis and how hedging works, see the following publications in this series: Selling Hedge with Futures (E-497) and Buying Hedge with Futures (E-498). Partial funding support has been provided by the Texas Corn Producers, Texas Farm Bureau, and Cotton Inc. Texas State Support Committee. Produced by AgriLife Communications, The Texas A&M System Extension publications can be found on the Web at: Visit Texas AgriLife Extension Service at Educational programs of the Texas AgriLife Extension Service are open to all people without regard to race, color, sex, disability, religion, age, or national origin. Issued in furtherance of Cooperative Extension Work in Agriculture and Home Economics, Acts of Congress of May 8, 1914, as amended, and June 30, 1914, in cooperation with the United States Department of Agriculture. Edward G. Smith, Director, Texas AgriLife Extension Service, The Texas A&M System. 4
30 E-498 RM Risk Management Buying Hedge with Futures Mark Welch and David Anderson* Many bulk purchasers of agricultural commodities need price risk management tools to help stabilize input prices. Livestock feeders anticipating future feed needs or grain exporters making commitments to sell grain are two users of agricultural commodities who could benefit from input price management strategies. A common tool is a buying, or long, hedge using futures. Producers concerned with price fluctuations for agricultural inputs can use a buying hedge with futures to manage that price risk. What Is a Hedge? A buying hedge involves taking a position in the futures market that is equal and opposite to the position one expects to take later in the cash market. The hedger is covered against input price increases during the intervening period. If prices rise while the hedge is in place, the higher cash price the producer must pay for his or her inputs is offset by a profit in the futures market. Conversely, if prices fall, losses in the futures market are offset by the lower cash price. There are five steps to implementing a buying hedge that will likely meet your pricing objectives. 1. Analyze the expected profit of the enterprise in question. For example, a cattle feeder should analyze how expected profits for fed cattle change as corn price (the input in question) changes. Only then can the producer know if the corn price he could hedge would allow the cattle feeding enterprise to achieve its corn pricing goal for the period, holding all other input prices and animal performance constant. 2. Be sure to hedge the correct quantity. Check contract quantity specifications and be sure the proper amount of inputs is hedged. For example: A cattle feeder plans to feed 120 head of steers weighing 700 pounds each. His targeted out-weight for the steers is 1,150 pounds (140 days on feed x 3.2 pounds average daily gain) and the projected feed conversion (pounds of feed per pound of gain) is 7. The cattle feeder s projected feed requirement is 6,750 bushels (54,000 pounds total gain x 7 pounds of feed per pound of gain 56 pounds per bushel). Since one Chicago Board of Trade (CBOT) corn contract is specified as 5,000 bushels, the feeder would need to hedge two contracts to fully cover the projected feed requirements. 3. Use the proper futures contract. Most widely produced agricultural commodities have a corresponding futures contract. Fed and feeder cattle, *Assistant Professor and Extension Economist Grain Marketing, and Professor and Extension Economist Livestock and Food Marketing and Policy, The Texas A&M System.
31 hogs, corn, wheat and soybeans are a few examples. A notable exception is grain sorghum. Because of grain sorghum s close price relationship to corn, producers can use corn futures to manage grain sorghum price risk. Once the proper futures contract is selected, pay close attention to the contract month. Project the date of the anticipated cash market transaction and select the nearest futures contract month after the anticipated purchase in the cash market. 4. Understand basis and develop a basis forecast. Basis (which is covered in depth in another publication in this series) is the relationship between local cash prices and futures prices. If projected basis and actual basis at the time of cash purchase are the same, then the purchase price that was hedged will be achieved. Failure to account for basis and basis risk could mean not meeting the buying hedge pricing goal. 5. Be disciplined and maintain the hedge until the commodity is purchased in the cash market or the hedge is offset by another price risk management tool. Producers should hedge only prices that are acceptable to them. Once you have initiated a hedge position, do not remove the hedge before the cash purchase date without carefully considering the risk exposure. Case Example: Buying Hedge for Feeder Steers Joe has a pen of cattle on feed that he will sell in early October. He will need to purchase feeder cattle at that time to replace the fed cattle he sells. In June, Joe sees that November Chicago Mercantile Exchange (CME) Feeder Cattle futures are trading at $105 per hundredweight. Joe knows the historical basis for 750-pound feeder cattle the first week of October is -$1 per hundredweight (i.e., cash price is $1 per hundredweight less than futures price). Observation of futures prices leads him to project a feeder steer purchase price of $104 per hundredweight ($105 - $1) for October 1. At that price, he projects a $20 per head profit under normal feeding conditions. Joe fears feeder cattle prices may increase between June and October. He elects to implement a buying hedge to lock in the purchase price for 120 steers (120 steers x 750 pounds per steer 50,000 pounds per contract = two contracts) (Table 1). Table 1. June 15 Cash market Objective: to realize a feeder cattle purchase price of $104/ cwt October 1 Buys 120 head of 750-lb feeder steers at $110/cwt Futures market Buys two CME November Feeder Cattle contracts at $105/cwt Sells two CME November Feeder Cattle contracts at $111/cwt Basis Projected at -$1/cwt Actual basis, -$1/cwt ($110-$111) Gain or loss in futures: Gain of $6/cwt ($111 - $105) Results: Actual cash purchase price... $ Futures profit... - $ 6.00 Realized purchase price...$104.00* *Without commission and interest How Did the Feeder Steer Buying Hedge Work? Joe projected an October 1 purchase price of $104 per hundredweight on June 15. On October 1, he purchased his feeder steers for $110 per hundredweight and liquidated his futures position at $111 per hundredweight, for a basis of -$1 per hundredweight. The increase in feeder cattle prices he feared occurred; thus, the cash price he paid for the steers was greater than his projection. However, Joe realized a $6 per hundredweight profit from the increase in the 2
32 CME November feeder cattle price. Applying the $6 per hundredweight futures profit to the cash purchase price, the realized (or net) purchase price was $104 per hundredweight, just as Joe projected. Without Joe s accurate basis forecast, the projected purchase price and realized price would have been different. A favorable basis move (i.e., a widened basis) would have yielded a lower realized purchase price, while an unfavorable basis move would have increased the net buying price. In a hedged position, the producer trades price risk for basis risk. Once more, the basis forecast is a key to hedging with futures. What if Joe s Price Outlook Was Incorrect? Let s examine the effects of a price decline on the performance of Joe s feeder steer buying hedge (Table 2). Joe s pricing objective of $104 per hundredweight was achieved. This example illustrates the discipline necessary when hedging. Although Joe might be frustrated with the results of this buying hedge in a declining market, he should remember that the decision to hedge was made after careful analysis and his best price forecast. While Joe might not be happy about a net price of $104 per hundredweight, his plan was sound, he still made a profit feeding these cattle, and he will likely maintain, if not improve, his overall financial position. Table 3. Advantages and disadvantages of a buying hedge with futures. Advantages Reduces risk of price increases Could make it easier to obtain credit Disadvantages Gains from price declines are limited Risk that actual basis will differ from projection Table 2. June 15 Cash market Objective: to realize a feeder cattle purchase price of $104/cwt Futures market Buys two CME November Feeder Cattle contracts at $105/cwt Basis Projected at -$1/cwt Establishing a price aids in management decisions Easier to cancel than a forward contract arrangement Futures position requires a margin deposit and margin calls are possible Contract quantity is standardized and may not match cash quantity October 1 Buys 120 head of 750-lb feeder steers at $100/cwt Sells two CME November Feeder Cattle contracts at $101/cwt Actual basis, -$1/cwt ($100-$101) Gain or loss in Futures: Loss of $4/cwt ($101 - $105) Results: Actual cash purchase price...$ Futures loss... + $ 4.00 Realized purchase price...$104.00* *Without commission and interest 3
33 Partial funding support has been provided by the Texas Corn Producers, Texas Farm Bureau, and Cotton Inc. Texas State Support Committee. Produced by AgriLife Communications, The Texas A&M System Extension publications can be found on the Web at: Visit Texas AgriLife Extension Service at Educational programs of the Texas AgriLife Extension Service are open to all people without regard to race, color, sex, disability, religion, age, or national origin. Issued in furtherance of Cooperative Extension Work in Agriculture and Home Economics, Acts of Congress of May 8, 1914, as amended, and June 30, 1914, in cooperation with the United States Department of Agriculture. Edward G. Smith, Director, Texas AgriLife Extension Service, The Texas A&M System.
34 E-497 RM Risk Management Selling Hedge with Futures Mark Welch* When a commodity price is acceptable prior to the time the commodity will be sold in the cash market, a producer can use a selling hedge to reduce the risk of declining prices. What Is a Hedge? A selling hedge involves taking a position in the futures market that is equal and opposite to the position one expects to have in the cash market, so one is covered (subject to basis risk) against price declines during the intervening period. If futures and cash prices decrease while the hedge is in place, the lower cash price the producer realizes for his production is offset by a profit in the futures market. Conversely, if prices increase, losses in the futures market are offset by the improved cash price. There are five steps to implementing a selling hedge that will likely meet your pricing objectives. 1. Analyze the expected profit of the enterprise in question. Whether or not you decide to implement a selling hedge will depend somewhat on the cost of production for the enterprise and on having an acceptable profit expectation. However, protecting an acceptable profit might not always be possible. A prudent manager might also use a selling hedge to limit losses when market conditions dictate. 2. Be sure to hedge the correct quantity. Check contract quantity specifications and be sure the proper amount of a commodity is hedged. For example: A cattle feeder has 100 head of steers on feed that have a projected out-weight of 1,200 pounds each. The total pounds of fed cattle produced divided by the Chicago Mercantile Exchange (CME) Live Cattle contract weight specification yields the number of contracts necessary to fully hedge the cattle (100 head x 1,200 pounds per head 40,000 pounds per contract = three contracts). Similarly, a producer who wants to hedge 100 percent of an expected 10,000 bushels of corn would use two futures contracts (one Chicago Board of Trade, or CBOT, corn futures contract is for 5,000 bushels). 3. Use the proper futures contract. Most widely produced agricultural commodities have a corresponding futures contract. Fed and feeder cattle, hogs, corn, wheat and soybeans are a few examples. A notable exception is grain sorghum. Because of grain sorghum s close price relationship to corn, producers can use corn futures to manage grain sorghum price risk. Once the proper futures contract is selected, pay close attention to the *Assistant Professor and Extension Economist Grain Marketing, The Texas A&M System.
35 contract month. Project the date of the anticipated cash market transaction and select the nearest contract month after the anticipated sale in the cash market. Futures contracts expire before the end of the month and this ensures that all cash sales will take place before futures contracts expire. For example, an expected September corn sale would be hedged against December CBOT corn futures, since there are no contracts available for October or November. 4. Understand basis and develop an accurate basis forecast. Basis (which is covered in depth in another publication in this series) is the relationship between local cash prices and futures prices. Basis is defined as cash minus futures. If projected basis and actual basis at the time of purchase are the same, then the selling price that was hedged will be achieved. Failure to account for basis and basis risk could mean not meeting your selling hedge pricing goals. 5. Be disciplined and hold the hedge until the cash sale of the commodity or until the hedge is offset by another price risk management tool. Producers should hedge only prices that are acceptable to them. Once you have initiated a hedge position, do not remove the hedge before the cash sale date without carefully considering the risk exposure. Case Example: Selling Hedge for Corn Bill is a corn farmer in the Texas Panhandle. He has a 10-year average corn production of 24,000 bushels and at no time in the past 5 years has that production dropped below 15,000 bushels. In March, Bill notices that December CBOT corn futures are trading at $5.65 per bushel. He knows the historical harvest time basis for corn in his county is -$0.05 per bushel relative to futures (i.e., cash price is $0.05 per bushel less than futures price). Based on futures information, he projects a harvest time price of $5.60 per bushel ($ $0.05), which is acceptable to him. Because Bill fears a possible price decline between March and harvest, he elects to implement a selling hedge on 15,000 bushels (three contracts at 5,000 each) because he has a reasonable expectation of producing this quantity based on his production history (Table 1). Table 1. March 5 October 10 Cash market Objective: to realize a corn sales price of $5.60/bu Sells 15,000 bu of corn at $5.40/bu Futures market Sells three CBOT December corn contracts at $5.65/bu Buys three CBOT December corn contracts at $5.45/bu Basis Projected at -$0.05/bu Actual basis, -$0.05/bu ($5.40-$5.45) Gain or loss in futures: Gain of $0.20 ($ $5.45) Results: Actual cash sales price...$5.40 Futures profit... + $0.20 Realized sales price...$5.60* *Without commission and interest How Did the Corn Selling Hedge Work? On March 5 Bill projected a harvest-time selling price of $5.60 per bushel. On October 10, he sold his corn for $5.40 per bushel and liquidated his futures position. The decrease in corn prices he had feared did occur, and the cash price he received for his corn was less than his projection. However, Bill realized a $0.20 per bushel profit from the decrease in the CBOT December corn futures price. Applying the $0.20 per bushel futures profit to the cash price, the realized (or net) selling price for the 15,000 bushels he hedged was $5.60 per bushel, just as he had projected. 2
36 Without Bill s accurate basis forecast, the projected selling price and realized selling price would have been different. A favorable basis move (i.e., a narrowed basis) would have yielded a higher realized sales price, while an unfavorable basis move would have decreased the net selling price. In a hedged position, the producer trades price risk for basis risk. Once more, the basis forecast is a key to hedging with futures. Did Bill receive $5.60 per bushel for his entire crop? The answer depends on the quantity produced. If he produced his historical average of 24,000 bushels, he was protected at $5.60 per bushel for the 15,000 bushels he hedged and received a price at harvest of $5.40 per bushel for the unhedged 9,000 bushels. This yields a weighted average price of $5.525 per bushel. Had he produced more than his historical average yield, the weighted average price would have been less than $5.525 per bushel. If he produced less than his historical average yield, the weighted average price would have been higher than $5.525 per bushel. Actual production determines the final average price per bushel. What if Bill s Price Outlook Was Incorrect? Let s examine the effects of a price increase on the performance of Bill s corn selling hedge (Table 2). Table 2. March 5 Cash market Objective: to realize a corn sales price of $5.60/bu Futures market Sells three CBOT December corn contracts at $5.65/bu Basis Projected at -$0.05/bu Results: Actual cash sales price...$5.85 Futures loss... - $0.25 Realized sales price...$5.60* *Without commission and interest Bill s pricing objective of $5.60 per bushel was achieved for the 15,000 bushels hedged. This example illustrates the discipline necessary when hedging. Although Bill might be frustrated with the results of this selling hedge in a rising market, he should remember that the decision to hedge was made after careful analysis and his best price forecast. While Bill might not be happy about a net price of $5.60 per bushel, his plan was sound, he still made his desired profit for this part of his corn crop, and he will likely maintain, if not improve, his overall financial position. Table 3. Advantages and disadvantages of a buying hedge with futures. Advantages Reduces risk of price increases Could make it easier to obtain credit Establishing a price aids in management decisions and can help stabilize crop income within a crop year Easier to cancel than a forward contract arrangement Disadvantages Gains from price increases are limited Risk that actual basis will differ from projection Year-to-year income fluctuations may not be reduced with hedging Contract quantity is standardized and may not match cash quantity Futures position requires a margin deposit and margin calls are possible October 10 Sells 15,000 bu of corn at $5.85/bu Buys three CBOT December corn contracts at $5.90/bu Actual basis, -$0.05/bu ($5.85-$5.90) Gain or loss in futures: Loss of $0.25 ($ $5.90) 3
37 Partial funding support has been provided by the Texas Corn Producers, Texas Farm Bureau, and Cotton Inc. Texas State Support Committee. Produced by AgriLife Communications, The Texas A&M System Extension publications can be found on the Web at: Visit Texas AgriLife Extension Service at Educational programs of the Texas AgriLife Extension Service are open to all people without regard to race, color, sex, disability, religion, age, or national origin. Issued in furtherance of Cooperative Extension Work in Agriculture and Home Economics, Acts of Congress of May 8, 1914, as amended, and June 30, 1914, in cooperation with the United States Department of Agriculture. Edward G. Smith, Director, Texas AgriLife Extension Service, The Texas A&M System.


38 Commodity Options as Price Insurance for Cattlemen R. Curt Lacy 1, Andrew P. Griffith 2 and John C. McKissick 3 Adapted from Managing For Today s Cattle Market and Beyond Introduction Most cattlemen are familiar with insurance. Examples include insuring buildings against fire, equipment against accidents and lives against death or injury. Purchasing insurance trades the possibility of a large but uncertain loss for a small but certain cost: the insurance premium. One of the greatest risks cattle producers face is price risk. Price changes can come in the form of declining cattle prices for sellers, increasing cattle prices for buyers or increasing feed prices for feed users. Because of this risk, producers might want to insure feeder cattle, fed cattle or feed against unfavorable price movements, while still being able to take advantage of favorable price movements. Cattlemen have this opportunity by using the commodity options market 4. What is the Commodity Options Market? The commodity options market is a market in which producers may purchase the opportunity to sell or buy a commodity futures contract at a specified price. Purchasers in options markets have the opportunity or right but not the obligation to exercise their agreement. Therefore, the markets are appropriately named options markets since they deal in an option, not an obligation. Just as a cattleman may purchase the right from an insurance firm to collect on a policy if a building burns, he can purchase the right to sell commodities at a specific price in case prices drop below the specified price. A separate options market also exists to allow the purchase of commodities at a specified price in case prices increase. For instance, if a cattleman wanted to buy the right to sell feeder cattle for $175/cwt., the feeder cattle options market might provide the opportunity. By paying the market-determined premium, the cattleman could then collect on the option if prices fell below $175/cwt. when the cattle were actually sold. If prices are higher than $175/cwt., the cattle are sold for the higher price, and the cost of the premium is absorbed. While this is a simplified version of the actual way in which producers might operate in the options market, the reality behind this concept is not much different. Just as with other types of insurance, by paying a premium, insurance can be purchased against price declines or increases. Collecting on the insurance would be an option if the price moves in an unfavorable direction. The Ins and Outs of Options: Puts and Calls There are two types of commodity options: a put option and a call option. The put option gives the holder (usually a commodity seller) the right -- but not the obligation -- to sell the underlying commodity contract to the option writer at a specified price on or before the commodity expiration date. The call option gives the holder (usually a commodity purchaser) the right -- but not the obligation -- to buy the underlying commodity contract from the option writer (seller) at a specified price on or before the option expiration date. The put option and the call option are two different and distinct contracts. A call option is not the opposite of a put option. Distinguish between the two types of options by remembering that the holder of the put option can choose to put-it-to-them ; that is, sell the product, while the holder of the call option can call-upon- em to provide the product. 1 Associate Professor and Extension Economist-Livestock, University of Georgia 2 Assistant Professor and Extension Economist-Livestock, University of Tennessee 3 Professor Emeritus and Distinguished Marketing Professor, University of Georgia 4 Cattle producers can purchase Livestock Risk Protection (LRP) through crop insurance agents. A good reference on LRP for feeder cattle producers is Livestock Risk Protection Insurance (LRP): How It Works for Feeder Cattle, publication number W 312, available through the University of Tennessee at
39 Buyers and Sellers In the option market, as in every other market, transactions require both buyers and sellers. The buyer of an option is referred to as an option holder. Holders of options may be either seekers of price insurance or speculators. The seller of an option is sometimes referred to as an option writer. The seller may also be either a speculator or someone who desires partial price protection. The choice to buy (hold) or sell (write) an option depends primarily upon one s objectives. Buyers and sellers of cattle options meet on the Chicago Mercantile Exchange. Rather than physically meeting, all transactions are carried out through brokerage firms that act as the buyer s and seller s representative at the exchange. For this service, the brokerage firm charges a commission. The exchange has no part in the transaction other than to insure its financial integrity. In effect, the exchange offers a place for option buyers and sellers to get together under organized rules of trade. Strike Price The specified price in the option is referred to as the exercise price or strike price. This is the price at which the underlying commodity contract can be bought or sold and is fixed for any given option, put or call. There could be several options with different strike prices traded during any period of time. If the price of the underlying commodity changes over time, then additional strike prices may be listed for trade. Underlying Commodity The underlying commodity for the commodity option is not the commodity itself but rather a futures contract for that commodity. For example, an October feeder cattle option is an option to obtain an October feeder cattle futures contract. In this sense, options are the right to buy or sell a futures contract and not the physical commodity. A more extensive explanation of futures contracts is available in UGA Extension Bulletin 1404, Using Futures Markets to Manage Price Risk in Feeder Cattle Operations. Because options have futures contracts as their underlying commodity, each option contract represents the same quantity as the underlying futures contract. That is, most grain options represent 5,000 bushels, while the live cattle option represents 40,000 pounds of fed cattle. The feeder cattle option represents 50,000 pounds of feeder cattle. Options are traded for each of the futures contract months in each of these commodities. A table showing the option contract specifications for feeder cattle and live cattle is shown at the end of this bulletin (Table 1). Expiration Futures contracts have a definite predetermined maturity date during the delivery month. Likewise, options have a date at which they mature and expire. The specific date of expiration for the feeder cattle option contract is the same as its underlying futures contract the last Thursday of each month, with the exception of November and any month when a holiday falls on the last Thursday or any of the four weekdays prior to that Thursday. Because fed cattle futures contracts can be settled by physically delivering the cattle, the fed cattle option contract expires the first Friday of the futures contract month, prior to the futures contract expiration around the 20th of the month. For example, a $175/cwt. October fed cattle put option is an opportunity to sell one October live cattle futures contract at $175/cwt. The holder can execute this option on any business day until the first Friday in October. Option Premiums The option writer is willing to incur an obligation in return for some compensation. The compensation is called the option premium. Using the insurance analogy, a premium is paid on an insurance policy to gain the coverage it provides. Similarly, an option premium is paid to gain the rights granted in the option. The option premium is determined either by public outcry and acceptance in an exchange trading pit or electronically through a virtual trading pit. Like all commodity prices, option premiums can be expected to change not only daily but often by the minute. While the interaction of supply and demand for options will ultimately determine the option premium, two major factors will interact to affect the level of premiums. The first factor is the difference between the strike price of the option and the futures price of the underlying commodity. This differential in prices may give the option intrinsic or exercise value. For example, consider an October feeder cattle put option with a strike price of $175/ cwt. and the underlying October feeder cattle futures with a current price of $172/cwt. The option could be Commodity Options as Price Insurance for Cattlemen 2 UGA Extension Bulletin 1405
40 sold for at least $3/cwt. since anyone would be willing to purchase the right to sell at $175 when the market is currently $172. This $3 is said to be the intrinsic value. As long as the market price on the option s underlying futures contract is below the strike price on a put option, the option has intrinsic value. The converse of the price relationship is true for a call option. A call option has intrinsic value when the futures market price is above the strike price. Any option that has intrinsic value is said to be inthe-money. An in-the-money option has value to others because the futures market price is below the put or above the call strike price. An option is said to be out-of-the-money and has no intrinsic value if the current futures market price is above the put or below the call strike price. When the futures market price of the commodity and the strike price are equal, the option is said to be at-the-money, and has no intrinsic value. A second factor influencing the option premium is the length of time to expiration of the option. Assuming all else is held constant, option premiums usually decline in value as the time to expiration decreases. This phenomenon reflects the time value of an option. For example, in August the time premium on a $175 September feeder cattle option will be less than the premium on a $175 November option. The option with a longer time to expiration has a greater probability of moving in-the-money than the option with less time. Therefore, it is worth more on that factor alone. The longer the time period, the greater the chance that events will occur that could cause substantial movement in futures prices and change the value of the option. As a result, the option writer requires a greater premium to assume the risk of writing a longer-term option. Out-of-the-money options have a value that reflects time value. In-the-money options possess both time value and intrinsic value. The total cost of a premium minus the intrinsic value yields the time value of an option (Time Value = Premium Intrinsic Value). Offsetting an Option The method by which most holders of in-the-money options realize accrued profit is by resale of the option. This is referred to as offsetting an option position and completing a round turn (the buy and sell or the sell and buy of an option). Options can be offset anytime between their purchase and expiration date if the holder so desires. Most option buyers will offset their position rather than exercise the option to avoid losing any remaining time premium and (or) assuming a futures market position and its resultant decisions, margin deposits and commissions. In most situations, the option can be resold to another trader at a premium at least equivalent to the intrinsic value that results from an in-the-money price relationship. Another method by which the holder of an option could realize accrued profits is by exercising the option. Options are only exercised at the direction of the owner or if there is intrinsic value at expiration. The opportunity to exercise the option means the option buyer can always get the intrinsic value of the option premium even if there is little or no trading in the option being held. It also provides for a means of continuing price protection after the option expires. If the decision is made to exercise, the following procedures are followed. For a put, the holder is assigned a short (sell) position in the futures market equal to the strike price. At the same time, the option writer is obligated to take a long (buy) futures position at the same price. Both positions are then adjusted to reflect the current settlement price. It is rational to exercise a put option only when the futures market price is below the strike price, so the holder s futures position will show a profit. The futures position of the writer will show an equivalent loss. At this point the option contract has been fulfilled and both parties are free to trade their futures contracts as they see fit. Evaluating and Using Options Markets Now that the mechanics of options trading have been explored, it is time to consider two critical questions: 1) What do varying strike prices mean in terms of price insurance? and 2) How does a producer actually obtain this insurance? There are three steps to consider in evaluating option prices. 1. Select the appropriate option contract month. To do this, select the option whose underlying futures will expire closest to, but not before, the time the physical commodity will be sold or purchased. Commodity Options as Price Insurance for Cattlemen 3 UGA Extension Bulletin 1405
41 For example, if a group of feeder calves were to be sold in early October, the October option would be appropriate. 2. Select the appropriate type of option. To insure products for sale at a later time against price declines, the producer would be interested in buying a put (the right to sell). If the producer s motive is to insure future commodity purchases against cost increases (for instance, corn needed to feed cattle), then purchasing a call would be an appropriate strategy. To continue the example: If the cattleman wishes to insure the feeders he will be selling in early October, then he will be interested in purchasing an October put option. 3. Calculate the minimum cash selling price being offered by the put option selected. For a call option, the maximum purchase price would need to be calculated. These calculations can be accomplished in five steps: 1. Select a strike price within the option month. For instance, a $175/cwt. October feeder cattle put. 2. Subtract the premium from the strike price for a put or add the premium for a call. For example, if a $175 October put costs $2.75/cwt., the result is $175 - $2.75 = $172.25/cwt. 3. Subtract (for a put) or add (for a call) the opportunity cost of paying the premium for the period it will be outstanding. For example, if the option premium of $2.75/cwt. is paid in June and the option is expected to be liquidated by an offsetting resale in early October, an interest cost for the three-month period needs to be added. If borrowed funds are used and the interest rate is 9 percent, then the interest (opportunity) cost would be.75 percent per month, or 2.25 percent for three months. The interest cost associated with a $2.75/cwt. put option premium would be $0.06/cwt. This leaves a net price of $ $0.06 = $172.19/cwt. 4. Subtract (for a put) or add (for a call) the commission fee for both buying and offsetting the option. Assume the brokerage firm charges $75 per round turn for handling each option contract. The commission fee would be $0.15/cwt. ($75 Basis estimation is a critical component in estimating the expected net purchase or sale price. Interested readers should also consult UGA Extension Bulletin 1406, Understanding and Using Cattle Basis in Managing Price Risk to help them better understand the various factors that can affect basis. for 50,000 lbs., $75/500 cwt.). The net price is now $ $0.15 = $172.04/ cwt. 5. One final adjustment must be made to these prices. The option strike price must be localized to reflect the difference between prices in the local markets where the cattle will be sold or grains purchased, and the futures market price. This difference is called basis (Basis = Local Cash Price Futures Price). The basis differs for cattle at different weights, sex, location and time of year across the country. See UGA Extension Bulletin 1406, Understanding and Using Cattle Basis in Managing Price Risk for some of the factors that affect cattle basis. Many state Extension offices have historical basis estimates for cattle and inputs that may be helpful in determining the appropriate basis. By adjusting the option price for basis, a minimum selling price can be obtained for a put or a maximum purchase price obtained for a call. For the example, if in early October, 600 lb. feeder steers normally bring $10/cwt. less than the feeder cattle futures market, then the likely minimum local cash price becomes $ $10 = $162.04/cwt. In the end, the only thing that will change this price is the fluctuation in the basis. More or less price insurance can be purchased by buying options with different strike prices. To determine the minimum selling price suggested by each strike price, repeat steps one through five for the various strike prices and their associated premiums. Options Arithmetic: Two Examples Once the relevant options prices have been evaluated, the next question is, how would the producer go about obtaining a certain level of price insurance? Two examples, one using a put to establish a price floor (an expected minimum selling price) and one using a call to establish a price ceiling (an expected maximum purchase price), will help illustrate the total process. Commodity Options as Price Insurance for Cattlemen 4 UGA Extension Bulletin 1405
42 Figure 1. Put Option Example. Feeder cattle pricing example where the option expires as worthless. Put Option Example In the following put option example (Figures 1 and 2), we discuss a cattleman who will be selling a load of feeder cattle in early October. In our example, he checks the options quotes in June and finds he could purchase an October feeder cattle put option to sell at $175/cwt. at a premium of $2.75/cwt. To further localize this strike price, he subtracts $10/cwt. basis since he normally sells 600 lb. steer calves for a somewhat lower local cash price in October than the October futures price. Commission ($75 per contract) and interest on the premium cost will be about $0.25/cwt., so the $175 put would provide an expected minimum selling price of $175 - $10 - $ $0.25, or $162/cwt. By comparing this with his other pricing alternatives and his production cost, he decides that purchasing this put would be an appropriate strategy for the 83 steers he plans to sell in October. He advises his broker that he wants to purchase one $175 October feeder cattle put at $2.75. He then forwards a check for $1,450 (500 cwt. X $2.75/cwt. plus $75 brokerage fee) to his broker. As October approaches, one of three things will happen: prices will stay relatively unchanged, rise above the option strike price (thus making the option worthless) or fall below the strike price (thus making the producer s option valuable). Remember that for a put option, if the current futures price is above the strike price, the option is said to be out-of-the-money. If futures are below the strike price, it is in-the-money. First, assume the futures market prices in early October are $185/cwt. -- well above the put option strike price of $175/cwt. This makes the producer s option out-of-the-money. Since no one is willing to pay for an option to sell at $175/cwt. when they could sell currently for $185/cwt., the option expires as worthless (Figure 1). In this case, the cattleman sells the load of feeders and does not use the option. The net price would be the cash price received less the net premium cost originally paid. Assuming the basis did not change (-$10/cwt.) and the cattle brought $175/cwt., the actual net received would be $172/cwt. ($185 - $10 basis - $2.75 premium - $0.25 commission and interest). In this case, the insurance policy was not needed. Had this been known in advance, the cattleman could have saved the premium. However, just as fire or other disasters can t be predicted, price movements can t be predicted with accuracy either. For this reason, the cattleman was willing to substitute the known loss (premium) for the possibility of a larger unknown loss. Commodity Options as Price Insurance for Cattlemen 5 UGA Extension Bulletin 1405
43 Figure 2. Put Option Example. Feeder Cattle Pricing Example where market declines and option is sold. on the option market to get the net price of $162/ cwt. Thus, the option was successful in assuring the minimum price when he bought it in June. What happens if the cattleman does need to collect on his option position? The mechanics of this instance are shown in Figure 2. Assume the futures market price at the first of October is $170/cwt. In this case, the option to sell does have value, because others are willing to purchase the right to sell at $175 when they are currently only able to sell at $170/cwt. Remember, this means the option is in-the-money. One way to collect on an options policy (offset) is very much like collecting on insurance. Since the value of the loss is $5/cwt., the cattleman should be able to sell the option back for at least this amount. He calls his broker and tells him to sell the October put at $5 or better. The sale of a previously bought put cancels the option, and the broker sends a check for $5 per cwt. X 500 cwt. or $2,500. Since he paid a premium of $2.75/cwt. plus the $0.25/ cwt. option trading cost, he really netted $2/cwt. on the option trade. The producer sells his calves for $160/ cwt. on the cash market and adds the $2/cwt. gained In this case, the producer collected on his option (policy). Just as with insurance, he collects to the extent of his loss. In options terminology, we are talking about the strike price (the face amount of the policy) less the current futures price of feeder cattle. A second way in which the insurance could have been recovered would be to exercise the option, converting it into a sell (short) position in the futures market. If the futures position were then immediately closed out with a purchased October futures (long), the $5/cwt. difference would be realized ($175 - $170 current futures) with only an additional commission for the futures purchase. Since fed cattle options expire before the underlying futures, this may be the route to completing the options insurance if the cattle were not sold until after the option had expired. With feeder cattle, however, this is not a problem, because the futures and options expire together. Figure 3 summarizes the resulting net price from purchasing an October put for $2.75/cwt. with $0.25/ cwt. trading cost under several futures market prices in October and a realized -$10/cwt. basis. It also makes clear why put option purchases are sometimes referred to as floor pricing. In reality, the producer will only be able to estimate what his basis will be when he sells the cattle. If the actual basis is better (stronger) than anticipated, then the Commodity Options as Price Insurance for Cattlemen 6 UGA Extension Bulletin 1405


44 Figure 3. realized net price from the options will be higher. If the actual basis is worse (weaker) than anticipated, then the realized net price from the options will be lower. In either case, the actual net price will vary by the difference in forecast and actual basis. Buying More or Less Insurance Figure 4 shows the net futures floor prices achieved at various strike prices. Basis would still need to be subtracted to arrive at an estimated cash price. Figure 4. Net futures prices for put option at various strike levels. Nov FC contract. Prices quoted in June. The crosshatched area indicates the amount of the premium paid. For instance, a $180 put could have been purchased for $6.70/cwt. This would have provided a higher floor price but at an unreasonable expense. Alternatively, a $170 put could be purchased for $3/ cwt., providing a net futures price of $169. Finally, a $166 put would have cost only $1.30/cwt. but provided a futures floor of only $164.70/cwt. Again, readers are reminded that these prices are calculated before any basis adjustment. So, if the basis is -$10/cwt., as has been used throughout this publication, then net cash prices will range from $ to $175.90/cwt. This graphic illustrates the impacts of strike prices and premiums on net futures prices. Selecting the right strike price involves knowing not only what level of protection is afforded, but also how much the protection costs. Call Option Example As mentioned previously, call options can be used to establish an expected maximum purchase price. Call options may be useful for stocker operators or feedlots to set a maximum purchase price of incoming cattle. Likewise, livestock producers can use corn or soybean meal options to set a maximum purchase price for feed ingredients. Similar to a put option establishing a price floor, call options establish a price ceiling. Call options give the holder the right but not the obligation to BUY a futures contract at a given price. The same terms (strike price, premium, etc.) apply for call options as they do with put options except the objective is to set a maximum purchase price for feeder cattle, live cattle or feed ingredients as opposed to a minimum price. As a result, premiums and other transaction costs are added to the strike price in calculating the net price paid, where with put options they were subtracted. In either instance, the result is the same. The holder experiences a small but known loss in exchange for mitigating the risk of upward price movements in the market. To illustrate a call option, consider the feeder cattle example presented for the put option (Figure 5) except that a feeder cattle buyer wants to set a maximum purchase price of $168/cwt. In this instance, prices increased enough to make the call option in-the-money. As result, the owner offset the option for the intrinsic value and reduced his net purchase price to $168/cwt. Commodity Options as Price Insurance for Cattlemen 7 UGA Extension Bulletin 1405
45 If the futures market had gone down to, say, $165/ cwt., the cattleman would have purchased the cattle for $155/cwt. ($165 - $10 basis) and let his call expire as worthless. Because his total purchase price (premium + commission + interest) was $3/cwt., his net purchase price would have been $158/ cwt. Figure 5. Call Option Example. Feeder Cattle Price Increase Example. Summary Purchasing options for price insurance is a way cattlemen can use the futures markets as a pricing alternative. This alternative should be carefully compared to all other pricing alternatives in light of the producer s objectives and risk-bearing ability. Options purchased for price insurance provide a hybrid market with characteristics of both doing nothing (cash market pricing) and hedging or forward-contracting. That is, the producer who purchases an option for price insurance has some of the same price protection offered through a hedge or forward contract. On the other hand, options are not as protective against unfavorable price movements as hedging or forward contracting or as attractive as the open cash market if prices become more favorable. In fact, option purchases will always be, at best, second to either of the other two pricing alternatives when evaluated after the fact. However, cattlemen do not have the luxury of making pricing decision after the fact. Because of this, many cattlemen may find a place in their pricing plans for the kind of hybrid vigor offered through the option market. Bulletin 1405 June 2014 The University of Georgia, Fort Valley State University, the U.S. Department of Agriculture and counties of the state cooperating. UGA Extension offers educational programs, assistance and materials to all people without regard to race, color, national origin, age, gender or disability. The University of Georgia is committed to principles of equal opportunity and affirmative action. Table 1. Comparison of Options Specifications Item Feeder Cattle Live Cattle Underlying Contract Size 50,000 pounds 40,000 pounds Delivery Cash settled Physically delivered Months traded Last day of trading 1 Jan, Mar, Apr, May, Aug, Sep, Oct and Nov Last Thursday of the contract month with exceptions for November and other months when a holiday falls on the last Thursday or any of the four weekdays prior to that Thursday, 12:00 p.m. See CME Rule 102A01.I. Feb, Apr, Jun, Aug, Oct, Dec First Friday of the contract month, 1:00 p.m. See CME Rule 101A01.I. 1 Source CME website accessed May 27,
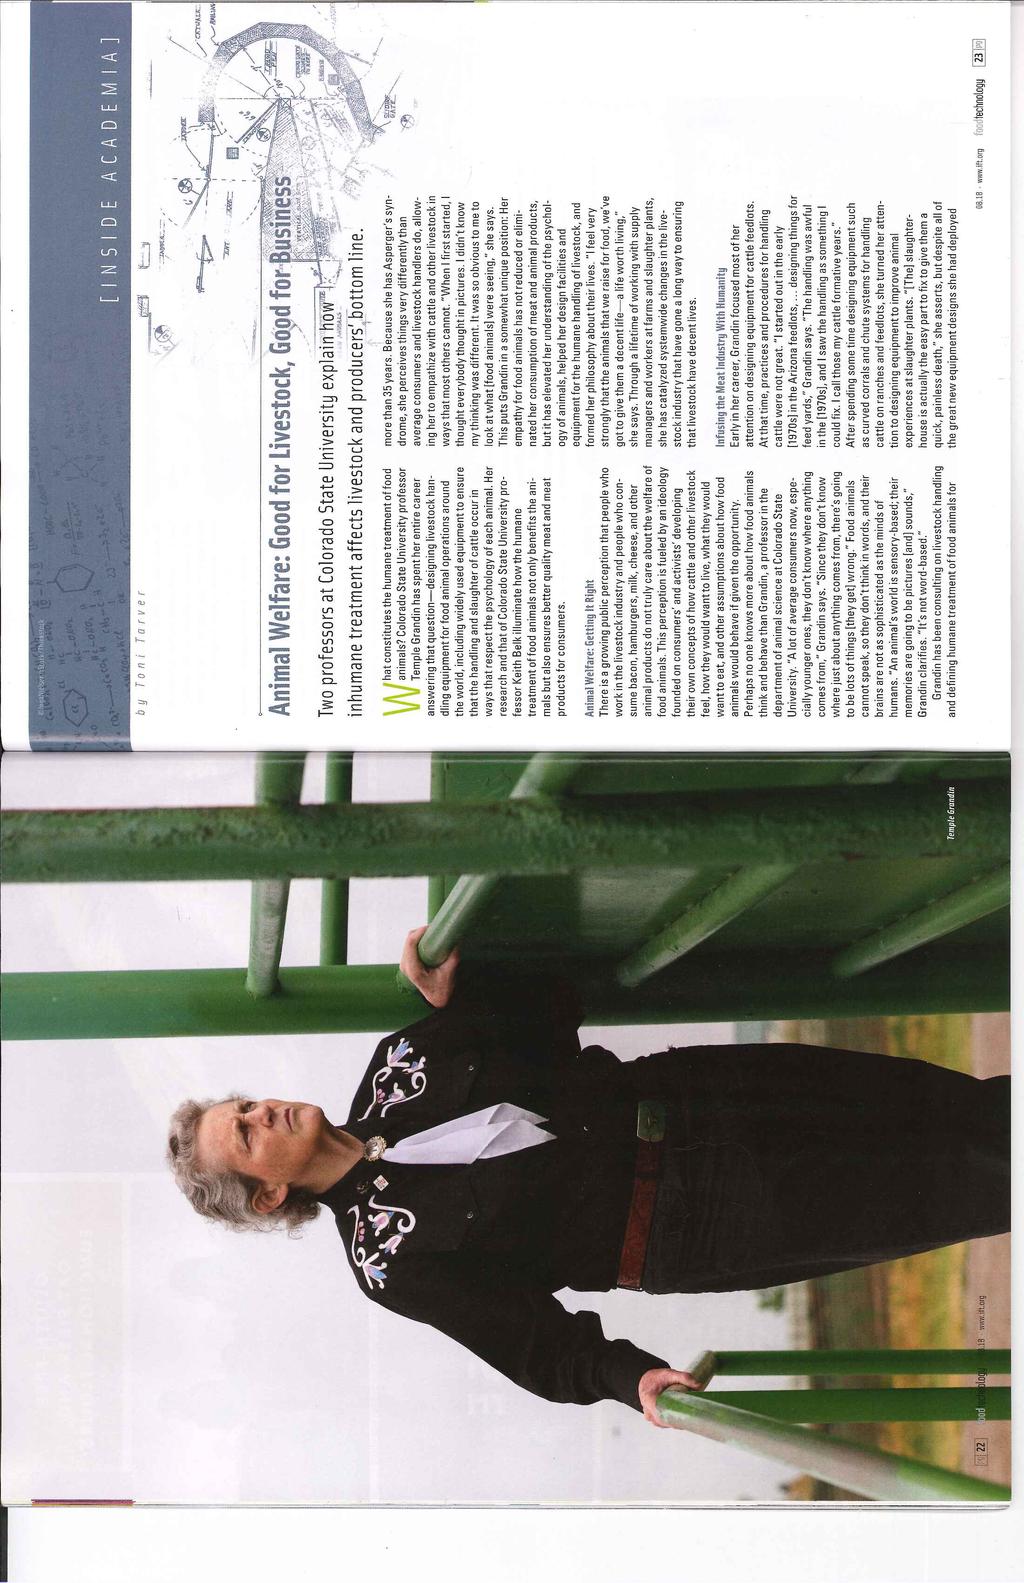
46
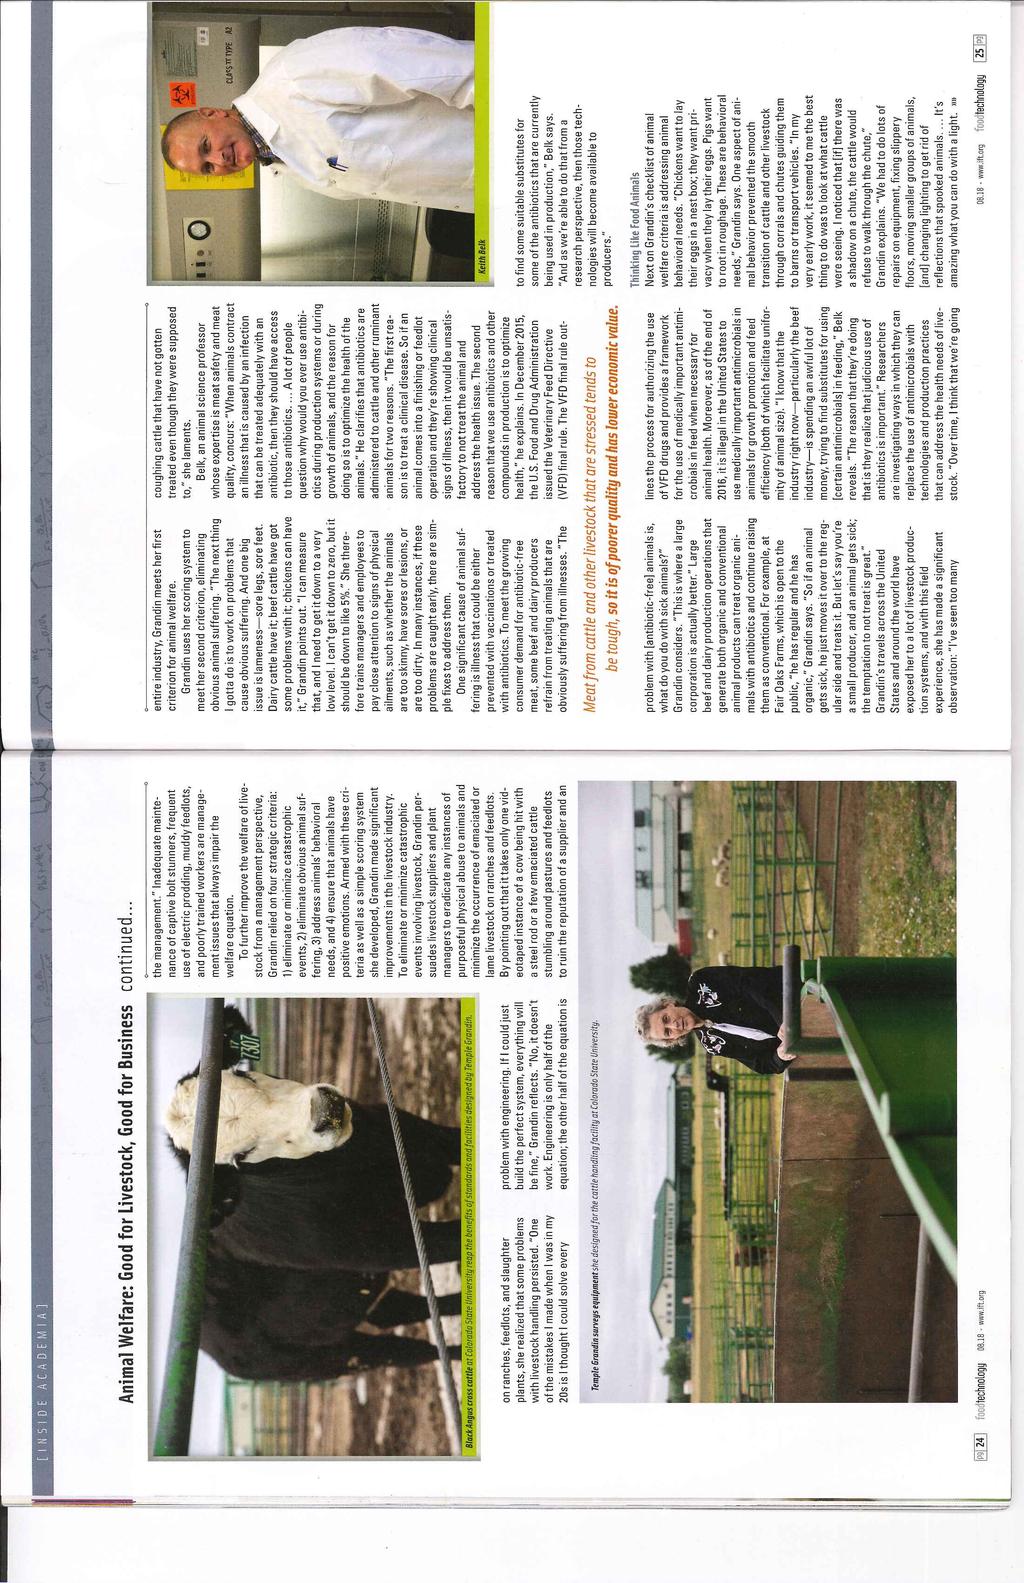
47
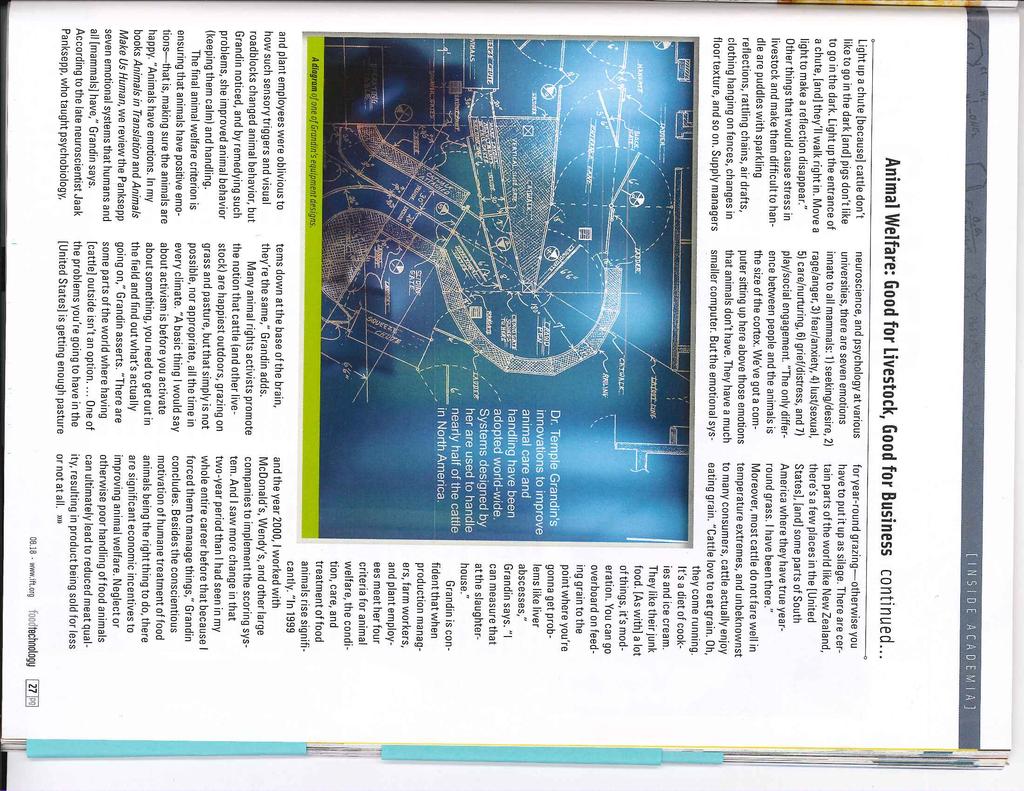
48
49
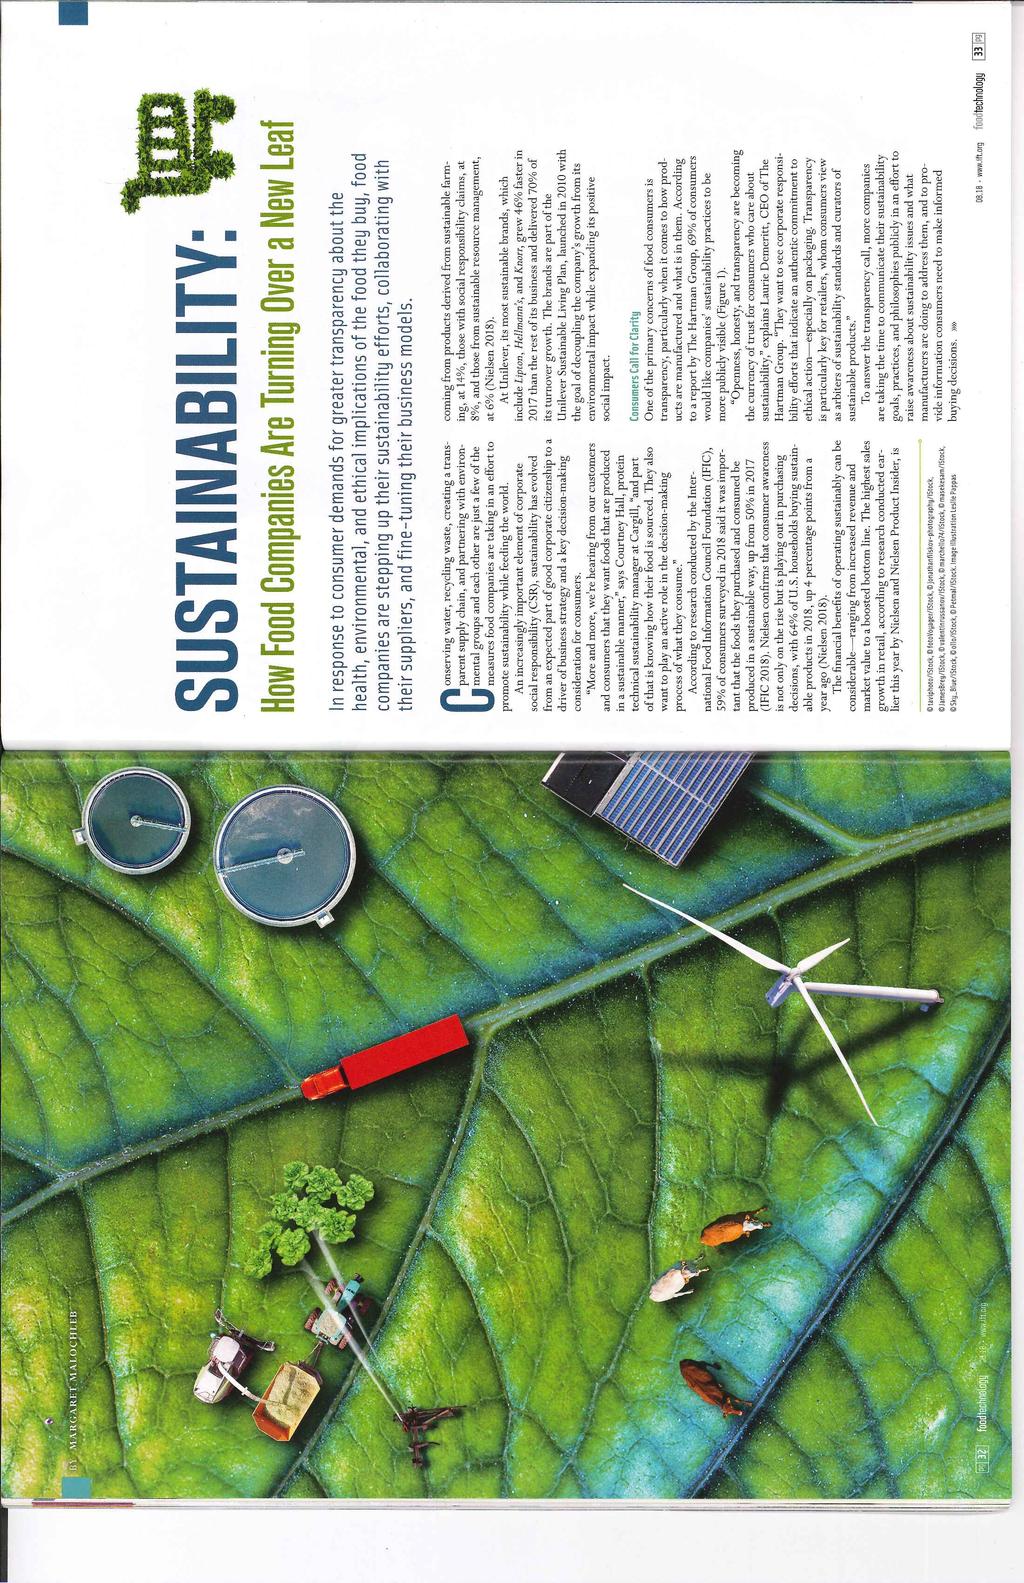
50
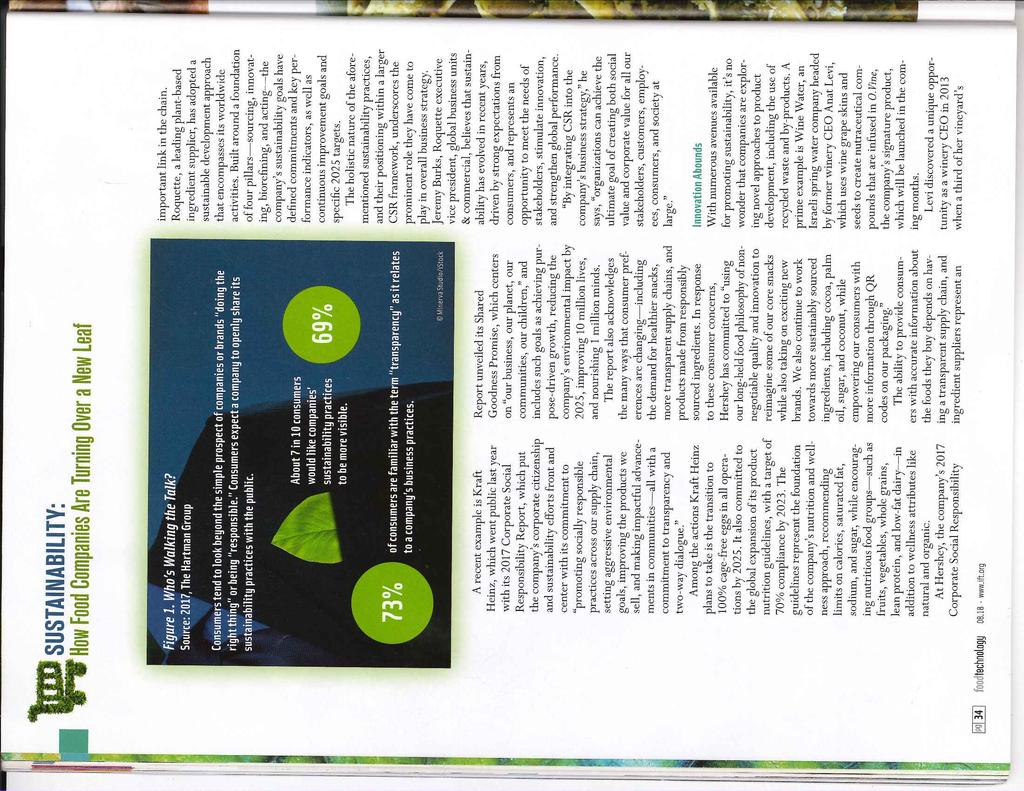
51
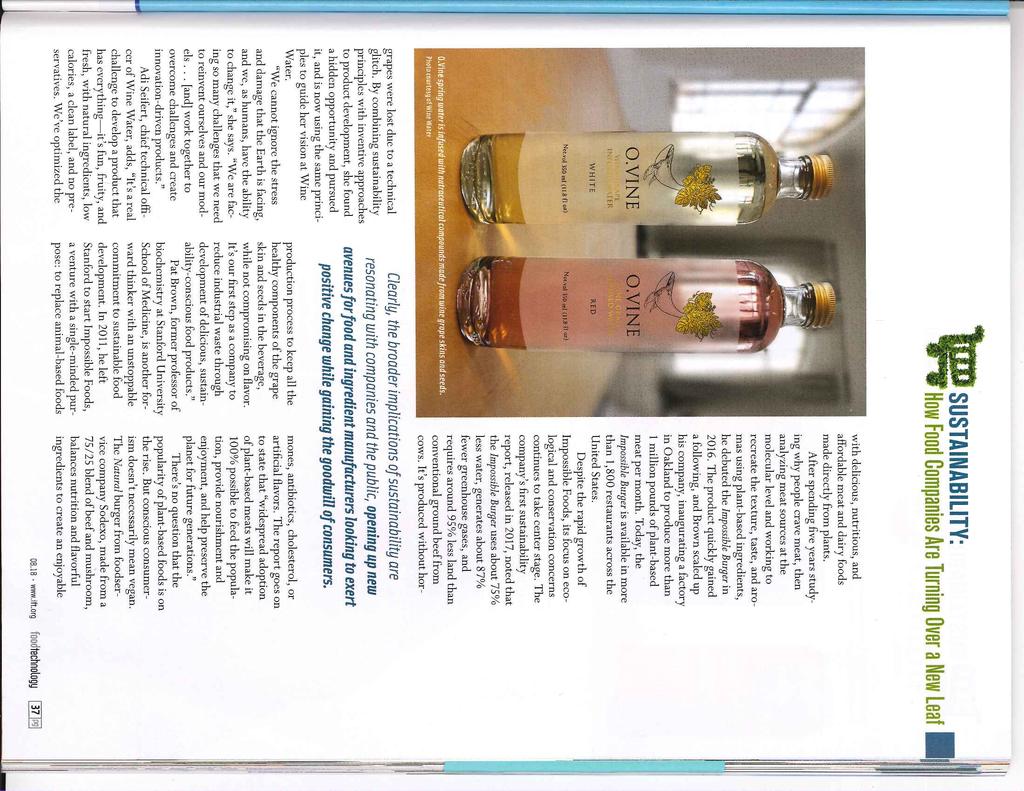
52
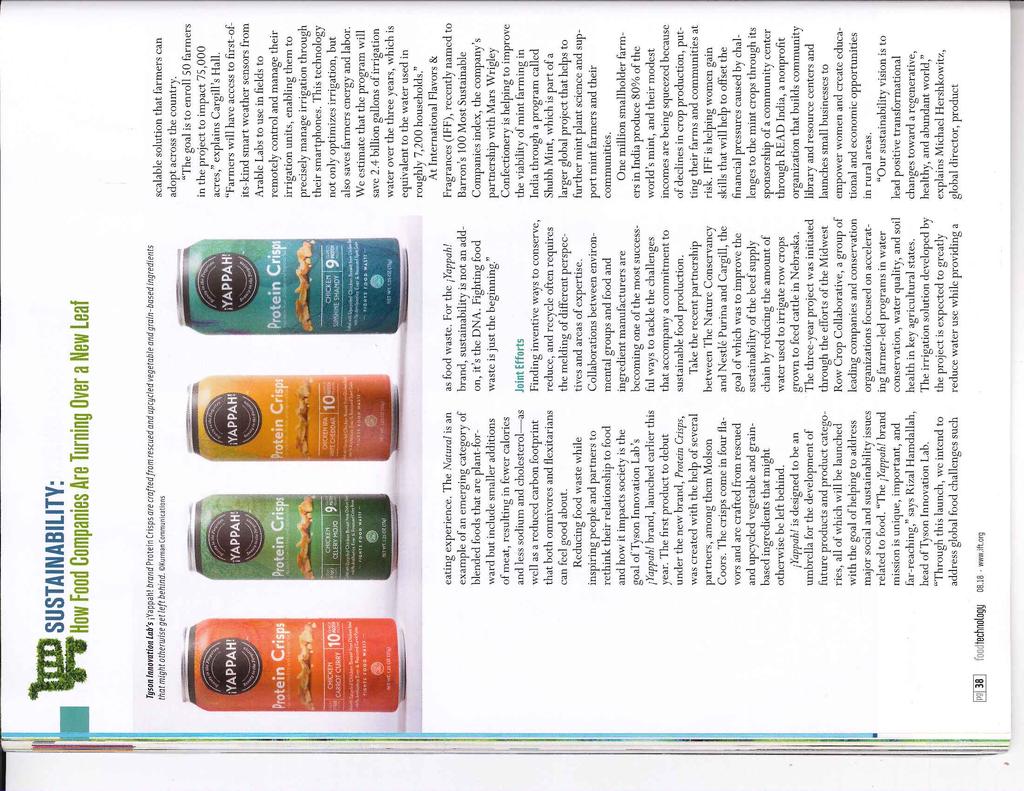
53

54
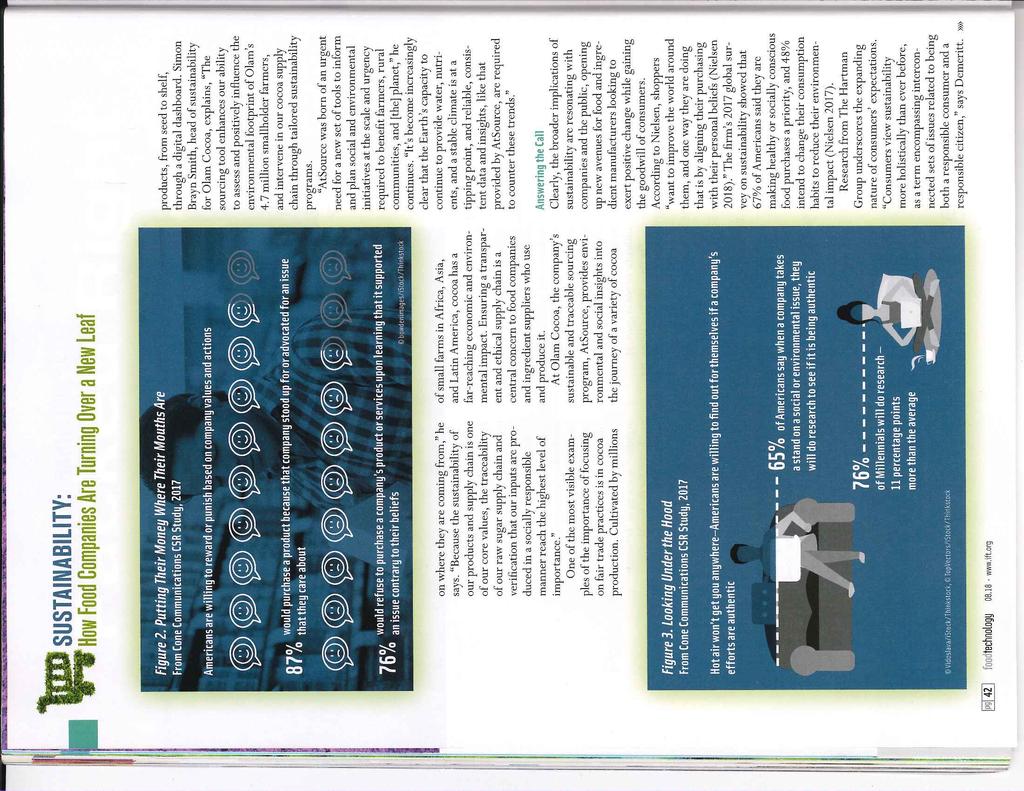
55
56
Cross Hedging Agricultural Commodities
 Cross Hedging Agricultural Commodities Kansas State University Agricultural Experiment Station and Cooperative Extension Service Manhattan, Kansas 1 Cross Hedging Agricultural Commodities Jennifer Graff
Definitions of Marketing Terms
 E-472 RM2-32.0 11-08 Risk Management Definitions of Marketing Terms Dean McCorkle and Kevin Dhuyvetter* Cash Market Cash marketing basis the difference between a cash price and a futures price of a particular
Livestock Risk Protection
 E-335 03-05 Livestock Risk Protection William Thompson, Blake Bennett and DeDe Jones* Livestock Risk Protection (LRP) is a single-peril price risk insurance program offered by the Risk Management Agency
Hedging and Basis Considerations For Feeder Cattle Livestock Risk Protection Insurance
 EXTENSION EC835 (Revised February 2005) Hedging and Basis Considerations For Feeder Cattle Livestock Risk Protection Insurance Darrell R. Mark Extension Agricultural Economist, Livestock Marketing Department
Risk Management for Stocker Cattle. R. Curt Lacy, Ph.D. Extension Economist-Livestock University of Georgia
 Risk Management for Stocker Cattle R. Curt Lacy, Ph.D. Extension Economist-Livestock University of Georgia Risk Management for Stocker Cattle It is NOT uncertainty! It is the negative outcome associated
Beef Cow/Calf, Projected Budget for Calves Sold in 2015, South Missouri
 Beef Cow/Calf, Projected Budget for Calves Sold in 2015, South Missouri Fall 14 Spring 15 Calving Calving Calf crop, % weaned 88% 85% Steer calf sales: 580 lbs. @ $250/cwt. x 85% x 1/2 -- $ 616.25 580
Answer each of the following questions by circling True or False (2 points each).
.") Name: Econ 337 Agricultural Marketing, Spring 2019 Exam I; March 28, 2019 Answer each of the following questions by circling True or False (2 points each). 1. True False Some risk transfer premium is appropriate
Name: Econ 337 Agricultural Marketing, Spring 2019 Exam I; March 28, 2019 Answer each of the following questions by circling True or False (2 points each). 1. True False Some risk transfer premium is appropriate
Department of Agricultural and Resource Economics
 D 34 Department of Agricultural and Resource Economics BASIS ESTIMATES FOR FEEDER CATTLE AND FED CATTLE February 2018 Andrew P. Griffith, Assistant Professor Becky Bowling, UT Extension Specialist Table
Participant Handbook Risk Management Program. RMP for livestock Cattle Hogs Sheep Veal
 Participant Handbook Risk Management Program RMP for livestock Cattle Hogs Sheep Veal Risk Management Program (RMP) for livestock includes the following four plans: RMP: Cattle RMP: Hogs RMP: Sheep RMP:
Basis Data for Forward Pricing Live Beef Cattle in Oregon-Washington
 05.5?1 F' 2- Basis Data for Forward Pricing Live Beef Cattle in Oregon-Washington,,,(>6 - ato c'-1.w(,.. nitt ::_o, s'f p1- a--:' )1t-1,7,ZSP.S I'l (; OC::: r, r% Ne 't17,7i:. n :... :', I. Special Report
Enterprise Budgets. How is it constructed?
 Enterprise Budgets An enterprise budget is an estimate of projected income and expenses associated with the production of a commodity. Most agricultural operations are made up of a combination of several
ECON 337 Agricultural Marketing. Spring Exam I. Due April 16, Start of Lab (or before)
") Name: KEY ECON 337 Agricultural Marketing Spring 2013 Exam I Due April 16, 2013 @ Start of Lab (or before) Answer each of the following questions by circling True or False (2 points each). 1. True False
Name: KEY ECON 337 Agricultural Marketing Spring 2013 Exam I Due April 16, 2013 @ Start of Lab (or before) Answer each of the following questions by circling True or False (2 points each). 1. True False
SUMMARY: DEVELOPMENT: PURCHASE OF THE CALVES (1)
") PROJECT LIVESTOCK - CATTLE & BREEDS - PORTUGAL-SPAIN LIMOUSIN / ANGUS / CHAROLAIS / BELGIAN BLUE / SIMMENTAL / BLONDA ALL CROSSED AND EXCELLENT QUALITY SUMMARY: 1- PURCHASE IN ORIGIN OF THE CALVES (3000
PROJECT LIVESTOCK - CATTLE & BREEDS - PORTUGAL-SPAIN LIMOUSIN / ANGUS / CHAROLAIS / BELGIAN BLUE / SIMMENTAL / BLONDA ALL CROSSED AND EXCELLENT QUALITY SUMMARY: 1- PURCHASE IN ORIGIN OF THE CALVES (3000
Cow-Calf Herd Budget Decision Aid User s Manual
 Cow-Calf Herd Budget Decision Aid User s Manual The purpose of this decision aid is to facilitate the organization production and economic date to budget of the cow-calf enterprise and beef cow herd. This
GOAT FARM BUDGETING. Roger Sahs. Extension Assistant. Agricultural Economics Oklahoma State University Stillwater, OK
 GOAT FARM BUDGETING Roger Sahs Extension Assistant Agricultural Economics Oklahoma State University Stillwater, OK 74078 Introduction Management is the most important factor in the success of any farm
Livestock Risk Protection Insurance (LRP): How It Works for Feeder Cattle
: How It Works for Feeder Cattle") Livestock Risk Protection Insurance (LRP): How It Works for Feeder Cattle W 312 Andrew P. Griffith Assistant Professor and Extension Economist Livestock Department of Agricultural and Resource Economics
Livestock Risk Protection Insurance (LRP): How It Works for Feeder Cattle W 312 Andrew P. Griffith Assistant Professor and Extension Economist Livestock Department of Agricultural and Resource Economics
Hedging Cull Sows Using the Lean Hog Futures Market Annual income
 MF-2338 Livestock Economics DEPARTMENT OF AGRICULTURAL ECONOMICS Hedging Cull Sows Using the Lean Hog Futures Market Annual income from cull sows represents a relatively small percentage (3 to 5 percent)
Grassfed Beef Ranch QuickBooks Setup Accounts
 Grassfed Beef Ranch QuickBooks Setup Accounts The business accounting system first must provide the data for compliance reporting following the expense accounts in the Internal Revenue (IRS) Tax Profit
Agriculture & Natural Resources
 AG ECONOMIC SERIES TIMELY INFORMATION Agriculture & Natural Resources AGRICULTURAL ECONOMICS AND RURAL SOCIOLOGY, AUBURN UNIVERSITY, AL 36849-5639 DAERS 04-2 May 2004 Using The Futures Market Price To
HOUSTON LIVESTOCK SHOW and RODEO TM
 2016 Record Book Instructions and Guidelines This contest is subject to the Houston Livestock Show and Rodeo General Rules and Regulations, the Junior Show Rules and Regulations and the Special Rules for
STANDARDIZED PERFORMANCE ANALYSIS
 STANDARDIZED PERFORMANCE ANALYSIS SPA-6 COW-CALF ENTERPRISE FINANCIAL PERFORMANCE MEASURES WORKSHEET (SPA-FCC) * 6-16-06 SPA is a standardized cow-calf enterprise production and financial performance analysis
Live Cattle Delivery Manual Relating to Chapter 101
 AGRICULTURE Live Cattle Delivery Manual Relating to Chapter 101 Table of Contents I. Submission Requirements...1 II. Live Delivery Requirements...2 A. Duties of the short...2 B. Duties of the long...3
HEDGING WITH FUTURES. Understanding Price Risk
 HEDGING WITH FUTURES Think about a sport you enjoy playing. In many sports, such as football, volleyball, or basketball, there are two general components to the game: offense and defense. What would happen
In this section of our overall farm management educational series we focus on evaluating farm financial performance, or figuring out how we are doing
 In this section of our overall farm management educational series we focus on evaluating farm financial performance, or figuring out how we are doing financially. This is important because often indicators
TIMELY INFORMATION Agriculture & Natural Resources
 AG ECONOMIC SERIES TIMELY INFORMATION Agriculture & Natural Resources Agricultural Economics and Rural Sociology, Auburn University, Al 36849-5639 DAERS 06-3 July 2006 Predicting The Of Feeder Cattle Walt
Beef Industry Risk Management: Alternatives and Resources for Producers
 Beef Industry Risk Management: Alternatives and Resources for Producers Glynn Tonsor Dept. of Agricultural, Food, and Resource Economics Michigan State University 2009 Michigan Cattlemen s Association
Dairy Proforma Calculator (DPC) Instructions Gary G. Frank, Center for Dairy Profitability, UW-Madison August 1, 1998
 Instructions Gary G. Frank, Center for Dairy Profitability, UW-Madison August 1, 1998") Dairy Proforma Calculator (DPC) Instructions Gary G. Frank, Center for Dairy Profitability, UW-Madison August 1, 1998 When loading DPC and this message appears, click the No button. Worksheet Appearance
Dairy Proforma Calculator (DPC) Instructions Gary G. Frank, Center for Dairy Profitability, UW-Madison August 1, 1998 When loading DPC and this message appears, click the No button. Worksheet Appearance
Contract Hog Production: Contract hog production
 1 MF-1070 Hog enterprise management Contract Hog Production: Contract hog production involves an agreement between a contractor and a grower. The contractor owns and provides feeder pigs for feeder pig
Ranch Accounting and Analysis
 Ranch Accounting and Analysis May 16, 2017 Ranch 101 - Ranch Accounting Texas & Southwestern Cattle Raisers Association Ft. Worth, Texas Stan Bevers Retired Professor & Ext. Economist www.ranchkpi.com
Table of Contents. Introduction
 Table of Contents Option Terminology 2 The Concept of Options 4 How Do I Incorporate Options into My Marketing Plan? 7 Establishing a Minimum Sale Price for Your Livestock Buying Put Options 11 Establishing
USING RISK MANAGEMENT TOOLS: A LIVESTOCK APPLICATION
 USING RISK MANAGEMENT TOOLS: A LIVESTOCK APPLICATION John Michael Riley AssistantExtension Professor Assistant Extension Professor Department of Agricultural Economics 1 Price Risk: Introduction Commodity
Andrew P. Griffith Assistant Professor Livestock Extension Economist
 Andrew P. Griffith Assistant Professor Livestock Extension Economist Is it a disease outbreak? (BRD, Trich., etc.) Is it when the neighbors bull visits? Is it when a land lease is lost? Is it the loss
Balance Sheets- step one for your 2016 farm analysis
 1 of 12 Name Address Phone Email Balance Sheets- step one for your 2016 farm analysis The farm s balance sheet is a snapshot, on one day in time, of what the farm business owns, (its assets), and what
Ranch Accounting and Analysis
 Ranch Accounting and Analysis November 15, 2016 TSCRA Ft. Worth, Texas Stan Bevers Retired Professor & Ext. Economist Ranch KPI Vernon, TX The Role of the Accounting System Income Tax Preparation Comply
In the previous session we learned about the various categories of Risk in agriculture. Of course the whole point of talking about risk in this
 In the previous session we learned about the various categories of Risk in agriculture. Of course the whole point of talking about risk in this educational series is so that we can talk about managing
in North Dakota GARY M. BEDKER EDDIE DUNN TIMOTHY A. PETRY
 jricultural Economics Report No. 112 March 1976 THE FEASIBILITY OF A Cooperatively Owned Large-Scale Hog Farrowing System in North Dakota GARY M. BEDKER EDDIE DUNN TIMOTHY A. PETRY Department of Agricultural
Replacement Heifers: Raise em, Buy em, or Just Sale em
 Replacement Heifers: Raise em, Buy em, or Just Sale em Stan Bevers, AFM Professor & Ext. Economist Texas A&M AgriLife Extension Service Vernon, Texas Reproductive Management Section Texas A&M Extension
Beef Industry Outlook
 Glynn T. Tonsor Dept. of Agricultural Economics, Kansas State University Email: gtonsor@ksu.edu Twitter: @TonsorGlynn Industry Outlook Conf. April 25, 2018 Chicago, IL Beef Industry Outlook This presentation
The Role of Market Prices by
 The Role of Market Prices by Rollo L. Ehrich University of Wyoming The primary function of both cash and futures prices is the coordination of economic activity. Prices are the signals that guide business
USING THE SPREADSHEET VERSION OF THE NCSU BEEF BUDGETS
 USING THE SPREADSHEET VERSION OF THE NCSU BEEF BUDGETS Sections Introduction Costs and Returns Modifying the Budgets Resources Introduction There are six beef enterprise budgets: Cow-calf Beef Wintering
November 28, Alberta Environment and Sustainable Resource Development Grazing Lease Rental Rate Model
 November 28, 2014 Alberta Environment and Sustainable Resource Development Grazing Lease Rental Rate Model CONTENTS Overview... 1 Model Development... 2 Net Revenues... 2 Operating Costs... 3 Rent Calculation...
2008 STATE FFA FARM BUSINESS MANAGEMENT CONTEST
 2008 STATE FFA FARM BUSINESS MANAGEMENT CONTEST The information in this section will be used to complete the problem-solving portion of the Farm Management Test. In the balance sheet analysis, you will
Basis Data for Forward Pricing Feeder Cattle: Oregon-Washington; Shasta, California; Billings, Montana
 is 5W Basis Data for Forward Pricing Feeder Cattle: Washington; Shasta, California; Billings, Montana Special Report 590 June 1980 Agricultural Experiment Station Oregon State University, Corvallis BASIS
Net Worth Statement Instructions & Forms Dan Childs NF-AE-01-02
 Net Worth Statement Instructions & Forms Dan Childs NF-AE-01-02 NF Net Worth Statement Instructions The Samuel Roberts Noble Foundation Introduction: Good financial management is very important to being
Financing hog operations
 Financing hog operations Introduction Author Mark Greenwood, Ag Star Reviewers Gary Thome, Riverland College John Murray, MN State Colleges and Universities To look at financing swine operations, I think
Balance Sheets- step one for your 2018 farm analysis
 Page 1 of 21 Name Address Phone Email Balance Sheets- step one for your 2018 farm analysis The farm s balance sheet is a snapshot, on one day in time, of what the farm business owns, (its assets), and
Dairy Farm Operating Trends
 Dairy Farm Operating Trends June 30, 2011 To Our Valued Clients and Other Friends in the Dairy Industry The following pages contain the Frazer, LLP s Dairy Farm Operating Trends for the six months ended
Performance and losses in 2016
 Review of 2016 Closeout information from Feedlot Vision Performance and losses in 2016 Feedlot Seminar Tuesday, March 7 th Cedar Rapid, IA Wednesday, March 8 th West Point, NE Thursday, March 9 th Sioux
2016 Enrollment Update
 2016 Enrollment Update Explaining the Dairy Producer Margin Protection Program The dairy safety net program included in the 2014 farm bill is entering its second year. Known as the dairy producer Margin
Legislative Issue Summer President s Column By Mike Haubrich
 Minnesota Lamb & Wool Producers Shepherds Legislative Issue Summer 2000 President s Column By Mike Haubrich B ll ti I hope everyone is enjoying the nice summer weather. What started out looking like a
Futures and Options Live Cattle Feeder Cattle. Tim Petry Livestock Marketing Economist NDSU Extension Service
 Futures and Options Live Cattle Feeder Cattle Tim Petry Livestock Marketing Economist NDSU Extension Service FutOpt-Jan2018 Price Risk Management Tools Cash forward contract Video and internet auctions
Hog Marketing Practices and Competition Questions
 2nd Quarter 2010, 25(2) Hog Marketing Practices and Competition Questions John D. Lawrence JEL Classifications: Q11, Q13 Hog production and marketing practices in the U.S. pork industry have changed dramatically
ECON 337 Agricultural Marketing Spring Exam I. Answer each of the following questions by circling True or False (2 point each).
.") Name: KEY ECON 337 Agricultural Marketing Spring 2014 Exam I Answer each of the following questions by circling True or False (2 point each). 1. True False Futures and options contracts have flexible sizes
Name: KEY ECON 337 Agricultural Marketing Spring 2014 Exam I Answer each of the following questions by circling True or False (2 point each). 1. True False Futures and options contracts have flexible sizes
Feeder Cattle Market Update AgriClear, All Rights Reserved.
 Feeder Cattle Market Update 1 2016 AgriClear, All Rights Reserved. Let s talk How many of you Have stressed over when to sell your calves especially this past fall? Have hoped to capture more value for
Livestock Insurance Alternatives For Risk Management February 15 to March 6, 2007 Dr. Darrell R. Mark Price Change ($/cwt) 5.
 5.") February 15 to March 6, Livestock Insurance Alternatives For Risk Management 1 Sponsors 2 February 15-March 6, Darrell R. Mark, Ph.D Ext. Livestock Marketing Specialist Dept. of University of Nebraska
February 15 to March 6, Livestock Insurance Alternatives For Risk Management 1 Sponsors 2 February 15-March 6, Darrell R. Mark, Ph.D Ext. Livestock Marketing Specialist Dept. of University of Nebraska
Developing a Cash Flow Plan
 Developing a Cash Flow Plan Oklahoma Cooperative Extension Service Division of Agricultural Sciences and Natural Resources F-751 Damona G. Doye Extension Economist and Professor Acash flow plan is a recorded
PROSPECTIVE FED CATTLE MARKET RISK
 PROSPECTIVE FED CATTLE MARKET RISK Justin Bina and Ted C. Schroeder 1 Kansas State University, Department of Agricultural Economics January 2018 Live Cattle Risk Cattle feeding involves substantial risk
HOG RISK MANAGEMENT SURVEY: SUMMARY AND PRELIMINARY ANALYSIS
 HOG RISK MANAGEMENT SURVEY: SUMMARY AND PRELIMINARY ANALYSIS by George F. Patrick, Purdue University Alan E. Baquet, University of Nebraska Keith H. Coble, Mississippi State University, Thomas O. Knight,
Seasonal price patterns of selected agricultural commodities
 Special Report Iowa Agricultural and Home Economics Experiment Station Publications 9-1968 Seasonal price patterns of selected agricultural commodities Allan P. Rahn Iowa State University Follow this and
Futures and Options Live Cattle Feeder Cattle. Tim Petry Livestock Marketing Economist NDSU Extension
 Futures and Options Live Cattle Feeder Cattle Tim Petry Livestock Marketing Economist NDSU Extension www.ndsu.edu/livestockeconomcs FutOpt-Jan2019 Price Risk Management Tools Cash forward contract Video
Risk Management Tools You Can Use
 Management Tools You Can Use Categories of Management Tools Financial Production Price Others Rodney Jones OSU NW Area Extension Economist Overall Financial 1) Know costs of production Your number one
Dairy Farm Operating Trends
 Dairy Farm Operating Trends June 30, 2017 With you. For you. To Our Valued Clients and Other Friends in the Dairy Industry The following pages contain the Frazer, LLP s Dairy Farm Operating Trends for
Frequently Asked Questions 2016 Enrollment Update Margin Protection Program
 Frequently Asked Questions 2016 Enrollment Update Margin Protection Program Registration and Coverage Selection Who is eligible to participate in the program? All dairy operations producing milk commercially
Dr. Jay Parsons - Colorado State University John P. Hewlett University of Wyoming
 How Much Risk Is Right For You? Technical Guide (August, 2013 #TG1308) Risk Scenario Planning Dr. Jay Parsons Colorado State University John P. Hewlett University of Wyoming Assessing changes to your operation
FULL TIME OPPORTUNITIES
 FULL TIME OPPORTUNITIES 2014-2015 BARTLETT & COMPANY WWW.BARTLETTANDCO.COM/CAREERS ABOUT BARTLETT Bartlett and Company is a diverse, growth-oriented agribusiness company. Our principle businesses are grain
Fundamentals of Futures Contracts and Hedging. Overview of discussion. Fundamentals of the hedge 10/6/2016
 Fundamentals of Futures Contracts and Hedging Scott Clawson NE Area Ag Economics Specialist Overview of discussion Fundamentals of the hedge Who are the players in a hedge? Basics of the hedge What is
NEW YORK STATE 4-H MARKET KID PROJECT BOOK
 NEW YORK STATE 4-H MARKET KID PROJECT BOOK Name: Age: Birthdate: Address: County: Years in 4-H: Name of 4-H Club: Name of 4-H Leader: Project start date: Project end date: How many years have you had a
The Western Livestock Price Insurance Program Regulations
 1 PRICE INSURANCE PROGRAM S-12.1 REG 2 The Western Livestock Price Insurance Program Regulations being Chapter S-12.1 Reg 2 (effective May 22, 2014) as amended by Saskatchewan Regulations 79/2018. NOTE:
Chapter Twelve: FINANCIAL ORGANIZATION
 Chapter Twelve: FINANCIAL ORGANIZATION Michael Boehlje and Kenneth Foster Introduction The financial/organizational options currently used in pork production are much broader than the traditional debt
Buying Hedge with Futures
 Buying Hedge with Futures What is a Hedge? A buying hedge involves taking a position in the futures market that is equal and opposite to the position one expects to take later in the cash market. The hedger
More information on other ways of forward contracting hogs is available in the module Hog Market Contracting.
 Hedging Hogs by the Farm Manager Introduction Hog prices can vary significantly from year to year and even day to day. With this volatility in the hog market, forward pricing opportunities arise worthy
Higher Beef Prices with Higher Prices to Come
 Louisiana Cattle Market Update Friday, August 31 st, 2012 Ross Pruitt, Department of Agricultural Economics and Agribusiness LSU AgCenter Higher Beef Prices with Higher Prices to Come As Labor Day weekend
Livestock Market Terms, Part II
 G84-709-A Livestock Market Terms, Part II The second in a series of three*, this NebGuide defines terminology used in general market and futures market reports. Allen C. Wellman, Extension Marketing Specialist
2002 Michigan Dairy Farm Business Analysis Summary. Staff Paper No November Eric Wittenberg and Christopher Wolf
 2002 Michigan Dairy Farm Business Analysis Summary Staff Paper No. 03-14 November 2003 by Eric Wittenberg and Christopher Wolf Copyright 2003 by Eric Wittenberg and Christopher Wolf. Readers may make verbatim
Capturing Management Value
 Capturing Management Value Kevin Hill, DVM, Merck Animal Health Do more things that make you money. Stop doing the things that don t. Make sure you can tell the difference. What Makes You Money? Calves
PROJECT CATTLE FOR FATTENING 2018 LIMOUSIN / ANGUS / CHAROLAIS / BLUE BELGIAN / SIMMENTAL / BLONDA ALL CROSSED CALVES AND EXCELLENT QUALITY SUMMARY:
 PROJECT CATTLE FOR FATTENING 2018 LIMOUSIN / ANGUS / CHAROLAIS / BLUE BELGIAN / SIMMENTAL / BLONDA ALL CROSSED CALVES AND EXCELLENT QUALITY SUMMARY: 1- PURCHASE IN THE ORIGIN OF THE CALVES (36,000 HEADS
The Economics of ARC vs. PLC
 University of Nebraska - Lincoln DigitalCommons@University of Nebraska - Lincoln Cornhusker Economics Agricultural Economics Department 2-4-2015 The Economics of ARC vs. PLC Bradley D. Lubben University
Managing Hog Price Risk: Futures, Options, and Packer Contracts
 Managing Hog Price Risk: Futures, Options, and Packer Contracts John D. Lawrence, Extension Livestock Economist and Director, Iowa Beef Center, and Alan Vontalge, Extension Economist, Iowa State University
A B C D E F G H I Dairy Code: XXX Dairy Business Analysis Project version 8/19/2002 Page 1 Dairy Description /16/2002
 1 1 1 1 0 1 0 1 A B C D E F G H I Dairy Code: XXX Dairy Business Analysis Project version /1/00 Page 1 Dairy Description 001 /1/00 Milk Production Prod. Record. System Milking System Milking Frequency
2009 Michigan Upper Peninsula Dairy Business Analysis Summary. Eric Wittenberg And Christopher Wolf. Staff Paper December, 2010
 2009 Michigan Upper Peninsula Dairy Business Analysis Summary Eric Wittenberg And Christopher Wolf Staff Paper 2010-08 December, 2010 Department of Agricultural, Food, and Resource Economics MICHIGAN STATE
Average Local Bases fur An Aggregation of Cattle Markets in Ohio. Stephen Ott and E. Dean Baldwin. Introduction
 Average Local Bases fur An Aggregation of Cattle Markets in Ohio Stephen Ott and E. Dean Baldwin Introduction Futures markets are a releatively new development in the livestock industry. They began in
BUSINESS TOOLS. How Lending Decisions Are Made. How the Five Cs of Credit are used
 Every lending institution has a set of credit standards or guidelines that are used to analyze and approve loans. At Northwest Farm Credit Services, these guidelines ensure constructive credit to help
Dairy Farm Operating Trends
 Dairy Farm Operating Trends December 31, 2007 MOORE STEPHENS WURTH FRAZER AND TORBET, LLP Certified Public Accountants and Consultants Creating New Horizons By Building Relationships and Exceeding Expectations
Developing a Cash Flow Plan
 Oklahoma Cooperative Extension Service AGEC-751 Developing a Cash Flow Plan Damona Doye Regents Professor and Extension Economist Brent Ladd Extension Assistant Oklahoma Cooperative Extension Fact Sheets
Managing Income Over Feed Costs
 d a i r y r i s k - m a n a g e m e n t e d u c a t i o n Managing Income Over Feed Costs Introduction Feed costs have typically represented 40 to 60 percent of the total cost of producing milk. The current
Commodity Prices, Volatility and Risk: Is the Soybean Market Becoming Riskier?
 University of Nebraska - Lincoln DigitalCommons@University of Nebraska - Lincoln Cornhusker Economics Agricultural Economics Department 2013 Commodity Prices, Volatility and Risk: Is the Soybean Market
End-of-Year Allocations Absorbing the Support Centers
 End-of-Year Allocations Absorbing the Support Centers Successful businesses are managed. Producers cannot manage what is not measured. In order to manage each enterprise of an agricultural business, producers
Lyon County Ag News April 2017
 In this issue: Weevil Control p. 2 Summer Stockers p. 3-4 Whole Farm Revenue Protection p. 5 Wheat Field Day p. 6 2017 Forage School, Grand Rivers, KY College of Agriculture, Food and Environment Cooperative
Live Cattle Marketing Committee Minutes Denver, CO Hyatt Regency, Capitol Ballroom 4 July 14, :15 AM 12:30 PM
 July 14, 201 Live Cattle Marketing Committee Minutes Denver, CO Hyatt Regency, Capitol Ballroom 4 July 14, 2017 9:15 AM 12:30 PM I. The meeting was called to order at 9:15 AM by Chairman Williams. The
Livestock Risk Protection (LRP)
") Livestock Risk Protection (LRP) A Price Risk Management Tool for Livestock Producers Tim Petry Extension Livestock Economist www.ndsu.edu/livestockeconomics November 14, 2017 FeedlotMgmtClass Nov2017.pptx
Livestock Risk Protection (LRP) A Price Risk Management Tool for Livestock Producers Tim Petry Extension Livestock Economist www.ndsu.edu/livestockeconomics November 14, 2017 FeedlotMgmtClass Nov2017.pptx
EC Livestock Contract Feeding Arrangements
 University of Nebraska - Lincoln DigitalCommons@University of Nebraska - Lincoln Historical Materials from University of Nebraska- Lincoln Extension Extension 1959 EC59-813 Livestock Contract Feeding Arrangements
Dairy Farm Operating Trends
 Dairy Farm Operating Trends June 30, 2013 To Our Valued Clients and Other Friends in the Dairy Industry The following pages contain the Frazer, LLP s Dairy Farm Operating Trends for the six months ended
EC Grain Pricing Alternatives
 University of Nebraska - Lincoln DigitalCommons@University of Nebraska - Lincoln Historical Materials from University of Nebraska- Lincoln Extension Extension 1977 EC77-868 Grain Pricing Alternatives Lynn
Western Livestock Price Insurance Program (WLPIP) June 9, 2014 SSGA AGM & Convention
 June 9, 2014 SSGA AGM & Convention") Western Livestock Price Insurance Program (WLPIP) June 9, 2014 SSGA AGM & Convention Presentation Outline Factors Impacting Canadian Prices Why Consider Risk Management Western Livestock Price Insurance
Western Livestock Price Insurance Program (WLPIP) June 9, 2014 SSGA AGM & Convention Presentation Outline Factors Impacting Canadian Prices Why Consider Risk Management Western Livestock Price Insurance
2005 Michigan Feeder Steers Business Analysis Summary. Eric Wittenberg and Roy Black. Staff Paper December, 2006
 2005 Michigan Feeder Steers Business Analysis Summary Eric Wittenberg and Roy Black Staff Paper 2006-31 December, 2006 Department of Agricultural Economics MICHIGAN STATE UNIVERSITY East Lansing, Michigan
2006 Michigan Cash Grain Farm Business Analysis Summary. Eric Wittenberg And Stephen Harsh. Staff Paper December, 2007
 2006 Michigan Cash Grain Farm Business Analysis Summary Eric Wittenberg And Stephen Harsh Staff Paper 2007-11 December, 2007 Department of Agricultural Economics MICHIGAN STATE UNIVERSITY East Lansing,
Indicators of the Kansas Economy
 Governor s Council of Economic Advisors Indicators of the Kansas Economy A Review of Economic Trends and the Kansas Economy 1000 S.W. Jackson St. Suite 100 Topeka, KS 66612-1354 Phone: (785) 296-0967 Fax:
November 2017 Monthly Commodity Market Overview Newsletter
 November 2017 Monthly Commodity Market Overview Newsletter By the ADMIS Research Team Stock Index Futures S&P 500, Dow Jones, NASDAQ and Russell 2000 futures registered new historical highs in November.
Fats vs. Feeders, Off to a Decent Start!
 Fats vs. Feeders, Off to a Decent Start! By Frank Petricca T: 312 286 9320 E: fpetricca@pricegroup.com 10/16/2017 My October special report recommending buying Live Cattle and selling Feeder Cattle is
2016 Enrollment Update
 2016 Enrollment Update Explaining the Dairy Producer Margin Protection Program The dairy safety net program included in the 2014 farm bill is entering its third year. Known as the Margin Protection Program