Click to edit Master text styles Second level Third level Corporate Presentation Fourth level Fifth level. September 2017
|
|
|
- Collin Richards
- 5 years ago
- Views:
Transcription


1 Corporate Presentation September 2017
2 Table of Contents Macroeconomic developments and status of the Greek banking sector 3 Profile of Attica Bank 11 A ground-breaking solution to NPE Management 18 A broad-spectrum transformation 21 Q Financials 24 APPENDIX 38 2
3 Macroeconomic developments and status of the Greek banking sector 3
4 Macroeconomic Developments Greece: GDP growth (seasonally adjusted), Dec June 2017 The conclusion of the second review of Greece s fiscal adjustment programme was the catalyst to the expansion of the GDP that was reported in the second quarter of Expansion was led by exports (+ 3.8%) and consumption (+ 0.4%). Source: National Statistic Authority Positive signs on the condition of the economy come from several other sources such as economic sentiment indicators, manufacturing (the PMI rose to a 9-year high of Click 52.2 to inedit August), unemployment, Master industrial text production styles and retail sales. A good touristic season (arrivals rose by 5.7% y-o-y in July) with also contribute positively to GDP growth in the second quarter of the year. On the downside, gross capital formation, dropped by 26% and investment was down 4.5% in the second quarter of the year. Source: National Statistic Authority 4
5 Macroeconomic Developments Source: National Statistic Authority 5
6 Macroeconomic Developments Macroeconomic Projections 2015 Annual change bn EUR Curr. Prices % GDP GDP Private Consumption Gross fixed capital formation Exports (goods & services) Imports (goods & services) GNI (GDP deflator) Contribution to GDP growth: Domestic Demand Inventories Net Exports Unemployment rate (a) Harmonised index of consumer prices Current - account balance (b ) General Government balance (b ) Structural budget balance (c) General Government gross debt (b ) Source: European Commission (a) as a % of total labor force, (b ) as a % of GDP, (c) as a % of potential GDP. Doubts remain over Greece s ability to achieve the growth targets for the year, as performance has to beat expectations, and as the next review of the fiscal adjustment programme is about to begin. 6

7 Status of the Greek Banking Sector Deleveraging continues at declining rates. Since December 2014 total loan balances in the Greek banking Click to system edit have been Master reduced by c. 21text bn. euros. styles Both business loans and mortgages have been reduced by c. 9 billion euros since the end of Source: Bank of Greece 7
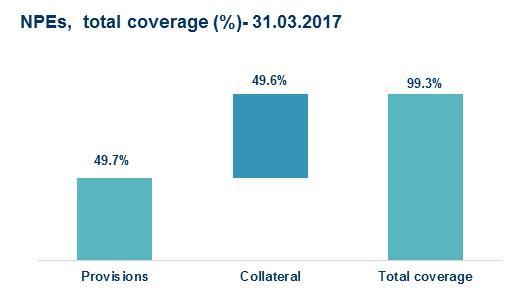
8 Status of the Greek Banking Sector The non-performing exposures of Greek banks stood billion euros in June 2017, 1.6 billion less than the target that has been set by the Bank of Greece for the respective period. Click to banks edit have written Master off loans totaling text 3.3 billion styles euros. It should be noted that in the first half of 2017 Greek The targets set by the Bank of Greece foresee an NPE ratio of 33.9% by the end of The following facts point to the fact that NPE management so far has not provided stable solutions to the NPE problem: - Default rates remain higher than cure rates - The level of NPLs is still rising - Banks have missed their H1 targets for loans in arrears for more than 720 days. NPE coverage ratios stand close to 50%. * Total exposures used for the calculation of the ratios include off-balance sheet items. If these items are excluded then the total NPE ratio as at June 2017 reaches 50.6%. Source: Bank of Greece 8
 General Government Businesses Households Total Dec. 2016 10.7 20.6 100.8 132.")
9 Status of the Greek Banking Sector Liquidity in the Greek banking system has stabilized since the outflows recorded in the first months of 2015, which led to the capital controls imposed in June Since then private sector deposit balances have remained stable, close to 120 billion euros. Deposit Balances ( billion) General Government Businesses Households Total Dec Jan Feb Mar Apr May June Greek banks have been reducing their reliance on Eurosystem funding by gradually eliminating the more expensive ELA financing. As at June 2017, Eurosystem funding was close to 16% of the Greek banks total assets. Source: Bank of Greece 9
10 Status of the Greek Banking Sector (Deposits) Average Interest Rate (Existing Deposits) Dec Dec March 2017 April 2017 May 2017 June 2017 July 2017 Households up to 2 years Businesses up to 2 years Weighted Average Interest Rate Average Interest Rate (New Deposits) Households (1 day) Businesses (1 day) Deposits up to 1 year from households Dec Dec March 2017 April 2017 May 2017 June 2017 July The cost of deposits has dropped significantly in 2016 and has remained rather stable in the first seven months of Weighted Average Interest Rate Source: Bank of Greece 10
11 Profile of the Bank 11
12 Profile of the Bank - History 1925 Year of establishment Listing on the Athens Stock Exchange Emporiki Bank acquires 70% of Attica Bank Major shareholders: - TSMEDE - Loans and Consignments Fund Major shareholders: - TSMEDE - Loans and Consignments Fund - Hellenic Postbank Changes achieved: - Balance sheet strengthening - Improved efficiencies - Growth and diversification - Systems and organisation Completion of share capital increase by private sector participation (no reliance on HFSF). Major shareholder TSMEDE (51%) Completion of share capital increase by private sector participation (no reliance on HFSF) Major shareholders TSMEDE (56%), TAPILTAT (8%) 2016 New management Extensive reorganization plan 2017 Completion of a non-performing loans transaction TSMEDE: Civil Engineers and Public Contractors Fund TAPILTAT: Pension fund of the banking sector. 12
13 Profile of the Bank Ownership Structure Attica Bank is the fifth largest bank in Greece, with total assets of 3.6 billion, as at , offering retail and corporate banking services. The Bank operates solely in Greece. The Bank s largest shareholder with 50.63% of common shares, is EFKA (Unified Social Security Fund). TAPILTAT (a pension fund insuring professionals of the banking sector) holds 7.91% of the ordinary shares of the bank and TMEDE (pension fund of the construction sector) holds the 5.63% of the bank s shares. Attica Bank is the only bank of meaningful size in Greece without any support from the Hellenic Financial Stability Fund % 5.63% 7.91% 50.63% EFKA TAPILTAT TMEDE OTHER 13
14 Market Shares Profile of the Bank-Market Position BUSINESSES Market Share Loans (June 2017) Industrial Sector 2.09% Commercial 3.42% Other 3.24% Total Business Loans 3.06% CONSUMERS Mortgages 0.79% Consumer Loans 0.90% Credit Cards 1.38% Total Consumer Loans 0.89% TOTAL 2.09% Branch network, Η Market Share Deposits (June 2017) Sight Deposits 2.00% Savings Deposits 0.81% Deposits 1.22% Click Term Deposits to edit Master 2.10% text styles Repos 0.00% Term Deposits 2.09% TOTAL 1.55% Peer Peer Peer Peer
15 Profile of the Bank Products & Network Retail Customers 19.5% of the loan book ( 780m as at March 2017) Deposit accounts Loans Mortgages Credit, Debit and Prepaid Cards Investment products Bancassurance Operating Segments Corporate & SMEs 80.5 % of the loan book ( 3,213m as at March 2017) Deposit Accounts Loans Bond Loans Documentary Credit Leasing, Factoring Bancassurance Venture Capital EU and Statesponsored Projects Standing Orders Capital Transfers POS Imports/Exports Network Network of 55 branches in all major cities in the country, out of which: 21 are located in Attica 6 are located in Thessaloniki 28 are located in the rest of Greece Payroll - Pension payment services The Attica Bank Group of companies is active in three major operating segments: Corporate banking: This segment includes all credit services provided to businesses and entrepreneurs. In addition to loans, the Group offers to customers of this category a broad range of products and services related to consulting, financial and investment operations, as well as foreign exchange operations. Retail banking: This segment includes all private consumers and freelance professionals. The Group, through the network of the Bank s branches, and the competent central services, offers to customers of this category the entire range of traditional products, as well as specialized products of an investment and savings nature. Cash reserve Management Treasury: This segment includes the management of the Group s cash assets, brokerage services in the sale of mutual funds, the management of the Group s securities, custodian services, and management of private customer portfolios. Thanks to co-operations with cooperative banks, Attica Bank offers access to its customers to 150 ATMs in Greece. Personnel Total of 792 (August 2017) out which: 423 in central functions 358 in branches 11 in subsidiaries 15


16 27,489 31,175 33,709 36,274 Profile of the Bank Customer basis E- banking Users. FY 2015 H ,847 36,738 32,313 43,125 4,824 5,563 6,138 6,851 FY 2015 H FY 2016 H Legal persons Private individuals The customer basis of the Bank has been expanding in recent years. The Bank has been improving its electronic distribution channels and is currently upgrading its e-banking infrastructure. 16
17 Profile of the Bank- Summary Financial Figures Summary financial figures- Q amounts in ( m) Change % (Q Q1 2016) Profit before provisions for credit and other risks: 8.38 million Personnel Expenses: % y-o-y Total Operating Expenses (excluding provisions for credit and other risks): - 5% y-o-y Stock of Provisions / Total Gross Loans: 30.6%. NPE Coverage Ratio: 50% Own Equity: mn. CET 1 Ratiο: 14.3% Total Loans before provisions 3, , % Stock of Provisions 1, , % Deposits 1, , % Assets 3, , % amounts in ( m) Change % (Q Q1 2016) Net Interest Income % Net Fee and Commission Income % Other Income % Total Net Operating Income % Personnel Expenses % Total Operating Expenses (excluding depreciation and provisions for credit and other risks) % Provisions for credit risks % Profit / (loss) after taxes (3.1) % Data on a consolidated basis. Information above does not include the effects of the NPE transaction completed in the summer of
18 A ground-breaking solution to NPE management 18
19 A ground-breaking solution to NPE management On May 15 th 2017 the General Meeting of Shareholders of the Attica Bank finalized the terms of a transaction involving the securitization of denounced loans in co-operation with an international investor (Aldridge) Attica Bank S.A. Bond Issuance/Securitization Senior Notes 525 million Junior Notes 806 million Non-performing Loan Portfolio 1.3 Billion Artemis Securitization (Special Purpose Vehicle) 806 million Junior Notes Payment of: 70 million for Junior Notes 80,000 for Thea Artemis stake Servicing of Loans Payment of Servicing Fees Artemis Finance S.ar.l. The Bank has established an NPL Asset Management Company (Thea Artemis), in accordance with the provisions of the respective Greek legislation (Law 4354/2015). 80% of Thea Artemis Shares Thea Artemis (Asset Management Company) In July the Bank proceeded with the securitization and the transfer of the 1.3 billion non-performing loan portfolio to Artemis Securitization, a special purpose vehicle (SPV). The SPV issued the following two bonds: o o A Series A Bond with face value of EUR million (Senior Note) A Series B Bond with face value of EUR million (Junior Note) The SPV signed a 10-year Service Level Agreement (SLA) with Thea Artemis. The investor has acquired 80% of Thea Artemis by paying an amount equal to the nominal value of its participation in the total equity required for the AMC. The Bank sold the Junior Note to the Investor recording a gain of 70 million euros and covering the remaining amount of the adverse scenario of the 2015 stress test. At the same time, the Bank retained the right to collect by priority any amount from the management of the loans of the senior bond which has a nominal value of million euros. 19
 from c. 56% in to c. 37% post-transaction and the NPL ratio (pro-forma) from c. 47% to c. 26%.")

20 A ground-breaking solution to NPE management NPE securitization- Key statistics Advantages of the transaction: Breakdown of gross loan balances Significant improvement of the NPE ratio (pro-forma) from c. 56% in to c. 37% post-transaction and the NPL ratio (pro-forma) from c. 47% to c. 26%. Resources are freed to manage the remaining portfolio of the Bank and focus on the development of new business. The Bank retains the right to collect by priority any amount from the management of the loans of the senior bond. Coverage of the capital shortfall remaining after the 2015 stress test. BoG NPE targets could be attained earlier than Improvement of the loans/deposits ratio. 20
21 A broad-spectrum transformation 21
22 A broad-spectrum transformation Since the last quarter of 2016 Attica Bank has been implementing a large-scale programme of projects focused on four major areas. By June 2017, 92% of the actions included in the programme had been completed. 1. INTERNAL GOVERNANCE Composition and function of the BoD Composition and function of BoD committees Ensuring that on the basis of current fit and proper criteria - BoD members possess necessary background and sufficient professional experience from diverse areas relevant to the activities of the Bank. Enhancement of BoD control to ensure appropriate functioning of the Board Committees Strengthening the corporate governance framework through: a) A Board nomination policy, b) Conflicts of interest policy for the Board, c) Board and Board Committees evaluation policy, d) Succession planning policy for the Board members and senior management, e) CEO and senior management assessment policy. Improvement of the operation of the Arrears and Non-Performing Loans Management Body (ANPLMB). Full independence of the Risk Management function. 2. BUSINESS MODEL Monitoring of New budget monitoring process and budget and profit allocation / sources of income management information systems to be utilized for profit and cost analysis of all business lines and producing comprehensive reports to support decision-making. Review of the loan pricing policy New process of pricing corporate loans incorporated in the loan approval process. 3. CREDIT RISK MANAGEMENT PROCESS Loan approval process, pricing policy, portfolio monitoring, Review and update the loan pricing policy, customer Click to edit establish Master new minimum interest text rates, styles definition classification and assessment Risk strategy and risk-taking limits, management policy for credit risks and provisioning 4. IT RISK IT Governance Development of watch-lists and regular review of borrowers. Update of the Credit Manual. of deviations policy and procedures of monitoring and handling deviations from pricing policy. Development and application of a Appetite Framework, and risk tolerance limits. Update of Risk Management Policy and Credit Risk & Provisioning Policy. new Risk Review of the provisioning process and development of statistical models for IBNR provisions Development of an Early Warning System (EWS) with concrete quantitative and qualitative indicators whose breach triggers specific actions Finalization of the IT Strategy ensuring coordination aligned with the overall business strategy of the Bank. Enhanced operation of the ΙΤ Steering Committee Ensure independence and full performance of responsibilities and duties of the Information Security Officer and also the well-functioning of the IT PMO. Development and establishment of new plans for recovery from catastrophic events (Business Continuity Plan and Disaster Recovery Plan) to ensure full compliance with the respective regulatory requirements. 22
23 A broad-spectrum transformation Heavy investment in information technology in New Investment IT Projects / 2017 Introduction of state-of-the-art Risk Management and Credit Scoring systems Upgrade of the NPE management IT infrastructure Upgrade of the e-banking infrastructure Transfer of the Bank s card management activities in-house Exploitation of technological instruments in Big Data/Customer Analytics Upgrade of back-office IT infrastructure Implementation of an upgraded document management system 23
24 Q financials (data in this section do not include the effects of the NPE transaction) 24
. Gross Loans (EUR m) and Provisions / Gross Loans (%) 31.03.2017 29.4% 29.5% 30.")
25 Loan Portfolio Overview Total loan book at 3.99 bn. as at 31 March Almost 80.5% of total portfolio consists of loans to businesses, 12.0% of mortgage loans and the remaining 7.5% of other retail loans. Provisions as at 31 March 2017 stood at 30.6% of total gross loans ( 1.22 bn). Gross Loans (EUR m) and Provisions / Gross Loans (%) % 29.5% 30.6% 25


26 Loan Portfolio Overview Loans to Businesses by Sector (Total as at : EUR 2.88 bn) 26


27 Asset Quality 27
 Concentration of NPEs - 31.03.")
 NPEs of SMEs and Small Enterprises accounting for 64.")
28 Asset Quality Breakdown of NPEs by type, (1) Concentration of NPEs (1) Consumer credit includes credit cards (1.65% of total NPEs) NPEs of SMEs and Small Enterprises accounting for 64.7% of total NPEs. The concentration of a large part of NPEs into a limited number of customers can facilitate the NPE management process. 28
 and collateral coverage (%) of total gross loans Evolution")
 of NPEs 50.9% 48.7% 50.6% 49.")
 Note: All collaterals are presented at fair value.")
29 Asset Quality Evolution of total portfolio and collateral value ( m) and collateral coverage (%) of total gross loans Evolution of NPE Portfolio collateral value ( m) and collateral coverage (%) of NPEs 50.9% 48.7% 50.6% 49.6% Breakdown of total collateral by type, ( m) Note: All collaterals are presented at fair value. Personal and corporate guarantees not included. 29
30 Asset Quality New NPE formation slowed down during the 1 st quarter of
31 Funding and Liquidity Evolution of Customer Deposits ( mn) In the first quarter of 2017, the Bank s deposits balances were reduced by approximately 5.9%. As at March 31th 2017, deposits stood at approximately 1.78 bn. Deposit balances have improved further since March Net Loans to Deposits ratio(%) 155.9% 146.7% 140.4% Q FY 2016 Q , ,100 2,050 2,000 1,950 1,900 1,850 1,800 1,750 1,700 1,650 1,600 2, ,892.8 Q FY 2016 Q Customer Deposit Balances ( mn) 31
 and time deposits.")

32 Evolution of Deposits Deposits are almost equally split between core (savings and sight deposits) and time deposits. The Bank s deposits are generated mostly from retail clients (~63%). The remaining balance is mainly divided into corporate clients and clients from the public sector. 32


33 Eurosystem Funding Evolution of Eurosystem funding (% of total assets) Q Q As at , Eurosystem funding amounted to 1,115 million. Eurosystem funding as a percentage of total assets reached 31.0%. The Banks reliance on ELA funding has been reduced by 13% by mid- September
34 bps bps Deposits Pricing Cost of deposits: Total Deposits (stock) Since the beginning of 2017 deposit costs have remained rather stable Aug-16 Dec-16 Apr-17 Aug-17 Cost of deposits: Term Deposits (stock) Aug-16 Dec-16 Apr-17 Aug-17 34
. The Bank has issued 100.2 m. of preference shares to the Greek State.")
35 Capital Position Risk Weighted Assets ( m) The Group s CET ratio stood at 14.3% as at (10.8% on a fully loaded basis). The completion of the NPE transaction is expected to improve the CET ratio by c. 200 bps. (pro-forma). The Bank has issued m. of preference shares to the Greek State. As from January 2018 this type of capital will not be taken into consideration for the calculation of the CET ratio. The Bank is currently considering various options for replacing this type of capital and strengthening its capital ratios further. 35
 Operating income by source (EUR m) OPERATING INCOME Q1 2017 Q1 2016 Net interest income 21.")
 2.54% 2.44% 2.37% 2.38% 2.")
36 Operating Income. Operating Expenses Evolution of key P&L figures. Q Q (EUR m) Operating income by source (EUR m) OPERATING INCOME Q Q Net interest income Net fee and commission income Gain/ loss from securities Other income TOTAL Net Interest Margin - NIM (%) 2.54% 2.44% 2.37% 2.38% 2.39% Q H Q FY 2016 Q NIM: Net interest income (annualized)/ Average Total Assets 36
 Operating expenses by category ( mn) Q1 2017 Q1 2016 Change % Q1 2017 Q1 2016 Rents 27.1% 22.7% Utility Services 5.8% 5.0% Telecommunication expenses 8.7% 7.")
37 Operating Expenses Cost / Income Ratio (excl. provisions for credit and other risks) Breakdown of general operating expenses ( 6.2 m for Q1 2017) Operating expenses by category ( mn) Q Q Change % Q Q Rents 27.1% 22.7% Utility Services 5.8% 5.0% Telecommunication expenses 8.7% 7.9% Repairs and maintenance 5.9% 5.8% Advertising and promotion expenses 3.4% 0.2% Other 30.6% 30.9% Third party fee and expenses 18.5% 27.5% TOTAL 100.0% 100.0% The Cost/Income ratio has been improving in As part of the cost cutting efforts has not been reflected fully, further improvement of the ratio should be expected in Personnel expenses % General & Administrative expenses % Depreciation % TOTAL % 37
38 Appendix 38
39 Amounts in million ASSETS Q FY 2016 CHANGE % (Q FY 2016) Cash and balances with the Central Bank % Due from other financial institutions % Derivative financial instruments- assets % Financial assets at fair value through profit and loss % Loans and advances to customers (net of provisions) 2, , % Financial assets available for sale % Investments held to maturity % Investments in associates % Property. plant. and equipment % Investment Property % Intangible assets % Deferred tax assets % Other assets % TOTAL ASSETS 3, , % LIABILITIES Due to Financial Institutions 1, , % Due to customers 1, , % Debt Securities issued Defined benefit obligations % Other provisions % Deferred tax liabilities % Other liabilities % Total Liabilities 2, , % EQUITY Share capital (common shares) Share capital (preference shares) Convertible bond loan Share Premium Reserves % Retained earnings (418.3) (415.4) 0.2% Equity Attributable to equity owners of the Bank % Non-controlling interests % Total Equity % TOTAL LIABILITIES & EQUITY 3, , % Amounts in million Group P&L and balance sheet Q Q CHANGE % (Q Q1 2016) Interest and similar income % -Less: Interest Expense and similar charges (13) (14) -3.9% Net interest income % Fee and commission income % Click -Less: fee and commission to edit expense Master (2) text (1) styles 202.1% Net fee and commission income % Profit (loss) from trading portfolio % Profit (loss) from investment portfolio % Other income % TOTAL OPERATING INCOME % Provisions for credit risks (13) (9) 39.9% Salaries. wages and personnel expenses (8) (10) -17.3% General operating expenses (6) (6) 8.5% Depreciation (2) (1) 28.7% TOTAL OPERATING EXPENSES (28) (25) 11.0% Income from investments in associates (1) % PROFIT / (LOSS) before taxes (4) 4 Taxes 1 (2) PROFIT / (LOSS) AFTER ΤΑΧ (3) 3 39
40 Group results by segment Q Q Total Amounts in EUR m Retail Business Banking Investment Banking & Treasury Retail Business Banking Investment Banking & Treasury Q Q Change % Q Q Operating Income % - Net interest income % - Net fee and commission income % - Income from trading & other income % - Adjustment between segments Income from investments in associates % Profit / (loss) before taxes % Taxes % Profit / (loss) after taxes % Provisions for credit risks and securities impairment % Depreciation % Total Assets , , , , % Total Liabilities 1, , , , , , % 40
41 Key financial ratios. Q Q BALANCE SHEET STRUCTURE Q FY 2016 Q Due to Customers / Loans and Advances to customers (before provisions) 44.6% 47.5% 50.3% Due to Customers / Loans and Advances to customers (after provisions) 64.2% 68.2% 71.2% Due to Customers / Total Assets 49.5% 52.4% 54.3% Loans and Advances to customers (after provisions) / Total Assets Total Equity / Total Assets Total Equity / Due to Customers EFFICIENCY Profit before taxes / Average Equity (RoAE) Profit before taxes / Average Total Assets (RoAA) Total operating expenses less provisions for credit risk / Total Assets NPE ratio Provisions / NPEs 77.1% 76.9% 76.3% 17.5% 17.6% 18.4% 35.4% 33.5% 33.9% Q FY 2016 Q (0.9%) (8.6%) 2.5% (0.2%) (1.5%) 0.5% 0.6% 4.0% 1.8% 61.5% 60.8% 57.2% 49.7% 49.9% 51.5% CAPITAL Q FY 2016 Q CET Ι capital ratio 14.30% 14.80% 16.10% Total Capital Adequacy Ratio 14.30% 14.80% 16.10% Data on a consolidated basis 41
42 Organizational Structure LEGAL COUNCIL LAW COUNCELOR BRANCH NETWORK MANAGEMENT PRODUCT & SERVICES DEVELOPMENT SPECIAL CREDIT INSTRUMENTS SUB- DEPARMENT LARGE CUSTOMERS DIGITAL SERVICES CHAIRMAN OF THE BOARD MANAGEMENT SECRETARIAT DEPARTMENT LEGAL DEPARTMENT STRATEGY AND FINANCIAL PLANNING FINANCE HUMAN RESOURCES CORPORATE COMMUNICATION SUB- DEPARTMENT DEPUTY CHIEF EXECUTIVE OFFICER CREDIT TREASURY INVESTMENT BANKING BOARD OF DIRECTORS BoD Committees AUDIT COMMITTEE RISK MANAGEMENT COMMITTEE REMUNERATION COMMITTEE BoD MEMBERS NOMINATION COMMITTEE. STRATEGY & CORPORATE COMMUNICATION COMMITTEE INTERNAL AUDIT CHIEF EXECUTIVE OFFICER (CEO) TRANSFORMATION OFFICE NPL MANAGEMENT: BUSINESS LOANS DELIQUENT LOANS MANAGEMENT: BUSINESS LOANS DELIQUENT LOANS MANAGEMENT: RETAIL LOANS COMPLIANCE & CORPORATE GOVERNANCE RISK MANAGEMENT DEPUTY CHIEF EXECUTIVE OFFICER IT & ORGANISATION PROPERTY, TECHNICAL SERVICES & PROCUREMENT CENTRALISED OPERATIONS PROCUREMENT, LOGISTICS & ARCHIVES 42
43 By receiving this document, the Recipient accepts and agrees to be bound by the following obligations and limitations: The above material has been prepared by Attica Bank for the exclusive use of the selected parties to whom it is delivered. Neither the whole ore any part of the information in this presentation may be disclosed to or used by any other person or used for any other purpose without the prior consent of Attica Bank. Neither Attica Bank nor any of its connected persons accept any liability or responsibility for the accuracy or completeness of. nor make any representation or warranty, express or implied, with respect to, the information on which this material is based or that this information remains unchanged after the issue of this presentation. In addition, the reader of the material agrees that Attica Bank and all connected persons neither owe nor accept any duty or responsibility to the former, whether in contract or in tort (including without limitation, negligence and breach of statutory duty), and shall not be liable in respect of any loss, damage or expense of whatsoever nature which is caused by any use the reader may choose to make of this material, or which is otherwise consequent upon the gaining of access to the report by the reader. The content of this material should not be construed as a solicitation or a recommendation. It has been prepared for information purposes only and is purely indicative. It does not constitute an offer or invitation for sale or purchase of securities or any of the businesses or assets described herein or any form of commitment, advice, recommendation or valuation opinion on the part of Attica Bank or its connected persons. No part of this material should form basis of or can be relied upon in connection with any contract or investment decision or commitment relating thereto. This material should not be regarded by the Recipient as a substitute for the exercise of its own judgment and the Recipient is expected to rely on its own due diligence if it wishes to proceed further. Additionally, the Recipient should not construe the contents of this material as legal, tax, accounting or investment advice. The Recipient should consult its own independent counsel, tax and financial advisers as to financial, tax legal and related matters concerning any transaction described herein. This material does not purport to be all-inclusive or to contain all of the information that the Recipient may require or request. The present material may contain targets, prospects, returns and/or opinions which obviously involve elements of subjective judgment. Any opinions expressed in this material are subject to change without notice. Forward looking statements may also be contained. Attica Bank gives no undertaking and is under no obligation to update these targets. prospects or potential statements for events or circumstances that occur subsequent to the date of this material or to update or keep current any of the information contained herein and this material and there exists no representation that it will do so. Actual results will vary from the projections or targets mentioned and such variations may be material. In this notice Attica Bank means Attica Bank S.A. and its connected persons means the shareholders, subsidiaries and the respective directors, officers, employees and agents of each of them. ATTICA BANK S.A. Contact Information: Strategy and Financial Planning Department 23 Omirou Str Athens. Greece InvestorRelations@atticabank.gr Tel.:
DRAFT. Attica Bank. Financial Results Q Together we are stronger.
 DRAFT Attica Bank Financial Results Q3 2017 Together we are stronger www.atticabank.gr Table of Contents HIGHLIGHTS ASSET QUALITY FUNDING CAPITAL APPENDIX 2 Highlights 3 Performance Highlights Capital
Attica Bank. Click to edit Master text styles Second level. Third level Fourth level Fifth level Q FINANCIAL RESULTS
 Attica Bank Q1 2015 FINANCIAL RESULTS Strategy Department 27.5.2015 Table of Contents Page Attica Bank in Q1 2015 3 Assets-Loan Portfolio 5 Deposits, Funding 9 Profit & Loss Account 12 Capital 16 Appendix
Attica Bank. Click to edit Master text styles Second level. Third level Fourth level Fifth level Η FINANCIAL RESULTS
 Attica Bank Η1 2015 FINANCIAL RESULTS Strategy Department 2.11.2015 Overview 1. Attica Bank in Η1 2015 2. Assets-Loan Portfolio 3. Deposits, Funding 4. Profit & Loss Account 5. Capital Appendix 2 1. Attica
DRAFT. Attica Bank. Q Financial Results. Together we are stronger.
 DRAFT Attica Bank Q3 2018 Financial Results Together we are stronger. www.atticabank.gr 1 Table of Contents MACROECONOMIC REVIEW HIGHLIGHTS FINANCIAL PERFORMANCE ASSET QUALITY FUNDING APPENDIX GLOSSARY
DRAFT. Attica Bank. H Financial Results. Together we are stronger.
 DRAFT Attica Bank H1 2018 Financial Results Together we are stronger. www.atticabank.gr 1 Table of Contents HIGHLIGHTS ASSET QUALITY FUNDING APPENDIX GLOSSARY OF TERMS 2 Highlights 3 Concluded and in -
National Bank of Greece
 National Bank of Greece Q2.2014 Results August 28 th, 2014 Q2.2014 Results: Highlights National Bank of Greece Results Result Highlights CET1 ratio increases 16.2% post 2.5bn capital increase Group PAT
FULL YEAR 2011 RESULTS
 FULL YEAR 2011 RESULTS Management Statements The implementation of the Greek Government bond exchange programme (PSI), inevitably had very large negative effects on both the financial results and the equity
Q1.16 Financial Results. May 26, 2016
 Q1.16 Financial Results May 26, 2016 Important Notice Forward Looking Information No representation or warranty, express or implied, is or will be made in relation to, and no responsibility is or will
Corporate Presentation. November, 2016
 Corporate Presentation November, 2016 Important Notice Forward Looking Information No representation or warranty, express or implied, is or will be made in relation to, and no responsibility is or will
2015 Asset Quality Review & Stress Test. Comprehensive Assessment Results
 2015 Asset Quality Review & Stress Test Comprehensive Assessment Results 31 October 2015 Disclaimer By reading or otherwise accessing the presentation that follows, you agree to be bound by the following
Management Statement PIRAEUS BANK GROUP - H FINANCIAL RESULTS
 PIRAEUS BANK GROUP - H1.2017 FINANCIAL RESULTS Piraeus Bank recorded a profit of 7mn in Q2.2017 Accelerated Execution of Agenda 2020 Core Bank Yields 1.1% RoA in H1.2017, Group P&L at Break-even Management
26 th April 2017 PORTUGAL. January March 2017
 26 th April 2017 PORTUGAL January March 2017 Disclaimer Banco Santander, S.A. ("Santander") cautions that this presentation contains forward-looking statements within the meaning of the US Private Securities
Nine Month 2016 Profit after Tax at Euro 22.2 million
 Nine Month 2016 Profit after Tax at Euro 22.2 million Main Highlights - Profitable 9M 2016 driven by de-escalation of Cost of Risk and improvement in Pre-Provision Income. - Core Pre-Provision income 1
Third Quarter 2017 Financial Results
 1 Third Quarter 2017 Financial Results 1 Net profit 2 61m in 3Q2017 and 132m in 9M2017 Core pre-provision income up 2.4% q-o-q and 7.9% y-o-y Operating expenses down 2.0% y-o-y International operations
First Half 2018 Profit After Tax at Euro 12.3 million
 First Half 2018 Profit After Tax at Euro 12.3 million Main Highlights - Sector leading capital position with Common Equity Tier 1 ratio (CET 1) at 18.5%; Tangible Book Value at Euro 7.8 billion. - Continued
First Quarter 2018 Profit after Tax at Euro 65.2 million
 First Quarter 2018 Profit after Tax at Euro 65.2 million Main Highlights - Strong capital position with Common Equity Tier 1 ratio (CET 1) at 18.3%; Tangible Book Value the highest among Greek banks at
Financial Division Research, Strategic Planning and Investor Relations May Portugal. Q1'18 Earnings Presentation
 Financial Division Research, Strategic Planning and Investor Relations May 2018 Portugal Q1'18 Earnings Presentation Disclaimer Santander Totta SGPS, S.A. ( Santander Totta ) cautions that this presentation
Q2.2018: Recurring Pre-Provision Income at 224mn, +8% qoq, and 24mn Net Profit from Continuing Operations
 Q2.2018: Recurring Pre-Provision Income at 224mn, +8% qoq, and 24mn Net Profit from Continuing Operations Further Cleaning-up and Strengthening of the Group s Balance Sheet NPE deleverage process accelerated,
BZWBK Group. Results 1H12. July 26 th, 2012
 1 BZWBK Group Results 1H12 July 26 th, 2012 2 This presentation as regards the forward looking statements is exclusively informational in nature and cannot be treated as an offering or recommendation to
FY2016 Financial Results
 FY2016 Financial Results Net profit at 230m in 2016 against losses of 1.2bn in 2015 Core pre-provision income up 26.8% 1 in 2016 and 5.0% in 4Q2016 Net interest income up 5.8% y-o-y Fee and commission
Full Year 2017 Profit after Tax 1 at Euro 89.5 million
 Full Year 2017 Profit after Tax 1 at Euro 89.5 million Main Highlights - Strong capital position with Common Equity Tier 1 ratio (CET 1) at 18.3%; Tangible Book Value at Euro 9.2 billion, the highest among
First Half 2017 Profit after Tax 1 at Euro 118 million
 First Half 2017 Profit after Tax 1 at Euro 118 million Main Highlights - Strong capital position with Common Equity Tier I ratio (CET 1) at 17.9%, up by 74bps q-o-q. Tangible Book Value at Euro 9 billion,
Attica Bank. Presentation. November Together we are stronger.
 Attica Bank Presentation November 2015 Together we are stronger www.atticabank.gr 1 Table of Contents EXECUTIVE SUMMARY 2 BUSINESS DESCRIPTION 14 LOANS 20 FUNDING 29 CAPITAL 33 OPERATING INCOME - OPERATING
Fourth Quarter 2014 Financial Results
 Fourth Quarter 2014 Financial Results Core pre-provision income up by 9.8% in the fourth quarter and 48.8% in 2014. 90dpd loans coverage ratio expanded by 270 basis points to 56.3%. 90dpd formation maintained
National Bank of Greece
 National Bank of Greece Q1.2014 Results May 28 th, 2014 Q1.2014 Results: Highlights National Bank of Greece Results Result Highlights Post the 2.5bn capital increase and before capital actions, CET1 1
31 January 2018 PORTUGAL. January December 2017
 31 January 2018 PORTUGAL January December 2017 Disclaimer Banco Santander, S.A. ("Santander") cautions that this presentation contains statements that constitute forward-looking statements within the meaning
Outperformance on Asset Quality Targets; Strengthened Cash Coverage
 A Year of Significant Progress for Piraeus Bank Highlights Outperformance on Asset Quality Targets; Strengthened Cash Coverage NPEs reduced by 3.0bn, NPLs by 3.7bn year-on-year NPE coverage at 52% and
First Quarter 2017 Financial Results
 First Quarter 2017 Financial Results Net profit at 37m in 1Q2017, of which 29m from international operations Core pre-provision income up 9.6% y-o-y Second quarter of negative NPE formation (- 72m) NPEs
28 July 2017 PORTUGAL. First half 2017
 28 July 2017 PORTUGAL First half 2017 Disclaimer Banco Santander, S.A. ("Santander") cautions that this presentation contains statements that constitute forward-looking statements within the meaning of
Preliminary Group Financial Results for the year ended 31 December 2015
 Announcement Preliminary Group Financial Results for the year ended 31 December 2015 Nicosia, 25 February 2016 Key Highlights Good progress in tackling delinquent loans; During FY2015, 90+ DPD were reduced
1Q18 Financial Results. May 31 st, 2018
 1Q18 Financial Results May 31 st, 2018 Important Notice Forward Looking Information No representation or warranty, express or implied, is or will be made in relation to, and no responsibility is or will
1Q2018 Financial Results 1
 1 1Q2018 Financial Results 1 Net profit 2 57m in 1Q2018 versus 34m in 1Q2017 Core pre-provision income stable y-o-y to 200m Operating expenses down 1.3% y-o-y International operations net profit 2 33m,
EUROBANK ERGASIAS S.A.
 FOR THE THREE MONTHS ENDED 31 MARCH 2018 8 Othonos Street, Athens 105 57, Greece www.eurobank.gr, Tel.: (+30) 210 333 7000 General Commercial Registry Νο: 000223001000 Index to the Condensed Consolidated
BZWBK Group. Results 1Q12. April 26 th, 2012
 BZWBK Group Results 1Q12 April 26 th, 2012 2 This presentation as regards the forward looking statements is exclusively informational in nature and cannot be treated as an offering or recommendation to
24 April Portugal. Q1'18 Earnings Presentation
 24 April 2018 Portugal Q1'18 Earnings Presentation Disclaimer Banco Santander, S.A. ("Santander") cautions that this presentation contains statements that constitute forward-looking statements within the
Assets & Liabilities of ATEbank. 30 July 2012
 Transfer of Selected Assets & Liabilities of ATEbank to Piraeus Bank 30 July 2012 Piraeus and ATE Joining Forces 2 1. Two highly recognisable banking brand names in Greece, Piraeus & ATE, are joining forces
24 April Poland. Q1'18 Earnings Presentation
 24 April 2018 Poland Q1'18 Earnings Presentation Disclaimer Banco Santander. S.A. ("Santander") and Banco Bank Zachodni WBK. S.A. ( BZ WBK ) caution that this presentation contains statements that constitute
31 October Spain. 9M'18 Earnings Presentation
 31 October 2018 Spain 9M'18 Earnings Presentation Disclaimer Banco Santander, S.A. ("Santander") cautions that this presentation contains statements that constitute forward-looking statements within the
FY2017 Financial Results 1
 1 FY2017 Financial Results 1 Net profit 2 186m in 2017 Core pre-provision income up 5.4% y-o-y to 837m Operating expenses down 0.9% y-o-y International operations net profit 2 130m in 2017 NPEs stock down
2Q2018 Financial Results
 2Q2018 Financial Results Net profit 1 55m in 2Q2018 and 113m in 1H2018 Core pre-provision income up 6.3% q-o-q and 1.3% y-o-y Operating expenses down 3.4% y-o-y in Greece and 2.0% for the Group International
Annual Financial Report 2012 Annual Financial Report 2012: 1) Results Announcement 2) Results Presentation 3) Annual Financial Report 2012
 Results Announcement 2) Results Presentation 3) Annual Financial Report 2012") Annual Financial Report 2012 Annual Financial Report 2012: 1) Results Announcement 2) Results Presentation 3) Annual Financial Report 2012 0001/00004713/en Annual Financial Report BANK OF CYPRUS PUBLIC
Annual Financial Report 2012 Annual Financial Report 2012: 1) Results Announcement 2) Results Presentation 3) Annual Financial Report 2012 0001/00004713/en Annual Financial Report BANK OF CYPRUS PUBLIC
Announcement. Audited Group Financial Results for the year ended 31 December Nicosia, 31 March 2016
 Announcement Audited Group Financial Results for the year ended 31 December 2015 Nicosia, 31 March 2016 Key Highlights Good progress in tackling delinquent loans; During FY2015, 90+ DPD were reduced by
2Q18 Financial Results. August 31 st, 2018
 2Q18 Financial Results August 31 st, 2018 Important Notice Forward Looking Information No representation or warranty, express or implied, is or will be made in relation to, and no responsibility is or
Unicaja Banco 3Q17 Results Presentation
 Unicaja Banco 3Q17 Results Presentation 31 st October 2017 0 Disclaimer This presentation (the Presentation) has been prepared by Unicaja Banco, S.A. (the Company or Unicaja Banco) for informational use
3Q18 Financial Results. November 29 th, 2018
 3Q18 Financial Results November 29 th, 2018 Important Notice Forward Looking Information No representation or warranty, express or implied, is or will be made in relation to, and no responsibility is or
Management Discussion and Analysis
 Management Discussion and Analysis For the second quarter and first half ended June 30, 2018 The Siam Commercial Bank Public Company Limited The Siam Commercial Bank Public Company Limited 9 Ratchadapisek
H R e s u l t s. August 31, 2017
 H 1 2 0 1 7 R e s u l t s August 31, 2017 Table of Contents Pages I. Macroeconomic Update 3 II. H1 17 Performance Highlights 7 III. H1 17 Performance 20 1. Balance Sheet 20 2. Pre Provision Income 22 3.
FULL YEAR 2006 RESULTS FEBRUARY 8, 2006
 FULL YEAR 26 RESULTS FEBRUARY 8, 26 Cautionary Statement Regarding Forward-Looking Information PAGE 2 This presentation may contain projections or other forward looking statements related to EFG Eurobank
THE CYPRUS ECONOMY CHARTBOOK June Bank of Cyprus Economic Research
 THE CYPRUS ECONOMY CHARTBOOK June 2018 Bank of Cyprus Economic Research Table of contents Economic activity 3 GDP by expenditures 4 Consumer prices 5 Labour market 6 Industry 7 Construction 8 Tourism 9
ANNUAL FINANCIAL REPORT
 ANNUAL FINANCIAL REPORT From 1 st January to 31 st December 2016 (In accordance with Law 3556/2007) 1 ATTIC A BANK S. A. A NNUAL F I N AN C I A L R E P OR T F OR THE P E R I O D F RO M 1 S T J A N UA R
24 April Spain. Q1'18 Earnings Presentation
 24 April 2018 Spain Q1'18 Earnings Presentation Disclaimer Banco Santander, S.A. ("Santander") cautions that this presentation contains statements that constitute forward-looking statements within the
Greek Banks Key Challenges and Rating Drivers the Difficult Way Ahead
 Greek Banks Key Challenges and Rating Drivers the Difficult Way Ahead Nondas Nicolaides Vice President - Senior Credit Office EMEA Banking 9 November, 2017 Agenda 1. Moody s rating methodology and Greek
3Q17 Financial Results. November 22 nd, 2017
 3Q17 Financial Results November 22 nd, 2017 Important Notice Forward Looking Information No representation or warranty, express or implied, is or will be made in relation to, and no responsibility is or
Portugal Q Portugal. Lisbon, April 26th 2012
 Q1 2012 Lisbon, April 26th 2012 Disclaimer 2 Banco Santander, S.A. ("Santander") cautions that this presentation contains forward-looking statements within the meaning of the US Private Securities Litigation
Bank Handlowy w Warszawie S.A. Preliminary consolidated financial results for 2017
 Bank Handlowy w Warszawie S.A. Preliminary consolidated financial results for 2017 February 14th, 2018 www.citihandlowy.pl Bank Handlowy w Warszawie S.A. 2017 Summary Increasing profit on customer business
2018 Combined Financial Results. Air Bank, Home Credit Czech Republic and Home Credit Slovak Republic. 6 February 2019
 2018 Combined Financial Results Air Bank, Home Credit Czech Republic and Home Credit Slovak Republic 6 February 2019 Note: Unaudited combined IFRS figures DISCLAIMER GENERAL THIS PRESENTATION DOES NOT
Unicaja Banco 1H 2017 Results Presentation
 Unicaja Banco 1H 2017 Results Presentation 31 July 2017 0 Disclaimer This presentation (the Presentation) has been prepared by Unicaja Banco, S.A. (the Company or Unicaja Banco) for informational use only.
2017 Results. 27 February 2018
 2017 Results 27 February 2018 FY17 Financial Performance 37.8p EPS 1 +29% 192.1m Stat profit 2 +37% RoTE of 14% up from 12.4% in FY16 13.8% CET1 Ratio 6.0p Total dividend +18% 297p TNAV +9% Note: (1) Basic
Sector Update. March 10, 2015
 Equity Research Banks Persisting Liquidity and Funding Pressures The political turmoil over the past three months has created a supressed operating environment for the Greek banks; deposits have reached
24 April Mexico. Q1'18 Earnings Presentation
 24 April 2018 Mexico Q1'18 Earnings Presentation Disclaimer Banco Santander, S.A. ("Santander") cautions that this presentation contains statements that constitute forward-looking statements within the
GREECE Macro Flash. Draft Government Budget Fiscal policy continues towards ambitious targets
 29 21 211 212 213 214 21 216 217e 218f NATIONAL BANK OF GREECE Greece: Macro View July 214 GREECE Macro Flash N A T I O N A L B A N K O F G R E E C E Draft Government Budget 218 The draft government budget
November 28, 2011 Nine Month 2011 Results
 SW-EUB022-2007-03-19-CMD-V7 November 28, 2011 Nine Month 2011 Results 3Q 2011 results highlights Page 2 3Q11 net profit at 13m, 9M11 operating net profit* at 89m. 9M11 New Europe profits at 50m. Bottom
31 October Mexico. 9M'18 Earnings Presentation
 31 October 2018 Mexico 9M'18 Earnings Presentation Disclaimer Banco Santander, S.A. ("Santander") cautions that this presentation contains statements that constitute forward-looking statements within the
FY 2015 Results. March 3, 2016
 FY 2015 Results March 3, 2016 Table of Contents Pages I. Q4 15 Performance Highlights 3 II. FY 2015 Performance 18 1. Balance Sheet 18 2. Pre Provision Income 20 3. Asset Quality 26 4. Liquidity 33 5.
Investor Presentation Merger of Grivalia into Eurobank to create undisputed Leader in Banking and Real Estate Market in Greece.
 Investor Presentation Merger of Grivalia into Eurobank to create undisputed Leader in Banking and Real Estate Market in Greece 26 November 2018 1 This presentation has been prepared by Grivalia Properties
Portuguese Banking System: latest developments. 2 nd quarter 2018
 Portuguese Banking System: latest developments 2 nd quarter 218 Lisbon, 218 www.bportugal.pt Prepared with data available up to 26 th September of 218. Macroeconomic indicators and banking system data
FY 2014 Results. March 19, 2015
 FY 2014 Results March 19, 2015 Table of Contents Pages I. FY 2014 Results Highlights 3 II. Appendix Asset Quality 17 III. Appendix Performance 21 1. Results Overview 22 2. International Operations 29 3.
Bank Millennium Group. Presentation of 3rd Quarter 2011 Results. 21st October 2011
 Bank Millennium 1 Half 2011 results Bank Millennium Group Presentation of 3rd Quarter 2011 Results 21st October 2011 Disclaimer This presentation (the Presentation ) has been prepared by Bank Millennium
NOVO BANCO GROUP ACTIVITY AND RESULTS. 1 st Half 2018
 Announcement Lisbon, 23 August 2018 NOVO BANCO GROUP ACTIVITY AND RESULTS 1 st Half 2018 (Unaudited financial information) NOVO BANCO 1H2018 Results of - 231.2 million show 20% improvement compared with
31 October Poland. 9M'18 Earnings Presentation
 31 October 2018 Poland 9M'18 Earnings Presentation Disclaimer Banco Santander. S.A. ("Santander") and Banco Bank Zachodni WBK. S.A. ( BZ WBK ) caution that this presentation contains statements that constitute
ECB Greek Comprehensive Assessment Results. 1 November 2015
 ECB Greek Comprehensive Assessment Results 1 November 2015 Disclaimer By attending the meeting where this presentation is made, or by reading the presentation slides, you agree to be bound by the following
I N V E S T O R P R E S E N TAT I O N. March 2016
 I N V E S T O R P R E S E N TAT I O N March 2016 Table of Contents Pages I. Q4 15 Performance Highlights 3 II. FY 2015 Performance 18 1. Balance Sheet 18 2. Pre Provision Income 20 3. Asset Quality 26
TMB Bank Plc. Building the Best Transactional Bank. Make THE Difference. Day with Executive Management
 TMB Bank Plc. Building the Best Transactional Bank Day with Executive Management November 1, 215 Make THE Difference AGENDA 3Q15 Financial Performance 9M15 Financial Performance Looking Forward [2] Executive
Corporate presentation. June 2018
 Corporate presentation June 2018 Important Notice Forward Looking Information No representation or warranty, express or implied, is or will be made in relation to, and no responsibility is or will be accepted
Portugal Q Portugal. Lisbon, July 27th 2011
 Q2 2011 Lisbon, July 27th 2011 Disclaimer 2 Banco Santander, S.A. ("Santander") cautions that this presentation contains forward-looking statements within the meaning of the US Private Securities Litigation
31 January 2018 BRAZIL. January December 2017
 31 January 2018 BRAZIL January December 2017 Disclaimer Banco Santander, S.A. ("Santander") cautions that this presentation contains statements that constitute forward-looking statements within the meaning
Results for for the period period from from 4 August 31 December March 2015
 Results for the period from 4 August to 31 December 2014 9 March 2015 Agenda 1. Main Highlights 2. Funding and Liquidity 3. Capital 4. Asset Quality 5. Sale of BESI 6. Results 7. Summary Appendix I: Detailed
PRESENTATION 9M.17 GROUP FINANCIAL RESULTS
 PRESENTATION 9M.17 GROUP FINANCIAL RESULTS November 2017 28 November 2017 TABLE OF CONTENTS 01 HIGHLIGHTS 02 FINANCIALS 03 ASSET QUALITY 04 LIQUIDITY 05 APPENDIΧ 01. H I G H L I G H TS Note: as of Q1.2017
KBC Group. 2Q and 1H 2018 results Press presentation. Johan Thijs, KBC Group CEO Rik Scheerlinck, KBC Group CFO
 KBC Group 2Q and 1H 2018 results Press presentation Johan Thijs, KBC Group CEO Rik Scheerlinck, KBC Group CFO 1 More detailed analyst presentation available at www.kbc.com Important information for investors
Corporate presentation. December 2017
 Corporate presentation December 2017 Important Notice Forward Looking Information No representation or warranty, express or implied, is or will be made in relation to, and no responsibility is or will
31 January 2017 POLAND. January December 2017
 31 January 2017 POLAND January December 2017 Disclaimer Banco Santander, S.A. ("Santander") and Banco Bank Zachodni WBK, S.A. ( BZ WBK ) caution that this presentation contains statements that constitute
26 October 2017 POLAND. January September 2017
 26 October 2017 POLAND January September 2017 Disclaimer Banco Santander, S.A. ("Santander") and Banco Bank Zachodni WBK, S.A. ( BZ WBK ) caution that this presentation contains statements that constitute
VFB-Happening Rik Scheerlinck, KBC Group CFO
 Rik Scheerlinck, KBC Group CFO Important information for investors This presentation is provided for information purposes only. It does not constitute an offer to buy or sell any security issued by an
Preliminary Financial Results of Alpha Bank Cyprus Ltd for the year 2015 [ ]
![Preliminary Financial Results of Alpha Bank Cyprus Ltd for the year 2015 [ ]](/thumbs/90/102860682.jpg "Preliminary Financial Results of Alpha Bank Cyprus Ltd for the year 2015 [ ]") Preliminary Financial Results of Alpha Bank Cyprus Ltd for the year 2015 [29.2.2016] Main Highlights - Strong Capital Base with Common Equity Tier 1 ratio at 17.5% on 31.12.2015 - After tax losses of Euro44.7
Preliminary Financial Results of Alpha Bank Cyprus Ltd for the year 2015 [29.2.2016] Main Highlights - Strong Capital Base with Common Equity Tier 1 ratio at 17.5% on 31.12.2015 - After tax losses of Euro44.7
Financial Results to 31 March May 11 th 2018
 Financial Results to 31 March 2018 May 11 th 2018 dobank team presenting today General Manager of Fincantieri in 2015 From 2013 to 2015 Chairman and CEO of Sorgenia CFO, General Manager of International
TITLE SLIDE IS IN SENTENCE CASE. GREEN BACKGROUND.
 TITLE SLIDE IS IN SENTENCE CASE. GREEN BACKGROUND. BANK OF AMERICA MERRILL LYNCH CEO CONFERENCE António Horta-Osório 00 Month 0000 Presenters Name 29 September 2015 AGENDA A differentiated business model
Real 2017 Q Q Q1 Jan Sep QoQ YoY QoQ YoY QoQ YoY YoY GDP Cp
 ISSN: 1791 35 35 December 8, 2017 Dr. Stylianos G. Gogos Economic Analyst sgogos@eurobank.gr Greek Real GDP +0.3 QoQ% / +1.3 YoY% in 2017Q3 Growth remains on a positive territory for a third quarter in
BBVA posts highest quarterly profit in three years: 1.34 billion (+12 percent YoY)
") Press release 04.27.2018 January - March 2018 BBVA posts highest quarterly profit in three years: 1.34 billion (+12 percent YoY) Transformation: Digital sales grew in all regions and accounted for 37 percent
Press release 04.27.2018 January - March 2018 BBVA posts highest quarterly profit in three years: 1.34 billion (+12 percent YoY) Transformation: Digital sales grew in all regions and accounted for 37 percent
25 July Spain. H1'18 Earnings Presentation
 25 July 2018 Spain H1'18 Earnings Presentation Disclaimer Banco Santander, S.A. ("Santander") cautions that this presentation contains statements that constitute forward-looking statements within the meaning
Quarterly results presentation
 Quarterly results presentation 1Q 2017 28 April 2017 1 Disclaimer This document was originally prepared in Spanish. The English version published here is for information purposes only. In the event of
[Insert Subheading] Click to edit Master text styles. Shop Direct Limited. Q1 FY18 Results. Three months ended 30 September 2017.
![[Insert Subheading] Click to edit Master text styles. Shop Direct Limited. Q1 FY18 Results. Three months ended 30 September 2017.](/thumbs/75/71763350.jpg "[Insert Subheading] Click to edit Master text styles. Shop Direct Limited. Q1 FY18 Results. Three months ended 30 September 2017.") [Insert Subheading] Click to edit Master text styles Shop Direct Limited Q1 FY18 Results Three months ended 30 September 2017 7 December 2017 1 Disclaimer This presentation (the Presentation ) has been
[Insert Subheading] Click to edit Master text styles Shop Direct Limited Q1 FY18 Results Three months ended 30 September 2017 7 December 2017 1 Disclaimer This presentation (the Presentation ) has been
Portuguese Banking System: latest developments. 4 th quarter 2017
 Portuguese Banking System: latest developments 4 th quarter 217 Lisbon, 218 www.bportugal.pt Prepared with data available up to 2 th March of 218. Macroeconomic indicators and banking system data are
Principal monitoring indicators for the Spanish banking system
 Principal monitoring indicators for the Spanish banking system Table 1 Abridged balance sheet for the banking system. (EUR bn and % var.) Assets Date 00-'08 latest y-on-y Total lending 2,106 1,951 1,716
THIS ANNOUNCEMENT CONTAINS INSIDE INFORMATION FOR THE PURPOSES OF ARTICLE 7 OF EU REGULATION 596/2014. ANNOUNCEMENT
 25 June 2018 THIS ANNOUNCEMENT CONTAINS INSIDE INFORMATION FOR THE PURPOSES OF ARTICLE 7 OF EU REGULATION 596/2014. ANNOUNCEMENT HELLENIC BANK S AGREEMENT TO ACQUIRE CERTAIN ASSETS AND LIABILITIES OF THE
30 January Portugal Earnings Presentation
 30 January 2019 Portugal 2018 Earnings Presentation Disclaimer Banco Santander, S.A. ("Santander") cautions that this presentation contains statements that constitute forward-looking statements within
Aldermore Group PLC. Investor presentation. Full Year Results 2015
 Aldermore Group PLC Investor presentation Full Year Results 2015 A year on from IPO. 1 Delivered another excellent set of financial results 2 Generating attractive and sustainable returns 3 Strong balance
2018 Stress Test. May 5 th, 2018
 2018 Stress Test May 5 th, 2018 Important Notice Forward Looking Information No representation or warranty, express or implied, is or will be made in relation to, and no responsibility is or will be accepted
30 January Mexico Earnings Presentation
 30 January 2019 Mexico 2018 Earnings Presentation Disclaimer Banco Santander, S.A. ("Santander") cautions that this presentation contains statements that constitute forward-looking statements within the
Bank Millennium Group
 Bank Millennium Group Bank Millennium Strategy, Summary of L series share issue and Presentation for 2009 results Bank Millennium s General Shareholders Meeting 22 April 2010 Disclaimer This presentation
25 July Mexico. H1'18 Earnings Presentation
 25 July 2018 Mexico H1'18 Earnings Presentation Disclaimer Banco Santander, S.A. ("Santander") cautions that this presentation contains statements that constitute forward-looking statements within the