Assessing the impact of the EU ETS using firm level data. Jan Abrell, Anta Ndoye Faye, Georg Zachmann
|
|
|
- Bethany Fitzgerald
- 5 years ago
- Views:
Transcription


1 Assessing the impact of the EU ETS using firm level data Jan Abrell, Anta Ndoye Faye, Georg Zachmann
2 The EU Emission trading scheme (EU ETS) Incentivise the most economic mitigation efforts by Capping carbon emissions Making carbon permits a tradable good 6 years of experience with ETS imply an empirical assessment of Its effectiveness (did it deliver reductions) Its impact on the company s performance (added value, profit margin, employment)
3 Literature Effectiveness: Ellerman and Buchner (2006), Grubb and al. (2009), Ellerman and al. (2010) Results: main reduction of emission took place between Drawback: Short period analysis (2 or 3 years), lack of counterfactual Competitiveness: D ly and Quirion (2008), Anger and Oberndorfer (2008) Results: modest competiveness losses in the first phase Drawback: Static analysis, sector specific or country specific, lack of counterfactual
4 The two phases of the EU ETS : trial phase (first phase) Grandfathering of allowances No banking : second phase Mainly Grandfathering of allowances Banking emissions in the regulated sectors increased by 2 % due to a high cap and the import of offsets Tighter cap, the amount of allowances distributed was reduced from 2007 to 2008 by about 11 percent Daily Closing Price EUA spot


5 ETS emissions by country Phase I Phase II Crisis year

6 ETS emissions by sector
7 Data CITL emission data Allocated emissions Verified emissions Allocation factor: the quotient of free allocation of emissions allocated to the verified emissions AMADEUS Profit Margin, Employment, Turnover, Added Value, Fixed Capital Both sets matched via adresses For CITL installations we got 2101 AMADEUS companies(3696 installations), representing 59% of the emissions Company level data allows us to: Control emission reductions for company performance Analyse whether being included in the ETS had an effect on company performance
8 Meadian allocation factor 1,16 1,14 1,12 1,1 1,08 1,06 Germany 1, Amadeus companies CITL Median allocation factor 1,3 1,25 1,2 1,15 1,1 Poland 1, Amadeus companies CITL Not a perfect match but reasonable!
9 Effectiveness of the EU ETS Our goal is to analyse whether companies changed their emission reduction strategy from to We use a diffs in diffs in diffs approach applied to the following equation y t it d 0 1 it cv 1, it 2005,2006,2007, cv 3 2, it it => thus, we analyse the change in speed in emission reduction between the first and the second phase
10 Results Dependant variable Growth rate of emissions ( ) - Growth rate of emissions ( ) Total Sample(1) AF05 <1.15(2) AF05>1.15(3) Phase dummy **(0.015) *** (0.011) (0.03) changes in 0.191***( 0.028) 0.19***(0.04) 0.21***( 0.04) turnover changes in labour (0.025) ( 0.02) 0.07 (0.05) size Adj R-squared Significance: * at 10%, ** at 5 % and *** at 1%. Standard errors are reported in brackets The tighter cap in Phase II was effective since emissions decrease Under allocated companies in allowances for 2005 reduced their emissions the most
11 Results Paper and paper products 416 firms Non-metallic minerals 806 firms Basic metals 159 firms Electricty heat 660 firms Phase dummy (0.027) ***(0.025) *(0.049) (0.038) changes in turnover changes in labor size 0.154**( 0.077) 0.299***(0.058) 0.089(0.126) 0.136**(0.06) (0.093) (0.044) 0.099(0.208) 0.012(0.042) Adj R-squared Significance: * at 10%, ** at 5 % and *** at 1%. Standard errors are reported in brackets Non metallic minerals and basic metals carried out the main reduction effort No significant effect of moving to a tighter cap for energy and paper sectors
12 Impact of EU ETS on the firm performance Impact of the EU ETS on firm added value, employment (labour size) and profitability (profit margin) With a matching procedure based on a propensity score, we construct a control group in order to assess this counterfactual effect The following two period fixed effect model (before and after treatment) is then estimated in first differences: y it 0 1 d 1,it 2 d 2,it 3 x it 4 cv it it,t 0,1 y i 1 2 d 2,i 3 x i 4 cv i u i ˆ 2 y T y C
13 Added Value Dependent variable Added value Total sample (4202 firms) Period (1)= (2)= Impact of EU ETS (0.08) (0.08) Changes in fixed capital 0.08***(0.01) 0.06***(0.01) Changes in employment 0.11***(0.01) 0.10***(0.02) Adj R-squared Under allocated firms (AF<1) (1) 1436 firms (2) 1538 firms Impact of EU ETS (0.04) (0.06) Changes in fixed capital 0.08***(0.01) 0.11***(0.01) Changes in employment 0.16***(0.02) 0.17***(0.02) Adj R-squared Over allocated firms (AF>1) (1) 2766 firms (2) 2664 firms Impact of EU ETS (0.07) -0.12(0.10) Changes in fixed capital 0.05**(0.02) 0.07***(0.02) Changes in employment 0.08***(0.02) 0.09***(0.02) Adj R-squared No impact on added value for the two periods
14 Profit Margin Dependent variable Profit margin Total Sample Period (1)= (2)= Impact of EU ETS (0.45) *(0.37) Changes in employment -0.59*(0.32) -0.52(0.32) Changes in turnover 3.91***(0.21) 3.67***(0.21) Adj R-squared Under allocated firms (AF<1) Impact of EU ETS (0.31) *(1.11) Changes in employment -0.42(0.43) -0.34(0.43) Changes in turnover 2.61***(0.27) 2.54(0.27) Adj R-squared Over allocated firms (AF>1) Impact of EU ETS 2.14* (1.25) 2.32 *(1.29) Changes in employment -0.95**(0.50) -0.87*(0.49) Changes in turnover 5.29***(0.35) 5.07***(0.34) Adj R-squared Overallocated firms have benefited significantly from the EU ETS in terms of profitability Underallocated Firms did lose Overall effect surprisingly negative
15 Employment Dependent variable Employment Total sample Period (1)= (2)= Impact of EU ETS (0.002) **(0.004) Changes in employment 0.50***(0.002) 0.52***(0.02) Changes in turnover 0.04***(0.02) 0.05***(0.02) Adj R-squared Under allocated firms (AF<1) Period (1) (2) Impact of EU ETS (0.003) (0.095) Changes in employment 0.49***(0.002) 0.50***(0.002) Changes in turnover 0.04***0.003) 0.03***(0.003) Adj R-squared Over allocated firms (AF>1) Period (1) (2) Impact of EU ETS **(0.004) (0.002) Changes in employment 0.52***(0.002) 0.51***(0.003) Changes in turnover 0.05***(0.004) 0.06 ***(0.005) Adj R-squared Overallocated firms have increased slightly their employment level after the launch of EU ETS.
16 Conclusion Phase II is promising compared to Phase I The magnitude of the impact appears small Limited impact on economic performance Extension 1: Include more years of the ETS to capture longer-term effects such as investments Extension 2: Effectiveness regression performed on a susbsample division that take into account the reduction of allowances distributed in 2008 compared to 2007
17 APPENDIX

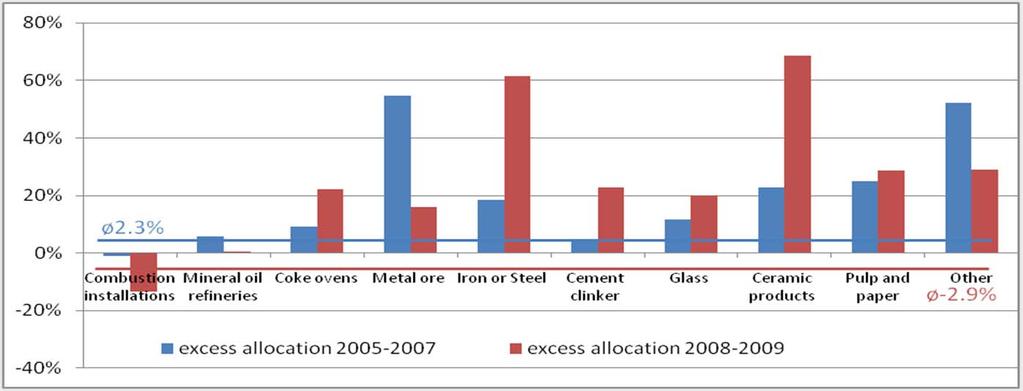
18 Excess allocation by sector and country
19 Median Allocation factor SAMPLE REPRESENTATIVENESS France 1,5 1 0,5 Median allocation factor Median allocation factor UK 1,2 1,15 1,1 1,05 1 0, Poland 1,3 1,25 1,2 1,15 1,1 1, Amadeus companies CITL Amadeus companies CITL Amadeus companies CITL
20 Median Allocation Factor 1,25 1,2 1,15 1,1 1,05 Spain Amadeus companies CITL
21 Sectoral and regional distribution (Amadeus Companies) Sectors Number of firms Frequency (%) Other non-metallic mineral products Electricity and heat Paper and paper products Basic metals Coke and refined petroleum products Countries Spain Germany Portugal France Czech Republic Poland Italy Finland UK-Ireland Bulgaria- Romania Sweden Austria Belgium-Luxembourg Slovakia Netherlands Denmark Slovenia-Hungary Estonia-Latvia-Lithuania
22 Descriptive statistics Added value Employees Fixed Capital Profit Margin Allocation Factor 1% % % Median Mean % % Std
EU-28 RECOVERED PAPER STATISTICS. Mr. Giampiero MAGNAGHI On behalf of EuRIC
 EU-28 RECOVERED PAPER STATISTICS Mr. Giampiero MAGNAGHI On behalf of EuRIC CONTENTS EU-28 Paper and Board: Consumption and Production EU-28 Recovered Paper: Effective Consumption and Collection EU-28 -
European Advertising Business Climate Index Q4 2016/Q #AdIndex2017
 European Advertising Business Climate Index Q4 216/Q1 217 ABOUT Quarterly survey of European advertising and market research companies Provides information about: managers assessment of their business
EU BUDGET AND NATIONAL BUDGETS
 DIRECTORATE GENERAL FOR INTERNAL POLICIES POLICY DEPARTMENT ON BUDGETARY AFFAIRS EU BUDGET AND NATIONAL BUDGETS 1999-2009 October 2010 INDEX Foreward 3 Table 1. EU and National budgets 1999-2009; EU-27
Live Long and Prosper? Demographic Change and Europe s Pensions Crisis. Dr. Jochen Pimpertz Brussels, 10 November 2015
 Live Long and Prosper? Demographic Change and Europe s Pensions Crisis Dr. Jochen Pimpertz Brussels, 10 November 2015 Old-age-dependency ratio, EU28 45,9 49,4 50,2 39,0 27,5 31,8 2013 2020 2030 2040 2050
REPORT FROM THE COMMISSION TO THE EUROPEAN PARLIAMENT, THE COUNCIL, THE EUROPEAN ECONOMIC AND SOCIAL COMMITTEE AND THE COMMITTEE OF THE REGIONS
 EUROPEAN COMMISSION Brussels,.4.29 COM(28) 86 final/ 2 ANNEXES to 3 ANNEX to the REPORT FROM THE COMMISSION TO THE EUROPEAN PARLIAMENT, THE COUNCIL, THE EUROPEAN ECONOMIC AND SOCIAL COMMITTEE AND THE COMMITTEE
GA No Report on the empirical assessment of monitoring and enforcement of EU ETS regulation
 GA No.308481 Report on the empirical assessment of monitoring and enforcement of EU ETS regulation Antoine Dechezleprêtre London School of Economics, LSE Executive Summary This report presents the first
DG TAXUD. STAT/11/100 1 July 2011
 DG TAXUD STAT/11/100 1 July 2011 Taxation trends in the European Union Recession drove EU27 overall tax revenue down to 38.4% of GDP in 2009 Half of the Member States hiked the standard rate of VAT since
EUROPA - Press Releases - Taxation trends in the European Union EU27 tax...of GDP in 2008 Steady decline in top corporate income tax rate since 2000
 DG TAXUD STAT/10/95 28 June 2010 Taxation trends in the European Union EU27 tax ratio fell to 39.3% of GDP in 2008 Steady decline in top corporate income tax rate since 2000 The overall tax-to-gdp ratio1
Content. Allocation: Free allocation and auctioning. Experiences from the EU
 Allocation: Free allocation and auctioning Experiences from the EU 3rd Annual CEEM Conference, 30th of November 2007 Presented by Dr. Regina Betz Content Allocation options Phase I (2005-2007) Phase II
EMPLOYMENT RATE IN EU-COUNTRIES 2000 Employed/Working age population (15-64 years)
") EMPLOYMENT RATE IN EU-COUNTRIES 2 Employed/Working age population (15-64 years EU-15 Denmark Netherlands Great Britain Sweden Portugal Finland Austria Germany Ireland Luxembourg France Belgium Greece Spain
EMPLOYMENT RATE IN EU-COUNTRIES 2 Employed/Working age population (15-64 years EU-15 Denmark Netherlands Great Britain Sweden Portugal Finland Austria Germany Ireland Luxembourg France Belgium Greece Spain
Approach to Employment Injury (EI) compensation benefits in the EU and OECD
 compensation benefits in the EU and OECD") Approach to (EI) compensation benefits in the EU and OECD The benefits of protection can be divided in three main groups. The cash benefits include disability pensions, survivor's pensions and other short-
Approach to (EI) compensation benefits in the EU and OECD The benefits of protection can be divided in three main groups. The cash benefits include disability pensions, survivor's pensions and other short-
EMPLOYMENT RATE Employed/Working age population (15-64 years)
") 1 EMPLOYMENT RATE 1980-2003 Employed/Working age population (15-64 years 80 % Finland (Com 75 70 65 60 EU-15 Finland (Stat. Fin. 55 50 80 82 84 86 88 90 92 94 96 98 00 02 9.9.2002/SAK /TL Source: European
1 EMPLOYMENT RATE 1980-2003 Employed/Working age population (15-64 years 80 % Finland (Com 75 70 65 60 EU-15 Finland (Stat. Fin. 55 50 80 82 84 86 88 90 92 94 96 98 00 02 9.9.2002/SAK /TL Source: European
EU KLEMS Growth and Productivity Accounts March 2011 Update of the November 2009 release
 EU KLEMS Growth and Productivity Accounts March 2011 Update of the November 2009 release Description of methodology and country notes Prepared by Reitze Gouma, Klaas de Vries and Astrid van der Veen-Mooij
EIOPA Statistics - Accompanying note
 EIOPA Statistics - Accompanying note Publication references: Published statistics: [Balance sheet], [Premiums, claims and expenses], [Own funds and SCR] Disclaimer: Data is drawn from the published statistics
EIOPA Statistics - Accompanying note
 EIOPA Statistics - Accompanying note Publication reference: Published statistics: [Balance sheet], [Premiums, claims and expenses], [Own funds and SCR] Disclaimer: Data is drawn from the published statistics
Lowest implicit tax rates on labour in Malta, on consumption in Spain and on capital in Lithuania
 STAT/13/68 29 April 2013 Taxation trends in the European Union The overall tax-to-gdp ratio in the EU27 up to 38.8% of GDP in 2011 Labour taxes remain major source of tax revenue The overall tax-to-gdp
2017 Figures summary 1
 Annual Press Conference on January 18 th 2018 EIB Group Results 2017 2017 Figures summary 1 European Investment Bank (EIB) financing EUR 69.88 billion signed European Investment Fund (EIF) financing EUR
EMPLOYMENT RATE Employed/Working age population (15 64 years)
") EMPLOYMENT RATE 198 26 Employed/Working age population (15 64 years 8 % Finland 75 EU 15 EU 25 7 65 6 55 5 8 82 84 86 88 9 92 94 96 98 2 4** 6** 14.4.25/SAK /TL Source: European Commission 1 UNEMPLOYMENT
EMPLOYMENT RATE 198 26 Employed/Working age population (15 64 years 8 % Finland 75 EU 15 EU 25 7 65 6 55 5 8 82 84 86 88 9 92 94 96 98 2 4** 6** 14.4.25/SAK /TL Source: European Commission 1 UNEMPLOYMENT
THE IMPACT OF THE PUBLIC DEBT STRUCTURE IN THE EUROPEAN UNION MEMBER COUNTRIES ON THE POSSIBILITY OF DEBT OVERHANG
 THE IMPACT OF THE PUBLIC DEBT STRUCTURE IN THE EUROPEAN UNION MEMBER COUNTRIES ON THE POSSIBILITY OF DEBT OVERHANG Robert Huterski, PhD Nicolaus Copernicus University in Toruń Faculty of Economic Sciences
Dividends from the EU to the US: The S-Corp and its Q-Sub. Peter Kirpensteijn 23 September 2016
 Dividends from the EU to the : The S-Corp and its Q-Sub Peter Kirpensteijn 23 September 2016 The Inc: large multinational manufacturing company residents The LLC: holding company owned by tax residents
Measuring financial protection: an approach for the WHO European Region
 Division of Health Systems and Public Health WHO Regional Office for Europe Measuring financial protection: an approach for the WHO European Region Jon Cylus WHO Barcelona Office for Health Systems Strengthening
Analysis of European Union Economy in Terms of GDP Components
 Expert Journal of Economic s (2 0 1 3 ) 1, 13-18 2013 Th e Au thor. Publish ed by Sp rint In v estify. Econ omics.exp ertjou rn a ls.com Analysis of European Union Economy in Terms of GDP Components Simona
Report Penalties and measures imposed under the UCITS Directive in 2016 and 2017
 Report Penalties and measures imposed under the Directive in 206 and 207 4 April 209 ESMA34-45-65 4 April 209 ESMA34-45-65 Table of Contents Executive Summary... 3 2 Background and relevant regulatory
Electricity & Gas Prices in Ireland. Annex Business Electricity Prices per kwh 2 nd Semester (July December) 2016
 2016") Electricity & Gas Prices in Ireland Annex Business Electricity Prices per kwh 2 nd Semester (July December) 2016 ENERGY POLICY STATISTICAL SUPPORT UNIT 1 Electricity & Gas Prices in Ireland Annex Business
Electricity & Gas Prices in Ireland Annex Business Electricity Prices per kwh 2 nd Semester (July December) 2016 ENERGY POLICY STATISTICAL SUPPORT UNIT 1 Electricity & Gas Prices in Ireland Annex Business
Spain France. England Netherlands. Wales Ukraine. Republic of Ireland Czech Republic. Romania Albania. Serbia Israel. FYR Macedonia Latvia
 Germany Belgium Portugal Spain France Switzerland Italy England Netherlands Iceland Poland Croatia Slovakia Russia Austria Wales Ukraine Sweden Bosnia-Herzegovina Republic of Ireland Czech Republic Turkey
Fiscal rules in Lithuania
 Fiscal rules in Lithuania Algimantas Rimkūnas Vice Minister, Ministry of Finance of Lithuania 3 June, 2016 Evolution of National and EU Fiscal Regulations Stability and Growth Pact (SGP) Maastricht Treaty
Taxation trends in the European Union Further increase in VAT rates in 2012 Corporate and top personal income tax rates inch up after long decline
 STAT/12/77 21 May 2012 Taxation trends in the European Union Further increase in VAT rates in 2012 Corporate and top personal income tax rates inch up after long decline The average standard VAT rate 1
Key Trends of Energy Transition in the EU-28 Region
 Key Trends of Energy Transition in the EU-28 Region Jarmo Vehmas, Jyrki Luukkanen & Jari Kaivo-oja Session 13, Innovation in Future Technology June 2017, Turku Finland Futures Research Centre, Turku School
Questions and Answers 1 on the Commission's decision on national implementation measures (NIMs)
") 1 Questions and Answers 1 on the Commission's decision on national implementation measures (NIMs) 1. How much free allocation will be given in the period 2013-2020 and how does this break down by Member
1 Questions and Answers 1 on the Commission's decision on national implementation measures (NIMs) 1. How much free allocation will be given in the period 2013-2020 and how does this break down by Member
EIOPA Statistics - Accompanying note
 EIOPA Statistics - Accompanying note Publication references: and Published statistics: [Balance sheet], [Premiums, claims and expenses], [Own funds and SCR] Disclaimer: Data is drawn from the published
Enterprise Europe Network SME growth forecast
 Enterprise Europe Network SME growth forecast 2017-18 een.ec.europa.eu Foreword Since we came into office three years ago, this European Commission has put the creation of more jobs and growth at the centre
FCCC/SBI/2010/10/Add.1
 United Nations Framework Convention on Climate Change Distr.: General 25 August 2010 Original: English Subsidiary Body for Implementation Contents Report of the Subsidiary Body for Implementation on its
Borderline cases for salary, social contribution and tax
 Version Abstract 1 (5) 2015-04-21 Veronica Andersson Salary and labour cost statistics Borderline cases for salary, social contribution and tax (Workshop on Labour Cost Survey, Rome, Italy 5-6 May 2015)
How to complete a payment application form (NI)
") How to complete a payment application form (NI) This form should be used for making a payment from a Northern Ireland Ulster Bank account. 1. Applicant Details If you are a signal number indemnity holder,
How to complete a payment application form (NI) This form should be used for making a payment from a Northern Ireland Ulster Bank account. 1. Applicant Details If you are a signal number indemnity holder,
Youth Integration into the labour market Barcelona, July 2011 Jan Hendeliowitz Director, Employment Region Copenhagen & Zealand Ministry of
 Youth Integration into the labour market Barcelona, July 2011 Jan Hendeliowitz Director, Employment Region Copenhagen & Zealand Ministry of Employment, Denmark Chair of the OECD-LEED Directing Committee
CANADA EUROPEAN UNION
 THE EUROPEAN UNION S PROFILE Economic Indicators Gross domestic product (GDP) at purchasing power parity (PPP): US$20.3 trillion (2016) GDP per capita at PPP: US$39,600 (2016) Population: 511.5 million
Poverty and social inclusion indicators
 Poverty and social inclusion indicators The poverty and social inclusion indicators are part of the common indicators of the European Union used to monitor countries progress in combating poverty and social
Raising the retirement age is the labour market ready for active ageing: evidence from EB and Eurofound research
 Raising the retirement age is the labour market ready for active ageing: evidence from EB and Eurofound research Robert Anderson, EUROFOUND, Dublin Reforming pension systems in Europe and Central Asia
Name Organisation Date
 European Public Leadership Driving Innovation In Construction and Operations Name Organisation Date Construction: declining productivity and low digitalisation Productivity Digitalisation Other non-farm
Lithuania: in a wind of change. Robertas Dargis President of the Lithuanian Confederation of Industrialists
 Lithuania: in a wind of change Robertas Dargis President of the Lithuanian Confederation of Industrialists 2017 06 15 Lithuanian Confederation of Industrialists - the largest business organisation in Lithuania
CFA Institute Member Poll: Euro zone Stability Bonds
 CFA Institute Member Poll: Euro zone Stability Bonds I. About the Survey... 2 a. Background... 2 b. Purpose and Methodology... 2 II. Full Results... 2 Q1: Requirement of common issuance of sovereign bonds...
Consumer Credit. Introduction. June, the 6th (2013)
") Consumer Credit in Europe at end-2012 Introduction Crédit Agricole Consumer Finance has published its annual survey of the consumer credit market in 27 European Union countries (EU-27) for the sixth year
Consumer Credit in Europe at end-2012 Introduction Crédit Agricole Consumer Finance has published its annual survey of the consumer credit market in 27 European Union countries (EU-27) for the sixth year
Single Market Scoreboard
 Single Market Scoreboard Performance per Member State Romania (Reporting period: 2017) Transposition of law In 2016, the Member States had to transpose 66 new directives, which represents a large increase
May 2012 Euro area international trade in goods surplus of 6.9 bn euro 3.8 bn euro deficit for EU27
 108/2012-16 July 2012 May 2012 Euro area international trade in goods surplus of 6.9 3.8 deficit for EU27 The first estimate for the euro area 1 (EA17) trade in goods balance with the rest of the world
Communication on the future of the CAP
 Communication on the future of the CAP The CAP towards 2020: meeting the food, natural resources and territorial challenges of the future Tassos Haniotis, Director Agricultural Policy Analysis and Perspectives
Macroeconomic scenarios for skill demand and supply projections, including dealing with the recession
 Alphametrics (AM) Alphametrics Ltd Macroeconomic scenarios for skill demand and supply projections, including dealing with the recession Paper presented at Skillsnet technical workshop on: Forecasting
The Impact of the European Union Emissions Trading System on the Competitiveness and Employment of EU Firms in 2012
 The Impact of the European Union Emissions Trading System on the Competitiveness and Employment of EU Firms in 2012 By HAIHANG WANG * This paper examines whether the European Union Emissions Trading System
First estimate for 2011 Euro area external trade deficit 7.7 bn euro bn euro deficit for EU27
 27/2012-15 February 2012 First estimate for 2011 Euro area external trade deficit 7.7 152.8 deficit for EU27 The first estimate for the euro area 1 (EA17) trade in goods balance with the rest of the world
Chart pack to council for cooperation on macroprudential policy
 Chart pack to council for cooperation on macroprudential policy Contents List of charts... 3 Macro and macro-financial setting... 5 Swedish macroeconomic setting... 5 Foreign macroeconomic setting... Macro-financial
June 2014 Euro area international trade in goods surplus 16.8 bn 2.9 bn surplus for EU28
 127/2014-18 August 2014 June 2014 Euro area international trade in goods surplus 16.8 bn 2.9 bn surplus for EU28 The first estimate for the euro area 1 (EA18) trade in goods balance with the rest of the
11 th Economic Trends Survey of the Impact of Economic Downturn
 11 th Economic Trends Survey 11 th Economic Trends Survey of the Impact of Economic Downturn 11 th Economic Trends Survey COUNTRY ANSWERS Austria 155 Belgium 133 Bulgaria 192 Croatia 185 Cyprus 1 Czech
June 2012 Euro area international trade in goods surplus of 14.9 bn euro 0.4 bn euro surplus for EU27
 121/2012-17 August 2012 June 2012 Euro area international trade in goods surplus of 14.9 0.4 surplus for EU27 The first estimate for the euro area 1 (EA17) trade in goods balance with the rest of the world
August 2012 Euro area international trade in goods surplus of 6.6 bn euro 12.6 bn euro deficit for EU27
 146/2012-16 October 2012 August 2012 Euro area international trade in goods surplus of 6.6 12.6 deficit for EU27 The first estimate for the euro area 1 (EA17) trade in goods balance with the rest of the
DATA SET ON INVESTMENT FUNDS (IVF) Naming Conventions
 Naming Conventions") DIRECTORATE GENERAL STATISTICS LAST UPDATE: 10 APRIL 2013 DIVISION MONETARY & FINANCIAL STATISTICS ECB-UNRESTRICTED DATA SET ON INVESTMENT FUNDS (IVF) Naming Conventions The series keys related to Investment
DIRECTORATE GENERAL STATISTICS LAST UPDATE: 10 APRIL 2013 DIVISION MONETARY & FINANCIAL STATISTICS ECB-UNRESTRICTED DATA SET ON INVESTMENT FUNDS (IVF) Naming Conventions The series keys related to Investment
Tax Survey Effective tax ratesof employees with different income levels in 25countries. Ivan Fučík. Fučík & partners, Prague, Czech Republic
 Tax Survey 2012 Effective tax ratesof employees with different income levels in 25countries Ivan Fučík Fučík & partners, Prague, Czech Republic E-mail: ivan@fucik.cz www.fucik.cz Content Introduction of
Maintaining Adequate Protection in a Fiscally Constrained Environment Measuring the efficiency of social protection systems
 Maintaining Adequate Protection in a Fiscally Constrained Environment Measuring the efficiency of social protection systems May 27, 2013 Brussels, Belgium Ramya Sundaram. rsundaram@worldbank.org The World
Comparing pay trends in the public services and private sector. Labour Research Department 7 June 2018 Brussels
 Comparing pay trends in the public services and private sector Labour Research Department 7 June 2018 Brussels Issued to be covered The trends examined The varying patterns over 14 years and the impact
EU Pension Trends. Matti Leppälä, Secretary General / CEO PensionsEurope 16 October 2014 Rovinj, Croatia
 EU Pension Trends Matti Leppälä, Secretary General / CEO PensionsEurope 16 October 2014 Rovinj, Croatia 1 Lähde: World Bank 2 Pension debt big (implicit debt, % of GDP, 2006) Source:Müller, Raffelhüschen
PUBLIC PROCUREMENT INDICATORS 2011, Brussels, 5 December 2012
 PUBLIC PROCUREMENT INDICATORS 2011, Brussels, 5 December 2012 1. INTRODUCTION This document provides estimates of three indicators of performance in public procurement within the EU. The indicators are
Courthouse News Service
 14/2009-30 January 2009 Sector Accounts: Third quarter of 2008 Household saving rate at 14.4% in the euro area and 10.7% in the EU27 Business investment rate at 23.5% in the euro area and 23.6% in the
The Cyprus Economy: from Recovery to Sustainable Growth. Vincenzo Guzzo Resident Representative in Cyprus
 The Economy: from Recovery to Sustainable Growth Vincenzo Guzzo Resident Representative in Growth momentum remains strong 18 : Real GDP ( billion) 1 Deviation from Pre-Crisis Level and Trend (Percent)
Council conclusions on "First Annual Report to the European Council on EU Development Aid Targets"
 COUNCIL OF THE EUROPEAN UNION Council conclusions on "First Annual Report to the European Council on EU Development Aid Targets" 3091st FOREIGN AFFAIRS Council meeting Brussels, 23 May 2011 The Council
Taxation trends in the European Union EU27 tax ratio at 39.8% of GDP in 2007 Steady decline in top personal and corporate income tax rates since 2000
 DG TAXUD STAT/09/92 22 June 2009 Taxation trends in the European Union EU27 tax ratio at 39.8% of GDP in 2007 Steady decline in top personal and corporate income tax rates since 2000 The overall tax-to-gdp
STAT/12/ October Household saving rate fell in the euro area and remained stable in the EU27. Household saving rate (seasonally adjusted)
") STAT/12/152 30 October 2012 Quarterly Sector Accounts: second quarter of 2012 Household saving rate down to 12.9% in the euro area and stable at 11. in the EU27 Household real income per capita fell by
STAT/12/152 30 October 2012 Quarterly Sector Accounts: second quarter of 2012 Household saving rate down to 12.9% in the euro area and stable at 11. in the EU27 Household real income per capita fell by
Technical report on macroeconomic Member State results of the EUCO policy scenarios
 Technical report on macroeconomic Member State results of the EUCO policy scenarios By E3MLab, December 2016 Contents Introduction... 1 Modelling the macro-economic impacts of the policy scenarios with
The Swedish approach to capital requirements in CRD IV
 The Swedish approach to capital requirements in CRD IV State Secretary Johanna Lybeck Lilja The aim of capital requirements Enhancing growth creating potential of a integrated, stable financial system
January 2010 Euro area unemployment rate at 9.9% EU27 at 9.5%
 STAT//29 1 March 20 January 20 Euro area unemployment rate at 9.9% EU27 at 9.5% The euro area 1 (EA16) seasonally-adjusted 2 unemployment rate 3 was 9.9% in January 20, the same as in December 2009 4.
Composition of capital IT044 IT044 POWSZECHNAIT044 UNIONE DI BANCHE ITALIANE SCPA (UBI BANCA)
") Composition of capital POWSZECHNA (in million Euro) Capital position CRD3 rules A) Common equity before deductions (Original own funds without hybrid instruments and government support measures other than
Composition of capital POWSZECHNA (in million Euro) Capital position CRD3 rules A) Common equity before deductions (Original own funds without hybrid instruments and government support measures other than
DPD CLASSIC (Slovenia) Slovenia 6,00 7,00 10,00 11,00 12,00 13,00 14,00 16,00 18,00 DPD CLASSIC - PARCEL DELIVERY TO THE EU
 Slovenia 6,00 7,00 10,00 11,00 12,00 13,00 14,00 16,00 18,00 DPD CLASSIC - PARCEL DELIVERY TO THE EU") Parcel delivery in Slovenia DPD CLASSIC (Slovenia) Area up to up to up to up to 1 up to up to 2 up to 31. up to 40 kg up to 50 kg Slovenia 6,00 7,00 10,00 11,00 12,00 13,00 14,00 18,00 Prices are in EUR
Parcel delivery in Slovenia DPD CLASSIC (Slovenia) Area up to up to up to up to 1 up to up to 2 up to 31. up to 40 kg up to 50 kg Slovenia 6,00 7,00 10,00 11,00 12,00 13,00 14,00 18,00 Prices are in EUR
January 2014 Euro area international trade in goods surplus 0.9 bn euro 13.0 bn euro deficit for EU28
 STAT/14/41 18 March 2014 January 2014 Euro area international trade in goods surplus 0.9 13.0 deficit for EU28 The first estimate for the euro area 1 (EA18) trade in goods balance with the rest of the
Post Compliance with the Energy Efficiency Directive
 Post Compliance with the Energy Efficiency Directive How to Deliver Business Value ERM Webinar What final requirements for compliance are in place across the EU Member States? EED Introduction The Directive
A. INTRODUCTION AND FINANCING OF THE GENERAL BUDGET. EXPENDITURE Description Budget Budget Change (%)
") DRAFT AMENDING BUDGET NO. 2/2018 VOLUME 1 - TOTAL REVENUE A. INTRODUCTION AND FINANCING OF THE GENERAL BUDGET FINANCING OF THE GENERAL BUDGET Appropriations to be covered during the financial year 2018
DRAFT AMENDING BUDGET NO. 2/2018 VOLUME 1 - TOTAL REVENUE A. INTRODUCTION AND FINANCING OF THE GENERAL BUDGET FINANCING OF THE GENERAL BUDGET Appropriations to be covered during the financial year 2018
PREZENTĀCIJAS NOSAUKUMS
 Which Structural Reforms Matter for economic growth: PREZENTĀCIJAS NOSAUKUMS Evidence from Bayesian Model Averaging Olegs Krasnopjorovs (Latvijas Banka) 2 nd Lisbon Conference on Structural Reforms 06.07.2017
74 ECB THE 2012 MACROECONOMIC IMBALANCE PROCEDURE
 Box 7 THE 2012 MACROECONOMIC IMBALANCE PROCEDURE This year s European Semester (i.e. the framework for EU policy coordination introduced in 2011) includes, for the first time, the implementation of the
Gender pension gap economic perspective
 Gender pension gap economic perspective Agnieszka Chłoń-Domińczak Institute of Statistics and Demography SGH Part of this research was supported by European Commission 7th Framework Programme project "Employment
COMMISSION DECISION of 23 April 2012 on the second set of common safety targets as regards the rail system (notified under document C(2012) 2084)
 2084)") 27.4.2012 Official Journal of the European Union L 115/27 COMMISSION DECISION of 23 April 2012 on the second set of common safety targets as regards the rail system (notified under document C(2012) 2084)
27.4.2012 Official Journal of the European Union L 115/27 COMMISSION DECISION of 23 April 2012 on the second set of common safety targets as regards the rail system (notified under document C(2012) 2084)
UPSTREAM SECURITY IN EUROPE. A concise overview of the issues arising in connection with the granting and taking of Upstream Security in Europe
 UPSTREAM SECURITY IN EUROPE A concise overview of the issues arising in connection with the granting and taking of Upstream Security in Europe 1 Table of Contents Introduction 5 1. Increase in Cross-Border
International Hints and Tips
 International Hints and Tips Content Q: What is the cut off time for processing International payments? A: International payments must be submitted and fully approved within the cut off time indicated
COMMISSION OF THE EUROPEAN COMMUNITIES COMMISSION STAFF WORKING DOCUMENT. Annex to the
 COMMISSION OF THE EUROPEAN COMMUNITIES Brussels, 19122006 SEC(2006) 1690 COMMISSION STAFF WORKING DOCUMENT Annex to the COMMUNICATION FROM THE COMMISSION TO THE COUNCIL, THE EUROPEAN PARLIAMENT AND THE
Enterprise Europe Network SME growth outlook
 Enterprise Europe Network SME growth outlook 2018-19 een.ec.europa.eu 2 Enterprise Europe Network SME growth outlook 2018-19 Foreword The European Commission wants to ensure that small and medium-sized
Synergies and Trade-offs between Energy Efficiency and Sustainablity Indicators: The EU-28 Study of Sustainable Energy Use
 14.6.217 Synergies and Trade-offs between Energy Efficiency and Sustainablity Indicators: The EU-28 Study of Sustainable Energy Use Jari Kaivo-oja, Jyrki Luukkanen & Jarmo Kaivo-oja Session 6, Futures
European Emissions Trading Scheme - Market Outlook. Market outlook. Outline of the Presentation
 European Emissions Trading Scheme - Market Outlook Dr. Jussi Nykänen Partner and Executive Vice President, Intermediary GreenStream Network Ltd. tel. +358 20 743 7800 GSM +358 40 840 8001 mail jussi.nykanen@greenstream.net
Medicines for Europe (MFE) HCP/HCO/PO Disclosure Transparency Requirements. Samsung Bioepis Methodology Note
 HCP/HCO/PO Disclosure Transparency Requirements. Samsung Bioepis Methodology Note") Medicines for Europe (MFE) HCP/HCO/PO Disclosure Transparency Requirements Samsung Bioepis Methodology Note 1 Contents 1. Overview of the MFE Requirements 2. Decisions 3. Submission Requirements 4. Categories
Medicines for Europe (MFE) HCP/HCO/PO Disclosure Transparency Requirements Samsung Bioepis Methodology Note 1 Contents 1. Overview of the MFE Requirements 2. Decisions 3. Submission Requirements 4. Categories
October 2010 Euro area unemployment rate at 10.1% EU27 at 9.6%
 STAT//180 30 November 20 October 20 Euro area unemployment rate at.1% EU27 at 9.6% The euro area 1 (EA16) seasonally-adjusted 2 unemployment rate 3 was.1% in October 20, compared with.0% in September 4.
3 Labour Costs. Cost of Employing Labour Across Advanced EU Economies (EU15) Indicator 3.1a
 Indicator 3.1a") 3 Labour Costs Indicator 3.1a Indicator 3.1b Indicator 3.1c Indicator 3.2a Indicator 3.2b Indicator 3.3 Indicator 3.4 Cost of Employing Labour Across Advanced EU Economies (EU15) Cost of Employing Labour
3 Labour Costs Indicator 3.1a Indicator 3.1b Indicator 3.1c Indicator 3.2a Indicator 3.2b Indicator 3.3 Indicator 3.4 Cost of Employing Labour Across Advanced EU Economies (EU15) Cost of Employing Labour
JOINT STATEMENT. The representatives of the governments of the Member States, meeting within the Council of
 JOINT STATEMENT The representatives of the governments of the Member States, meeting within the Council of the EU, and The Swiss Federal Council, Have drawn up the following Joint Statement on company
NOTE. for the Interparliamentary Meeting of the Committee on Budgets
 NOTE for the Interparliamentary Meeting of the Committee on Budgets THE ROLE OF THE EU BUDGET TO SUPPORT MEMBER STATES IN ACHIEVING THEIR ECONOMIC OBJECTIVES AS AGREED WITHIN THE FRAMEWORK OF THE EUROPEAN
CO 2 Markets. Maria Mansanet Bataller
 CO 2 Markets Maria Mansanet Bataller Motivation Climate Change Importance Increasingly Kyoto Protocol: International Response to Climate Change Flexibility Mechanisms EMISSIONS TRADING CARBON MARKETS The
3 Labour Costs. Cost of Employing Labour Across Advanced EU Economies (EU15) Indicator 3.1a
 Indicator 3.1a") 3 Labour Costs Indicator 3.1a Indicator 3.1b Indicator 3.1c Indicator 3.2a Indicator 3.2b Indicator 3.3 Indicator 3.4 Cost of Employing Labour Across Advanced EU Economies (EU15) Cost of Employing Labour
3 Labour Costs Indicator 3.1a Indicator 3.1b Indicator 3.1c Indicator 3.2a Indicator 3.2b Indicator 3.3 Indicator 3.4 Cost of Employing Labour Across Advanced EU Economies (EU15) Cost of Employing Labour
EU State aid: Guidelines on State aid for environmental protection and energy making of -
 EU State aid: Guidelines on State aid for environmental protection and energy 2014-2020 - making of - NHO Seminar Oslo, 5 November 2014 Guido Lobrano, Senior Legal Adviser Summary What is BUSINESSEUROPE?
The CAP reform process in perspective: issues of the post-2013 debate
 The CAP reform process in perspective: issues of the post-213 debate Tassos Haniotis Director - Economic Analysis, Perspectives and Evaluations DG for Agriculture and Rural Development European Commission
Purpose of this form. If you are an Appointed Representative ( AR ) then this form must be completed by the sponsoring firm on your behalf.
 then this form must be completed by the sponsoring firm on your behalf.") FIRM NAME: FRN: Passporting Notification of intention to provide cross border services in another EEA state INSURANCE DISTRIBUTION DIRECTIVE (SUP 13 Annex 5R Notification under SUP 13.5.2R) Purpose of
FIRM NAME: FRN: Passporting Notification of intention to provide cross border services in another EEA state INSURANCE DISTRIBUTION DIRECTIVE (SUP 13 Annex 5R Notification under SUP 13.5.2R) Purpose of
STATISTICAL REFLECTIONS
 STATISTICAL REFLECTIONS 29 January 2016 Contents Introduction...1 Changes in property transactions...1 Annual price indices...1 Quarterly pure price index...2 Factors of overall price in the market of
STATISTICAL REFLECTIONS
 STATISTICAL REFLECTIONS 7 November 2016 Housing prices, housing price index, Quarter 2 2016* Contents Introduction...1 Changes in property transactions...1 Annual price indices...2 Quarterly pure price
Defining Issues. EU Audit Reforms: The Countdown Begins. April 2016, No Key Facts for U.S. Companies
 Defining Issues April 2016, No. 16-12 EU Audit Reforms: The Countdown Begins Only two months remain before the European Union (EU) audit reforms come into full effect. These reforms will affect many U.S.
Corrigendum. OECD Pensions Outlook 2012 DOI: ISBN (print) ISBN (PDF) OECD 2012
 ISBN (PDF) OECD 2012") OECD Pensions Outlook 2012 DOI: http://dx.doi.org/9789264169401-en ISBN 978-92-64-16939-5 (print) ISBN 978-92-64-16940-1 (PDF) OECD 2012 Corrigendum Page 21: Figure 1.1. Average annual real net investment
OECD Pensions Outlook 2012 DOI: http://dx.doi.org/9789264169401-en ISBN 978-92-64-16939-5 (print) ISBN 978-92-64-16940-1 (PDF) OECD 2012 Corrigendum Page 21: Figure 1.1. Average annual real net investment
Second SHA2011-based pilot data collection 2014
 EUROPEAN COMMISSION EUROSTAT Directorate F: Social statistics Unit F-5: Education, health and social protection DOC 2013-PH-06 Annex 3 Second SHA2011-based pilot data collection 2014 Item 6.2.3 of the
Statistics: Fair taxation of the digital economy
 Statistics: Fair taxation of the digital economy Your reply: can be published with your personal information (I consent to the publication of all information in my contribution in whole or in part including
RENEWABLE ELECTRICTY SUPPORT IN THE EU WHAT LESSONS CAN BE LEARNED?
 RENEWABLE ELECTRICTY SUPPORT IN THE EU WHAT LESSONS CAN BE LEARNED? 16 th Global Conference on Environmental Taxation University of Technology Sydney, 24 th September 2015 Claudia Kettner & Daniela Kletzan-Slamanig
EU Emission Trading - Better Job Second Time Around? ECEEE Summer Study La Colle sur Loup, France 5-9 June 2007
 EU Emission Trading - Better Job Second Time Around? ECEEE Summer Study La Colle sur Loup, France 5-9 June 2007 Joachim Schleich Fraunhofer ISI, Karlsruhe, Germany Regina Betz CEEM, Sydney, Australia Karoline