Quantitative evidence of post-crisis structural macroeconomic changes
|
|
|
- Shauna Fields
- 5 years ago
- Views:
Transcription
1 Quantitative evidence of post-crisis structural macroeconomic changes Roberto Camagni, Roberta Capello, Andrea Caragliu, Barbara Chizzolini Politecnico di Milano To be discussed at the Advisory Board Forum, Brussels, 14 March 2018
2 Aim of the presentation Initial quantitative evidence of post-crisis structural macroeconomic changes is here provided with the aim to discuss with the advisory board members about: the possible consequences of such changes for Europe and its territory; the inclusion of such chamges into a reference scenario; the linkage of such changes with the policy debate (see document ECP).
3 Source: JM Barroso, Informal European Council (Feb.2010)
4 yearly % EU28 GDP average anual growth rate according to ECFIN in the 2012, 2015 and 2018 updates of the Ageing Report 1,80 1,70 1,60 1,50 1,40 1,30 1,20 1,10 1, EC (ECFIN)-EPC (AWG) 2012 projections EC-EPC (AWG) 2015 projections EC-EPC (AWG) 2018 projections
5
6
7
8 Groups of countries obtained through a custer analysis on GDP performance in the post-crisis period ( ) Low growth countries Medium growth countries High growth countries Austria 1 Belgium 1 Cyprus 1 Finland 1 France 1 Italy 1 Luxembourg 1 Netherlands 1 Croatia 2 Denmark 2 Germany 2 Greece 2 Malta 2 Romania 2 Slovenia 2 Spain 2 Sweden 2 Bulgaria 3 Czech Republic 3 Estonia 3 Hungary 3 Ireland 3 Latvia 3 Lithuania 3 Poland 3 Portugal 3 Slovakia 3 United Kingdom 3
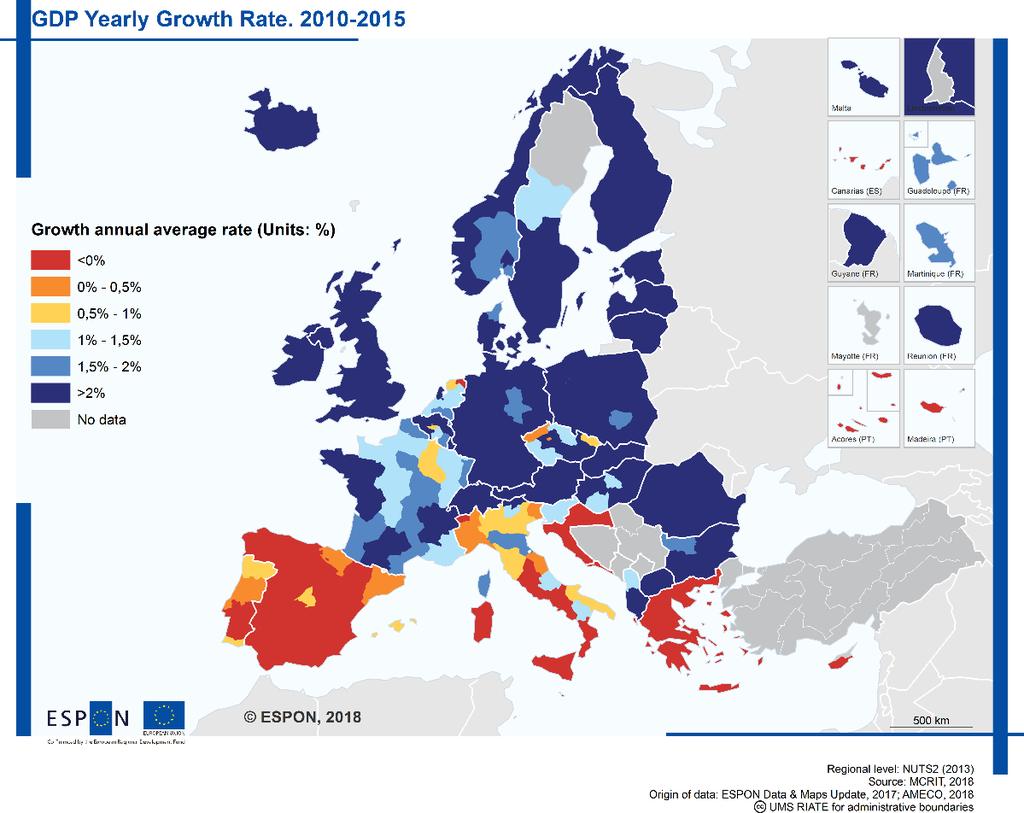
9 GDP levels
10 Comments Clusters look as geography-neutral (East-West, North-South divide not visible as before the crisis). Low growing countries are not only the Southern ones; not all Eastern countries are fast growing; Northern countries are present in all groups; The relative performance of the clusters in the postcrisis period looks similar to the other two periods, namely: fast growing countries were also faster before the crisis and with limited effects of the crisis; the growth rate of the post-crisis period is higher than the pre-crisis; low growing countries were also growing less in the previous two periods and less after crisis than in the pre-crisis; the medium growing countries always lied in between the other two, and show a simialr performance before and after the crisis.
11 Possible explanation on the differentiated growth paths: pre-crisis and post-crisis investments trends Low-growing countries Medium-growing countries Fast-growing countries Gross Fixed Investments: average trend cluster 1 Gross Fixed Investments: trends for cluster 2 Gross Fixed Investments: trends cluster 3 240, , , ,000 80,000 40, , , , , ,000 80,000 60,000 40,000 20, ,000 70,000 60,000 50,000 40,000 30,000 20,000 10, E_IFK TREND pre TREND post E_IFK TREND pre TREND post E_IFK TREND pre TREND post Legend: Red - pre-crisis ( ) trend Green post-crisis ( ) trend Blu annual investments
12 Possible explanation for the differentiated growth paths: investments trends Comparing post-crisis with pre-crisis investment trends: low-growing countries show a similar investment trend (but lower than the other two groups of countries); medium-growing countries have a steeper investment trend; fast-growing countries have a much steeper investment trend.
13 Long run explanation of investment growth: vs pre-crisis and crisis periods pre-crisis, crisis and post-crisis periods Dependent variable: growth in investment Coefficient Std. Error t-statistic Prob. Coefficient Std. Error t-statistic Prob. Constant Constant FDI in previous periods FDI in previous periods GDP growth in previous period GDP growth in previous periods Real interest rate Real interest rate unit labor cost unit labor cost Dummy crisis Dummy crisis gamma gamma Investment trends Investment trends
14 Comments In the post-crisis period: the reactivity of investment growth to GDP growth is higher: higher cumulative effects (I GDP I); investments become more volatile, i.e. they are less linked to their long-term trend.
15 Possible explanation for the differentiated growth paths: export performance ( ) Variable Coefficient Std. Error t-statistic Prob. Euro/& exchange rate Deflator in hi-med countries (wrt. low-growing) Deflator in low-growing countries Japan and US GDP growth rate BRIC GDP growth rate Eastern countries Constant R-squared Mean dependent var Adjusted R-squared S.D. dependent var S.E. of regression Akaike info criterion Sum squared resid Schwarz criterion Log likelihood Hannan-Quinn criter F-statistic Durbin-Watson stat Prob(F-statistic)
16 Comments In the post-crisis period: rise in price deflator hits only low growing countries; medium and high growing countries instead suffer less (due to likely high price competitiveness and to likely specialization in sectors with anelastic demand). These last countries perform better due to a wider structural transformation in their economies.
17 Regional disparities (Theil index) Year Between countries Theil index Total Theil index Within Countries Theil Index
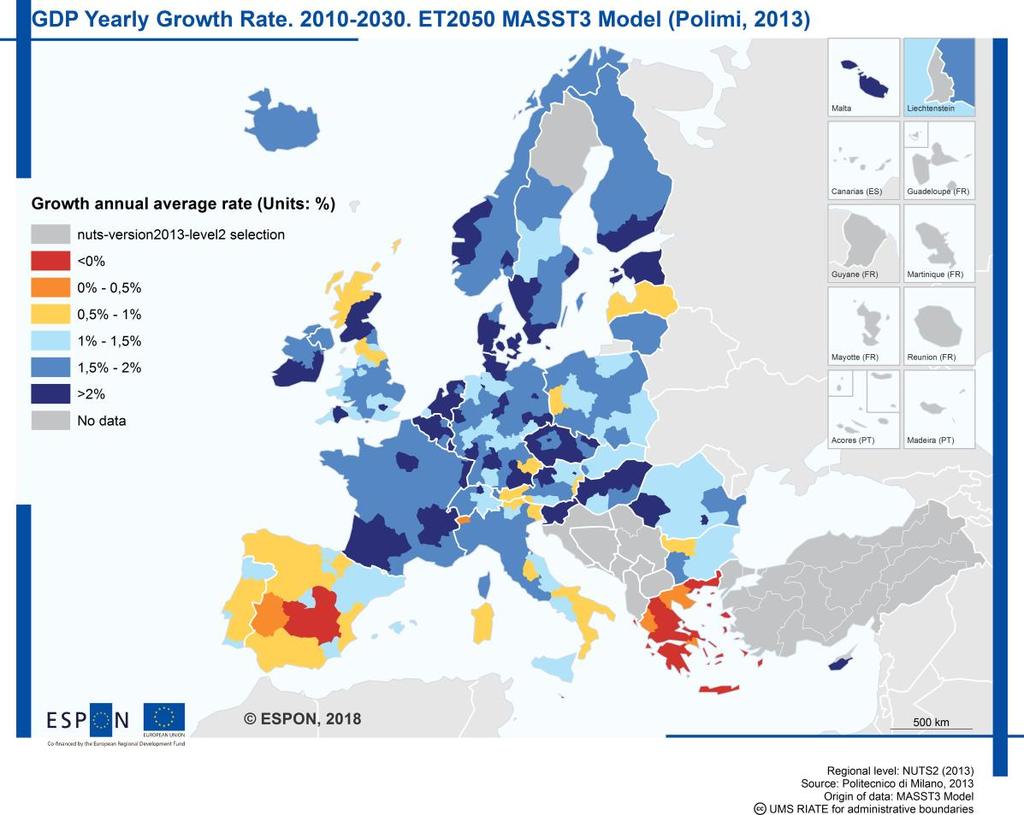
18 Trends in regional disparities The Theil index confirms previous forecasts of the MASST model (ET2050), namely: the end of inter-national reduction of disparities; the continuing increase of intra-national disparities; the increase since 2008 of overall regional disparities.
19 Within countries regional disparities by groups of countries Year Within Theil, low growth Countries Within Theil, high growth Countries Within Theil, middle growth Countries
20 Within countries (intra-national) regional disparities by groups of countries The Theil index shows: fastest growing countries show a faster increase in internal disparities since the beginning of the crisis; all clusters show an increase in internal disparities; this increase started well before the crisis ( ) in the case of fast growing and medium growing countries.
21 Disparities between agglomerated and rural regions year
22 Disparities between agglomerated and rural regions The Theil index between agglomerated and rural regions shows: a reduction during the pre-crisis period, in which rural areas where growing; a stability during the crisis, due to the downturn which characterised agglomerated areas; an increase after the crisis.
23 Tentative conclusions (after crisis) A geograhically-neutral, multi-speed Europe; crucial role of investments and structural change; increase in regional disparities leading possibly to increased political fragmentation; the opening of a new dichotomy between urban and rural areas (with similar effects on political fragmentation); crucial role of both macroeconomic (national) and territorial elements multi-scalar, selective policies needed.
EU-28 RECOVERED PAPER STATISTICS. Mr. Giampiero MAGNAGHI On behalf of EuRIC
 EU-28 RECOVERED PAPER STATISTICS Mr. Giampiero MAGNAGHI On behalf of EuRIC CONTENTS EU-28 Paper and Board: Consumption and Production EU-28 Recovered Paper: Effective Consumption and Collection EU-28 -
Live Long and Prosper? Demographic Change and Europe s Pensions Crisis. Dr. Jochen Pimpertz Brussels, 10 November 2015
 Live Long and Prosper? Demographic Change and Europe s Pensions Crisis Dr. Jochen Pimpertz Brussels, 10 November 2015 Old-age-dependency ratio, EU28 45,9 49,4 50,2 39,0 27,5 31,8 2013 2020 2030 2040 2050
European Advertising Business Climate Index Q4 2016/Q #AdIndex2017
 European Advertising Business Climate Index Q4 216/Q1 217 ABOUT Quarterly survey of European advertising and market research companies Provides information about: managers assessment of their business
EU BUDGET AND NATIONAL BUDGETS
 DIRECTORATE GENERAL FOR INTERNAL POLICIES POLICY DEPARTMENT ON BUDGETARY AFFAIRS EU BUDGET AND NATIONAL BUDGETS 1999-2009 October 2010 INDEX Foreward 3 Table 1. EU and National budgets 1999-2009; EU-27
REPORT FROM THE COMMISSION TO THE EUROPEAN PARLIAMENT, THE COUNCIL, THE EUROPEAN ECONOMIC AND SOCIAL COMMITTEE AND THE COMMITTEE OF THE REGIONS
 EUROPEAN COMMISSION Brussels,.4.29 COM(28) 86 final/ 2 ANNEXES to 3 ANNEX to the REPORT FROM THE COMMISSION TO THE EUROPEAN PARLIAMENT, THE COUNCIL, THE EUROPEAN ECONOMIC AND SOCIAL COMMITTEE AND THE COMMITTEE
Approach to Employment Injury (EI) compensation benefits in the EU and OECD
 compensation benefits in the EU and OECD") Approach to (EI) compensation benefits in the EU and OECD The benefits of protection can be divided in three main groups. The cash benefits include disability pensions, survivor's pensions and other short-
Approach to (EI) compensation benefits in the EU and OECD The benefits of protection can be divided in three main groups. The cash benefits include disability pensions, survivor's pensions and other short-
2017 Figures summary 1
 Annual Press Conference on January 18 th 2018 EIB Group Results 2017 2017 Figures summary 1 European Investment Bank (EIB) financing EUR 69.88 billion signed European Investment Fund (EIF) financing EUR
THE IMPACT OF THE PUBLIC DEBT STRUCTURE IN THE EUROPEAN UNION MEMBER COUNTRIES ON THE POSSIBILITY OF DEBT OVERHANG
 THE IMPACT OF THE PUBLIC DEBT STRUCTURE IN THE EUROPEAN UNION MEMBER COUNTRIES ON THE POSSIBILITY OF DEBT OVERHANG Robert Huterski, PhD Nicolaus Copernicus University in Toruń Faculty of Economic Sciences
Fiscal rules in Lithuania
 Fiscal rules in Lithuania Algimantas Rimkūnas Vice Minister, Ministry of Finance of Lithuania 3 June, 2016 Evolution of National and EU Fiscal Regulations Stability and Growth Pact (SGP) Maastricht Treaty
EMPLOYMENT RATE IN EU-COUNTRIES 2000 Employed/Working age population (15-64 years)
") EMPLOYMENT RATE IN EU-COUNTRIES 2 Employed/Working age population (15-64 years EU-15 Denmark Netherlands Great Britain Sweden Portugal Finland Austria Germany Ireland Luxembourg France Belgium Greece Spain
EMPLOYMENT RATE IN EU-COUNTRIES 2 Employed/Working age population (15-64 years EU-15 Denmark Netherlands Great Britain Sweden Portugal Finland Austria Germany Ireland Luxembourg France Belgium Greece Spain
DG TAXUD. STAT/11/100 1 July 2011
 DG TAXUD STAT/11/100 1 July 2011 Taxation trends in the European Union Recession drove EU27 overall tax revenue down to 38.4% of GDP in 2009 Half of the Member States hiked the standard rate of VAT since
Consumer Credit. Introduction. June, the 6th (2013)
") Consumer Credit in Europe at end-2012 Introduction Crédit Agricole Consumer Finance has published its annual survey of the consumer credit market in 27 European Union countries (EU-27) for the sixth year
Consumer Credit in Europe at end-2012 Introduction Crédit Agricole Consumer Finance has published its annual survey of the consumer credit market in 27 European Union countries (EU-27) for the sixth year
STAT/12/ October Household saving rate fell in the euro area and remained stable in the EU27. Household saving rate (seasonally adjusted)
") STAT/12/152 30 October 2012 Quarterly Sector Accounts: second quarter of 2012 Household saving rate down to 12.9% in the euro area and stable at 11. in the EU27 Household real income per capita fell by
STAT/12/152 30 October 2012 Quarterly Sector Accounts: second quarter of 2012 Household saving rate down to 12.9% in the euro area and stable at 11. in the EU27 Household real income per capita fell by
CANADA EUROPEAN UNION
 THE EUROPEAN UNION S PROFILE Economic Indicators Gross domestic product (GDP) at purchasing power parity (PPP): US$20.3 trillion (2016) GDP per capita at PPP: US$39,600 (2016) Population: 511.5 million
EUROPA - Press Releases - Taxation trends in the European Union EU27 tax...of GDP in 2008 Steady decline in top corporate income tax rate since 2000
 DG TAXUD STAT/10/95 28 June 2010 Taxation trends in the European Union EU27 tax ratio fell to 39.3% of GDP in 2008 Steady decline in top corporate income tax rate since 2000 The overall tax-to-gdp ratio1
Communication on the future of the CAP
 Communication on the future of the CAP The CAP towards 2020: meeting the food, natural resources and territorial challenges of the future Tassos Haniotis, Director Agricultural Policy Analysis and Perspectives
Electricity & Gas Prices in Ireland. Annex Business Electricity Prices per kwh 2 nd Semester (July December) 2016
 2016") Electricity & Gas Prices in Ireland Annex Business Electricity Prices per kwh 2 nd Semester (July December) 2016 ENERGY POLICY STATISTICAL SUPPORT UNIT 1 Electricity & Gas Prices in Ireland Annex Business
Electricity & Gas Prices in Ireland Annex Business Electricity Prices per kwh 2 nd Semester (July December) 2016 ENERGY POLICY STATISTICAL SUPPORT UNIT 1 Electricity & Gas Prices in Ireland Annex Business
11 th Economic Trends Survey of the Impact of Economic Downturn
 11 th Economic Trends Survey 11 th Economic Trends Survey of the Impact of Economic Downturn 11 th Economic Trends Survey COUNTRY ANSWERS Austria 155 Belgium 133 Bulgaria 192 Croatia 185 Cyprus 1 Czech
Growth, competitiveness and jobs: priorities for the European Semester 2013 Presentation of J.M. Barroso,
 Growth, competitiveness and jobs: priorities for the European Semester 213 Presentation of J.M. Barroso, President of the European Commission, to the European Council of 14-1 March 213 Economic recovery
EMPLOYMENT RATE Employed/Working age population (15-64 years)
") 1 EMPLOYMENT RATE 1980-2003 Employed/Working age population (15-64 years 80 % Finland (Com 75 70 65 60 EU-15 Finland (Stat. Fin. 55 50 80 82 84 86 88 90 92 94 96 98 00 02 9.9.2002/SAK /TL Source: European
1 EMPLOYMENT RATE 1980-2003 Employed/Working age population (15-64 years 80 % Finland (Com 75 70 65 60 EU-15 Finland (Stat. Fin. 55 50 80 82 84 86 88 90 92 94 96 98 00 02 9.9.2002/SAK /TL Source: European
Quarterly Gross Domestic Product of Montenegro 3 rd quarter 2017
 MONTENEGRO STATISTICAL OFFICE R E L E A S E No: 224 Podgorica, 22 December 2017 When using the data, please name the source Quarterly Gross Domestic Product of Montenegro 3 rd quarter 2017 The release
EMPLOYMENT RATE Employed/Working age population (15 64 years)
") EMPLOYMENT RATE 198 26 Employed/Working age population (15 64 years 8 % Finland 75 EU 15 EU 25 7 65 6 55 5 8 82 84 86 88 9 92 94 96 98 2 4** 6** 14.4.25/SAK /TL Source: European Commission 1 UNEMPLOYMENT
EMPLOYMENT RATE 198 26 Employed/Working age population (15 64 years 8 % Finland 75 EU 15 EU 25 7 65 6 55 5 8 82 84 86 88 9 92 94 96 98 2 4** 6** 14.4.25/SAK /TL Source: European Commission 1 UNEMPLOYMENT
A. INTRODUCTION AND FINANCING OF THE GENERAL BUDGET. EXPENDITURE Description Budget Budget Change (%)
") DRAFT AMENDING BUDGET NO. 2/2018 VOLUME 1 - TOTAL REVENUE A. INTRODUCTION AND FINANCING OF THE GENERAL BUDGET FINANCING OF THE GENERAL BUDGET Appropriations to be covered during the financial year 2018
DRAFT AMENDING BUDGET NO. 2/2018 VOLUME 1 - TOTAL REVENUE A. INTRODUCTION AND FINANCING OF THE GENERAL BUDGET FINANCING OF THE GENERAL BUDGET Appropriations to be covered during the financial year 2018
Report Penalties and measures imposed under the UCITS Directive in 2016 and 2017
 Report Penalties and measures imposed under the Directive in 206 and 207 4 April 209 ESMA34-45-65 4 April 209 ESMA34-45-65 Table of Contents Executive Summary... 3 2 Background and relevant regulatory
Economics 442 Macroeconomic Policy (Spring 2015) 3/23/2015. Instructor: Prof. Menzie Chinn UW Madison
 3/23/2015. Instructor: Prof. Menzie Chinn UW Madison") Economics 442 Macroeconomic Policy (Spring 2015) 3/23/2015 Instructor: Prof. Menzie Chinn UW Madison Outline Models of Investment Assessment Uncertainty http://www.bostonfed.org/economic/neer/neer2001/neer201a.pdf
Economics 442 Macroeconomic Policy (Spring 2015) 3/23/2015 Instructor: Prof. Menzie Chinn UW Madison Outline Models of Investment Assessment Uncertainty http://www.bostonfed.org/economic/neer/neer2001/neer201a.pdf
How to complete a payment application form (NI)
") How to complete a payment application form (NI) This form should be used for making a payment from a Northern Ireland Ulster Bank account. 1. Applicant Details If you are a signal number indemnity holder,
How to complete a payment application form (NI) This form should be used for making a payment from a Northern Ireland Ulster Bank account. 1. Applicant Details If you are a signal number indemnity holder,
Lithuania: in a wind of change. Robertas Dargis President of the Lithuanian Confederation of Industrialists
 Lithuania: in a wind of change Robertas Dargis President of the Lithuanian Confederation of Industrialists 2017 06 15 Lithuanian Confederation of Industrialists - the largest business organisation in Lithuania
June 2014 Euro area international trade in goods surplus 16.8 bn 2.9 bn surplus for EU28
 127/2014-18 August 2014 June 2014 Euro area international trade in goods surplus 16.8 bn 2.9 bn surplus for EU28 The first estimate for the euro area 1 (EA18) trade in goods balance with the rest of the
Courthouse News Service
 14/2009-30 January 2009 Sector Accounts: Third quarter of 2008 Household saving rate at 14.4% in the euro area and 10.7% in the EU27 Business investment rate at 23.5% in the euro area and 23.6% in the
Consumer credit market in Europe 2013 overview
 Consumer credit market in Europe 2013 overview Crédit Agricole Consumer Finance published its annual survey of the consumer credit market in 28 European Union countries for seven years running. 9 July
COMMUNICATION FROM THE COMMISSION
 EUROPEAN COMMISSION Brussels, 20.2.2019 C(2019) 1396 final COMMUNICATION FROM THE COMMISSION Modification of the calculation method for lump sum payments and daily penalty payments proposed by the Commission
Quarterly Gross Domestic Product of Montenegro 2st quarter 2016
 Government of Montenegro Statistical Office of Montenegro Quarterly Gross Domestic Product of Montenegro 2st quarter 2016 The release presents the preliminary data for quarterly gross domestic product
PUBLIC PROCUREMENT INDICATORS 2011, Brussels, 5 December 2012
 PUBLIC PROCUREMENT INDICATORS 2011, Brussels, 5 December 2012 1. INTRODUCTION This document provides estimates of three indicators of performance in public procurement within the EU. The indicators are
Spain France. England Netherlands. Wales Ukraine. Republic of Ireland Czech Republic. Romania Albania. Serbia Israel. FYR Macedonia Latvia
 Germany Belgium Portugal Spain France Switzerland Italy England Netherlands Iceland Poland Croatia Slovakia Russia Austria Wales Ukraine Sweden Bosnia-Herzegovina Republic of Ireland Czech Republic Turkey
Macroeconomic scenarios for skill demand and supply projections, including dealing with the recession
 Alphametrics (AM) Alphametrics Ltd Macroeconomic scenarios for skill demand and supply projections, including dealing with the recession Paper presented at Skillsnet technical workshop on: Forecasting
Lowest implicit tax rates on labour in Malta, on consumption in Spain and on capital in Lithuania
 STAT/13/68 29 April 2013 Taxation trends in the European Union The overall tax-to-gdp ratio in the EU27 up to 38.8% of GDP in 2011 Labour taxes remain major source of tax revenue The overall tax-to-gdp
Constraints on Exchange Rate Flexibility in Transition Economies: a Meta-Regression Analysis of Exchange Rate Pass-Through
 Constraints on Exchange Rate Flexibility in Transition Economies: a Meta-Regression Analysis of Exchange Rate Pass-Through Igor Velickovski & Geoffrey Pugh Applied Economics 43 (27), 2011 National Bank
May 2012 Euro area international trade in goods surplus of 6.9 bn euro 3.8 bn euro deficit for EU27
 108/2012-16 July 2012 May 2012 Euro area international trade in goods surplus of 6.9 3.8 deficit for EU27 The first estimate for the euro area 1 (EA17) trade in goods balance with the rest of the world
January 2014 Euro area international trade in goods surplus 0.9 bn euro 13.0 bn euro deficit for EU28
 STAT/14/41 18 March 2014 January 2014 Euro area international trade in goods surplus 0.9 13.0 deficit for EU28 The first estimate for the euro area 1 (EA18) trade in goods balance with the rest of the
June 2012 Euro area international trade in goods surplus of 14.9 bn euro 0.4 bn euro surplus for EU27
 121/2012-17 August 2012 June 2012 Euro area international trade in goods surplus of 14.9 0.4 surplus for EU27 The first estimate for the euro area 1 (EA17) trade in goods balance with the rest of the world
Key Trends of Energy Transition in the EU-28 Region
 Key Trends of Energy Transition in the EU-28 Region Jarmo Vehmas, Jyrki Luukkanen & Jari Kaivo-oja Session 13, Innovation in Future Technology June 2017, Turku Finland Futures Research Centre, Turku School
STATISTICAL REFLECTIONS
 STATISTICAL REFLECTIONS 7 November 2016 Housing prices, housing price index, Quarter 2 2016* Contents Introduction...1 Changes in property transactions...1 Annual price indices...2 Quarterly pure price
August 2012 Euro area international trade in goods surplus of 6.6 bn euro 12.6 bn euro deficit for EU27
 146/2012-16 October 2012 August 2012 Euro area international trade in goods surplus of 6.6 12.6 deficit for EU27 The first estimate for the euro area 1 (EA17) trade in goods balance with the rest of the
Quarterly Gross Domestic Product of Montenegro for period 1 st quarter rd quarter 2016
 Government of Montenegro Statistical Office of Montenegro Quarterly Gross Domestic Product of Montenegro for period 1 st quarter 015 - rd quarter 016 The release presents the final results of quarterly
Governor of the Bank of Latvia
 Lessons from Latvia s internal adjustment strategy Ilmārs Rimšēvičs Governor of the Bank of Latvia September 4, 2012 Presentation outline Overheating of Latvia s economy Expansionary consolidation Lessons
NOTE. for the Interparliamentary Meeting of the Committee on Budgets
 NOTE for the Interparliamentary Meeting of the Committee on Budgets THE ROLE OF THE EU BUDGET TO SUPPORT MEMBER STATES IN ACHIEVING THEIR ECONOMIC OBJECTIVES AS AGREED WITHIN THE FRAMEWORK OF THE EUROPEAN
BRIEFING ON THE FUND FOR EUROPEAN AID FOR THE MOST DEPRIVED ( FEAD )
") BRIEFING ON THE FUND FOR EUROPEAN AID FOR THE MOST DEPRIVED ( FEAD ) August 2014 INTRODUCTION The European Union has set up a new fund, the Fund for European Aid for the Most Deprived ( FEAD ). It will
BRIEFING ON THE FUND FOR EUROPEAN AID FOR THE MOST DEPRIVED ( FEAD ) August 2014 INTRODUCTION The European Union has set up a new fund, the Fund for European Aid for the Most Deprived ( FEAD ). It will
Analysis of European Union Economy in Terms of GDP Components
 Expert Journal of Economic s (2 0 1 3 ) 1, 13-18 2013 Th e Au thor. Publish ed by Sp rint In v estify. Econ omics.exp ertjou rn a ls.com Analysis of European Union Economy in Terms of GDP Components Simona
First estimate for 2011 Euro area external trade deficit 7.7 bn euro bn euro deficit for EU27
 27/2012-15 February 2012 First estimate for 2011 Euro area external trade deficit 7.7 152.8 deficit for EU27 The first estimate for the euro area 1 (EA17) trade in goods balance with the rest of the world
Macroeconomic overview SEE and Macedonia
 Macroeconomic overview SEE and Macedonia Zoltan Arokszallasi Chief Analyst, Macro & FX/FI Research Erste Group Bank Erste Investors Breakfast, 29 September, Skopje 02. Oktober SEE shows mixed performance
Quarterly Gross Domestic Product of Montenegro 4 th quarter 2018 (p)
") MONTENEGRO STATISTICAL OFFICE R E L E A S E No: 46 Podgorica, 22 March 2019 When using the data, please name the source Quarterly Gross Domestic Product of Montenegro 4 th quarter 2018 (p) The release
MONTENEGRO STATISTICAL OFFICE R E L E A S E No: 46 Podgorica, 22 March 2019 When using the data, please name the source Quarterly Gross Domestic Product of Montenegro 4 th quarter 2018 (p) The release
PREZENTĀCIJAS NOSAUKUMS
 Which Structural Reforms Matter for economic growth: PREZENTĀCIJAS NOSAUKUMS Evidence from Bayesian Model Averaging Olegs Krasnopjorovs (Latvijas Banka) 2 nd Lisbon Conference on Structural Reforms 06.07.2017
Prospects for the review of the EU 2020 Strategy, the Juncker Plan and Cohesion Policy after 2020
 Prospects for the review of the EU 2020 Strategy, the Juncker Plan and Cohesion Policy after 2020 Jurmala, June 3 2015 Philippe Monfort DG for Regional and European Commission Preamble Little information
EU State aid: Guidelines on State aid for environmental protection and energy making of -
 EU State aid: Guidelines on State aid for environmental protection and energy 2014-2020 - making of - NHO Seminar Oslo, 5 November 2014 Guido Lobrano, Senior Legal Adviser Summary What is BUSINESSEUROPE?
The macroeconomic effects of a carbon tax in the Netherlands Íde Kearney, 13 th September 2018.
 The macroeconomic effects of a carbon tax in the Netherlands Íde Kearney, th September 08. This note reports estimates of the economic impact of introducing a carbon tax of 50 per ton of CO in the Netherlands.
Measuring financial protection: an approach for the WHO European Region
 Division of Health Systems and Public Health WHO Regional Office for Europe Measuring financial protection: an approach for the WHO European Region Jon Cylus WHO Barcelona Office for Health Systems Strengthening
DATA SET ON INVESTMENT FUNDS (IVF) Naming Conventions
 Naming Conventions") DIRECTORATE GENERAL STATISTICS LAST UPDATE: 10 APRIL 2013 DIVISION MONETARY & FINANCIAL STATISTICS ECB-UNRESTRICTED DATA SET ON INVESTMENT FUNDS (IVF) Naming Conventions The series keys related to Investment
DIRECTORATE GENERAL STATISTICS LAST UPDATE: 10 APRIL 2013 DIVISION MONETARY & FINANCIAL STATISTICS ECB-UNRESTRICTED DATA SET ON INVESTMENT FUNDS (IVF) Naming Conventions The series keys related to Investment
FCCC/SBI/2010/10/Add.1
 United Nations Framework Convention on Climate Change Distr.: General 25 August 2010 Original: English Subsidiary Body for Implementation Contents Report of the Subsidiary Body for Implementation on its
Raising the retirement age is the labour market ready for active ageing: evidence from EB and Eurofound research
 Raising the retirement age is the labour market ready for active ageing: evidence from EB and Eurofound research Robert Anderson, EUROFOUND, Dublin Reforming pension systems in Europe and Central Asia
Statistics Brief. Investment in Inland Transport Infrastructure at Record Low. Infrastructure Investment. July
 Statistics Brief Infrastructure Investment July 2015 Investment in Inland Transport Infrastructure at Record Low The latest update of annual transport infrastructure investment and maintenance data collected
CFA Institute Member Poll: Euro zone Stability Bonds
 CFA Institute Member Poll: Euro zone Stability Bonds I. About the Survey... 2 a. Background... 2 b. Purpose and Methodology... 2 II. Full Results... 2 Q1: Requirement of common issuance of sovereign bonds...
FSMA_2017_05-01 of 24/02/2017
 FSMA_2017_05-01 of 24/02/2017 This Communication is addressed to Belgian alternative investment fund managers who intend to market, to professional investors, units or shares of European Economic Area
Enterprise Europe Network SME growth forecast
 Enterprise Europe Network SME growth forecast 2017-18 een.ec.europa.eu Foreword Since we came into office three years ago, this European Commission has put the creation of more jobs and growth at the centre
Trends in the European Investment Fund Industry. in the Third Quarter of 2016
 Quarterly Statistical Release December 2016, N 67 This release and other statistical releases are available on Efama s website (www.efama.org) Trends in the European Investment Fund Industry in the Third
Trends in the European Investment Fund Industry. in the Third Quarter of 2018
 Quarterly Statistical Release December 2018 N 75 This release and other statistical releases are available on Efama s website (www.efama.org) Trends in the European Investment Fund Industry in the Third
Comparing pay trends in the public services and private sector. Labour Research Department 7 June 2018 Brussels
 Comparing pay trends in the public services and private sector Labour Research Department 7 June 2018 Brussels Issued to be covered The trends examined The varying patterns over 14 years and the impact
May 2009 Euro area external trade surplus 1.9 bn euro 6.8 bn euro deficit for EU27
 STAT/09/106 17 July 2009 May 2009 Euro area external trade surplus 1.9 6.8 deficit for EU27 The first estimate for the euro area 1 (EA16) trade balance with the rest of the world in May 2009 gave a 1.9
Council conclusions on "First Annual Report to the European Council on EU Development Aid Targets"
 COUNCIL OF THE EUROPEAN UNION Council conclusions on "First Annual Report to the European Council on EU Development Aid Targets" 3091st FOREIGN AFFAIRS Council meeting Brussels, 23 May 2011 The Council
The CAP reform process in perspective: issues of the post-2013 debate
 The CAP reform process in perspective: issues of the post-213 debate Tassos Haniotis Director - Economic Analysis, Perspectives and Evaluations DG for Agriculture and Rural Development European Commission
COMMISSION DECISION of 23 April 2012 on the second set of common safety targets as regards the rail system (notified under document C(2012) 2084)
 2084)") 27.4.2012 Official Journal of the European Union L 115/27 COMMISSION DECISION of 23 April 2012 on the second set of common safety targets as regards the rail system (notified under document C(2012) 2084)
27.4.2012 Official Journal of the European Union L 115/27 COMMISSION DECISION of 23 April 2012 on the second set of common safety targets as regards the rail system (notified under document C(2012) 2084)
Quarterly Financial Accounts Household net worth reaches new peak in Q Irish Household Net Worth
 Quarterly Financial Accounts Q4 2017 4 May 2018 Quarterly Financial Accounts Household net worth reaches new peak in Q4 2017 Household net worth rose by 2.1 per cent in Q4 2017. It now exceeds its pre-crisis
Dividends from the EU to the US: The S-Corp and its Q-Sub. Peter Kirpensteijn 23 September 2016
 Dividends from the EU to the : The S-Corp and its Q-Sub Peter Kirpensteijn 23 September 2016 The Inc: large multinational manufacturing company residents The LLC: holding company owned by tax residents
Single Market Scoreboard
 Single Market Scoreboard Performance per Member State Romania (Reporting period: 2017) Transposition of law In 2016, the Member States had to transpose 66 new directives, which represents a large increase
COMMISSION OF THE EUROPEAN COMMUNITIES COMMISSION STAFF WORKING DOCUMENT. Annex to the
 COMMISSION OF THE EUROPEAN COMMUNITIES Brussels, 19122006 SEC(2006) 1690 COMMISSION STAFF WORKING DOCUMENT Annex to the COMMUNICATION FROM THE COMMISSION TO THE COUNCIL, THE EUROPEAN PARLIAMENT AND THE
Statistics: Fair taxation of the digital economy
 Statistics: Fair taxation of the digital economy Your reply: can be published with your personal information (I consent to the publication of all information in my contribution in whole or in part including
EU Pension Trends. Matti Leppälä, Secretary General / CEO PensionsEurope 16 October 2014 Rovinj, Croatia
 EU Pension Trends Matti Leppälä, Secretary General / CEO PensionsEurope 16 October 2014 Rovinj, Croatia 1 Lähde: World Bank 2 Pension debt big (implicit debt, % of GDP, 2006) Source:Müller, Raffelhüschen
Bank resolution in the Swedish context
 Bank resolution in the Swedish context Hans Lindblad Director General UBS Annual Nordic Financial Services Conference Stockholm 8 september 2016 The Swedish economy is performing well GDP growth is strong
InnovFin SME Guarantee
 InnovFin SME Guarantee Implementation Update Reporting date: 30/09/2017 Disclaimer This presentation contains general information about the implementation results of InnovFin SME Guarantee, a facility
August 2008 Euro area external trade deficit 9.3 bn euro 27.2 bn euro deficit for EU27
 STAT/08/143 17 October 2008 August 2008 Euro area external trade deficit 9.3 27.2 deficit for EU27 The first estimate for the euro area 1 (EA15) trade balance with the rest of the world in August 2008
October 2010 Euro area unemployment rate at 10.1% EU27 at 9.6%
 STAT//180 30 November 20 October 20 Euro area unemployment rate at.1% EU27 at 9.6% The euro area 1 (EA16) seasonally-adjusted 2 unemployment rate 3 was.1% in October 20, compared with.0% in September 4.
Taxation trends in the European Union Further increase in VAT rates in 2012 Corporate and top personal income tax rates inch up after long decline
 STAT/12/77 21 May 2012 Taxation trends in the European Union Further increase in VAT rates in 2012 Corporate and top personal income tax rates inch up after long decline The average standard VAT rate 1
March 2005 Euro-zone external trade surplus 4.2 bn euro 6.5 bn euro deficit for EU25
 STAT/05/67 24 May 2005 March 2005 Euro-zone external trade surplus 4.2 6.5 deficit for EU25 The first estimate for euro-zone 1 trade with the rest of the world in March 2005 was a 4.2 billion euro surplus,
EU KLEMS Growth and Productivity Accounts March 2011 Update of the November 2009 release
 EU KLEMS Growth and Productivity Accounts March 2011 Update of the November 2009 release Description of methodology and country notes Prepared by Reitze Gouma, Klaas de Vries and Astrid van der Veen-Mooij
Second estimate for the third quarter of 2008 EU27 current account deficit 39.5 bn euro 19.3 bn euro surplus on trade in services
 STAT/09/12 22 January 2009 Second estimate for the third quarter of 20 EU27 current account deficit 39.5 bn euro 19.3 bn euro surplus on trade in According to the latest revisions1, the EU272 external
Chart pack to council for cooperation on macroprudential policy
 Chart pack to council for cooperation on macroprudential policy Contents List of charts... 3 Macro and macro-financial setting... 5 Swedish macroeconomic setting... 5 Foreign macroeconomic setting... Macro-financial
Trends in the European Investment Fund Industry. in the Third Quarter of 2017
 Quarterly Statistical Release December 2017 N 71 This release and other statistical releases are available on Efama s website (www.efama.org) Trends in the European Investment Fund Industry in the Third
The Eureka Eurostars Programme
 The Eureka Eurostars Programme 29/03/2011 Terence O Donnell, Eureka National Project Co-ordinator What is EUREKA? > 2 > EUREKA is a public network supporting R&D-performing businesses > Established in
EIB Financing for Social and Affordable Housing
 EIB Financing for Social and Affordable Housing Andrea Colantonio, Urban Development Division, European Investment Bank Affordable housing for inclusive cities, 16 th May 2018 Brussels European Investment
January 2010 Euro area unemployment rate at 9.9% EU27 at 9.5%
 STAT//29 1 March 20 January 20 Euro area unemployment rate at 9.9% EU27 at 9.5% The euro area 1 (EA16) seasonally-adjusted 2 unemployment rate 3 was 9.9% in January 20, the same as in December 2009 4.
August 2005 Euro-zone external trade deficit 2.6 bn euro 14.2 bn euro deficit for EU25
 STAT/05/132 20 October 2005 August 2005 Euro-zone external trade deficit 2.6 14.2 deficit for EU25 The first estimate for euro-zone 1 trade with the rest of the world in August 2005 was a 2.6 billion euro
Borderline cases for salary, social contribution and tax
 Version Abstract 1 (5) 2015-04-21 Veronica Andersson Salary and labour cost statistics Borderline cases for salary, social contribution and tax (Workshop on Labour Cost Survey, Rome, Italy 5-6 May 2015)
34 th Associates Meeting - Andorra, 25 May Item 5: Evolution of economic governance in the EU
 34 th Associates Meeting - Andorra, 25 May 2012 - Item 5: Evolution of economic governance in the EU Plan of the Presentation 1. Fiscal and economic coordination: how did it start? 2. Did it work? 3. Five
3 Labour Costs. Cost of Employing Labour Across Advanced EU Economies (EU15) Indicator 3.1a
 Indicator 3.1a") 3 Labour Costs Indicator 3.1a Indicator 3.1b Indicator 3.1c Indicator 3.2a Indicator 3.2b Indicator 3.3 Indicator 3.4 Cost of Employing Labour Across Advanced EU Economies (EU15) Cost of Employing Labour
3 Labour Costs Indicator 3.1a Indicator 3.1b Indicator 3.1c Indicator 3.2a Indicator 3.2b Indicator 3.3 Indicator 3.4 Cost of Employing Labour Across Advanced EU Economies (EU15) Cost of Employing Labour
COUNCIL OF THE EUROPEAN UNION. Brussels, 21 December 2009 (OR. en) 16488/3/09 REV 3 STAT 32 FIN 519
 16488/3/09 REV 3 STAT 32 FIN 519") COUNCIL OF THE EUROPEAN UNION Brussels, 21 December 2009 (OR. en) 16488/3/09 REV 3 STAT 32 FIN 519 LEGISLATIVE ACTS AND OTHER INSTRUMTS Subject: COUNCIL REGULATION adjusting with effect from 1 July 2009
COUNCIL OF THE EUROPEAN UNION Brussels, 21 December 2009 (OR. en) 16488/3/09 REV 3 STAT 32 FIN 519 LEGISLATIVE ACTS AND OTHER INSTRUMTS Subject: COUNCIL REGULATION adjusting with effect from 1 July 2009
COMMISSION STAFF WORKING DOCUMENT Accompanying the document
 EUROPEAN COMMISSION Brussels, 9.10.2017 SWD(2017) 330 final PART 13/13 COMMISSION STAFF WORKING DOCUMENT Accompanying the document REPORT FROM THE COMMISSION TO THE EUROPEAN PARLIAMENT, THE COUNCIL, THE
Hasil Common Effect Model
 Hasil Common Effect Model Date: 05/11/18 Time: 06:20 C 21.16046 1.733410 12.20742 0.0000 IPM -25.74125 2.841429-9.059263 0.0000 FDI 9.11E-11 1.96E-11 4.654743 0.0000 X 0.044150 0.021606 2.043430 0.0425
Gender pension gap economic perspective
 Gender pension gap economic perspective Agnieszka Chłoń-Domińczak Institute of Statistics and Demography SGH Part of this research was supported by European Commission 7th Framework Programme project "Employment
Taxation trends in the European Union EU27 tax ratio at 39.8% of GDP in 2007 Steady decline in top personal and corporate income tax rates since 2000
 DG TAXUD STAT/09/92 22 June 2009 Taxation trends in the European Union EU27 tax ratio at 39.8% of GDP in 2007 Steady decline in top personal and corporate income tax rates since 2000 The overall tax-to-gdp
Synergies and Trade-offs between Energy Efficiency and Sustainablity Indicators: The EU-28 Study of Sustainable Energy Use
 14.6.217 Synergies and Trade-offs between Energy Efficiency and Sustainablity Indicators: The EU-28 Study of Sustainable Energy Use Jari Kaivo-oja, Jyrki Luukkanen & Jarmo Kaivo-oja Session 6, Futures
Learn more about Thresholds
 Learn more about Thresholds VAT registration: Threshold VAT registration thresholds 1.1. Overview of local VAT threshold Local VAT registration thresholds were designed to reduce the administrative burden