Drägerwerk AG & Co. KGaA Capital Markets Presentation. March, 2015
|
|
|
- Edward Rodgers
- 5 years ago
- Views:
Transcription
1 Drägerwerk AG & Co. KGaA Capital Markets Presentation March, 2015
2 Disclaimer This presentation does not constitute an offer of securities for sale or a solicitation of an offer to purchase any securities. No money, securities or other consideration is being solicited by this presentation. This presentation contains forward-looking statements regarding the future development of the Dräger Group. These forward-looking statements are based on the current expectations, presumptions, and forecasts of the Executive Board as well as the information available to it to date, and have been made to the best of its knowledge and belief. No guarantee or liability for the occurrence of the future developments and results specified can be assumed in respect of such forward-looking statements. Rather, the future developments and results are dependent on a number of factors; they entail risks and uncertainties beyond our control and are based on assumptions which could prove to be incorrect. Notwithstanding any legal requirements to adjust forecasts, we assume no obligation to update the forward-looking statements contained in this presentation. Interim financial reports as well as preliminaries are not audited. 2


3 Dräger The Company Financials Outlook 3


4 4 Dräger The Company
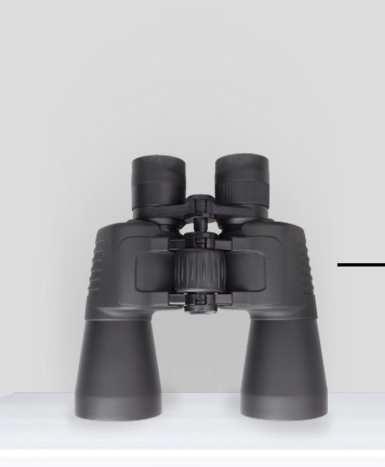
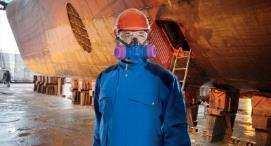
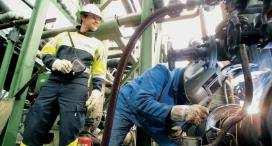
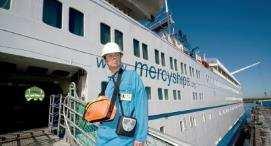
5 Dräger products protect, lives support and save. 5
6 Net sales development Strong growth independent of the global economy Dräger net sales in EUR million Global gross domestic product Net sales development 2,500 Financial crisis 2,000 1,500 1,000 Second oil crisis 500 Gulf War Mexican peso crisis Russian financial crisis Stockmarket crash Stockmarket crash Iraq War Source: International Monetary Fund, World Economic Outlook Database 6
7 Dräger worldwide Net sales, sites and employees Dräger at a glance Safetydivision 36 % 17 % 19 % 8 % Net Sales: EUR 2.4 bn 12 % 3 % 56 % Medicaldivision 64 % Dräger-Sites Production sites in Europe, America, Africa und Asia Sales and Service organizations worldwide 15 % Europe 13,737 employees in 2014 Asia/Pacific 70 % America Middle East, Africa and Other 7


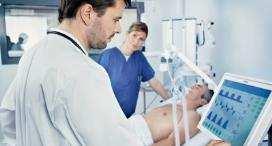
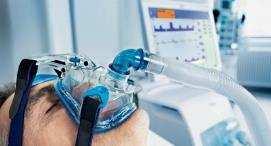
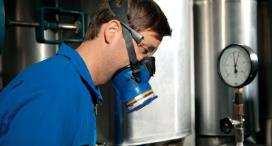
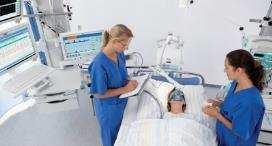
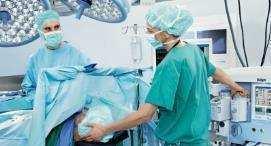
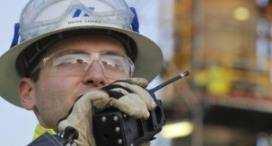
8 Markets Our customers Hospital Fire services Oil and gas industry Mining Chemical industry Other markets 8


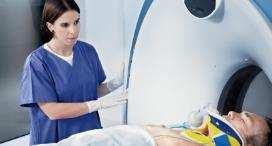
9 Intensive Care Operating Room Neonatal Care Hospital wide Solutions Anesthesiology Respiratory Care Thermoregulation #1 in Europe #2 in the US market for anesthesia devices and vaporizers #1 in Europe #3 in the US market for ventilators #2 worldwide #1 in Europe for incubators and phototherapy Patient Monitoring & Clinical Data Management Workplace Infrastructure #3 worldwide for monitoring Infinity Acute Care System IT network solutions Telemetry and IT solutions Integrated workplace solutions Project business Gas management, architectural systems Medical lights Hospital Consumables & Service Training and service Consumables and accessories Multivendor services Note: Market position based on Dräger s market knowledge and its own assessment of market position; positions ranked according to net sales, for monitoring depending on market definition. 9


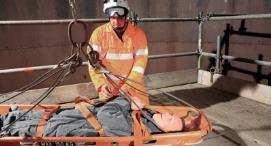
10 Oil & Gas Chemical Mining Fire Service Fire Fighting #2 worldwide in integrated breathing protection for fire departments Plant Safety Gas Management Shutdown Management #1 position worldwide and in Europe #3 in the US market Project business Customer specific solutions Shutdown- and Safetymanagement Occupational Health & Safety Train & Prepare Breathing protection and air purifying respiratory protection Training Dräger Academy mobile and stationary firefighting training systems Service Products & Solutions Spareparts and consumables business Classical-, Multivendorand Remote-Service Note: Market positions based on Dräger s market knowledge and its own assessment of market position; positions ranked according to net sales. 10
11 Medical and safety technology providing long-term growth prospects in developed and emerging markets Hospital Oil&Gas Chemical Mining FireService Attractive growth prospects in sizeable markets Average expected annual market growth for the global medical equipment market significantly exceeding growth in many other sectors Strong growth prospects in both developed and emerging markets Very diversified markets with numerous product and service offerings Attractive growth prospects for target sectors (e.g. industry) and growing safety investments in Europe and the US Rapidly aging population and consequently increasing healthcare expenditure Increasing demand for medical equipment to improve clinical workflows and efficiency Increasingly stricter safety regulations Rising environmental awareness Improved outlook for target markets as well as in emerging markets Strong growth of GDP and population resulting in a demand for improved medical services Political benefits from investments in health care sector Increasingly higher safety standards Increasing industrial hygiene awareness Strong growth of key customer sectors 11
12 Strategy for profitable growth 1 Management of innovation rate through continuous improvements in quality and R&D processes 2 Expansion of market positions in attractive markets. Special focus on profitable growth in developing countries 3 Expansion of service and consumables business 4 FIT FOR GROWTH efficiency program 12


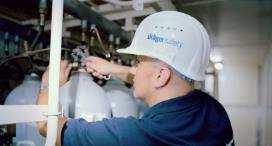
13 1 Technology and innovation leadership to drive profitable growth Strong R&D focus Innovation to enhance future growth (examples) Approximately 1,400 employees in R&D around the globe EUR 212 million spent for R&D activities in 2014 (8.7 % of net sales) Tradition of innovation and quality leadership Very close collaboration with customers to develop new and improve existing products R&D focus on integration of products and services to provide solutions which support customer workflows R&D strives to leverage advantage of using same technology for different market segments and products (e.g. in gas sensors) Technological competency and high quality standards result in leading market positions and high barriers to entry Integration Monitoring and Anesthesia Device Anesthesia device Perseus A500 with IACS Monitoring integration for optimized workflow in the OR Sensor Portfolio Permanent expansion of the sensor portfolio: broad spectrum of detectible gases, low concentration, high reliability, long life time Clinical Apps Software based decision support to improve medical outcomes. E.g. Smart Pilot View, Sepsis-Guard 13


14 2 Exploit growth potentials in developing countries 2 Investments in profitable growth in developing countries Focus on the specific needs of customer in developing countries Identify growth potential in strong growing markets like China, Brazil and India Capitalize on the significant investments into the Sales & Service infrastructure and specific market knowledge, especially in our Regions Asia / Pacific, Central- and South- America Enhance engagement with partners in developing countries to expand local presence with R&D, manufacturing, sales and after sales business Net sales 2014 Newly industrialized countries 24 % Focused product range Developed Markets 76 % Savina Color Vista 120 Fabius Plus XL 14


 is a critical factor for customers Dräger Service")


15 3 Service- and consumables business a clear focus of our Sales activities 3 Further expansion of service and consumables business Capitalize on large installed base to expand after sales business Continued expansion of service and spare parts offering Focus on combined sale of equipment and after sales contracts Dräger Service Dräger Consumables Globally over 3,000 service technicians Fast and reliable service (repairs and spare parts) is a critical factor for customers Dräger Service technicians important for customer loyalty Efficient service solutions via remote service Multi Vendor Service Administration and Service-Documentation of customers equipment pool Functionalities with added value, e.g. optimizing workflow with RFID-based communication between consumables part and therapy machine Dräger quality to improve hygienic standards Dräger value add especially in development of consumables. Production usually via suppliers Partly proprietary consumable products, e.g. Dräger-Tubes 15
16 4 FIT FOR GROWTH Overview Initiatives SHAPE Improve SG & A expense ratio and working capital Optimize global Sales, Marketing & Administration set-up Legal entity consolidation within sales organization Streamlining, standardization and pooling of central, regional and local tasks and processes Effective expense management Reduction of SGA ratio* by 1pp in 2017 and additional 1pp 2019 Fit! Bring customer value faster to the market and increase innovation share Global footprint Improve workflow and delivery times and reduce production cost Optimize innovation set-up E.g. Improve competency-, capability- and technology management, strengthen system and platform based development, increase global standardization, reengineer launch process to improve ramp-up speed, expand product portfolio targeted at Emerging Markets, Improve Time to market by 50% until 2019 and increase innovation share Optimize production set-up Investment into Zukunftsfabrik in Lübeck, Germany Transfer of production with high labor content to Chomutov, Czech Republic Consolidation of US-facilities (closure of Pittsburgh site) * compared to 2014 (SG&A ratio = 31%) at comparable FX rates and before possible on-off expenses for restructuring or similar 16
17 4 FIT FOR GROWTH Effects on EBIT-margin* Net sales growth of CAGR 3 to 6 percent (net of currency effects) ~7% +2% SHAPE SG&A ratio Global footprint stabilize GP-margin FIT! R&D ratio >10% Improve Working Capital Reduce time to market * The forecasted EBIT margin is based on the assumption of constant currencies (basis FX beginning 2015) 17


18 18 Financials
19 Business development Dräger Group Q Q million million million million million million million Net Sales 2, , , , , % growth 13.9% 3.6% 5.2% 0.0% 2.5% -1.2% 7.2% % growth (currency adjusted) 9.5% 4.4% 2.5% 3.1% 4.0% 2.9% 6.3% Gross margin 48.0% 49.1% 49.2% 48.3% 46.7% 46.8% 47.4% Functional Expenses % of Net Sales -38.5% -39.7% -39.4% -39.7% -39.7% -34.0% -34.7% EBITDA EBITDA Margin 11.3% 12.2% 12.5% 11.4% 10.5% 15.1% 15.6% EBIT EBIT Margin 8.9% 9.5% 9.7% 8.5% 7.3% 12.5% 12.6% Interest Result Tax rate 31.8% 30.8% 31.3% Net Profit DVA % % Currency adjusted 12M: order intake +2.8%, orders on hand -5.6%, net sales +4.0% Currency adjusted quarter: order intake +5.5%, orders on hand -5.6%, net sales +6.3% 19
20 Business development Medical division, Safety division Medical division (in EUR million) Safety division (in EUR million) % 9.9% 1,558 1, % 1, % 10.3% % Net Sales EBIT % EBIT-margin 20
21 Key figures Change million million million million million % Cashflow (from operating activities) in % of EBIT 114% 76% 77% 34% 105% Investments Cash and cash equivalents Net financial debt Net financial debt 1 /EBITDA Capital employed , , ROCE (EBIT 2 /Capital employed 1 ) 23.1% 24.3% 25.5% 19.1% 16.1% Net Working Capital DVA Headcount 1 11,291 11,924 12,516 13,334 13, Values at due date 2 EBITDA and accordingly EBIT of the last twelve months 21

22 22 Outlook
23 Outlook 2015 and mid term guidance Net Sales + 4.0% (net of currency effects) e Mid term 2019e 2.0% 5.0% (net of currency effects) CAGR 3.0% 6.0% (net of currency effects) EBIT-margin 7.3% 6.0% 8.0%* >10 %* Gross-margin 46.7% On the prior year s level Cash flow from operating activities 105.0% of EBIT > 70.0% of EBIT Equity ratio 40.1% > 40.0% * based on the assumption of constant currencies (basis FX beginning 2015) 23
24 Outlook 2015 and mid term guidance Net sales growth of 2% to 5% (net of currency effects) EBIT-margin of 6.0% to 8.0%* GP-margin on par with prior year R&D Budget increase to up to 230m Improvement of SG&A ratio** of 1pp R&D ratio starting to decline first improvements in time to market Net sales growth CAGR 3 6 % (net of currency effects) Improvement of SG&A ratio** of additional 1pp time to market improved by 50%*** stable gross profit margin EBIT-margin above 10%* * based on the assumption of constant currencies (basis FX beginning 2015) ** compared to 2014 (SG&A ratio = 31%) at comparable FX rates and before possible on-off expenses for restructuring or similar *** innovation projects starting
25 25 Guiding philosophy What we stand for


26 26
 Executive Board member for Innovation and IT Executive Board member for Finance (Chief Financial")

27 Dräger executive board Stefan Dräger Anton Schrofner Gert-Hartwig Lescow Chairman of the Executive Board (Chief Executive Officer) Executive Board member for Innovation and IT Executive Board member for Finance (Chief Financial Officer) Fifth generation of the Dräger family to lead the company Responsible for the Africa, Asia/Pacific and Middle East regions Responsible for the Americas region At Dräger since 1992 At Dräger since 2010 At Dräger since
28 Shareholder structure 10,160,000 common shares (28.5 % free float) 7,100,000 preferred shares (100.0 % free float) Shareholding Common shares Shareholding Dr. Heinrich Dräger GmbH 28.5% 4.3% 18.1% 58.7% 67.2 % 23.2% Dr. Heinrich Dräger GmbH Free float Members of the Dräger family Stefan Dräger GmbH Dräger Foundation Successors of Dr. Heinrich Dräger 28
29 Consolidated balance sheet Assets 31 Dec Dec 2014 Change million million % Intangible assets Property, plant and equipment Other non-current assets Non-current assets Inventories Trade receivables Other current assets Cash and cash equivalents Current assets 1, , Total assets 2, ,
30 Consolidated balance sheet Equity and liabilities 31 Dec Dec 2014 Change million million % Equity Liabilities from participation certificates Provisions for pensions and similar obligations Non-current interest-bearing loans Other non-current liabilities Non-current liabilities Current provisions Current loans and liabilities to banks Trade payables Other current liabilities Current liabilities Total equity and liabilities 2, ,
31 All Regions contributed to top-line growth Regional Order Entry of Dräger Group America Europe +5.2% +2.9% constant currency constant currency 1,360 1, % % 471 nominal Middle East, Africa, Others nominal 2013 Asia-Pacific +6.4% +5.4% constant currency constant currency +5.1% +2.6% 392 nominal nominal
32 Business development Medical division Q Q million million million million million million Change % Order Intake 1, , , , Order on hand Net Sales 1, , , , EBIT EBIT Margin 12.9% 11.9% 9.9% 8.1% 15.8% 16.0% DVA Currency adjusted 12M: order intake +2.8%, orders on hand -4.6%, net sales +4.3% 1 Currency adjusted quarter: order intake +4.1%, orders on hand -4.6%, net sales +7.2% 32
33 Business development Medical division: order entry in Q and FY 2014 Middle East, Africa & Others Asia/Pasific % nom % cc % +4.1% % +11.5% -17.0% +7.7% 76.5 % nom % cc 1, % +2.8% % -4.3% +3.5% +6.3% -2.4% +0.6% +3.0% +4.0% % +12.6% Americas +2.4% +3.2% Q FY 2014 Europe 33
34 Business development Safety division Q Q Change million million million million million million % Order Intake Order on hand Net Sales EBIT EBIT Margin 9.5% 11.5% 10.3% 9.9% 13.0% 13.2% DVA Currency adjusted 12M: order intake +4.0%, orders on hand -5.6%, net sales +4.2%. 1 Currency adjusted quarter: order intake +9.8%, orders on hand -5.6%, net sales +5.1% 34
35 Business development Safety division: order entry in Q and FY 2014 Middle East, Africa & Others Asia/Pasific Americas % nom % cc % +9.8% % +0.3% +67.4% -4.5% +19.6% +12.9% +8.9% +8.8% % nom % cc % +4.0% % -6.6% +17.4% -3.2% +5.1% +6.8% +3.5% +4.0% Q FY 2014 Europe 35
36 Functional expenses Change Q Q million million million % million million Change % R&D % of Net Sales -8.3% -8.5% -8.7% -7.0% -7.4% SG&A % of Net Sales -31.0% -31.1% -30.8% -26.8% -26.9% Functional Expenses total % of Net Sales -39.4% -39.7% -39.7% -34.0% -34.7% 36
37 Cash-flow statement EUR million EUR million Group net profit Change in inventories Change in accounts receivables >100 Change in accounts payables >100 Depreciation and amortization Other operating cash flow items Operating cash flow >100 Investing cash flow Free cash flow >100 Financing cash flow Change in cash >100 Cash and cash equivalents Change in cash and cash equivalents, i.e. without any effect of exchange rates 2 Values at due date Change EUR million EUR million % 37
38 Innovation rate to manage power of innovation Improvement of Innovation process Continued development of new innovative products and introduction of product upgrades Increasing net sales share of new products Continued strong investments in R&D Share on new products and upgrades medical division 1 45% 40% Net sales Upgrades New products 37% 35% 30% 33% 29% 33% 34% 32% 25% 20% 26% 26% 15% 23% 28% 22% 15% 10% 5% 0% 11% 14% 10% 7% % % Launched in the last 3 years; products are regarded as new, if they enable Dräger to either enter a new market segment or if products are regarded as completely new according to Dräger s customers and Dräger s sales force. Upgrades are those products, which serve existing Dräger markets, but their functionality is perceived as significantly enhanced by Dräger s customers and Dräger s sales force. 38
39 Financial calendar March 11, Accounts press conference, Lübeck - Analysts meeting, Frankfurt April 29, Report for the first three months Conference call, Lübeck April 30, Annual shareholders' meeting, Lübeck July 30, Report for the first six months Conference call, Lübeck November 5, Report for the first nine months Conference call, Lübeck 39
40 Contact Melanie Kamann Corporate Communications Thomas Fischler Investor Relations Drägerwerk AG & Co. KGaA Drägerwerk AG & Co. KGaA Moislinger Allee Moislinger Allee Lübeck, Germany Lübeck, Germany Tel Tel Fax Fax Mobile Mobile
Drägerwerk AG & Co. KGaA Capital Markets Presentation. March, 2016
 Drägerwerk AG & Co. KGaA Capital Markets Presentation March, 2016 Disclaimer This presentation does not constitute an offer of securities for sale or a solicitation of an offer to purchase any securities.
Worldwide. On Site. Drägerwerk AG & Co. KGaA Capital Markets Presentation. January, 2018
 Worldwide. On Site. Drägerwerk AG & Co. KGaA Capital Markets Presentation January, 2018 Disclaimer This presentation does not constitute an offer of securities for sale or a solicitation of an offer to
Drägerwerk AG & Co. KGaA Capital Markets Presentation. October, 2018
 Drägerwerk AG & Co. KGaA Capital Markets Presentation October, 2018 Disclaimer This presentation does not constitute an offer of securities for sale or a solicitation of an offer to purchase any securities.
Drägerwerk AG & Co. KGaA Capital Markets Presentation. July, 2018
 Drägerwerk AG & Co. KGaA Capital Markets Presentation July, 2018 Disclaimer This presentation does not constitute an offer of securities for sale or a solicitation of an offer to purchase any securities.
Worldwide. On Site. Drägerwerk AG & Co. KGaA Capital Markets Presentation. May, 2017
 Worldwide. On Site. Drägerwerk AG & Co. KGaA Capital Markets Presentation May, 2017 Disclaimer This presentation does not constitute an offer of securities for sale or a solicitation of an offer to purchase
Conference call Interim report January 1 to March 31, Lübeck, April 26, 2016
 Conference call Interim report January 1 to March 31, 2016 Lübeck, April 26, 2016 Disclaimer This presentation does not constitute an offer of securities for sale or a solicitation of an offer to purchase
Conference call Interim report January 1 to March 31, Lübeck, April 26, 2018
 Conference call Interim report January 1 to March 31, 2018 Lübeck, April 26, 2018 Disclaimer This presentation does not constitute an offer of securities for sale or a solicitation of an offer to purchase
Conference call Interim report January 1 to March 31, Lübeck, May 2, 2013
 Conference call Interim report January to March 3, 203 Lübeck, May 2, 203 Disclaimer This presentation does not constitute an offer of securities for sale or a solicitation of an offer to purchase any
Conference call Interim report January 1 to September 30, 2018
 ICH WERDE DA SEIN. Conference call Interim report January 1 to September 30, 2018 Lübeck, October 30, 2018 Disclaimer This presentation does not constitute an offer of securities for sale or a solicitation
Analyst Conference Drägerwerk AG & Co. KGaA. Frankfurt, March 8 th 2018
 Analyst Conference Drägerwerk AG & Co. KGaA Frankfurt, March 8 th 2018 Disclaimer This presentation does not constitute an offer of securities for sale or a solicitation of an offer to purchase any securities.
Worldwide. On Site. Conference call Interim report January 1 to June 30, Lübeck, July 27, 2017
 Worldwide. On Site. Conference call Interim report January 1 to June 30, 2017 Lübeck, July 27, 2017 Disclaimer This presentation does not constitute an offer of securities for sale or a solicitation of
Analyst Conference Drägerwerk AG & Co. KGaA. March 7 th 2019
 Analyst Conference Drägerwerk AG & Co. KGaA March 7 th 2019 Disclaimer This presentation does not constitute an offer of securities for sale or a solicitation of an offer to purchase any securities. No
Drägerwerk AG & Co. KGaA Analysts Meeting. Frankfurt, March 14, 2012
 Drägerwerk AG & Co. KGaA Analysts Meeting Frankfurt, March 4, 202 Disclaimer This presentation does not constitute an offer of securities for sale or a solicitation of an offer to purchase any securities.
Quarterly Statement January 1 to September 30, 2017 Dräger Group
 Quarterly Statement January 1 to September 30, 2017 Dräger Group THE DRÄGER GROUP OVER THE PAST FIVE YEARS 2013 2014 2015 2016 2017 Order intake million 1,756.7 1,743.4 1,895.1 1,849.1 1,928.3 Net sales
Quarterly Statement January 1 to March 31, 2017 Dräger Group
 Quarterly Statement January 1 to March 31, 2017 Dräger Group THE DRÄGER GROUP OVER THE PAST FIVE YEARS 2013 2014 2015 2016 2017 Order intake million 571.3 544.6 615.3 599.6 639.4 Net sales million 533.8
Quarterly Statement January 1 to March 31, 2016 Dräger Group
 Quarterly Statement January 1 to March 31, 2016 Dräger Group THE DRÄGER GROUP over the past five years 2012 2013 2014 2015 2016 Order intake million 550.9 571.3 544.6 615.3 599.6 Net sales million 529.3
Quarterly Statement January 1 to March 31, 2018 Dräger Group
 Quarterly Statement January 1 to March 31, 2018 Dräger Group THE DRÄGER GROUP OVER THE PAST FIVE YEARS 2014 2015 2016 2017 2018 Order intake million 544.6 615.3 599.6 639.4 621.4 Net sales million 513.2
Nine months 2011: Dräger increases order intake and earnings
 Page 1 / 5 Nine months 2011: Dräger increases order intake and earnings - Order intake grows by 7.8 percent - EBIT margin reaches 9.0 percent - Equity ratio continues to rises to 34.7 percent - Sales reorganization
Q1/2005 report Dräger Group
 Q1/2005 report Dräger Group D 3 Contents 4 Preliminary remarks 4 Preparation of the interim financial statements 5 Business performance Q1/2005 5 Dräger Group 8 Business performance of the segments 8
H1/2005 report Dräger Group
 H1/2005 report Dräger Group D 3 Contents 4 Preliminary remarks 4 Preparation of the interim financial statements 5 Business performance H1/2005 5 Dräger Group 8 Business performance of the segments 8
Half-yearly financial report January 1 to June 30, 2012 Dräger Group
 Half-yearly financial report January 1 to June 30, Dräger Group THE DRÄGER GROUP OVER THE PAST FIVE YEARS Six months 2008 Six months 2009 Six months 2010 Six months Six months Change on in % Order intake
FINANCIAL CALENDAR 2018 Imprint Drägerwerk AG & Co. KGaA Concept and design Publication Drägerwerk AG & Co. KGaA Reproductions Printed by
 Annual Report 2017 Technology for Life COMPANY PROFILE Dräger is an international leader in the fi elds of medical and safety technology. The family-run company was founded in Lübeck, Germany, in 1889.
Quarterly Report January 1 to March 31, 2011 Dräger Group
 Quarterly Report January 1 to March 31, 2011 Dräger Group THE DRÄGER GROUP over the past five years 2007 2008 2009 2010 2011 Change on 2010 in % Order intake million 444.9 493.8 448.6 488.2 553.6 +13.4
Half-yearly financial report January 1 to June 30, 2017 Dräger Group
 Half-yearly financial report January 1 to June 30, 2017 Dräger Group THE DRÄGER GROUP OVER THE PAST FIVE YEARS Six months 2013 Six months 2014 Six months 2015 Six months 2016 Six months 2017 Order intake
Quarterly Report January 1 to September 30, 2012 Dräger Group
 Quarterly Report January 1 to September 30, Dräger Group THE DRÄGER GROUP OVER THE PAST FIVE YEARS Nine months 2008 Nine months 2009 Nine months 2010 Nine months Nine months Change on in % Order intake
Half-yearly financial report January 1 to June 30, 2016 Dräger Group
 Half-yearly financial report January 1 to June 30, 2016 Dräger Group THE DRÄGER GROUP OVER THE PAST FIVE YEARS Six months 2012 Six months 2013 Six months 2014 Six months 2015 Six months 2016 Order intake
Quarterly Report January 1 to September 30, 2009 Dräger Group (revised version)
") Quarterly Report January 1 to September 30, 2009 Dräger Group (revised version) THE DRÄGER GROUP AT A GLANCE Nine months Nine months Nine months Nine months Change on 2006 2007 2008 2009 2008 in % Order
Quarterly Report January 1 to September 30, 2009 Dräger Group (revised version) THE DRÄGER GROUP AT A GLANCE Nine months Nine months Nine months Nine months Change on 2006 2007 2008 2009 2008 in % Order
FUCHS PETROLUB AG The leading independent lubricants manufacturer of the world
 The leading independent lubricants manufacturer of the world Dr. Alexander Selent, Vice Chairman & CFO Dagmar Steinert, Head of Investor Relations April 2013 FUCHS the leading independent lubricants manufacturer
Mindray Medical International Limited Corporate Presentation
 Mindray Medical International Limited Corporate Presentation May 2012 Disclaimer This material contains "forward looking statements" within the meaning of the safe harbor provisions of the U. S. Private
Full-Year / Fourth Quarter 2010 Results
 Full-Year / Fourth Quarter 2010 Results 16 February 2011 Disclaimer This presentation contains certain statements that are neither reported financial results nor other historical information. This presentation
Dräger Group Q1/2009 (amended version)
") Dräger Group Q1/2009 (amended version) Q1 THE DRÄGER GROUP AT A GLANCE Q1/2006 Q1/2007 Q1/2008 Q1/2009 Change on 2008 in % Order intake million 452.2 444.9 493.8 448.6 (9.2) Orders on hand million 327.2
Dräger Group Q1/2009 (amended version) Q1 THE DRÄGER GROUP AT A GLANCE Q1/2006 Q1/2007 Q1/2008 Q1/2009 Change on 2008 in % Order intake million 452.2 444.9 493.8 448.6 (9.2) Orders on hand million 327.2
EDITED TRANSCRIPT. Q Draegerwerk AG & Co KGaA Earnings Call EVENT DATE/TIME: OCTOBER 30, 2018 / 2:00PM GMT THOMSON REUTERS
 THOMSON REUTERS EDITED TRANSCRIPT Q3 2018 Draegerwerk AG & Co KGaA Earnings Call EVENT DATE/TIME: OCTOBER 30, 2018 / 2:00PM GMT 1 CORPORATE PARTICIPANTS CONFERENCE CALL PARTICIPANTS Aliaksandr Halitsa
Schaeffler Group at a glance
 Facts and figures 9M 2016 Schaeffler Group at a glance Key figures 1 st nine months Income statement (in millions) 2016 2015 Revenue 9,977 9,958 0.2 % at constant currency 2.7 % EBIT 1,276 1,251 2.0 %
Intertek Investor Presentation April 2013
 Intertek Investor Presentation April 2013 aston.swift@intertek.com sarah.ogilvie@intertek.com +44 (0)20 7396 3400 1 Cautionary statement regarding forward-looking statements This presentation contains
FINANCIAL STATEMENT 28 FEBRUARY RD QUARTER FISCAL YEAR 2017/2018
 FINANCIAL STATEMENT 28 FEBRUARY 2018 3RD QUARTER FISCAL YEAR 2017/2018 Contents 03 KEY PERFORMANCE INDICATORS 04 HIGHLIGHTS 05 INDUSTRY DEVELOPMENT 05 BUSINESS DEVELOPMENT OF THE HELLA GROUP 05 Results
EXPLOITING OPPORTUNITIES EFFICIENTLY FACTBOOK R. STAHL AG
 EXPLOITING OPPORTUNITIES EFFICIENTLY FACTBOOK R. STAHL AG NOVEMBER 2018 R. STAHL Factbook November 2018 1010 Rounding differences and rates of change Percentages and figures in this report may include
Interim statement Q / Digital in the box.
 Interim statement Q3 2017 / 2018 Digital in the box. Heidelberg Group Interim statement for the third quarter of 2017 / 2018 Figures Incoming orders after nine months on par with previous year at 1,912
Fresenius Medical Care achieves revised 2018 targets and accelerates investments for future growth
 0 Press Release Media Contact Matthias Link T +49 6172 609-2872 matthias.link@fresenius.com Contact for analysts and investors Dr. Dominik Heger T +49 6172 609-2601 dominik.heger@fmc-ag.com www.freseniusmedicalcare.com
Q1/2004 report Dräger Group
 D Q1/2004 report Dräger Group Business trend in the Dräger Group Highlights in Q1/2004 EBIT, order intake and sales again all up Growth in America and Asia/Pacific Dräger Medical unveils new IT products
Q3/2003 report Dräger Group
 D Q3/2003 report Dräger Group Business trend in the Dräger Group Highlights in Q3/2003 Despite one-off expenses and unfavorable exchange rates, EBIT at year-earlier level Q3 group order intake and sales
Interim Results 3-month figures FY 12
 Interim Results 3-month figures FY 12 Bernhard Schreier, CEO Dirk Kaliebe, CFO Robin Karpp, Head of Investor Relations Heidelberger Druckmaschinen AG August 9, 2011 Highlights Q1 FY 12 Global economic
Single entity financial statements and management report of Drägerwerk AG & Co. KGaA AS OF DECEMBER 31, 2010
 Single entity financial statements and management report of Drägerwerk AG & Co. KGaA AS OF DECEMBER 31, 2010 MANAGEMENT REPORT FINANCIAL STATEMENTS NOTES 1 CONTENTS Management report of Drägerwerk AG &
Mindray Medical International Limited
 Mindray Medical International Limited Corporate Presentation August 2011 Disclaimer This material contains "forward looking statements" within the meaning of the safe harbor provisions of the U. S. Private
Investors & Analysts Conference FY 11
 Investors & Analysts Conference FY 11 Bernhard Schreier, CEO Dirk Kaliebe, CFO Robin Karpp, Head of Investor Relations Heidelberger Druckmaschinen AG June 16, 2011 Highlights FY 11 Heidelberg is operationally
Digital in the box. Interim statement Q / 2018
 Digital in the box. Interim statement 2017 / 2018 Heidelberg Group INTERIM STATEMENT FOR THE FIRST QUARTER OF 2017/2018 Figures Incoming orders total 629 million Net sales up year-on-year at 495 million
Single entity financial statements and management report of Drägerwerk AG & Co. KGaA. as of December 31, 2011
 Single entity financial statements and management report of Drägerwerk AG & Co. KGaA as of December 31, 2011 CONTENT Management report of Drägerwerk AG & Co. KGaA Forward-looking statements 2 43 Single
Full-Year 2017/18 Results Stäfa, May 22, 2018 Arnd Kaldowski, CEO Hartwig Grevener, CFO Thomas Bernhardsgrütter, IR
 Full-Year 2017/18 Results Stäfa, Arnd Kaldowski, CEO Hartwig Grevener, CFO Thomas Bernhardsgrütter, IR Disclaimer This presentation contains forward-looking statements, which offer no guarantee with regard
Koenig & Bauer AG at 15 th German Corporate Conference 2016 January 19, 2016, Frankfurt
 People & Print Koenig & Bauer AG at 15 th German Corporate Conference 2016 January 19, 2016, Frankfurt Mathias Dähn, CFO Agenda Company overview Strategy & growth drivers Q3 2015 & outlook KBA Koenig &
2 CEO's operational report. Arni Oddur Thordarson, CEO
 1 2 CEO's operational report Arni Oddur Thordarson, CEO 2.1 Year of strategic moves and solid performance CEO's operational report Strategic acquisitions and strong organic growth On the Icelandic Stock
Hill-Rom Fourth Quarter 2016 Financial Results. November 3, 2016
 Hill-Rom Fourth Quarter 2016 Financial Results November 3, 2016 Forward Looking Statements Certain statements in this presentation contain forward-looking statements, within the meaning of the Private
January to March 2018: Linde makes a good start to the new year significant increase in Group earnings
 Press release January to March 2018: Linde makes a good start to the new year significant increase in Group earnings Group revenue: EUR 4.044 bn (up 1.4 percent after adjusting for exchange rate effects
Interim Results 9-month figures FY 11
 Interim Results 9-month figures FY 11 Bernhard Schreier, CEO Dirk Kaliebe, CFO Robin Karpp, Head of Investor Relations Heidelberger Druckmaschinen AG February 09, 2011 Highlights FY 11 Order intake increased
Interim Report January March 2018
 Interim Report January March 218 President and CEO Kjell Forsén April 25, 218 Vaisala First quarter 218 highlights Orders received EUR 87.1 (81.5) million, +7% With comparable rates +13% Order book EUR
Third quarter Vestas Wind Systems A/S. Copenhagen, 7 November 2018
 Third quarter Vestas Wind Systems A/S Copenhagen, 7 November Disclaimer and cautionary statement This document contains forward-looking statements concerning Vestas financial condition, results of operations
H1/2018 Results u-blox Holding AG
 H1/2018 Results August 24, 2018 Thomas Seiler, CEO Roland Jud, CFO Disclaimer This presentation contains certain forward-looking statements. Such forward-looking statements reflect the current views of
KONE Q JULY 19, 2017 HENRIK EHRNROOTH, PRESIDENT & CEO ILKKA HARA, CFO
 KONE Q2 2017 JULY 19, 2017 HENRIK EHRNROOTH, PRESIDENT & CEO ILKKA HARA, CFO Q2 2017 highlights Good overall execution Profitability burdened by several headwinds Stabilization in China Good improvement
CONFERENCE CALL Q May 2010
 CONFERENCE CALL Q1 2010 12 May 2010 Agenda Overview Q1 2010 Dr Helmut Leube, Chairman of the Management Board Key performance indicators Q1 2010 Dr Margarete Haase, CFO Outlook and "MOVE FAST" programme
Financial Information
 Financial Information H1 revenues reached 12.8bn up 9.8%, flat org. in Q2 Adj. EBITA reached 1.6bn, up 6.4%, Adj. EBITA margin flat excl. Invensys in a challenging environment 2015 targets: Around flat
HALF-YEAR REPORT Bobst Group SA
 HALF-YEAR REPORT 2017 Bobst Group SA Bobst Group SA Half-year report 2017 KEY FIGURES In million CHF June 2017 June 2016 June 2015 Sales 643.2 600.4 524.7 Operating result (EBIT) 39.8 18.0 14.7 In % of
Interim Results 6-month figures FY 11
 Interim Results 6-month figures FY 11 Bernhard Schreier, CEO Dirk Kaliebe, CFO Andreas Trösch, Head of Investor Relations Heidelberger Druckmaschinen AG November 10, 2010 Highlights Q2 FY 11 650 million
Interim management statement
 Interim management statement 1st to 3rd quarter of 2017 FIRST TO THIRD QUARTER AT A GLANCE DEUTZ Group: Overview 7 9/2017 7 9/2016 1 9/2017 1 9/2016 New orders 370.8 258.1 1,173.8 935.3 Unit sales (units)
Mindray Medical International Limited. November 2011
 Mindray Medical International Limited Corporate Presentation November 2011 Disclaimer This material contains "forward looking statements" within the meaning of the safe harbor provisions of the U. S. Private
FUCHS PETROLUB SE. manufacturer of the world. Dr. Alexander Selent, Vice Chairman & CFO. April 2015
 The leading independent lubricants manufacturer of the world Dr. Alexander Selent, Vice Chairman & CFO DagmarSteinert Steinert, Headof Investor Relations April 2015 The leading independent lubricants manufacturer
April 2015 A LEADING TECH COMPANY
 April 2015 A LEADING TECH COMPANY This presentation has been produced by Indra for the sole purpose expressed therein. Therefore, neither this presentation nor any of the information contained herein constitutes
However, the business review set out below for the period January to September 2018 relates solely to The Linde Group on a stand-alone basis.
 Quarterly statement January to September 2018 Group revenue: EUR 13.050 bn (up 4.8 percent after adjusting for exchange rate effects and the impact of the first-time application of IFRS 15) Group operating
KONE Q OCTOBER 26, 2017 HENRIK EHRNROOTH, PRESIDENT & CEO ILKKA HARA, CFO
 KONE Q3 2017 OCTOBER 26, 2017 HENRIK EHRNROOTH, PRESIDENT & CEO ILKKA HARA, CFO Q3 2017 highlights Orders received returned to growth in China with positive contribution from focused pricing actions Roll-out
FULL YEAR 2018 Vestas Wind Systems A/S
 FULL YEAR Vestas Wind Systems A/S Copenhagen, 7 February 2019 DISCLAIMER AND CAUTIONARY STATEMENT This document contains forward-looking statements concerning Vestas financial condition, results of operations
Presentation of the Group
 The world s leading infrastructure developer Presentation of the Group Key figures & Global Strategy July 2012 Grupo ACS The world s leading infrastructure & concessions developer Engineering contractor
FUCHS PETROLUB SE The leading independent lubricants manufacturer of the world
 FUCHS PETROLUB SE The leading independent lubricants manufacturer of the world Dr. Alexander Selent, Vice Chairman & CFO Reiner Schmidt, GMC-Member Warburg Highlights - Handout June 2015 The leading independent
COCHLEAR FINANCIAL RESULTS FOR THE SIX MONTHS ENDED DECEMBER 2018
 ASX Announcement 19 February 2019 COCHLEAR FINANCIAL RESULTS FOR THE SIX MONTHS ENDED DECEMBER 2018 The business delivered an increase in in sales revenue of 11% and net profit of 16% for the half Reported
Welcome to the conference call Dürr AG. Results January-March 2007 Dürr Group
 Welcome to the conference call Dürr AG Results January-March 2007 Dürr Group Stuttgart, May 10, 2007 Disclaimer This presentation has been prepared independently by Dürr AG ( Dürr ). The presentation contains
INTERIM PRESENTATION Q October 2018
 INTERIM PRESENTATION 25 October JUAN VARGUES, PRESIDENT & CEO HIGHLIGTHS Organic growth Good organic growth in EMEA Flat organic growth in Americas despite -7% RV OEM APAC down due to softer market in
FUCHS PETROLUB SE The leading independent lubricants manufacturer of the world
 The leading independent lubricants manufacturer of the world Dr. Alexander Selent, Vice Chairman & CFO Dagmar Steinert, Head of Investor Relations September 2014 The leading independent lubricants manufacturer
Interim Report Q4 FY 17
 Interim Report Q4 FY 17 Quarter 4 / Fiscal Year 2017 Sustained positive development Sivantos delivered 3.1% organic growth 1) in Q4 FY2017. The moderate growth rate compared to previous quarters was a
Analysts Conference Full Year Results 2004 Frankfurt, March 22, pm
 Analysts Conference Full Year Results 2004 Frankfurt, March 22, 2005 3.00pm Page 4 Page 17 Page 32 Presentation of Dr Wolfgang Reitzle President & CEO, Linde AG Presentation of Dr Peter Diesch CFO, Linde
Investor presentation
 Investor presentation Important information Forward-Looking Statements and Risks & Uncertainties This document and the related oral presentation contain, and responses to questions following the presentation
FUCHS PETROLUB SE The leading independent lubricants manufacturer of the world
 The leading independent lubricants manufacturer of the world Dr. Alexander Selent, Vice Chairman & CFO Dagmar Steinert, Head of Investor Relations January 2015 The leading independent lubricants manufacturer
Investor Call Half-Year Results 2016
 Investor Call Half-Year Results 2016 September 22th, 2016 Philipp Kuckuck, Vice President Corporate Finance Disclaimer This presentation was prepared with reasonable care. However, no responsibility can
Press Release December 15, 2017
 ISRA VISION AG: 2016 / 2017 financial year Revenues and EBT +11 %, cash flow significantly stronger ISRA again matches full year guidance: Heading for the next revenue level with double-digit growth rates
Full year Vestas Wind Systems A/S. Copenhagen, 7 February Classification: Public
 Full year Vestas Wind Systems A/S Copenhagen, 7 February 2018 Classification: Public Disclaimer and cautionary statement This document contains forward-looking statements concerning Vestas financial condition,
FUCHS GROUP. In Motion. Investor Presentation, November 2017 Dagmar Steinert, CFO Thomas Altmann, Head of Investor Relations
 FUCHS GROUP In Motion Investor Presentation, November 2017 Dagmar Steinert, CFO Thomas Altmann, Head of Investor Relations Agenda 01 02 03 04 The Leading Independent Lubricants Company Q1-3 2017 Shares
Sivantos Investor Presentation
 Sivantos Investor Presentation Dr. Roger Radke, CEO Jens Due Olsen, CFO 6 June 2016 Sivantos 2015 All rights reserved/restricted. Disclaimer This document contains statements related to our future business
FY 2014 Results Presentation. Uwe Röhrhoff, CEO Rainer Beaujean, CFO Duesseldorf, February 11, 2015
 FY 2014 Results Presentation Uwe Röhrhoff, CEO Rainer Beaujean, CFO Duesseldorf, February 11, 2015 Disclaimer 1. This presentation may contain certain forward-looking statements, including assumptions,
FINANCIAL REPORT 30 NOVEMBER ST HALF OF FISCAL YEAR 2017/2018
 FINANCIAL REPORT 30 NOVEMBER 2017 1ST HALF OF FISCAL YEAR 2017/2018 CONTENTS 03 KEY PERFORMANCE INDICATORS 04 HIGHLIGHTS 05 HELLA ON THE CAPITAL MARKET 07 INTERIM GROUP MANAGEMENT REPORT 07 Economic development
Interim Results 6-month figures FY 13
 Interim Results 6-month figures FY 13 Gerold Linzbach, CEO Dirk Kaliebe, CFO Robin Karpp, Head of IR HEIDELBERG, NOVEMBER 7TH, 2012 Review FY 2012/2013 Order intake of 668m in on par with previous year
Investors Conference HSBC SRI Conference. February 7, 2017, Frankfurt. Driving transformation. Shaping the future.
 Investors Conference HSBC SRI Conference February 7, 2017, Frankfurt Driving transformation. Shaping the future. Disclaimer Note: This presentation contains statements concerning the future business trend
REXEL. Q3 & 9-month 2009 results. November 12, 2009
 REXEL Q3 & 9-month 2009 results November 12, 2009 Q3 2009 & 9-month results Q3 and 9-month 2009 at a glance Financial review Outlook 3 Q3 & 9-month 2009 at a glance Q3 & 9-month 2009 highlights: Quarter-on-quarter
Half-year 2012 Results. August 1, 2012
 Half-year 2012 Results August 1, 2012 Disclaimer All forward-looking statements are Schneider Electric management s present expectations of future events and are subject to a number of factors and uncertainties
HUGO BOSS Investor Day 2012 Group Financial Performance and Strategy
 HUGO BOSS Investor Day 2012 Group Financial Performance and Strategy Mark Langer, Chief Financial Officer December 6, 2012 HUGO BOSS Investor Day 2012 HUGO BOSS Dec. 6, 2012 2 / 38 Agenda HUGO BOSS grows
Société Générale Premium Review 2016
 Société Générale Premium Review 2016 Paris 1 December 2016 1 November 2016 Safe harbor statement: This presentation includes certain forward-looking statements within the meaning of Section 27A of the
Linde Group. January - June 2006 Conference Call. July 28, Dr Peter Diesch, CFO
 January June 2006 Conference Call July 28, 2006 Dr Peter Diesch, CFO Contents 04 Linde Group 09 Gas & Engineering 11 Linde Gas 18 Linde Engineering 21 Material Handling 2 Disclaimer This investor presentation
Full year 2016 results
 Listen-only live audio webcast available from www.gemalto.com/investors Full year 2016 results March 3, 2017 Philippe VALLEE, CEO Jacques TIERNY, CFO Disclaimer This communication does not constitute an
Annual General Meeting 2015
 Annual General Meeting 2015 Frankfurt May 19, 2015 Rice Powell Chief Executive Officer and Chairman of the Management Board Rice Powell CEO WELCOME Frankfurt May 19, 2015 Agenda 1. Looking back at the
Half-year 2011 Results. July 29, 2011
 Half-year 2011 Results July 29, 2011 Disclaimer All forward-looking statements are Schneider Electric management s present expectations of future events and are subject to a number of factors and uncertainties
FUCHS GROUP. In Motion. Investor Presentation, September 2017 Dagmar Steinert, CFO Thomas Altmann, Head of Investor Relations
 FUCHS GROUP In Motion Investor Presentation, September 2017 Dagmar Steinert, CFO Thomas Altmann, Head of Investor Relations Agenda 01 02 The Leading Independent Lubricants Company H1 2017 03 Shares 04
A Century of History A Global Service
 A Century of History A Global Service Bank of China Limited 2012 Interim Results August 24, 2012 Forward-looking Statement Disclaimer This presentation and subsequent discussions may contain forward-looking
Roadshow Kepler Cheuvreux. November 7, 2016, London. Driving transformation. Shaping the future.
 Roadshow Kepler Cheuvreux November 7, 2016, London Driving transformation. Shaping the future. Disclaimer Note: This presentation contains statements concerning the future business trend of the Vossloh
Investors presentation. November 2011
 Investors presentation November 2011 Disclaimer All forward-looking statements are Schneider Electric management s present expectations of future events and are subject to a number of factors and uncertainties
Investor Presentation. August 2014
 Investor Presentation August 2014 1 Important Disclosures NOTE ON FORWARD-LOOKING STATEMENTS: This presentation and related discussions may contain forward-looking statements about such matters as: our
INVESTOR PRESENTATION
 INVESTOR PRESENTATION NOTES TO INVESTORS FORWARD-LOOKING STATEMENTS. These materials contain forward-looking statements. Statements that describe or relate to NCR's plans, goals, intentions, strategies,