Drägerwerk AG & Co. KGaA Capital Markets Presentation. October, 2018
|
|
|
- Dina Lynch
- 5 years ago
- Views:
Transcription
1 Drägerwerk AG & Co. KGaA Capital Markets Presentation October, 2018
2 Disclaimer This presentation does not constitute an offer of securities for sale or a solicitation of an offer to purchase any securities. No money, securities or other consideration is being solicited by this presentation. This presentation contains forward-looking statements regarding the future development of the Dräger Group. These forward-looking statements are based on the current expectations, presumptions, and forecasts of the Executive Board as well as the information available to it to date, and have been made to the best of its knowledge and belief. No guarantee or liability for the occurrence of the future developments and results specified can be assumed in respect of such forward-looking statements. Rather, the future developments and results are dependent on a number of factors; they entail risks and uncertainties beyond our control and are based on assumptions which could prove to be incorrect. Notwithstanding any legal requirements to adjust forecasts, we assume no obligation to update the forward-looking statements contained in this presentation. Interim financial reports as well as preliminaries are not audited. 2


3 Dräger The Company Financials Outlook 3
4 Dräger products protect, lives support and save. 4
5 Net sales development Strong growth independent of the global economy Dräger net sales in EUR million Global gross domestic product Net sales development 3,000 Debt crisis 2,500 2,000 1,500 1,000 Gulf War Mexican peso crisis Russian financial crisis Stockmarket crash Stockmarket crash Iraq War Financial crisis Source: International Monetary Fund, World Economic Outlook Database 5
6 Dräger worldwide Net sales, sites and employees Safety ~35 % 25% 20% Net Sales: EUR ~2.6 billion in % Medical ~65 % 10% 11% 14% Dräger-Sites Production sites in Europe, America, Africa and Asia Sales and Service organizations worldwide Sales & Service R&D 21% 16% 13,739 employees in 2017 Production, Quality, Logistics, Purchasing Administration 70% Europe Africa, Asia, Australia Americas 58% 6


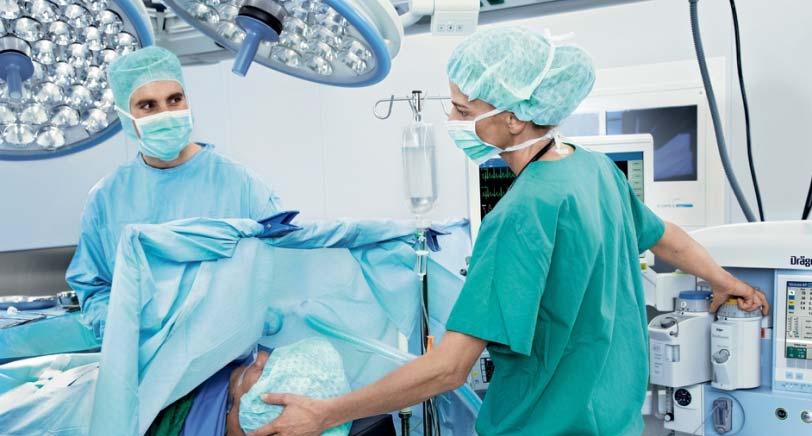
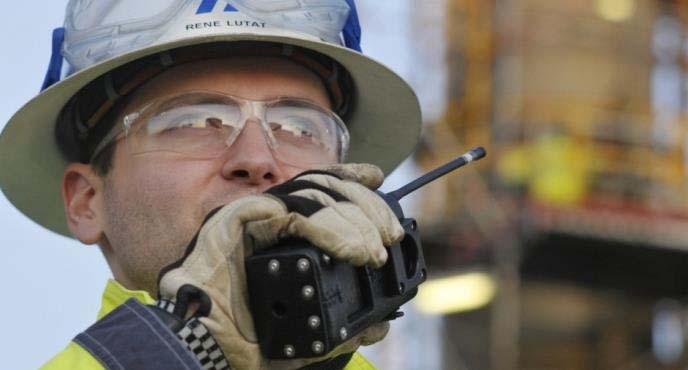
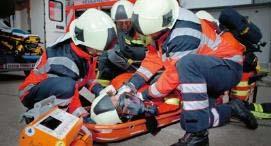
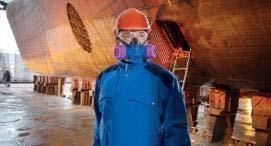
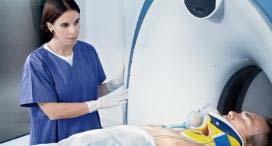
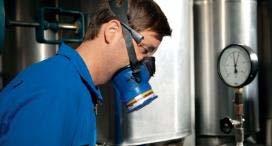
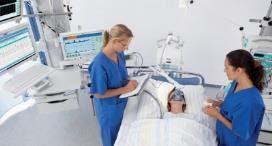
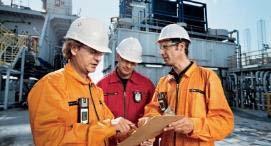
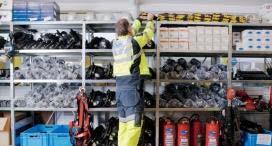
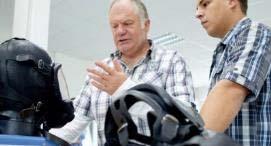
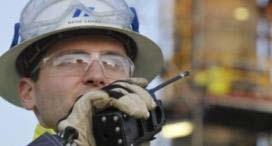
7 Markets Our customers Hospital Fire services Oil and gas industry Mining Chemical industry Other markets 7


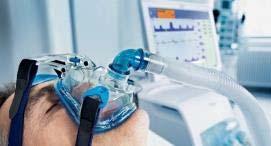
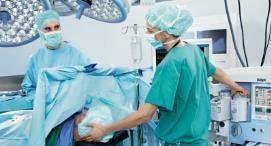
8 Intensive Care Operating Room Neonatal Care Hospital wide Solutions Anaesthesiology Ventilation Thermoregulation Anaesthesia workstations and vaporizers #1 in Europe and #2 in the US market Emergency & Transport-, Neonatal- and Intensive Care ventilators Respiratory monitoring #1 in Europe Patient Monitoring & Clinical IT Infinity Acute Care System Clincal software solutions Telemetry and IT-solutions Workplace Infrastructure Medical supply units Medical Gas supply systems Medical lights and video solutions Incubators and Warming Therapy #2 worldwide and #1 in Europe Note: Market position based on Dräger s market knowledge and its own assessment of market position; positions ranked according to net sales. Hospital Consumables & Service Consumables and accessories Classical-, Multivendor product service, Professional Service Training 8


9 Fire Service Oil & Gas Chemical Mining Other Markets Breathing Systems Gas Detection Systems Self-contained Breathing Appartus for fire fighters #2 worldwide and #1 in Europe Impairment Check Equipment Alcohol- and drug screening devices Interlock devices #1 worldwide and #1 in Europe Fixed and mobile gas detection systems #1 worldwide and #1 in Europe Personal Protection Equipment Protection equipment for hazardous working environments Body and Head protection, rescue and escape devices, Masks and Filters, etc. Note: Market positions based on Dräger s market knowledge and its own assessment of market position; positions ranked according to net sales. Engineered Solutions Service Customer specific solutions mobile and stationary firefighting training systems Rescue chambers Spareparts and consumables Product Service Rental, On-site shops and Shutdown Service Marine-Offshore Service 9
10 Medical and safety technology providing long-term growth prospects in developed and emerging markets Hospital Oil&Gas Chemical Mining FireService Attractive growth prospects in sizeable markets Average expected annual market growth for the global medical equipment market significantly exceeding growth in many other sectors Strong growth prospects in both developed and emerging markets Very diversified markets with numerous product and service offerings Attractive growth prospects for target sectors (e.g. industry) and growing safety investments in developed markets Rapidly aging population and consequently increasing healthcare expenditure Increasing demand for medical equipment to improve clinical workflows and efficiency Increasingly stricter safety regulations Rising environmental awareness Improved outlook for target markets as well as in emerging markets Strong growth of GDP and population resulting in a demand for improved medical services Political benefits from investments in health care sector Increasingly higher safety standards Increasing industrial hygiene awareness Strong growth of key customer sectors 10
11 Strategy for profitable growth 1 Management of innovation rate through continuous improvements in quality and R&D processes 2 Expansion of market positions in attractive markets. Special focus on profitable growth in developing countries 3 Expansion of service and consumables business 4 Investments for future growth 11
 Approximately 1,300 employees in R&D around the globe.")


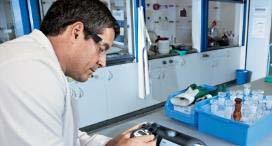
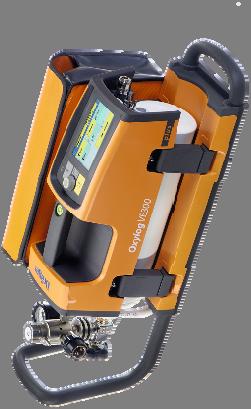
12 1 Technology and innovation leadership to drive profitable growth Strong R&D focus Innovation to enhance future growth (examples) Approximately 1,300 employees in R&D around the globe. EUR 235 million spent for R&D activities in 2017 (9.1 % of net sales). Certified test-center at Lübeck headquarter supports innovation- and approval process. Qualitymanagement organization with >100 employees. Very close collaboration with customers to develop new and improve existing products. Technological competency and high quality standards result in leading market positions and high barriers to entry. Babyleo Incuwarmer: combination of a classical incubator and warming bed functionalities. Dräger X-am 8000 Multigas detector for measurement of up to 7 gases simultaneously. Oxylog VE300 Lightweight, ergonomic designed emergency ventilator for ambulance, ER and clinical patient transport. Note: no meaningful capitalization of R&D budget 12


13 2 Exploit growth potentials in developing countries 2 Investments in profitable growth in developing countries Focus on the specific needs of customer in developing countries Identify growth potential in strong growing markets like China, Brazil and India Capitalize on the significant investments into the Sales & Service infrastructure and specific market knowledge, especially in our Regions Asia / Pacific, Central- and South-America Enhance engagement with partners in developing countries to expand local presence with R&D, manufacturing, sales and after sales business Net sales 2017 Newly industrialized countries 23 % Focused product range Developed Markets 77 % Savina Color Vista 120 Fabius Plus XL 13


 is a critical factor for customers Dräger Service")


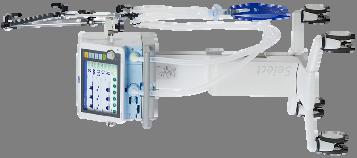
14 3 Service- and consumables business a clear focus of our Sales activities 3 Further expansion of service and consumables business Capitalize on large installed base to expand after sales business Focus on combined sale of equipment and after sales contracts Expansion of disposable consumables business Dräger Services Dräger Consumables Globally over 3,000 service technicians Fast and reliable service (repairs and spare parts) is a critical factor for customers Dräger Service technicians important for customer loyalty Efficient service solutions via remote service Broad offerings of product service New services in the areas of Rental, Multi-Vendor and Marine-offshore Functionalities with added value, e.g. optimizing workflow with RFID-based communication between consumables part and therapy machine Dräger quality to improve hygienic standards Dräger value add especially in development of consumables. Production usually via suppliers Partly proprietary consumable products, e.g. Dräger-Tubes 14
15 4 Investments 2018/2019 will support future growth WE ARE INVESTING IN WE WILL ACHIEVE increasing sales resources & -capabilities Strengthening Safety sales channels FGDS System Centers Key Account Management Digital distribution channels Global roll out of Future Technician Workplace a strengthened sales force to support bringing the innovation road map to market. SG&A 2018/19 ~30% SG&A >2020 <30% accelerating R&D roadmap More R&D resources (focus on SWdevelopment) Partnership with external development partners Accelerate EM product portfolio major product releases in 2020, 2021 and Medical Innovation rate % Medical Innovation rate 2020 >28% and will lift EBIT margin again from
16 16 Financials
17 Business development Dräger Group 5y view M M 2018 million million million million million million million Net Sales 2, , , , , , ,729.1 % growth 0.0% 2.5% 7.2% -3.3% 1.9% 1.9% -0.5% % growth (FX adjusted) 3.1% 4.0% 2.9% -1.5% 3.3% 2.4% 3.0% Gross margin 48.3% 46.7% 44.9% 45.0% 44.8% 44.7% 42.4% Functional Expenses , % of Net Sales -39.7% -39.7% -42.1% -39.6% -38.6% -42.0% -44.6% EBIT EBIT Margin 8.5% 7.3% 2.6% 5.4% 6.1% 2.5% -2.4% DVA Note: restructuring charges included in FY EBIT: EUR 35 million in 2015, EUR 10 million in 2016 Dräger Value Added (DVA) = EBIT less cost of capital of average invested capital 17
18 Key figures Dräger Group 5y view M M 2018 million million million million million million million Cashflow (from operating activities) Investments Cash and cash equivalents Net financial debt Net financial debt 1 /EBITDA Capital employed 1 1, , , , , , ,283.4 ROCE (EBIT 2 /Capital employed 1 ) 19.1% 16.1% 5.3% 11.0% 12.5% 12.6% 5.6% Net Working Capital Values as of reporting date 2 EBITDA and accordingly EBIT of the last twelve months Note: Investments 2015 include EUR ~60m for M&A 18


19 19 Outlook
20 Outlook EXPECTATIONS FOR FISCAL YEAR 2018 Net sales e 3.3% % (net of currency effects) (net of currency effects) EBIT margin 6.1% % Dräger Value Added EUR 70.7 million EUR million Note: Dräger Value Added (DVA) = EBIT less cost of capital of average invested capital Additional forecast figures in the appendix on page 25 20
21 21 Guiding philosophy What we stand for


22 22

 Vice")


23 Dräger management Stefan Dräger Gert-Hartwig Lescow Rainer Klug Dr. Reiner Piske Anton Schrofner Chairman of the Executive Board (Chief Executive Officer) Vice Chairman of the Executive Board Executive Board member for Finance and IT Executive Board member for Purchasing, Production and Logistics Executive Board member for Human Resources Executive Board member for Innovation and Quality At Dräger since 1992 At Dräger since 2008 At Dräger since 2015 At Dräger since 2015 At Dräger since 2010 Fifth generation of the Dräger family to lead the company Responsible for the Americas region Responsible for the Europe region Responsible for the Africa, Asia and Australia regions 23
24 Shareholder structure 10,160,000 common shares (28.8 % free float) 7,600,000 preferred shares (100.0 % free float) Shareholding Common shares Shareholding Dr. Heinrich Dräger GmbH 28.8% 4.0% 18.1% 58.7% 67.2 % 23.2% Dr. Heinrich Dräger GmbH Free float Members of the Dräger family Stefan Dräger GmbH Dräger Foundation Successors of Dr. Heinrich Dräger 24
25 Guidance 2018 EXPECTATIONS FOR FISCAL YEAR 2018 Net sales e 3.3% % (net of currency effects) (net of currency effects) EBIT margin 6.1% % Dräger Value Added EUR 70.7 million EUR million Other forecast figures: Gross margin 44.8 % % Research and development c EUR million EUR million Interest result EUR million Slight improvement Days working capital (DWC) days on prior year's level Investment volume EUR million EUR million* Net financial debt EUR million Slight deterioration *excluding company acquisitions 25
26 Business Development Segments 5y view SEGMENT EUROPE Order Entry 1 million 1, , , , ,447.8 Net Sales 1 million 1, , , , ,415.5 EBIT million EBIT margin % SEGMENT AMERICA Order Entry 1 million Net Sales 1 million EBIT million EBIT margin % SEGMENT AFRICA, ASIA, AUSTRALIA Order Entry 1 million Net Sales 1 million EBIT million EBIT margin % years were adjusted pro-forma due to the change in segment reporting. 26 For further analysis, this data (including quarterly figures) can be downloaded as an Excel file from the Dräger website
27 Business development Q3 Segments Europe Americas Africa, Asia, Australia Dräger Group Q Q Q Q Q Q Q Q million million million million million million million million Order entry Net Sales EBITDA EBIT EBIT-margin Capital Employed , ,283.4 ROCE 1, DVA Values at due date 2 EBIT of the last twelve months 27
28 Business development 9M Segments Europe Americas Africa, Asia, Australia Dräger Group 9M M M M M M M M 2018 million million million million million million million million Order entry 1, , , ,931.2 Net Sales , ,729.1 EBITDA EBIT EBIT-margin Capital Employed , ,283.4 ROCE 1, DVA Values at due date 2 EBIT of the last twelve months 28
29 Business Development medical and safety products 5y view Medical Order Entry million 1, , , , ,683.7 Net Sales million 1, , , , ,668.0 EBIT million EBIT margin % Safety Order Entry million Net Sales million EBIT million EBIT margin % For further analysis, this data (including quarterly figures) can be downloaded as an Excel file from the Dräger website 29
30 Business development Medical Q Q Change Change 9M M 2018 Change Change million million % % (FX adj.) million million % % (FX adj.) Order entry , , Europe America Africa, Asia, Australia Net Sales , , Europe America Africa, Asia, Australia EBIT > > -100 EBIT-margin (%)
31 Business development Safety Q Q Change Change 9M M 2018 Change Change million million % % (FX adj.) million million % % (FX adj.) Order entry Europe America Africa, Asia, Australia Net Sales Europe America Africa, Asia, Australia EBIT EBIT-margin (%)
32 Functional expenses 5y view M M 2018 million million million million million million million R&D % of Net Sales -8.5% -8.7% -8.9% -8.7% -9.1% 9.9% 11.1% SG&A % of Net Sales -31.1% -30.8% -33.0% -30.2% -29.7% 32.0% 33.6% Other operating income Functional Expenses total , % of Net Sales -39.7% -39.7% -42.1% -39.6% -38.6% 42.0% 44.6% Headcount 1 13,334 13,737 13,936 13,263 13,739 13,642 14,233 1 Values as of reporting date 32
33 Cash-flow statement M M 2018 million million million million million million million Group net profit Change in inventories Change in receivables Change in payables Depreciation and amortization Other operating cash flow items Operating cash flow Investing cash flow Free cash flow Financing cash flow Change in cash Cash and cash equivalents Change in cash and cash equivalents, i.e. without any effect of exchange rates 2 Values as of reporting date 33
34 Consolidated balance sheet 31 Dec Dec 2017 Change million million % Intangible Assets Property, plant and equipment Other noncurrent assets Noncurrent assets Inventories Trade receivables Other current assets Cash and cash equivalents Current assets 1, , Total assets 2, ,
35 Consolidated balance sheet 31 Dec Dec 2017 Change million million % Equity 1, , Liabilities from participation certificates Provisions for pensions and similar oblig Noncurrent interest bearing loans Other noncurrent liabilities Noncurrent liabilities Current Provisions Current loans and liabilities to banks Trade payables Other current liabilities Current liabilities Total equity and liabilities 2, ,
36 Earnings per share Net profit (less the share of earnings attributable to non-controlling interests) '000 33,575 81,391 98,530 Scenario: 100% pay-out ratio 100% 100% 100% = tax benefit from pay-out to PCs* '000 3,188 7,888 9,493 Earnings attrib. to shares and PCs (incl. tax benefit) '000 36,763 89, , % Earnings attributable to PCs** '000 11,719 28,425 34,420 32% Earnings attributable to shares '000 25,044 60,855 73,603 68% EPS (common share) EPS (preferred share) Scenario: actual/proposed pay-out ratio 12.9% 5.3% 11.6% tax benefit from pay-out to PCs* ' Earnings attrib. to shares and PCs (incl. tax benefit) '000 33,915 81,732 99, % Earnings attributable to PCs** '000 1,249 1,236 3,482 3% Earnings attributable to shares '000 32,665 80,496 96,008 97% EPS (common share)*** EPS (preferred share)*** * tax benefit arises from the tax deductible pay-out to the PCs; please refer to Annual Report 2017, note 19 ** without minimum dividend (as interest, the minimum dividend is already included in net earnings) ** the EPS is not calculated in accordance with IAS 33 PCs = participation certificates (Genussscheine) + 36


37 Selection of new products 2017 SAFETY MEDICAL IACS VG6/VG7 Vista 120 S Oxylog VE300 Movita Lift Strong 37 Savina 300 Select Pulsar 7000 Secor 7000 Dräger X-am 8000 Dräger-Tubes App Dräger Alcotest 5000
38 Innovation rate Share on new products and upgrades medical 1 45% 40% Net sales Upgrades New products 35% 30% 25% 20% 15% 10% 34% 28% 32% 22% 27% 20% 20% 18% 26% 22% 28% 23% 5% 0% 6% % % % % % 2018H1 1 Launched in the last 3 years; products are regarded as new, if they enable Dräger to either enter a new market segment or if products are regarded as completely new according to Dräger s customers and Dräger s sales force. Upgrades are those products, which serve existing Dräger markets, but their functionality is perceived as significantly enhanced by Dräger s customers and Dräger s sales force. 38
39 Financial calendar 2019 March 7, Analysts meeting April 25, Report for the first three months 2019 Conference call May 10, Annual shareholders' meeting, Lübeck, Germany August 8, Report for the first six months 2019 Conference call October 30, Report for the first nine months 2019 Conference call 39

40 Contact Melanie Kamann Corporate Communications Thomas Fischler Investor Relations Drägerwerk AG & Co. KGaA Drägerwerk AG & Co. KGaA Moislinger Allee Moislinger Allee Lübeck, Germany Lübeck, Germany Tel Tel Fax Fax Mobile Mobile
Drägerwerk AG & Co. KGaA Capital Markets Presentation. July, 2018
 Drägerwerk AG & Co. KGaA Capital Markets Presentation July, 2018 Disclaimer This presentation does not constitute an offer of securities for sale or a solicitation of an offer to purchase any securities.
Worldwide. On Site. Drägerwerk AG & Co. KGaA Capital Markets Presentation. January, 2018
 Worldwide. On Site. Drägerwerk AG & Co. KGaA Capital Markets Presentation January, 2018 Disclaimer This presentation does not constitute an offer of securities for sale or a solicitation of an offer to
Drägerwerk AG & Co. KGaA Capital Markets Presentation. March, 2016
 Drägerwerk AG & Co. KGaA Capital Markets Presentation March, 2016 Disclaimer This presentation does not constitute an offer of securities for sale or a solicitation of an offer to purchase any securities.
Worldwide. On Site. Drägerwerk AG & Co. KGaA Capital Markets Presentation. May, 2017
 Worldwide. On Site. Drägerwerk AG & Co. KGaA Capital Markets Presentation May, 2017 Disclaimer This presentation does not constitute an offer of securities for sale or a solicitation of an offer to purchase
Drägerwerk AG & Co. KGaA Capital Markets Presentation. March, 2015
 Drägerwerk AG & Co. KGaA Capital Markets Presentation March, 2015 Disclaimer This presentation does not constitute an offer of securities for sale or a solicitation of an offer to purchase any securities.
Analyst Conference Drägerwerk AG & Co. KGaA. March 7 th 2019
 Analyst Conference Drägerwerk AG & Co. KGaA March 7 th 2019 Disclaimer This presentation does not constitute an offer of securities for sale or a solicitation of an offer to purchase any securities. No
Analyst Conference Drägerwerk AG & Co. KGaA. Frankfurt, March 8 th 2018
 Analyst Conference Drägerwerk AG & Co. KGaA Frankfurt, March 8 th 2018 Disclaimer This presentation does not constitute an offer of securities for sale or a solicitation of an offer to purchase any securities.
Conference call Interim report January 1 to September 30, 2018
 ICH WERDE DA SEIN. Conference call Interim report January 1 to September 30, 2018 Lübeck, October 30, 2018 Disclaimer This presentation does not constitute an offer of securities for sale or a solicitation
Conference call Interim report January 1 to March 31, Lübeck, April 26, 2016
 Conference call Interim report January 1 to March 31, 2016 Lübeck, April 26, 2016 Disclaimer This presentation does not constitute an offer of securities for sale or a solicitation of an offer to purchase
Worldwide. On Site. Conference call Interim report January 1 to June 30, Lübeck, July 27, 2017
 Worldwide. On Site. Conference call Interim report January 1 to June 30, 2017 Lübeck, July 27, 2017 Disclaimer This presentation does not constitute an offer of securities for sale or a solicitation of
Conference call Interim report January 1 to March 31, Lübeck, April 26, 2018
 Conference call Interim report January 1 to March 31, 2018 Lübeck, April 26, 2018 Disclaimer This presentation does not constitute an offer of securities for sale or a solicitation of an offer to purchase
Conference call Interim report January 1 to March 31, Lübeck, May 2, 2013
 Conference call Interim report January to March 3, 203 Lübeck, May 2, 203 Disclaimer This presentation does not constitute an offer of securities for sale or a solicitation of an offer to purchase any
Quarterly Statement January 1 to September 30, 2017 Dräger Group
 Quarterly Statement January 1 to September 30, 2017 Dräger Group THE DRÄGER GROUP OVER THE PAST FIVE YEARS 2013 2014 2015 2016 2017 Order intake million 1,756.7 1,743.4 1,895.1 1,849.1 1,928.3 Net sales
Quarterly Statement January 1 to March 31, 2017 Dräger Group
 Quarterly Statement January 1 to March 31, 2017 Dräger Group THE DRÄGER GROUP OVER THE PAST FIVE YEARS 2013 2014 2015 2016 2017 Order intake million 571.3 544.6 615.3 599.6 639.4 Net sales million 533.8
Quarterly Statement January 1 to March 31, 2018 Dräger Group
 Quarterly Statement January 1 to March 31, 2018 Dräger Group THE DRÄGER GROUP OVER THE PAST FIVE YEARS 2014 2015 2016 2017 2018 Order intake million 544.6 615.3 599.6 639.4 621.4 Net sales million 513.2
Quarterly Statement January 1 to March 31, 2016 Dräger Group
 Quarterly Statement January 1 to March 31, 2016 Dräger Group THE DRÄGER GROUP over the past five years 2012 2013 2014 2015 2016 Order intake million 550.9 571.3 544.6 615.3 599.6 Net sales million 529.3
Drägerwerk AG & Co. KGaA Analysts Meeting. Frankfurt, March 14, 2012
 Drägerwerk AG & Co. KGaA Analysts Meeting Frankfurt, March 4, 202 Disclaimer This presentation does not constitute an offer of securities for sale or a solicitation of an offer to purchase any securities.
H1/2005 report Dräger Group
 H1/2005 report Dräger Group D 3 Contents 4 Preliminary remarks 4 Preparation of the interim financial statements 5 Business performance H1/2005 5 Dräger Group 8 Business performance of the segments 8
FINANCIAL CALENDAR 2018 Imprint Drägerwerk AG & Co. KGaA Concept and design Publication Drägerwerk AG & Co. KGaA Reproductions Printed by
 Annual Report 2017 Technology for Life COMPANY PROFILE Dräger is an international leader in the fi elds of medical and safety technology. The family-run company was founded in Lübeck, Germany, in 1889.
Q1/2005 report Dräger Group
 Q1/2005 report Dräger Group D 3 Contents 4 Preliminary remarks 4 Preparation of the interim financial statements 5 Business performance Q1/2005 5 Dräger Group 8 Business performance of the segments 8
Nine months 2011: Dräger increases order intake and earnings
 Page 1 / 5 Nine months 2011: Dräger increases order intake and earnings - Order intake grows by 7.8 percent - EBIT margin reaches 9.0 percent - Equity ratio continues to rises to 34.7 percent - Sales reorganization
Half-yearly financial report January 1 to June 30, 2017 Dräger Group
 Half-yearly financial report January 1 to June 30, 2017 Dräger Group THE DRÄGER GROUP OVER THE PAST FIVE YEARS Six months 2013 Six months 2014 Six months 2015 Six months 2016 Six months 2017 Order intake
Quarterly Report January 1 to September 30, 2012 Dräger Group
 Quarterly Report January 1 to September 30, Dräger Group THE DRÄGER GROUP OVER THE PAST FIVE YEARS Nine months 2008 Nine months 2009 Nine months 2010 Nine months Nine months Change on in % Order intake
Quarterly Report January 1 to March 31, 2011 Dräger Group
 Quarterly Report January 1 to March 31, 2011 Dräger Group THE DRÄGER GROUP over the past five years 2007 2008 2009 2010 2011 Change on 2010 in % Order intake million 444.9 493.8 448.6 488.2 553.6 +13.4
Half-yearly financial report January 1 to June 30, 2012 Dräger Group
 Half-yearly financial report January 1 to June 30, Dräger Group THE DRÄGER GROUP OVER THE PAST FIVE YEARS Six months 2008 Six months 2009 Six months 2010 Six months Six months Change on in % Order intake
Quarterly Report January 1 to September 30, 2009 Dräger Group (revised version)
") Quarterly Report January 1 to September 30, 2009 Dräger Group (revised version) THE DRÄGER GROUP AT A GLANCE Nine months Nine months Nine months Nine months Change on 2006 2007 2008 2009 2008 in % Order
Quarterly Report January 1 to September 30, 2009 Dräger Group (revised version) THE DRÄGER GROUP AT A GLANCE Nine months Nine months Nine months Nine months Change on 2006 2007 2008 2009 2008 in % Order
Half-yearly financial report January 1 to June 30, 2016 Dräger Group
 Half-yearly financial report January 1 to June 30, 2016 Dräger Group THE DRÄGER GROUP OVER THE PAST FIVE YEARS Six months 2012 Six months 2013 Six months 2014 Six months 2015 Six months 2016 Order intake
Hill-Rom Fourth Quarter 2016 Financial Results. November 3, 2016
 Hill-Rom Fourth Quarter 2016 Financial Results November 3, 2016 Forward Looking Statements Certain statements in this presentation contain forward-looking statements, within the meaning of the Private
Dräger Group Q1/2009 (amended version)
") Dräger Group Q1/2009 (amended version) Q1 THE DRÄGER GROUP AT A GLANCE Q1/2006 Q1/2007 Q1/2008 Q1/2009 Change on 2008 in % Order intake million 452.2 444.9 493.8 448.6 (9.2) Orders on hand million 327.2
Dräger Group Q1/2009 (amended version) Q1 THE DRÄGER GROUP AT A GLANCE Q1/2006 Q1/2007 Q1/2008 Q1/2009 Change on 2008 in % Order intake million 452.2 444.9 493.8 448.6 (9.2) Orders on hand million 327.2
EDITED TRANSCRIPT. Q Draegerwerk AG & Co KGaA Earnings Call EVENT DATE/TIME: OCTOBER 30, 2018 / 2:00PM GMT THOMSON REUTERS
 THOMSON REUTERS EDITED TRANSCRIPT Q3 2018 Draegerwerk AG & Co KGaA Earnings Call EVENT DATE/TIME: OCTOBER 30, 2018 / 2:00PM GMT 1 CORPORATE PARTICIPANTS CONFERENCE CALL PARTICIPANTS Aliaksandr Halitsa
Q3/2003 report Dräger Group
 D Q3/2003 report Dräger Group Business trend in the Dräger Group Highlights in Q3/2003 Despite one-off expenses and unfavorable exchange rates, EBIT at year-earlier level Q3 group order intake and sales
Fresenius Medical Care achieves revised 2018 targets and accelerates investments for future growth
 0 Press Release Media Contact Matthias Link T +49 6172 609-2872 matthias.link@fresenius.com Contact for analysts and investors Dr. Dominik Heger T +49 6172 609-2601 dominik.heger@fmc-ag.com www.freseniusmedicalcare.com
Full-Year 2017/18 Results Stäfa, May 22, 2018 Arnd Kaldowski, CEO Hartwig Grevener, CFO Thomas Bernhardsgrütter, IR
 Full-Year 2017/18 Results Stäfa, Arnd Kaldowski, CEO Hartwig Grevener, CFO Thomas Bernhardsgrütter, IR Disclaimer This presentation contains forward-looking statements, which offer no guarantee with regard
EXPLOITING OPPORTUNITIES EFFICIENTLY FACTBOOK R. STAHL AG
 EXPLOITING OPPORTUNITIES EFFICIENTLY FACTBOOK R. STAHL AG NOVEMBER 2018 R. STAHL Factbook November 2018 1010 Rounding differences and rates of change Percentages and figures in this report may include
Full-Year / Fourth Quarter 2010 Results
 Full-Year / Fourth Quarter 2010 Results 16 February 2011 Disclaimer This presentation contains certain statements that are neither reported financial results nor other historical information. This presentation
Acquisition of Wood Mackenzie. March 10, 2015
 Acquisition of Wood Mackenzie March 10, 2015 Forward Looking Statements, Safe Harbor & Non- GAAP Financial Measures Forward-Looking Statements This presentation contains forward-looking statements. These
FUCHS PETROLUB AG The leading independent lubricants manufacturer of the world
 The leading independent lubricants manufacturer of the world Dr. Alexander Selent, Vice Chairman & CFO Dagmar Steinert, Head of Investor Relations April 2013 FUCHS the leading independent lubricants manufacturer
INTERIM PRESENTATION Q October 2018
 INTERIM PRESENTATION 25 October JUAN VARGUES, PRESIDENT & CEO HIGHLIGTHS Organic growth Good organic growth in EMEA Flat organic growth in Americas despite -7% RV OEM APAC down due to softer market in
VERSUM MATERIALS. Air Products Electronic Materials Division Spin-off Form 10 Highlights August 2016
 VERSUM MATERIALS Air Products Electronic Materials Division Spin-off Form 10 Highlights August 2016 FORWARD-LOOKING STATEMENTS This presentation and materials Air Products and Versum have filed or will
July 26, 2017 LafargeHolcim Ltd 2015
 Second Quarter 2017 Results Beat Hess, Chairman and Interim CEO Roland Köhler, Interim COO and Regional Head of Europe, Australia/NZ & Trading Ron Wirahadiraksa, CFO July 26, 2017 LafargeHolcim Ltd 2015
A Trusted Technology Partner to Medical and Advanced Technology Equipment Manufacturers
 A Trusted Technology Partner to Medical and Advanced Technology Equipment Manufacturers Baird Healthcare Conference, September 2017 NASDAQ: NOVT 1 Safe Harbor Statement The statements in this presentation
H1/2018 Results u-blox Holding AG
 H1/2018 Results August 24, 2018 Thomas Seiler, CEO Roland Jud, CFO Disclaimer This presentation contains certain forward-looking statements. Such forward-looking statements reflect the current views of
Q Results. Lars Brorsen (CEO) Christoph Hobo (CFO) November 22, 2018
 Christoph Hobo (CFO) November 22, 2018") Q3 2018 Results Lars Brorsen (CEO) Christoph Hobo (CFO) November 22, 2018 Agenda 1. Highlights Q3 2018 2. Market outlook 3. Detailed results review 4. Company outlook 5. Q&A Appendix 1 Business summary
Q3 2018 Results Lars Brorsen (CEO) Christoph Hobo (CFO) November 22, 2018 Agenda 1. Highlights Q3 2018 2. Market outlook 3. Detailed results review 4. Company outlook 5. Q&A Appendix 1 Business summary
REXEL. Q3 & 9-month 2009 results. November 12, 2009
 REXEL Q3 & 9-month 2009 results November 12, 2009 Q3 2009 & 9-month results Q3 and 9-month 2009 at a glance Financial review Outlook 3 Q3 & 9-month 2009 at a glance Q3 & 9-month 2009 highlights: Quarter-on-quarter
4Q 2017 Highlights and Operating Results
 4Q 2017 Highlights and Operating Results January 30, 2018 1 4Q 2017 Highlights and Operating Results Table of Contents Page(s) 1 Sales Overview 4-8 2 Financial Performance Trends 9-16 3 Leverage Metrics
A good start to the year
 1 A good start to the year 28 April 2011 No. 17/11 Sales totaled SEK 8,699 M (8,345), representing an increase of 4%, made up of 6% organic growth, 7% acquired growth and exchange-rate effects of 9%. Strong
Schaeffler Group at a glance
 Facts and figures 9M 2016 Schaeffler Group at a glance Key figures 1 st nine months Income statement (in millions) 2016 2015 Revenue 9,977 9,958 0.2 % at constant currency 2.7 % EBIT 1,276 1,251 2.0 %
FORACO INTERNATIONAL S.A. MANAGEMENT S DISCUSSION & ANALYSIS
 FORACO INTERNATIONAL S.A. MANAGEMENT S DISCUSSION & ANALYSIS Three-month and nine-month periods ended September 30, 2017 FORACO INTERNATIONAL S.A. MANAGEMENT S DISCUSSION AND ANALYSIS The following Management
4Q 2018 Highlights and Operating Results. Products. Technology. Services. Delivered Globally.
 4Q 2018 Highlights and Operating Results Products. Technology. Services. Delivered Globally. Table of Contents Page 3 Safe Harbor Statement and Non-GAAP Financial Measures 4 Sales Overview 9 Overview of
Henkel Q Hans Van Bylen, Carsten Knobel Düsseldorf, November 15, 2018
 Henkel Q3 2018 Hans Van Bylen, Carsten Knobel Düsseldorf, November 15, 2018 Disclaimer This information contains forward-looking statements which are based on current estimates and assumptions made by
H1/2017 Results u-blox Holding AG
 H1/2017 Results u-blox Holding AG August 24, 2017 Thomas Seiler, CEO Roland Jud, CFO locate, communicate, accelerate Disclaimer This presentation contains certain forward-looking statements. Such forward-looking
Financial Information
 Financial Information H1 revenues reached 12.8bn up 9.8%, flat org. in Q2 Adj. EBITA reached 1.6bn, up 6.4%, Adj. EBITA margin flat excl. Invensys in a challenging environment 2015 targets: Around flat
Siemens Q2 FY10 IR FLASHLIGHT
 Siemens Q2 FY10 IR FLASHLIGHT The Analyst Conference will take place in London on April 29th, at 3.00 p.m. CEST / 2.00 p.m. BST, and will be webcast on www.siemens.com/investorrelations The Press Conference
Siemens Q4 FY10 IR FLASHLIGHT
 Siemens Q4 FY10 IR FLASHLIGHT The Annual Analyst Conference will take place in London on November 11th, at 4.00 p.m. CET / 3.00 p.m. GMT, and will be webcast on www.siemens.com/investorrelations The Annual
Solid performance in an uncertain market
 Solid performance in an uncertain market Group operational EBITDA 1 margin stable vs Q2 2012, including Power Products Orders and revenues supported by better geographic balance in automation Strong divisional
Digital in the box. Interim statement Q / 2018
 Digital in the box. Interim statement 2017 / 2018 Heidelberg Group INTERIM STATEMENT FOR THE FIRST QUARTER OF 2017/2018 Figures Incoming orders total 629 million Net sales up year-on-year at 495 million
FINANCIAL STATEMENT 28 FEBRUARY RD QUARTER FISCAL YEAR 2017/2018
 FINANCIAL STATEMENT 28 FEBRUARY 2018 3RD QUARTER FISCAL YEAR 2017/2018 Contents 03 KEY PERFORMANCE INDICATORS 04 HIGHLIGHTS 05 INDUSTRY DEVELOPMENT 05 BUSINESS DEVELOPMENT OF THE HELLA GROUP 05 Results
FORACO INTERNATIONAL S.A. MANAGEMENT S DISCUSSION & ANALYSIS
 FORACO INTERNATIONAL S.A. MANAGEMENT S DISCUSSION & ANALYSIS Three-month and nine-month periods ended September 30, 2018 FORACO INTERNATIONAL S.A. MANAGEMENT S DISCUSSION AND ANALYSIS The following Management
Conference Call on Q November 6, 2018
 Conference Call on Q3 2018 November 6, 2018 Q3 2018 Headlines Top line growth of +0.5% to EUR 405.8 million, organically up by +5.3% EBIT pre PPA at EUR 23.8 million, EBIT margin pre PPA at 5.9% Solid
P R E S S R E L E A S E
 P R E S S R E L E A S E from ASSA ABLOY AB (publ) 27 April 2004 No. 5/04 ASSA ABLOY Q1: ORGANIC GROWTH AND IMPROVED MARGINS IN ALL DIVISIONS Sales in the first quarter increased organically by 3% to SEK
J.P. MORGAN HEALTHCARE CONFERENCE. Robert Abernathy Chairman and CEO
 J.P. MORGAN HEALTHCARE CONFERENCE Robert Abernathy Chairman and CEO OVERVIEW FORWARD-LOOKING INFORMATION Certain matters in this presentation and conference call, including our 2016 outlook, expectations
Our Transformation Continues Sidoti NDR May 29-30, 2018
 Our Transformation Continues Sidoti NDR May 29-30, 2018 Disclosure Regarding Forward-Looking Statements Forward-Looking Statements and Factors That May Affect Future Results: Throughout this presentation,
Please note that the following presentation contains financial projections and other forward-looking statements that are specific to the date of the
 Please note that the following presentation contains financial projections and other forward-looking statements that are specific to the date of the presentation July 16, 2012 and should not be considered
February 29 th, FY 2015 Results Presentation
 February 29 th, 2016 FY 2015 Results Presentation 1 GROWTH Excellent results in Spain and Argentina Positive organic growth in Brazil Sales growth of 4.7% including FX rate LatAm organic growth above 12%
Analysts Conference, March 27, Analysts Conference 2003 Seite 1
 Analysts Conference, March 27, 2003 Analysts Conference 2003 Seite 1 Linde Group FY 2002 Slight decline in sales due to drop in domestic sales Drop in EBITA compensated by lower interest charge and reduced
The Annual Analyst Conference will take place in London, on December 3rd, at 3.30 p.m. GMT, and will be webcast on
 Siemens Q4 FY09 IR FLASHLIGHT The Annual Analyst Conference will take place in London, on December 3rd, at 3.30 p.m. GMT, and will be webcast on www.siemens.com/investorrelations The Annual Press Conference
For personal use only
 ASX / Media release 14 February 2017 COCHLEAR FINANCIAL RESULTS FOR THE SIX MONTHS ENDED DECEMBER 2016 Positive momentum continues across all markets Net profit of $111.4m, up 19% Cochlear implant units
The Analyst Conference will take place in London, on November 13, at 4.30 p.m. CET, and will be webcast on
 Siemens Q4 FY08 IR FLASHLIGHT The Analyst Conference will take place in London, on November 13, at 4.30 p.m. CET, and will be webcast on www.siemens.com/investorrelations The Annual Press Conference will
Henkel Q Kasper Rorsted Carsten Knobel. London. 1 August 08, Q Henkel Analyst & Investor Call
 Henkel Q2 2013 London August 08, 2013 Kasper Rorsted Carsten Knobel 1 August 08, 2013 Disclaimer This information contains forward-looking statements which are based on current estimates and assumptions
FUCHS PETROLUB / Q1 2013
 FUCHS PETROLUB / Q1 2013 Conference Call Dr. Alexander Selent, Vice Chairman and CFO Reiner Schmidt, Member of the Group Management Committee Mannheim, 2 May 2013 FUCHS increases EBIT to 73.4 million and
FUCHS PETROLUB SE The lubricants specialist
 The lubricants specialist Stefan Fuchs, CEO Reiner Schmidt, Member of the Group Management Committee Commerzbank Sector Conference Week 27 August 2013 Overview and business model 2 FUCHS the lubricants
Financial review. Continuous organic growth. Strong growth in the EMEA region. Positive operating margin development
 66 Financial review Sonova generated record sales of CHF 2,35.1 million in 214 / 15, an increase of 4.3 % in reported Swiss francs or 6.2 % in local currencies. Group EBITA rose by 5.9 % in reported Swiss
Interim Results 9-month figures FY 11
 Interim Results 9-month figures FY 11 Bernhard Schreier, CEO Dirk Kaliebe, CFO Robin Karpp, Head of Investor Relations Heidelberger Druckmaschinen AG February 09, 2011 Highlights FY 11 Order intake increased
A Trusted Technology Partner to Medical and Advanced Technology Equipment Manufacturers
 A Trusted Technology Partner to Medical and Advanced Technology Equipment Manufacturers Baird Industrial Conference, November 2017 Matthijs Glastra, Chief Executive Officer NASDAQ: NOVT 1 Safe Harbor Statement
FISHER & PAYKEL HEALTHCARE DELIVERS RECORD FULL YEAR RESULT, NET PROFIT UP
 News Release STOCK EXCHANGE LISTINGS: NEW ZEALAND (FPH), AUSTRALIA (FPH) FISHER & PAYKEL HEALTHCARE DELIVERS RECORD FULL YEAR RESULT, NET PROFIT UP 26% Auckland, New Zealand, 23 May 2014 - Fisher & Paykel
3Q 2018 Highlights and Operating Results. Products. Technology. Services. Delivered Globally.
 3Q 2018 Highlights and Operating Results Products. Technology. Services. Delivered Globally. Table of Contents Page 3 Safe Harbor Statement and Non-GAAP Financial Measures 4 Sales Overview 9 Overview of
Earnings Release Q January 1 to March 31, 2011
 Outstanding Broad-Based Growth Customer wins drive orders growth Substantial gain on sale of Areva NP interest Peter Löscher, President and Chief Executive Officer of Siemens AG We ve achieved outstanding,
Interim statement Q / Digital in the box.
 Interim statement Q3 2017 / 2018 Digital in the box. Heidelberg Group Interim statement for the third quarter of 2017 / 2018 Figures Incoming orders after nine months on par with previous year at 1,912
FY 2018 Third Quarter Earnings Call
 FY 2018 Third Quarter Earnings Call July 26, 2018 Improving the experience of a world in motion Important information Adient has made statements in this document that are forward-looking and, therefore,
Fourth quarter 2017 results Analyst call. Koen Van Gerven, CEO Henri de Romrée, CFO
 Fourth quarter 207 results Analyst call Koen Van Gerven, CEO Henri de Romrée, CFO Brussels March 4, 208 Investor presentation - Interim financial report 4Q7 2 Financial Calendar More on corporate.bpost.be/investors
Earnings Release Q3 FY 2015 April 1 to June 30, 2015
 Munich, Germany, July 30, 2015 Earnings Release FY 2015 April 1 to June 30, 2015 Solid performance, softening market environment»overall our businesses delivered solid underlying profitability despite
Q2 FY 2009 Sales & Earnings. March 12, 2009
 Q2 FY 2009 Sales & Earnings March 12, 2009 Forward-Looking Statements The matters discussed in this presentation contain forward-looking statements as defined in the Private Securities Litigation Reform
2012 Full-Year Results
 2012 Full-Year Results February 20, 2013 Amsterdam Nancy McKinstry Chief Executive Officer and Chairman Boudewijn Beerkens Chief Financial Officer Forward-looking Statements This presentation contains
Interim Results 6-month figures FY 11
 Interim Results 6-month figures FY 11 Bernhard Schreier, CEO Dirk Kaliebe, CFO Andreas Trösch, Head of Investor Relations Heidelberger Druckmaschinen AG November 10, 2010 Highlights Q2 FY 11 650 million
2015 Half-Year Results
 2015 Half-Year Results July 29, 2015 Nancy McKinstry Chief Executive Officer and Chairman Kevin Entricken Chief Financial Officer Forward-looking Statements This presentation contains forward-looking statements.
Fresenius Medical Care achieves record results in 2017 and targets strong net income growth in 2018
 Press Release Media Contact Matthias Link T +49 6172 609-2872 matthias.link@fresenius.com Contact for analysts and investors Dr. Dominik Heger T +49 6172 609-2601 dominik.heger@fmc-ag.com www.freseniusmedicalcare.com
Q1/2004 report Dräger Group
 D Q1/2004 report Dräger Group Business trend in the Dräger Group Highlights in Q1/2004 EBIT, order intake and sales again all up Growth in America and Asia/Pacific Dräger Medical unveils new IT products
Half-year 2012 Results. August 1, 2012
 Half-year 2012 Results August 1, 2012 Disclaimer All forward-looking statements are Schneider Electric management s present expectations of future events and are subject to a number of factors and uncertainties
Interim Results 9-month figures FY 14
 HEIDELBERGER DRUCKMASCHINEN AG, FEBRUARY 5, 214 Interim Results 9-month figures 14 Gerold Linzbach, CEO Dirk Kaliebe, CFO Robin Karpp, Head of IR Interim Results 9-month figures 14 February 5th, 214 Improved
2Q 2017 Highlights and Operating Results
 2Q 2017 Highlights and Operating Results July 25, 2017 1 2Q 2017 Highlights and Operating Results Table of Contents Page(s) 1 Sales Overview and Highlights 4-5 2 NSS Overview 6-7 3 EES Overview 8-9 4 UPS
KONE s interim report for January June 2016 JULY 19, 2016 HENRIK EHRNROOTH, PRESIDENT & CEO
 KONE s interim report for January June 2016 JULY 19, 2016 HENRIK EHRNROOTH, PRESIDENT & CEO Figures Key figures for for January June 2016 Q2 2016 Key figures STRONG EXECUTION AND PROFITABLE SALES GROWTH
Zumtobel Group AG Preliminary H1 2017/18. November 2017
 Zumtobel Group AG Preliminary H1 2017/18 November 2017 Stabilisation of revenues dynamic Components Segment Revenue and EBIT development Components Segment -8.7% (fx-adj. -6.6%) 97.3 88.8-3.4% (fx-adj.
UBS Healthcare Conference John J. Greisch, President and CEO. May 22, 2017
 UBS Healthcare Conference John J. Greisch, President and CEO May 22, 2017 Forward Looking Statements This presentation contains forward-looking statements, within the meaning of the Private Securities
Q3 FY 2009 Sales & Earnings. June 9, 2009
 Q3 FY 2009 Sales & Earnings June 9, 2009 Forward-Looking Statements The matters discussed in this presentation contain forward-looking statements as defined in the Private Securities Litigation Reform
Annual results 2013 u-blox Holding AG
 locate, communicate, accelerate Annual results 2013 u-blox Holding AG March 20, 2014 Thomas Seiler, CEO Roland Jud, CFO Disclaimer This presentation contains certain forward-looking statements. Such forward-looking
Q Results. Strong start in May 3, 2016
 Q1 2016 Results Strong start in 2016 May 3, 2016 Legal Disclaimer Information in this presentation may involve guidance, expectations, beliefs, plans, intentions or strategies regarding the future. These
Mindray Medical International Limited
 Mindray Medical International Limited Corporate Presentation August 2011 Disclaimer This material contains "forward looking statements" within the meaning of the safe harbor provisions of the U. S. Private
Investors & Analysts Conference FY 11
 Investors & Analysts Conference FY 11 Bernhard Schreier, CEO Dirk Kaliebe, CFO Robin Karpp, Head of Investor Relations Heidelberger Druckmaschinen AG June 16, 2011 Highlights FY 11 Heidelberg is operationally
Sivantos Investor Presentation
 Sivantos Investor Presentation Dr. Roger Radke, CEO Jens Due Olsen, CFO 6 June 2016 Sivantos 2015 All rights reserved/restricted. Disclaimer This document contains statements related to our future business
Lenovo Group Limited
 Lenovo Group Limited 2008/09 Interim Results November 6, 2008, San Francisco / November 7, 2008, Hong Kong 2008 Lenovo William Amelio President & Chief Executive Officer 2008 Lenovo The foundation of Lenovo