Worldwide. On Site. Drägerwerk AG & Co. KGaA Capital Markets Presentation. May, 2017
|
|
|
- Jared Morton
- 5 years ago
- Views:
Transcription


1 Worldwide. On Site. Drägerwerk AG & Co. KGaA Capital Markets Presentation May, 2017
2 Disclaimer This presentation does not constitute an offer of securities for sale or a solicitation of an offer to purchase any securities. No money, securities or other consideration is being solicited by this presentation. This presentation contains forward-looking statements regarding the future development of the Dräger Group. These forward-looking statements are based on the current expectations, presumptions, and forecasts of the Executive Board as well as the information available to it to date, and have been made to the best of its knowledge and belief. No guarantee or liability for the occurrence of the future developments and results specified can be assumed in respect of such forward-looking statements. Rather, the future developments and results are dependent on a number of factors; they entail risks and uncertainties beyond our control and are based on assumptions which could prove to be incorrect. Notwithstanding any legal requirements to adjust forecasts, we assume no obligation to update the forward-looking statements contained in this presentation. Interim financial reports as well as preliminaries are not audited. 2


3 Dräger The Company Financials Outlook 3


4 4 Dräger The Company
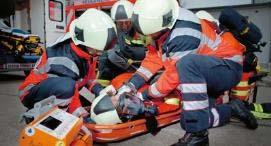
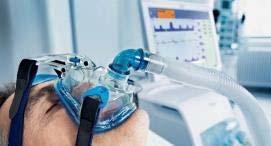
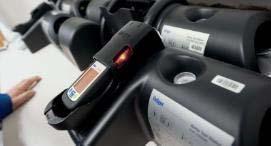
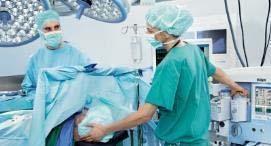
5 Dräger products protect, lives support and save. 5
6 Net sales development Strong growth independent of the global economy Dräger net sales in EUR million Global gross domestic product Net sales development 2,500 2,000 1,500 1,000 Gulf War Mexican peso crisis Russian financial crisis Stockmarket crash Stockmarket crash Iraq War Financial crisis Source: International Monetary Fund, World Economic Outlook Database 6
7 Dräger worldwide Net sales, sites and employees Safety ~35 % 25% 20% Net Sales: EUR 2.5 billion in % 10% Medical ~65 % 11% 14% 16% 13,263 employees in 2016 Dräger-Sites 25% 70% 55% Production sites in Europe, America, Africa und Asia Sales and Service organizations worldwide Sales & Service F&E Production, Quality, Logistics, Purchasing Administration Europe Africa, Asia, Australia Americas 7


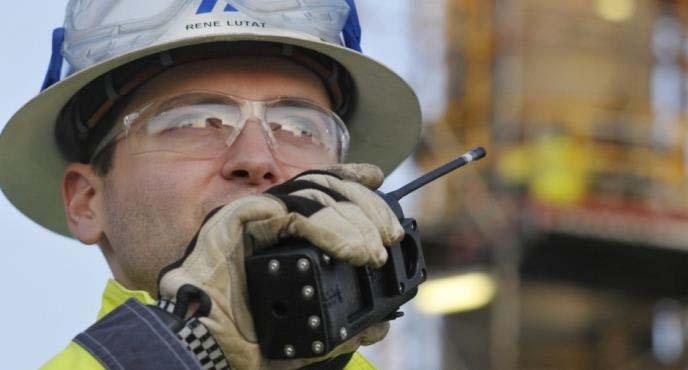
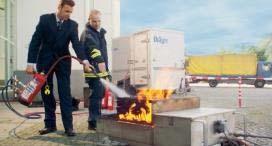
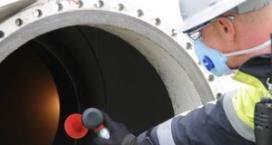
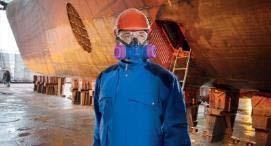
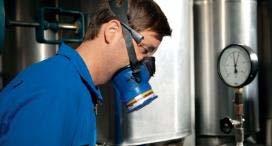
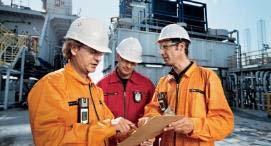
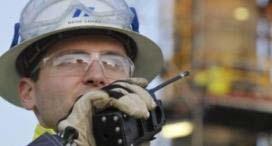
8 Markets Our customers Hospital Fire services Oil and gas industry Mining Chemical industry Other markets 8


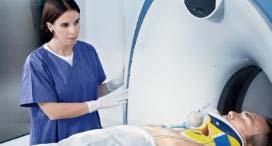
9 Intensive Care Operating Room Neonatal Care Hospital wide Solutions Anaesthesiology Ventilation Thermoregulation Anaesthesia workstations and vaporizers #1 in Europe and #2 in the US market Emergency & Transport-, Neonatal Care and Intensive Care ventilators Respiratory monitoring #1 in Europe Patient Monitoring & Clinical IT Infinity Acute Care System Clincal software solutions Telemetry and IT-solutions Workplace Infrastructure Medical supply units Medical Gas supply systems Medical lights and video solutions Incubators and Warming Therapy #2 worldwide and #1 in Europe Hospital Consumables & Service Consumables and accessories Classical-, Multivendor product service, Professional Service Training Note: Market position based on Dräger s market knowledge and its own assessment of market position; positions ranked according to net sales, for monitoring depending on market definition. 9


10 Fire Service Oil & Gas Chemical Mining Other Markets Breathing Systems Gas Detection Systems Self-contained Breathing Appartus for fire fighters #2 worldwide and #1 in Europe Impairment Check Equipment Alcohol- and drug screening devices Interlock devices #1 worldwide and #1 in Europe Fixed and mobile gas detection systems #1 worldwide and #1 in Europe Personal Protection Equipment Protection equipment for hazardous working environments Body and Head protection, rescue and escape devices, Masks and Filters, etc. Note: Market positions based on Dräger s market knowledge and its own assessment of market position; positions ranked according to net sales. Engineered Solutions Service Customer specific solutions mobile and stationary firefighting training systems Rescue chambers Spareparts and consumables Product Service Rental, On-site shops and Shutdown Service Marine-Offshore Service 10
11 Medical and safety technology providing long-term growth prospects in developed and emerging markets Hospital Oil&Gas Chemical Mining FireService Attractive growth prospects in sizeable markets Average expected annual market growth for the global medical equipment market significantly exceeding growth in many other sectors Strong growth prospects in both developed and emerging markets Very diversified markets with numerous product and service offerings Attractive growth prospects for target sectors (e.g. industry) and growing safety investments in Europe and the US Rapidly aging population and consequently increasing healthcare expenditure Increasing demand for medical equipment to improve clinical workflows and efficiency Increasingly stricter safety regulations Rising environmental awareness Improved outlook for target markets as well as in emerging markets Strong growth of GDP and population resulting in a demand for improved medical services Political benefits from investments in health care sector Increasingly higher safety standards Increasing industrial hygiene awareness Strong growth of key customer sectors 11
12 Strategy for profitable growth 1 Management of innovation rate through continuous improvements in quality and R&D processes 2 Expansion of market positions in attractive markets. Special focus on profitable growth in developing countries 3 Expansion of service and consumables business 4 FIT FOR GROWTH efficiency program 12
 Approximately 1,300 employees in R&D around the globe.")


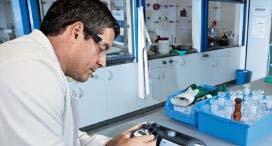
13 1 Technology and innovation leadership to drive profitable growth Strong R&D focus Innovation to enhance future growth (examples) Approximately 1,300 employees in R&D around the globe. EUR 219 million spent for R&D activities in 2016 (8.7 % of net sales). Certified test-center at Lübeck headquarter supports innovation- and approval process. Qualitymanagement organization with >100 employees. Very close collaboration with customers to develop new and improve existing products. Technological competency and high quality standards result in leading market positions and high barriers to entry. Babyleo Incuwarmer: combination of a classical incubator and warming bed functionalities. Regard 7000 core controlling unit for fixed gas detection systems. Mview Integration of handheld devices in the patient monitoring landscape of hospitals. 13


14 2 Exploit growth potentials in developing countries 2 Investments in profitable growth in developing countries Focus on the specific needs of customer in developing countries Identify growth potential in strong growing markets like China, Brazil and India Capitalize on the significant investments into the Sales & Service infrastructure and specific market knowledge, especially in our Regions Asia / Pacific, Central- and South-America Enhance engagement with partners in developing countries to expand local presence with R&D, manufacturing, sales and after sales business Net sales 2016 Newly industrialized countries 23 % Focused product range Developed Markets 77 % Savina Color Vista 120 Fabius Plus XL 14


 is a critical factor for customers Dräger Service")


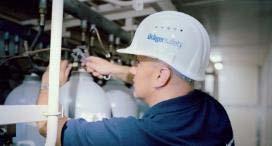
15 3 Service- and consumables business a clear focus of our Sales activities 3 Further expansion of service and consumables business Capitalize on large installed base to expand after sales business Focus on combined sale of equipment and after sales contracts Expansion of disposable consumables business Dräger Services Dräger Consumables Globally over 3,000 service technicians Fast and reliable service (repairs and spare parts) is a critical factor for customers Dräger Service technicians important for customer loyalty Efficient service solutions via remote service Broad offerings of product service New services in the areas of Rental, Multi-Vendor and Marine-offshore Functionalities with added value, e.g. optimizing workflow with RFID-based communication between consumables part and therapy machine Dräger quality to improve hygienic standards Dräger value add especially in development of consumables. Production usually via suppliers Partly proprietary consumable products, e.g. Dräger-Tubes 15
16 4 FIT FOR GROWTH Overview Initiatives SHAPE Improve SG&A expense ratio Optimize global Sales, Marketing & Administration set-up New governance model in Q1/16 implemented. 250 cost containment measures: ~70% of the measures implemented in Remaining ~30% will be implemented in cost reduction net of FX and restructuring charges: -6.1% in Reduction of SGA ratio* to ~30% in Fit! Bring customer value faster to the market Optimize innovation set-up New Innovation organization implemented. Numerous changes in the innovation process (e.g. strengthen system and platform based development, AGILE development, Dräger Garage, etc. ). Improve Time to market by 50% until Global footprint Improve workflow and delivery times and reduce production cost Optimize production set-up New Zukunftsfabrik in Lübeck (go-live in Q2/2016). Transfer of production with high labor content to Czech Republic (completed). Closure of Pittsburgh site (completed). * at comparable FX rates Jan and before possible on-off expenses for restructuring or similar 16
17 17 Financials
18 Business development Dräger Group Q Q million million million million million million Net Sales 2, , , , % growth 0.0% 2.5% 7.2% -3.3% -2.4% 0.5% % growth (FX adjusted) 3.1% 4.0% 2.9% -1.5% 0.2% -1.1% Gross Profit 1, , , , Gross margin 48.3% 46.7% 44.9% 45.0% 42.0% 44.9% Functional Expenses , % of Net Sales -39.7% -39.7% -42.1% -39.6% -44.9% -44.4% EBIT EBIT Margin 8.5% 7.3% 2.6% 5.4% -2.9% 0.4% Net Profit DVA Note: restructuring charges included in FY EBIT: EUR 35 million in 2015, EUR 10 million in 2016; EUR 10 million (planned) in
19 Key figures Dräger Group Q Q million million million million million million Cashflow (from operating activities) Investments Cash and cash equivalents Net financial debt Net financial debt 1 /EBITDA Capital employed 1 1, , , , , ,218.6 ROCE (EBIT 2 /Capital employed 1 ) 19.1% 16.1% 5.3% 11.0% 4.0% 12.7% Net Working Capital Headcount 1 13,334 13,737 13,936 13,263 13,679 13,352 1 Values as of reporting date 2 EBITDA and accordingly EBIT of the last twelve months 19


20 20 Outlook
21 Outlook e Net Sales % 0.0 % 3.0 % (net of currency effects) EBIT margin 5.4 % 5.0 % 7.0 %* Gross profit margin 45.0 % % Dräger Value Added EUR 49.8m EUR 40m 90m Assumptions for FY 2017 Guidance Downside risk of strong market interruptions caused by rising political protectionism (new import taxes, cancellation of international trade agreements) or caused by high level of uncertainty (e.g. repeal of Obamacare) not reflected in guidance. Demand improvement in AAA region and Europe (ex DACH). Continuously strong development in North America, but increasing challenges in Central- and South America. Possibly softer development in DACH in light of strong FX effects of ~+1 pp on net sales. No support from FX on EBIT-margin.* Restructuring cost of EUR ~10 million (PY EUR 10 million). * based on exchange rates at the start of the year
22 22 Guiding philosophy What we stand for


23 23

 Vice")


24 Dräger management Stefan Dräger Gert-Hartwig Lescow Rainer Klug Dr. Reiner Piske Anton Schrofner Chairman of the Executive Board (Chief Executive Officer) Vice Chairman of the Executive Board Executive Board member for Finance and IT Executive Board member for Purchasing, Production and Logistics Chief Human Resources Officer Executive Board member for Innovation and Quality At Dräger since 1992 At Dräger since 2008 At Dräger since 2015 At Dräger since 2015 At Dräger since 2010 Fifth generation of the Dräger family to lead the company Responsible for the Americas region Responsible for the Europe region Responsible for the Africa, Asia and Australia regions 24
25 Shareholder structure 10,160,000 common shares (28.8 % free float) 7,600,000 preferred shares (100.0 % free float) Shareholding Common shares Shareholding Dr. Heinrich Dräger GmbH 28.8% 4.0% 18.1% 58.7% 67.2 % 23.2% Dr. Heinrich Dräger GmbH Free float Members of the Dräger family Stefan Dräger GmbH Dräger Foundation Successors of Dr. Heinrich Dräger 25
26 Guidance 2017 Net sales -1.5% (net of currency effects) 2016 Forecast % (net of currency effects) EBIT margin 5.4% % 1 Dräger Value Added EUR 49.8 million EUR million Other forecast figures: Gross margin 45.0% % Research and development costs EUR 219 million EUR million Interest result EUR million EUR -13 to -17 million Days wokring capital (DWC) days Slight improvement Investment volume EUR 99.9 million EUR million Net financial debt EUR 34.7 million Improvement 1 Based on exchange rates at the start of the year 2 excluding company acquisitions 26
27 Business Development Segments SEGMENT EUROPE Order Entry 1 million 1, , , , ,382.5 Net Sales 1 million 1, , , , ,384.3 EBIT million EBIT margin % SEGMENT AMERICA Order Entry 1 million Net Sales 1 million EBIT million EBIT margin % SEGMENT AFRICA, ASIA, AUSTRALIA Order Entry 1 million Net Sales 1 million EBIT million EBIT margin % years were adjusted pro-forma due to the change in segment reporting. For further analysis, this data (including quarterly figures) can be downloaded as an Excel file from the Dräger website Anmerkung: die Daten, inklusive der Quartalszahlen, können auf der Dräger Website im.xls-format herunter geladen werden Anmerkung: die Daten, inklusive der Quartalszahlen, können auf der Dräger Website im.xls-format herunter geladen werden 27
28 Business Development medical and safety products Medical Order Entry million 1, , , , ,662.6 Net Sales million 1, , , , ,647.4 EBIT million EBIT margin % Safety Order Entry million Net Sales million EBIT million EBIT margin % For further analysis, this data (including quarterly figures) can be downloaded as an Excel file from the Dräger website 28
29 Functional expenses Q Q million million million million million million R&D % of Net Sales -8.5% -8.7% -8.9% -8.7% -10.2% -10.5% SG&A % of Net Sales -31.1% -30.8% -33.0% -30.2% -34.8% -34.2% Functional Expenses total , % of Net Sales -39.7% -39.7% -42.1% -39.6% -44.9% -44.4% Headcount 1 13,334 13,737 13,936 13,263 13,679 13,352 1 Values as of reporting date 29
30 Cash-flow statement Q Q million million million million million million Group net profit Change in inventories Change in receivables Change in payables Depreciation and amortization Other operating cash flow item Operating cash flow Investing cash flow Free cash flow Financing cash flow Change in cash Cash and cash equivalents Change in cash and cash equivalents, i.e. without any effect of exchange rates 2 Values as of reporting date 30
31 Consolidated balance sheet 31 Dec Dec 2016 Change million million % Intangible Assets Property, plant and equipment Other noncurrent assets Noncurrent assets Inventories Trade receivables Other current assets Cash and cash equivalents Current assets 1, , Total assets 2, ,
32 Consolidated balance sheet 31 Dec Dec 2016 Change million million % Equity , Liabilities from participation certificates Provisions for pensions and similar oblig Noncurrent interest bearing loans Other noncurrent liabilities Noncurrent liabilities Current Provisions Current loans and liabilities to banks Trade payables Other current liabilities Current liabilities Total equity and liabilities 2, ,
33 Innovation rate Share on new products and upgrades medical division 1 45% 40% Net sales Upgrades New products 35% 30% 29% 33% 34% 32% 27% 25% 20% 15% 15% 23% 28% 22% 20% 20% 10% 18% 5% 0% 14% 10% % % % % Launched in the last 3 years; products are regarded as new, if they enable Dräger to either enter a new market segment or if products are regarded as completely new according to Dräger s customers and Dräger s sales force. Upgrades are those products, which serve existing Dräger markets, but their functionality is perceived as significantly enhanced by Dräger s customers and Dräger s sales force. 33
34 Earnings per share Net profit in thousand 135, , ,666 33,288 81,736 Earnings attributable to non controlling interests in thousand 3, Szenario: 100% distribution: pay out ratio 100% 100% 100% 100% 100% Earnings attributable to participation certificates* in thousand 35,523 31,917 27,686 8,530 20,537 Earnings attributable to shareholders in thousand 96,838 87,415 77,085 25,044 60,855 Earnings per common share Earnings per preferred share Szenario: actual/proposed distribution pay out ratio 15.1% 15.1% 30.1% 10.9% 4.5% Earnings attributable to participation certificates* in thousand 5,325 4,780 8, Earnings attributable to shareholders in thousand 127, ,553 96,598 32,665 80,496 Earnings per common share** Earnings per preferred share** * excluding minimum dividend, after taxes ** the EPS is not in accordance with IAS 33 34
35 Financial calendar 2017 March 8, Accounts press conference, Lübeck - Analysts meeting May 4, Report for the first three months 2017 Conference call, Lübeck May 10, Annual shareholders' meeting, Lübeck July 27, Report for the first six months 2017 Conference call, Lübeck November 2, Report for the first nine months 2017 Conference call, Lübeck 35

36 Contact Melanie Kamann Corporate Communications Thomas Fischler Investor Relations Drägerwerk AG & Co. KGaA Drägerwerk AG & Co. KGaA Moislinger Allee Moislinger Allee Lübeck, Germany Lübeck, Germany Tel Tel Fax Fax Mobile Mobile
Worldwide. On Site. Drägerwerk AG & Co. KGaA Capital Markets Presentation. January, 2018
 Worldwide. On Site. Drägerwerk AG & Co. KGaA Capital Markets Presentation January, 2018 Disclaimer This presentation does not constitute an offer of securities for sale or a solicitation of an offer to
Drägerwerk AG & Co. KGaA Capital Markets Presentation. July, 2018
 Drägerwerk AG & Co. KGaA Capital Markets Presentation July, 2018 Disclaimer This presentation does not constitute an offer of securities for sale or a solicitation of an offer to purchase any securities.
Drägerwerk AG & Co. KGaA Capital Markets Presentation. March, 2016
 Drägerwerk AG & Co. KGaA Capital Markets Presentation March, 2016 Disclaimer This presentation does not constitute an offer of securities for sale or a solicitation of an offer to purchase any securities.
Drägerwerk AG & Co. KGaA Capital Markets Presentation. October, 2018
 Drägerwerk AG & Co. KGaA Capital Markets Presentation October, 2018 Disclaimer This presentation does not constitute an offer of securities for sale or a solicitation of an offer to purchase any securities.
Drägerwerk AG & Co. KGaA Capital Markets Presentation. March, 2015
 Drägerwerk AG & Co. KGaA Capital Markets Presentation March, 2015 Disclaimer This presentation does not constitute an offer of securities for sale or a solicitation of an offer to purchase any securities.
Analyst Conference Drägerwerk AG & Co. KGaA. March 7 th 2019
 Analyst Conference Drägerwerk AG & Co. KGaA March 7 th 2019 Disclaimer This presentation does not constitute an offer of securities for sale or a solicitation of an offer to purchase any securities. No
Analyst Conference Drägerwerk AG & Co. KGaA. Frankfurt, March 8 th 2018
 Analyst Conference Drägerwerk AG & Co. KGaA Frankfurt, March 8 th 2018 Disclaimer This presentation does not constitute an offer of securities for sale or a solicitation of an offer to purchase any securities.
Conference call Interim report January 1 to March 31, Lübeck, April 26, 2016
 Conference call Interim report January 1 to March 31, 2016 Lübeck, April 26, 2016 Disclaimer This presentation does not constitute an offer of securities for sale or a solicitation of an offer to purchase
Worldwide. On Site. Conference call Interim report January 1 to June 30, Lübeck, July 27, 2017
 Worldwide. On Site. Conference call Interim report January 1 to June 30, 2017 Lübeck, July 27, 2017 Disclaimer This presentation does not constitute an offer of securities for sale or a solicitation of
Conference call Interim report January 1 to March 31, Lübeck, April 26, 2018
 Conference call Interim report January 1 to March 31, 2018 Lübeck, April 26, 2018 Disclaimer This presentation does not constitute an offer of securities for sale or a solicitation of an offer to purchase
Conference call Interim report January 1 to September 30, 2018
 ICH WERDE DA SEIN. Conference call Interim report January 1 to September 30, 2018 Lübeck, October 30, 2018 Disclaimer This presentation does not constitute an offer of securities for sale or a solicitation
Conference call Interim report January 1 to March 31, Lübeck, May 2, 2013
 Conference call Interim report January to March 3, 203 Lübeck, May 2, 203 Disclaimer This presentation does not constitute an offer of securities for sale or a solicitation of an offer to purchase any
Quarterly Statement January 1 to September 30, 2017 Dräger Group
 Quarterly Statement January 1 to September 30, 2017 Dräger Group THE DRÄGER GROUP OVER THE PAST FIVE YEARS 2013 2014 2015 2016 2017 Order intake million 1,756.7 1,743.4 1,895.1 1,849.1 1,928.3 Net sales
Quarterly Statement January 1 to March 31, 2017 Dräger Group
 Quarterly Statement January 1 to March 31, 2017 Dräger Group THE DRÄGER GROUP OVER THE PAST FIVE YEARS 2013 2014 2015 2016 2017 Order intake million 571.3 544.6 615.3 599.6 639.4 Net sales million 533.8
Quarterly Statement January 1 to March 31, 2018 Dräger Group
 Quarterly Statement January 1 to March 31, 2018 Dräger Group THE DRÄGER GROUP OVER THE PAST FIVE YEARS 2014 2015 2016 2017 2018 Order intake million 544.6 615.3 599.6 639.4 621.4 Net sales million 513.2
Drägerwerk AG & Co. KGaA Analysts Meeting. Frankfurt, March 14, 2012
 Drägerwerk AG & Co. KGaA Analysts Meeting Frankfurt, March 4, 202 Disclaimer This presentation does not constitute an offer of securities for sale or a solicitation of an offer to purchase any securities.
Quarterly Statement January 1 to March 31, 2016 Dräger Group
 Quarterly Statement January 1 to March 31, 2016 Dräger Group THE DRÄGER GROUP over the past five years 2012 2013 2014 2015 2016 Order intake million 550.9 571.3 544.6 615.3 599.6 Net sales million 529.3
H1/2005 report Dräger Group
 H1/2005 report Dräger Group D 3 Contents 4 Preliminary remarks 4 Preparation of the interim financial statements 5 Business performance H1/2005 5 Dräger Group 8 Business performance of the segments 8
Nine months 2011: Dräger increases order intake and earnings
 Page 1 / 5 Nine months 2011: Dräger increases order intake and earnings - Order intake grows by 7.8 percent - EBIT margin reaches 9.0 percent - Equity ratio continues to rises to 34.7 percent - Sales reorganization
FINANCIAL CALENDAR 2018 Imprint Drägerwerk AG & Co. KGaA Concept and design Publication Drägerwerk AG & Co. KGaA Reproductions Printed by
 Annual Report 2017 Technology for Life COMPANY PROFILE Dräger is an international leader in the fi elds of medical and safety technology. The family-run company was founded in Lübeck, Germany, in 1889.
Q1/2005 report Dräger Group
 Q1/2005 report Dräger Group D 3 Contents 4 Preliminary remarks 4 Preparation of the interim financial statements 5 Business performance Q1/2005 5 Dräger Group 8 Business performance of the segments 8
Half-yearly financial report January 1 to June 30, 2017 Dräger Group
 Half-yearly financial report January 1 to June 30, 2017 Dräger Group THE DRÄGER GROUP OVER THE PAST FIVE YEARS Six months 2013 Six months 2014 Six months 2015 Six months 2016 Six months 2017 Order intake
Quarterly Report January 1 to March 31, 2011 Dräger Group
 Quarterly Report January 1 to March 31, 2011 Dräger Group THE DRÄGER GROUP over the past five years 2007 2008 2009 2010 2011 Change on 2010 in % Order intake million 444.9 493.8 448.6 488.2 553.6 +13.4
Half-yearly financial report January 1 to June 30, 2012 Dräger Group
 Half-yearly financial report January 1 to June 30, Dräger Group THE DRÄGER GROUP OVER THE PAST FIVE YEARS Six months 2008 Six months 2009 Six months 2010 Six months Six months Change on in % Order intake
Half-yearly financial report January 1 to June 30, 2016 Dräger Group
 Half-yearly financial report January 1 to June 30, 2016 Dräger Group THE DRÄGER GROUP OVER THE PAST FIVE YEARS Six months 2012 Six months 2013 Six months 2014 Six months 2015 Six months 2016 Order intake
Quarterly Report January 1 to September 30, 2012 Dräger Group
 Quarterly Report January 1 to September 30, Dräger Group THE DRÄGER GROUP OVER THE PAST FIVE YEARS Nine months 2008 Nine months 2009 Nine months 2010 Nine months Nine months Change on in % Order intake
Quarterly Report January 1 to September 30, 2009 Dräger Group (revised version)
") Quarterly Report January 1 to September 30, 2009 Dräger Group (revised version) THE DRÄGER GROUP AT A GLANCE Nine months Nine months Nine months Nine months Change on 2006 2007 2008 2009 2008 in % Order
Quarterly Report January 1 to September 30, 2009 Dräger Group (revised version) THE DRÄGER GROUP AT A GLANCE Nine months Nine months Nine months Nine months Change on 2006 2007 2008 2009 2008 in % Order
Q3/2003 report Dräger Group
 D Q3/2003 report Dräger Group Business trend in the Dräger Group Highlights in Q3/2003 Despite one-off expenses and unfavorable exchange rates, EBIT at year-earlier level Q3 group order intake and sales
Solid performance in an uncertain market
 Solid performance in an uncertain market Group operational EBITDA 1 margin stable vs Q2 2012, including Power Products Orders and revenues supported by better geographic balance in automation Strong divisional
Dräger Group Q1/2009 (amended version)
") Dräger Group Q1/2009 (amended version) Q1 THE DRÄGER GROUP AT A GLANCE Q1/2006 Q1/2007 Q1/2008 Q1/2009 Change on 2008 in % Order intake million 452.2 444.9 493.8 448.6 (9.2) Orders on hand million 327.2
Dräger Group Q1/2009 (amended version) Q1 THE DRÄGER GROUP AT A GLANCE Q1/2006 Q1/2007 Q1/2008 Q1/2009 Change on 2008 in % Order intake million 452.2 444.9 493.8 448.6 (9.2) Orders on hand million 327.2
SEMPERIT GROUP FY 2017 / Q INVESTOR PRESENTATION. Dr Martin Füllenbach, CEO Frank Gumbinger, CFO 16 March 2018
 SEMPERIT GROUP FY / Q4 INVESTOR PRESENTATION Dr Martin Füllenbach, CEO Frank Gumbinger, CFO 16 March 2018 Transformation process initiated Challenges and Timeline Sempermed Group ( Group (2) Cost efficiency
Q2 FY 2009 Sales & Earnings. March 12, 2009
 Q2 FY 2009 Sales & Earnings March 12, 2009 Forward-Looking Statements The matters discussed in this presentation contain forward-looking statements as defined in the Private Securities Litigation Reform
FORACO INTERNATIONAL S.A. MANAGEMENT S DISCUSSION & ANALYSIS
 FORACO INTERNATIONAL S.A. MANAGEMENT S DISCUSSION & ANALYSIS Three-month and nine-month periods ended September 30, 2017 FORACO INTERNATIONAL S.A. MANAGEMENT S DISCUSSION AND ANALYSIS The following Management
Fresenius Medical Care achieves revised 2018 targets and accelerates investments for future growth
 0 Press Release Media Contact Matthias Link T +49 6172 609-2872 matthias.link@fresenius.com Contact for analysts and investors Dr. Dominik Heger T +49 6172 609-2601 dominik.heger@fmc-ag.com www.freseniusmedicalcare.com
EDITED TRANSCRIPT. Q Draegerwerk AG & Co KGaA Earnings Call EVENT DATE/TIME: OCTOBER 30, 2018 / 2:00PM GMT THOMSON REUTERS
 THOMSON REUTERS EDITED TRANSCRIPT Q3 2018 Draegerwerk AG & Co KGaA Earnings Call EVENT DATE/TIME: OCTOBER 30, 2018 / 2:00PM GMT 1 CORPORATE PARTICIPANTS CONFERENCE CALL PARTICIPANTS Aliaksandr Halitsa
Hill-Rom Fourth Quarter 2016 Financial Results. November 3, 2016
 Hill-Rom Fourth Quarter 2016 Financial Results November 3, 2016 Forward Looking Statements Certain statements in this presentation contain forward-looking statements, within the meaning of the Private
Interim statement Q / Digital in the box.
 Interim statement Q3 2017 / 2018 Digital in the box. Heidelberg Group Interim statement for the third quarter of 2017 / 2018 Figures Incoming orders after nine months on par with previous year at 1,912
Interim Report Q4 FY 17
 Interim Report Q4 FY 17 Quarter 4 / Fiscal Year 2017 Sustained positive development Sivantos delivered 3.1% organic growth 1) in Q4 FY2017. The moderate growth rate compared to previous quarters was a
A Trusted Technology Partner to Medical and Advanced Technology Equipment Manufacturers
 A Trusted Technology Partner to Medical and Advanced Technology Equipment Manufacturers Baird Healthcare Conference, September 2017 NASDAQ: NOVT 1 Safe Harbor Statement The statements in this presentation
FINANCIAL STATEMENT 28 FEBRUARY RD QUARTER FISCAL YEAR 2017/2018
 FINANCIAL STATEMENT 28 FEBRUARY 2018 3RD QUARTER FISCAL YEAR 2017/2018 Contents 03 KEY PERFORMANCE INDICATORS 04 HIGHLIGHTS 05 INDUSTRY DEVELOPMENT 05 BUSINESS DEVELOPMENT OF THE HELLA GROUP 05 Results
H1/2018 Results u-blox Holding AG
 H1/2018 Results August 24, 2018 Thomas Seiler, CEO Roland Jud, CFO Disclaimer This presentation contains certain forward-looking statements. Such forward-looking statements reflect the current views of
FORACO INTERNATIONAL S.A. MANAGEMENT S DISCUSSION & ANALYSIS
 FORACO INTERNATIONAL S.A. MANAGEMENT S DISCUSSION & ANALYSIS Three-month and nine-month periods ended September 30, 2018 FORACO INTERNATIONAL S.A. MANAGEMENT S DISCUSSION AND ANALYSIS The following Management
July 26, 2017 LafargeHolcim Ltd 2015
 Second Quarter 2017 Results Beat Hess, Chairman and Interim CEO Roland Köhler, Interim COO and Regional Head of Europe, Australia/NZ & Trading Ron Wirahadiraksa, CFO July 26, 2017 LafargeHolcim Ltd 2015
February 29 th, FY 2015 Results Presentation
 February 29 th, 2016 FY 2015 Results Presentation 1 GROWTH Excellent results in Spain and Argentina Positive organic growth in Brazil Sales growth of 4.7% including FX rate LatAm organic growth above 12%
Full-Year / Fourth Quarter 2010 Results
 Full-Year / Fourth Quarter 2010 Results 16 February 2011 Disclaimer This presentation contains certain statements that are neither reported financial results nor other historical information. This presentation
ANNUAL RESULTS PRESS CONFERENCE. Financial year 2007
 ANNUAL RESULTS PRESS CONFERENCE Financial year 2007 Cologne, 27 March 2008 Agenda Highlights of financial year 2007 Dr Helmut Leube, Chairman of the Management Board Key performance indicators for 2007
Financial Year March 15, Leveraging the Group s Position
 Financial Year 2011 Media and Analysts Meeting March 15, 2012 2011 Leveraging the Group s Position Safe Harbour Statement The information made available in this conference may include forward-looking statements
Digital in the box. Interim statement Q / 2018
 Digital in the box. Interim statement 2017 / 2018 Heidelberg Group INTERIM STATEMENT FOR THE FIRST QUARTER OF 2017/2018 Figures Incoming orders total 629 million Net sales up year-on-year at 495 million
Full-Year 2017/18 Results Stäfa, May 22, 2018 Arnd Kaldowski, CEO Hartwig Grevener, CFO Thomas Bernhardsgrütter, IR
 Full-Year 2017/18 Results Stäfa, Arnd Kaldowski, CEO Hartwig Grevener, CFO Thomas Bernhardsgrütter, IR Disclaimer This presentation contains forward-looking statements, which offer no guarantee with regard
FUCHS PETROLUB AG The leading independent lubricants manufacturer of the world
 The leading independent lubricants manufacturer of the world Dr. Alexander Selent, Vice Chairman & CFO Dagmar Steinert, Head of Investor Relations April 2013 FUCHS the leading independent lubricants manufacturer
Investor Call Half-Year Results 2016
 Investor Call Half-Year Results 2016 September 22th, 2016 Philipp Kuckuck, Vice President Corporate Finance Disclaimer This presentation was prepared with reasonable care. However, no responsibility can
FY 2014 Results Presentation. Uwe Röhrhoff, CEO Rainer Beaujean, CFO Duesseldorf, February 11, 2015
 FY 2014 Results Presentation Uwe Röhrhoff, CEO Rainer Beaujean, CFO Duesseldorf, February 11, 2015 Disclaimer 1. This presentation may contain certain forward-looking statements, including assumptions,
Quarterly Highlights Revenue was $296 million, increasing 6 percent from a year ago on a reported basis and 5 percent on a constant currency basis.
 FOR IMMEDIATE RELEASE FROM: Ticker: MSA (NYSE) Media Relations Contact: Mark Deasy (724) 741-8570 Investor Relations Contact: Kenneth Krause (724) 741-8534 MSA Announces Third Quarter Results Strategic
A good start to the year
 1 A good start to the year 28 April 2011 No. 17/11 Sales totaled SEK 8,699 M (8,345), representing an increase of 4%, made up of 6% organic growth, 7% acquired growth and exchange-rate effects of 9%. Strong
Cisco Systems Inc. Q1 FY 03 Conference Call November 6, 2002
 Cisco Systems Inc. Q1 FY 03 Conference Call November 6, 2002 2002, Cisco Systems, Inc. All rights reserved. 1 Cisco Forward-Looking Statements This presentation may contain projections or other forward-looking
QUANT INTERIM REPORT JANUARY JUNE 2018 INTERIM REPORT
 INTERIM REPORT January June 1 April June Revenue for the period remained flat against prior year in local currency. Revenue decreased to EUR 44.8 million from EUR 46.7 million prior year, including currency
Jefferies Global Healthcare Conference
 Jefferies Global Healthcare Conference June 7, 2012 2012 PAREXEL International Safe Harbor This presentation contains forward-looking statements within the meaning of Section 27A of the Securities Act
A Century of History A Global Service
 A Century of History A Global Service Bank of China Limited 2012 Interim Results August 24, 2012 Forward-looking Statement Disclaimer This presentation and subsequent discussions may contain forward-looking
Interim Report 3m 2015
 May 07, 2015 Interim Report 3m 2015 Investors and Analysts Conference Call on May 07, 2015 Andreas Müller, Head of Corporate Accounting & Tax / IR Bettina Schneider, Deputy Head IR 3m 2015: Highlights
Acquisition of Wood Mackenzie. March 10, 2015
 Acquisition of Wood Mackenzie March 10, 2015 Forward Looking Statements, Safe Harbor & Non- GAAP Financial Measures Forward-Looking Statements This presentation contains forward-looking statements. These
2 CEO's operational report. Arni Oddur Thordarson, CEO
 1 2 CEO's operational report Arni Oddur Thordarson, CEO 2.1 Year of strategic moves and solid performance CEO's operational report Strategic acquisitions and strong organic growth On the Icelandic Stock
EXPLOITING OPPORTUNITIES EFFICIENTLY FACTBOOK R. STAHL AG
 EXPLOITING OPPORTUNITIES EFFICIENTLY FACTBOOK R. STAHL AG NOVEMBER 2018 R. STAHL Factbook November 2018 1010 Rounding differences and rates of change Percentages and figures in this report may include
INTERIM PRESENTATION Q October 2018
 INTERIM PRESENTATION 25 October JUAN VARGUES, PRESIDENT & CEO HIGHLIGTHS Organic growth Good organic growth in EMEA Flat organic growth in Americas despite -7% RV OEM APAC down due to softer market in
Investor Presentation. August 2014
 Investor Presentation August 2014 1 Important Disclosures NOTE ON FORWARD-LOOKING STATEMENTS: This presentation and related discussions may contain forward-looking statements about such matters as: our
A Trusted Technology Partner to Medical and Advanced Technology Equipment Manufacturers
 A Trusted Technology Partner to Medical and Advanced Technology Equipment Manufacturers Baird Industrial Conference, November 2017 Matthijs Glastra, Chief Executive Officer NASDAQ: NOVT 1 Safe Harbor Statement
Quarterly Report Q1 2018
 Quarterly Report Q1 2018 26 April 2018 The global leader in door opening solutions A good start to the year First quarter Net sales increased by 2% to SEK 18,550 M (18,142), with organic growth of 4% (6)
Interim Report Q1 FY 18
 Interim Report Q1 FY 18 Quarter 1 / Fiscal Year 2018 Continued positive development extends into the new fiscal year Sivantos delivered 3.5% organic growth 1) in Q1 2018 with negative Fx translation effects
Earnings Release Q2 FY 2018
 Munich, Germany, May 9, 2018 Earnings Release FY 2018 January 1 to March 31, 2018 Investments in digital industry making an impact»most of our businesses, primarily our digital offerings, showed impressive
Financial Information
 Financial Information H1 revenues reached 12.8bn up 9.8%, flat org. in Q2 Adj. EBITA reached 1.6bn, up 6.4%, Adj. EBITA margin flat excl. Invensys in a challenging environment 2015 targets: Around flat
HALF-YEAR REPORT Bobst Group SA
 HALF-YEAR REPORT 2017 Bobst Group SA Bobst Group SA Half-year report 2017 KEY FIGURES In million CHF June 2017 June 2016 June 2015 Sales 643.2 600.4 524.7 Operating result (EBIT) 39.8 18.0 14.7 In % of
Interim Results 6-month figures FY 13
 Interim Results 6-month figures FY 13 Gerold Linzbach, CEO Dirk Kaliebe, CFO Robin Karpp, Head of IR HEIDELBERG, NOVEMBER 7TH, 2012 Review FY 2012/2013 Order intake of 668m in on par with previous year
Interim Results 9-month figures FY 11
 Interim Results 9-month figures FY 11 Bernhard Schreier, CEO Dirk Kaliebe, CFO Robin Karpp, Head of Investor Relations Heidelberger Druckmaschinen AG February 09, 2011 Highlights FY 11 Order intake increased
Interim management statement
 Interim management statement 1st to 3rd quarter of 2017 FIRST TO THIRD QUARTER AT A GLANCE DEUTZ Group: Overview 7 9/2017 7 9/2016 1 9/2017 1 9/2016 New orders 370.8 258.1 1,173.8 935.3 Unit sales (units)
ABB reports solid fourth quarter performance, 2011 net income up 24%
 ABB reports solid fourth quarter performance, 2011 net income up 24% Orders rise 17% 1 (10% organic 2 ), revenues up 16% (10% organic) Full-year orders hit $40 bn for first time, record revenues of $38
Fresenius Medical Care achieves record results in 2017 and targets strong net income growth in 2018
 Press Release Media Contact Matthias Link T +49 6172 609-2872 matthias.link@fresenius.com Contact for analysts and investors Dr. Dominik Heger T +49 6172 609-2601 dominik.heger@fmc-ag.com www.freseniusmedicalcare.com
P R E S S R E L E A S E
 P R E S S R E L E A S E from ASSA ABLOY AB (publ) 27 April 2004 No. 5/04 ASSA ABLOY Q1: ORGANIC GROWTH AND IMPROVED MARGINS IN ALL DIVISIONS Sales in the first quarter increased organically by 3% to SEK
Schaeffler Group at a glance
 Facts and figures 9M 2016 Schaeffler Group at a glance Key figures 1 st nine months Income statement (in millions) 2016 2015 Revenue 9,977 9,958 0.2 % at constant currency 2.7 % EBIT 1,276 1,251 2.0 %
Earnings Release Q3 FY 2015 April 1 to June 30, 2015
 Munich, Germany, July 30, 2015 Earnings Release FY 2015 April 1 to June 30, 2015 Solid performance, softening market environment»overall our businesses delivered solid underlying profitability despite
Q3 FY 2009 Sales & Earnings. June 9, 2009
 Q3 FY 2009 Sales & Earnings June 9, 2009 Forward-Looking Statements The matters discussed in this presentation contain forward-looking statements as defined in the Private Securities Litigation Reform
KONE s interim report for January June 2016 JULY 19, 2016 HENRIK EHRNROOTH, PRESIDENT & CEO
 KONE s interim report for January June 2016 JULY 19, 2016 HENRIK EHRNROOTH, PRESIDENT & CEO Figures Key figures for for January June 2016 Q2 2016 Key figures STRONG EXECUTION AND PROFITABLE SALES GROWTH
P R E S S R E L E A S E from ASSA ABLOY AB (publ)
") P R E S S R E L E A S E from ASSA ABLOY AB (publ) August 10, 2000 no. 14/00 INTERIM REPORT JANUARY-JUNE 2000 Sales increased by 24% to SEK 6,079 M (4,920) Income before tax increased by 44% to SEK 610
P R E S S R E L E A S E from ASSA ABLOY AB (publ) August 10, 2000 no. 14/00 INTERIM REPORT JANUARY-JUNE 2000 Sales increased by 24% to SEK 6,079 M (4,920) Income before tax increased by 44% to SEK 610
Reported revenue was $1.15 billion, increasing 2 percent from a year ago on a reported basis and 4 percent on a constant currency basis.
 FOR IMMEDIATE RELEASE FROM: MSA Safety Incorporated Ticker: MSA (NYSE) Media Relations Contact: Mark Deasy (724) 741-8570 Investor Relations Contact: Kenneth Krause (724) 741-8534 MSA Announces Full-Year
Consolidated Statement of Comprehensive Income Consolidated Statement of Cash Flows Consolidated Statement of Shareholders Equity...
 Group Management Report For The Three Months Ended March 31, 2009 Contents Group Management Report... 3 Overall Economy and Industry... 3 Revenue Development... 3 Earnings Development... 4 Research and
Interim Results 6-month figures FY 11
 Interim Results 6-month figures FY 11 Bernhard Schreier, CEO Dirk Kaliebe, CFO Andreas Trösch, Head of Investor Relations Heidelberger Druckmaschinen AG November 10, 2010 Highlights Q2 FY 11 650 million
Investor Presentation Q3 Results. 12 November 2014
 Investor Presentation Q3 Results 12 November 2014 1 Forward-looking statements This presentation contains forward-looking statements, including, but not limited to, the statements and expectations contained
FOR IMMEDIATE RELEASE
 FOR IMMEDIATE RELEASE FROM: MSA Safety Incorporated Ticker: MSA (NYSE) Media Relations Contact: Mark Deasy (724) 741-8570 Investor Relations Contact: Elyse Lorenzato (724) 741-8525 MSA Announces Second
FISHER & PAYKEL HEALTHCARE DELIVERS RECORD FULL YEAR RESULT, NET PROFIT UP
 News Release STOCK EXCHANGE LISTINGS: NEW ZEALAND (FPH), AUSTRALIA (FPH) FISHER & PAYKEL HEALTHCARE DELIVERS RECORD FULL YEAR RESULT, NET PROFIT UP 26% Auckland, New Zealand, 23 May 2014 - Fisher & Paykel
Strong margin expansion and robust licence sales help Temenos to raise outlook for full year free cashflow by 60%
 Strong margin expansion and robust licence sales help Temenos to raise outlook for full year free cashflow by 60% Geneva, Switzerland, July 29, 2009 Temenos Group AG (SIX: TEMN), the global provider of
VERSUM MATERIALS. Air Products Electronic Materials Division Spin-off Form 10 Highlights August 2016
 VERSUM MATERIALS Air Products Electronic Materials Division Spin-off Form 10 Highlights August 2016 FORWARD-LOOKING STATEMENTS This presentation and materials Air Products and Versum have filed or will
Outline of Consolidated Results for the Third Quarter of FY2017. February 2, 2018
 Outline of Consolidated Results for the Third Quarter of FY2017 February 2, 2018 Contents 1. Outline of Consolidated Results for the Third Quarter of FY2017 P.3 2. Supplementary Materials of Financial
J.P. MORGAN HEALTHCARE CONFERENCE. Robert Abernathy Chairman and CEO
 J.P. MORGAN HEALTHCARE CONFERENCE Robert Abernathy Chairman and CEO OVERVIEW FORWARD-LOOKING INFORMATION Certain matters in this presentation and conference call, including our 2016 outlook, expectations
Press Release December 15, 2017
 ISRA VISION AG: 2016 / 2017 financial year Revenues and EBT +11 %, cash flow significantly stronger ISRA again matches full year guidance: Heading for the next revenue level with double-digit growth rates
Analysts Conference, March 27, Analysts Conference 2003 Seite 1
 Analysts Conference, March 27, 2003 Analysts Conference 2003 Seite 1 Linde Group FY 2002 Slight decline in sales due to drop in domestic sales Drop in EBITA compensated by lower interest charge and reduced
April-September 2017 Results: short term impacts, long term actions. November 6, 2017
 April-September 2017 Results: short term impacts, long term actions November 6, 2017 Disclaimer This material has been prepared by Siemens Gamesa Renewable Energy, and is disclosed solely for information
Interim Financial Report as at 31 March 2018
 Interim Financial Report as at 31 March 2018 Interim Report as at 31 March 2018 TRANSLATION FROM THE ORIGINAL ITALIAN TEXT INDEX PREFACE... 4 INTERIM MANAGEMENT REPORT AS AT 31 MARCH 2018... 5 CHANGES
P R E S S R E L E A S E
 P R E S S R E L E A S E from ASSA ABLOY AB (publ) 2 November 2004 No. 12/04 ASSA ABLOY: CONTINUED STRONG ORGANIC GROWTH IN THE THIRD QUARTER Sales in the third quarter increased organically by 6% to SEK
Business Update. USPP Conference Miami. Luis Damasceno Group CFO Michael Williams Group Finance Director & Treasurer January 2019
 Business Update USPP Conference Miami Luis Damasceno Group CFO Michael Williams Group Finance Director & Treasurer 23-25 January 2019 www.alsglobal.com IMPORTANT NOTICE AND DISCLAIMER This presentation
ACTIVISION BLIZZARD ANNOUNCES BETTER-THAN-EXPECTED THIRD QUARTER 2012 FINANCIAL RESULTS
 FOR IMMEDIATE RELEASE ACTIVISION BLIZZARD ANNOUNCES BETTER-THAN-EXPECTED THIRD QUARTER 2012 FINANCIAL RESULTS Company Had Three of the Top Four Best-Selling Games in North America and Europe for the First
Reported revenue was $346 million, increasing 17 percent from a year ago on a reported basis and 14 percent on a constant currency basis.
 FOR IMMEDIATE RELEASE FROM: MSA Safety Incorporated Ticker: MSA (NYSE) Media Relations Contact: Mark Deasy (724) 741-8570 Investor Relations Contact: Elyse Lorenzato (724) 741-8525 MSA Announces Fourth
Interim Report Q2 FY 18
 Interim Report Q2 FY 18 Quarter 2 / Fiscal Year 2018 Strong revenue growth driven by Signia Nx Sivantos delivered a strong organic growth 1) of 9.8% in Q2 2018 while nominal growth at 3.6% accounted negative