Analyst Conference Drägerwerk AG & Co. KGaA. Frankfurt, March 8 th 2018
|
|
|
- Leo Chase
- 6 years ago
- Views:
Transcription

1 Analyst Conference Drägerwerk AG & Co. KGaA Frankfurt, March 8 th 2018
2 Disclaimer This presentation does not constitute an offer of securities for sale or a solicitation of an offer to purchase any securities. No money, securities or other consideration is being solicited by this presentation. This presentation contains forward-looking statements regarding the future development of the Dräger Group. These forward-looking statements are based on the current expectations, presumptions, and forecasts of the Executive Board as well as the information available to it to date, and have been made to the best of its knowledge and belief. No guarantee or liability for the occurrence of the future developments and results specified can be assumed in respect of such forward-looking statements. Rather, the future developments and results are dependent on a number of factors; they entail risks and uncertainties beyond our control and are based on assumptions which could prove to be incorrect. Notwithstanding any legal requirements to adjust forecasts, we assume no obligation to update the forward-looking statements contained in this presentation. Interim financial reports as well as preliminaries are not audited. 2

3 OVERVIEW Fiscal Year
4 FY 2017 Highlights Guidance achieved. Return to Net sales growth after decline in the prior year. Strong order entry gives us a good basis for solid growth in Gross Profit margin stabilized and cost development well controlled. EBIT and DVA increases. Successful completion of the Fit For Growth program. Innovation rate increased again. 5 year decline stopped. Decision to step up investments to support future growth. 4
5 Net sales growth and EBIT improvement Business development Dräger Group Net Sales (in EUR million) 2, % FX adjusted +1.9% Nominal , Q1 Q2 Q3 Q EBIT (in EUR million) 5.4% Margin % Margin Q1 Q2 Q3 Q Highlights Order intake +4.4% cc above the net sales development. Again strong year-end business, despite some issues in the supply chain. Gross profit margin stable at 44.8% (PY 45.0%) Continuous cost containment. Functional expenses on prior year s level. FY EBIT-margin improved to 6.1%. Full-year FX impact negative on net sales and EBIT. (FY FX: Net sales 1.3pp, EBIT margin ~ -1pp) DVA improved to EUR 70.7m (PY EUR 49.8m) 5
6 Positive order intake in all regions Order development Dräger Group Order entry (in EUR million) Group Medical Safety Net Sales America % +1.6% -0.2% +3.5% Africa, Asia, Australia % +2.5% +10.4% +3.5% Europe 1, % +3.4% +8.9% +3.1% Group 2, % +2.6% +7.7% +3.3% Growth rates are net of currency effects; incl. allocations 6

7 Business Development Regions Fiscal Year
8 Region Americas Financial performance Order Entry EBIT Currency 515 adjusted % EBITmargin +1.0% -61% 0.8% EBITmargin Net Sales +3.5% 504 Currency adjusted Comments Order intake: Q4 FY Medical -3.4% +1.5% Safety +3.1% -0.2% Americas -1.6% +1.0% Solid FY Order and net sales growth in North America could off-set the decline in Central-, South-America. Gross profit margin: -0.2 pp yoy Functional expenses (FX adjusted): FY +4.5% yoy Decline in EBIT in large parts due to one-off expenses in Central-/South America DVA EUR -16.6m (PY EUR -10.5m) 8
9 Region Americas Operational performance and priorities Operational performance 2017 Brazil production site closed as planned. Activities transferred to South Africa. New market fulfillment organization implemented in North America. Improvement of working capital in the region Americas Priorities 2018 / 2019 Implementation of new Go to Market approach in North America. Return to growth in Central-, South America Return to stronger growth in Safety markets (order entry in FY17-0,2% FX adj.) 9
10 Region Europe Financial performance Order Entry EBIT Currency 1,383 adjusted 1, % EBITmargin % +28% 7.6% EBITmargin Net Sales +3.1% 1,384 Currency adjusted 1, Comments Order intake: Q4 FY Medical +6.9% +3.3% Safety +9.5% +9.1% Europe +7.9% +5.6% Good top line growth in many European countries. Germany slightly below strong PY level. Gross profit margin: +0.5pp yoy Functional expenses (FX adjusted): FY 0.5% yoy DVA EUR 68.8m (PY EUR 44.5m)
11 Region Europe Operational performance and priorities Operational performance 2017 Implementation of Future Technician Workplace. Strong performance in Safety, driven by Service & Consumables and also Safety Respiratory & Protective Systems. Good recovery in many European markets outside of Germany. Priorities 2018 / 2019 New Krefeld Site to go in operation and support European Rental & Shutdown Service growth. Further roll-out of Future Technician Workplace. Investment program in sales & service capabilities. 11
12 Region Africa, Asia, Australia Financial performance Order Enty +4.5% Currency 641 adjusted Net Sales +3.5% Currency 636 adjusted Comments Order intake: Q4 FY Medical -7.0% +2.3% Safety +6.8% +10.3% AAA -2.8% +4.5% Recovery in the Middle East and continuous good top-line development in China. EBIT 6.6% EBITmargin +4% 6.8% EBITmargin 43.7 Gross profit margin: -1.8pp yoy Functional expenses (FX adjusted): FY -2.4% yoy DVA EUR 18.5m (PY EUR 15.8m)
13 Region Africa, Asia, Australia Operational performance and priorities Operational performance 2017 Main growth driver is Safety with demand growth in all product areas. After a weak 2016, strong recovery in Middle East Africa. Start of production site in India. Production of medical support units targeted at Emerging Markets. ERP roll-out in Australia and New Zealand. Priorities 2018 / 2019 System Center for Gas Detection business Balanced growth in 2018, recovery of the markets that did not grow in

14 FINANCIALS Fiscal Year
15 Business development Dräger Group Net Sales Comments +5.0% Currency adjusted 819,5 835, ,8 +3.3% Currency adjusted 2.572,3 Order intake (FX adjusted) Q4 FY Medical +0.7% +2.6% Safety +7.8% +7.7% Group +3.3% +4.4% Orders on hand ~+9% cc EBIT Q4 16 Q % EBITmargin ,9 Q4 16 Q4 17 FY16 +3% +14% 13.4% EBITmargin 5.4% EBITmargin FY16 FY17 6.1% EBITmargin 155,7 FY17 Gross profit margin 12M 44.8% (py 45.0%) 12M Functional Expenses yoy +0.2% (cc); excluding restructuring in py +1.2% 12M restructuring cost 0m (py ~10m) 12M other fin.& invest. result -4.4m (py 0.7m) EBIT-margin incl. ~ -1 pp from FX DVA 70.7m (py 49.8m) 15
16 Functional Expenses Dräger Group 12M M 2017 Change Change net of FX and restructuring million million % % R&D % of Net Sales -8.7% -9.1% Sales & Marketing % of Net Sales -22.0% -22.0% Administration % of Net Sales -8.2% -7.7% SG&A % of Net Sales -30.2% -29.7% Functional Expenses total % of Net Sales -39.6% -38.6% Headcount 1 13,263 13, Values as of reporting date 16
17 Key Figures Dräger Group 12M M 2017 million million Change % Cashflow from operating activities in % of EBIT 143% 92% Investments Cash and cash equivalents Net financial debt >-100 Net financial debt 1 /EBITDA Capital employed 1 1, , ROCE (EBIT 2 /Capital employed 1 ) 11.0% 12.5% Net Working Capital Equity ratio pp EPS per common shares (on full distribution) EPS per preferred shares (on full distribution) Values as of reporting date 2 EBITDA and accordingly EBIT of the last twelve months 17


18 18 Update Fit For Growth
19 FIT FOR GROWTH Targets achieved Improve SG & A expense ratio SG&A 2017 ~30% SHAPE 1 Optimize global Sales, Marketing & Administration set-up Bring customer value faster to the market and increase innovationshare FIT FOR GROWTH 2FIT! Optimize innovation set-up T2M -50% by Optimize production set-up Global footprint Improve workflow and delivery times and reduce production cost Annual savings ~ 9m 19
20 FIT FOR GROWTH - SHAPE Results of the initiatives SHAPE Improve SG&A expense ratio Optimize global Sales, Marketing & Administration set-up New governance model implemented in Q1/ cost containment measures achieve cost savings of >EUR 100m vs. original budget Reduction of SGA ratio to <30% in 2017 Initiatives continuing in the line organization Continuous cost control in administrative areas Continue optimization of global purchasing to reduce COGS Pricing excellence project to increase price enforcement and grow margin contribution Continue to harmonize ERP landscape and standardize back-office & logistic processes 20
21 FIT FOR GROWTH GLOBAL FOOTPRINT Results of the initiatives Global Footprint Improve workflow and delivery times and reduce production cost Optimize production and logistic set-up New Zukunftsfabrik in Lübeck. Savings ~ EUR 9m p.a. Transfer of production with high labor content to Czech Republic. Site consolidation: Closure of Pittsburgh site, Closure of Brazil production. Initiatives continuing in the line organization Further optimization of logistic structure through new hub for safety products in Frankfurt. Expansion of our Rental & Shutdown Service infrastructure in Krefeld. Global roll-out of market fulfillment concept Focus on Operational Excellence Initiatives 21
22 FIT FOR GROWTH FIT! Results of the initiatives FIT! Bring customer value faster to the market Optimize innovation set-up New Innovation organization implemented. Optimization of the innovation process (e.g. AGILE development, Innovation incubator Garage, rapid prototyping, ). Reduction of complexity (e.g. reduction of internal standards) Acceleration of up to 30% with new development projects Initiatives continuing in the line organization Continue to focus on Time to market achievement (target: reduction by 50% until 2019). Examples: More development by strategic development partners Actively scouting for technology partnerships Upgrade Product Lifecycle Management System 22


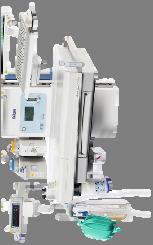


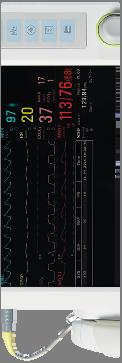


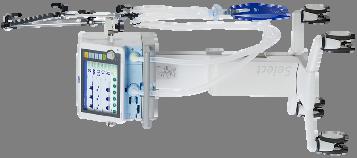


23 Faster. Connected. Innovative. Selection of new products 2017 SAFETY MEDICAL IACS VG6/VG7 Vista 120 S Oxylog VE300 Movita Lift Strong 23 Savina 300 Select Pulsar 7000 Secor 7000 Dräger X-am 8000 Dräger-Tubes App Dräger Alcotest 5000
24 Planned investments 2018/2019 will support future growth WE ARE INVESTING IN WE WILL ACHIEVE increasing sales resources & -capabilities EXAMPLES: Strengthening Safety sales channels FGDS System Centers Key Account Management Digital distribution channels Global roll out of Future Technician Workplace a strengthened sales force to support bringing the innovation road map to market. SG&A 2018/19 ~30% SG&A >2020 <30% accelerating R&D roadmap More R&D resources (focus on SWdevelopment) Partnership with external development partners Accelerate EM product portfolio major product releases in 2020, 2021 and Medical Innovation rate % Medical Innovation rate 2020 >28% and will lift EBIT margin above 6% again from

25 care givers have access to all relevant information anywhere, anytime to improve decision making. Our Vision an acute care environment where medical devices are safely accessible remotely for preventive checks to increase uptime stress factors such as nuisance alarms and noise are avoided for patients and care givers alike


 ~ 40")
 up to 40 min.")
 26 (2): Lawless, S.")


, (4): Cropp, A.")
26 Alarm management initiatives and Silent ICU Current Situation up to 350 alarms per patient / day (1) ~ % clinically irrelevant (2) 50 % are not noticed (3) ~ 40 different sounds in one ICU (4) up to 40 min. to alarm confirmation (5) 26 (2): Lawless, S., Crit Care Med 1994; Koski, E., Int J Clin Monit Comput 1990, Chambirn, M., Intensiv Care Med 1999 (3), (4): Cropp, A., et al. Chest 1994 (5): Reslan, ZA., University of Connecticut 2007

27 Alarm management Quiet and stress-reduced environments Secure alarm distribution allowing for confirmed alarm on mobile or stationary devices outside the patient room Smart alarms Soft thresholds reduce the number of false alarms significantly to reduce alarm fatigue Alarm history views providing patient specific or departmental overviews for alarm consultation 27

28 OUTLOOK Fiscal Year
29 Dividend proposal for FY (in EUR million) 2017 (in EUR million) Net profit * Dividend ,4 Participation certificates ** Common shares 1.3 4,1 Preferred shares Net payout ratio 5.3% 11.6% Dividend per common share preferred share Dividend policy In future fiscal years, Dräger plans to distribute at least 10% of group net profit (less earnings attributable to non-controlling interests) to the company s shareholders and participation certificate holders. * after earnings attributable to non-controlling interests ** Without minimum dividend, after taxes 29
30 Outlook Net Sales (net of currency effects) 2017 guidance e 0.0 % 3.0 % 3.3 % 2.0 % 5.0 % EBIT margin 5.0 % 7.0 % 6.1 % 4.0 % 6.0 %* Gross profit margin % 44.8 % % Dräger Value Added EUR 40m 90m EUR 70.7m EUR 15m 65m Assumptions for FY 2018 Guidance Downside risk of strong market interruptions, e.g. caused by rising political protectionism, not reflected in guidance. Continuously strong top-line development in AAA Region. Continued growth in North America. Return to growth in Central- / South America. After a strong 2017, growth in the Europe Region expected to be more towards the lower end of the guidance range. Positive growth in both product areas, with a stronger top-line growth for safety offerings. Higher functional expenses due to investments to support future growth. Increase of R&D budget to EUR million. SG&A ratio stable. * based on exchange rates at the start of the year


31 Corporate Social Responsibility at Dräger We protect people OHSAS certified: >80% of Dräger employees We act ethical Compliance System with mandatory trainings We create value Quality Management System ISO 9001 and ISO We respect our environment ~100 Supplier Audits per annum 31


32 32 Questions & Answers
33 Guidance 2018 Net sales e 3.3% % (net of currency effects) (net of currency effects) EBIT margin 6.1% % Dräger Value Added EUR 70.7 million EUR million Other forecast figures: Gross margin 44.8 % % Research and development costs EUR million EUR million Interest result EUR million Slight improvement Days wokring capital (DWC) days on prior year's level Investment volume EUR million EUR million Net financial debt EUR million Slight improvement 1 Based on exchange rates at the start of the year excluding company acquisitions 33
34 Business Development Segments SEGMENT EUROPE Order Entry 1 million 1, , , , ,447.8 Net Sales 1 million 1, , , , ,415.5 EBIT million EBIT margin % SEGMENT AMERICA Order Entry 1 million Net Sales 1 million EBIT million EBIT margin % SEGMENT AFRICA, ASIA, AUSTRALIA Order Entry 1 million Net Sales 1 million EBIT million EBIT margin % years were adjusted pro-forma due to the change in segment reporting. 34 For further analysis, this data (including quarterly figures) can be downloaded as an Excel file from the Dräger website
35 Business development Segments Europe Americas Africa, Asia, Australia Dräger Group Q Q Q Q Q Q Q Q million million million million million million million million Order entry Net Sales EBITDA EBIT EBIT-margin Capital Employed , ,243.6 ROCE 1, DVA Values at due date 2 EBIT of the last twelve months 35
36 Business Development medical and safety products Medical Order Entry million 1, , , , ,683.7 Net Sales million 1, , , , ,668.0 EBIT million EBIT margin % Safety Order Entry million Net Sales million EBIT million EBIT margin % For further analysis, this data (including quarterly figures) can be downloaded as an Excel file from the Dräger website 36
37 Business development Medical products Q Q Change Change 12M M 2017 Change Change million million % % (FX adj.) million million % % (FX adj.) Order entry , , Europe America Africa, Asia, Australia Net Sales , , Europe America Africa, Asia, Australia EBIT EBIT-margin
38 Business development Safety products Q Q Change Change 12M M 2017 Change Change million million % % (FX adj.) million million % % (FX adj.) Order entry Europe America Africa, Asia, Australia Net Sales Europe America Africa, Asia, Australia EBIT EBIT-margin
39 Functional expenses Change net of FX and restructuring million million million million million % R&D % of Net Sales SG&A -8.5% % % % % % of Net Sales -31.1% -30.8% -33.0% -30.2% -29.7% Other operating income Functional Expenses total , % of Net Sales -39.7% -39.7% -42.1% -39.6% -38.6% Headcount 1 1 Values as of reporting date 13,334 13,737 13,936 13,263 13,739 39
40 Cash-flow statement Group net profit Change in inventories Change in receivables Change in payables Depreciation and amortization Other operating cash flow items Operating cash flow Investing cash flow Free cash flow Financing cash flow Change in cash Cash and cash equivalents Change in cash and cash equivalents, i.e. without any effect of exchange rates 2 Values as of reporting date million million million million 2017 million 40
41 Consolidated balance sheet 31 Dec Dec 2017 Change million million % Intangible Assets Property, plant and equipment Other noncurrent assets Noncurrent assets Inventories Trade receivables Other current assets Cash and cash equivalents Current assets 1, , Total assets 2, ,
42 Consolidated balance sheet 31 Dec Dec 2017 Change million million % Equity 1, , Liabilities from participation certificates Provisions for pensions and similar oblig Noncurrent interest bearing loans Other noncurrent liabilities Noncurrent liabilities Current Provisions Current loans and liabilities to banks Trade payables Other current liabilities Current liabilities Total equity and liabilities 2, ,
43 Earnings per share Net profit (less the share of earnings attributable to non controlling interests) '000 33,575 81,391 98,530 Scenario: 100% pay out ratio 100% 100% 100% = tax benefit from pay out to PCs* '000 3,188 7,888 9,493 Earnings attrib. to shares and PCs (incl. tax benefit) '000 36,763 89, , % Earnings attributable to PCs** '000 11,719 28,425 34,420 32% Earnings attributable to shares '000 25,044 60,855 73,603 68% EPS (common share) EPS (preferred share) Scenario: actual/proposed pay out ratio 12.9% 5.3% 11.6% tax benefit from pay out to PCs* ' Earnings attrib. to shares and PCs (incl. tax benefit) '000 33,915 81,732 99, % Earnings attributable to PCs** '000 1,249 1,236 3,482 3% Earnings attributable to shares '000 32,665 80,496 96,008 97% EPS (common share)*** EPS (preferred share)*** * tax benefit arises from the tax deductible pay out to the PCs; please refer to Annual Report 2017, note 19 ** without minimum dividend (as interest, the minimum dividend is already included in net earnings) ** the EPS is not calculated in accordance with IAS 33 PCs = participation certificates (Genussscheine) 43
44 Innovation rate Share on new products and upgrades medical 1 45% 40% Net sales Upgrades New products 35% 30% 25% 20% 15% 10% 33% 23% 34% 28% 32% 22% 27% 20% 20% 18% 26% 22% 5% 0% 10% % % % % % Launched in the last 3 years; products are regarded as new, if they enable Dräger to either enter a new market segment or if products are regarded as completely new according to Dräger s customers and Dräger s sales force. Upgrades are those products, which serve existing Dräger markets, but their functionality is perceived as significantly enhanced by Dräger s customers and Dräger s sales force. 44
45 Financial calendar 2018 March 8, Analysts meeting April 26, Report for the first three months 2018 Conference call May 4, Annual shareholders' meeting, Lübeck, Germany July 26, Report for the first six months 2018 Conference call October 30, Report for the first nine months 2018 Conference call 45

46 Contact Melanie Kamann Corporate Communications Thomas Fischler Investor Relations Drägerwerk AG & Co. KGaA Drägerwerk AG & Co. KGaA Moislinger Allee Moislinger Allee Lübeck, Germany Lübeck, Germany Tel Tel Fax Fax Mobile Mobile
Analyst Conference Drägerwerk AG & Co. KGaA. March 7 th 2019
 Analyst Conference Drägerwerk AG & Co. KGaA March 7 th 2019 Disclaimer This presentation does not constitute an offer of securities for sale or a solicitation of an offer to purchase any securities. No
Conference call Interim report January 1 to March 31, Lübeck, April 26, 2018
 Conference call Interim report January 1 to March 31, 2018 Lübeck, April 26, 2018 Disclaimer This presentation does not constitute an offer of securities for sale or a solicitation of an offer to purchase
Conference call Interim report January 1 to March 31, Lübeck, April 26, 2016
 Conference call Interim report January 1 to March 31, 2016 Lübeck, April 26, 2016 Disclaimer This presentation does not constitute an offer of securities for sale or a solicitation of an offer to purchase
Conference call Interim report January 1 to September 30, 2018
 ICH WERDE DA SEIN. Conference call Interim report January 1 to September 30, 2018 Lübeck, October 30, 2018 Disclaimer This presentation does not constitute an offer of securities for sale or a solicitation
Worldwide. On Site. Conference call Interim report January 1 to June 30, Lübeck, July 27, 2017
 Worldwide. On Site. Conference call Interim report January 1 to June 30, 2017 Lübeck, July 27, 2017 Disclaimer This presentation does not constitute an offer of securities for sale or a solicitation of
Drägerwerk AG & Co. KGaA Capital Markets Presentation. July, 2018
 Drägerwerk AG & Co. KGaA Capital Markets Presentation July, 2018 Disclaimer This presentation does not constitute an offer of securities for sale or a solicitation of an offer to purchase any securities.
Worldwide. On Site. Drägerwerk AG & Co. KGaA Capital Markets Presentation. January, 2018
 Worldwide. On Site. Drägerwerk AG & Co. KGaA Capital Markets Presentation January, 2018 Disclaimer This presentation does not constitute an offer of securities for sale or a solicitation of an offer to
Drägerwerk AG & Co. KGaA Capital Markets Presentation. October, 2018
 Drägerwerk AG & Co. KGaA Capital Markets Presentation October, 2018 Disclaimer This presentation does not constitute an offer of securities for sale or a solicitation of an offer to purchase any securities.
Drägerwerk AG & Co. KGaA Capital Markets Presentation. March, 2015
 Drägerwerk AG & Co. KGaA Capital Markets Presentation March, 2015 Disclaimer This presentation does not constitute an offer of securities for sale or a solicitation of an offer to purchase any securities.
Worldwide. On Site. Drägerwerk AG & Co. KGaA Capital Markets Presentation. May, 2017
 Worldwide. On Site. Drägerwerk AG & Co. KGaA Capital Markets Presentation May, 2017 Disclaimer This presentation does not constitute an offer of securities for sale or a solicitation of an offer to purchase
Drägerwerk AG & Co. KGaA Capital Markets Presentation. March, 2016
 Drägerwerk AG & Co. KGaA Capital Markets Presentation March, 2016 Disclaimer This presentation does not constitute an offer of securities for sale or a solicitation of an offer to purchase any securities.
Conference call Interim report January 1 to March 31, Lübeck, May 2, 2013
 Conference call Interim report January to March 3, 203 Lübeck, May 2, 203 Disclaimer This presentation does not constitute an offer of securities for sale or a solicitation of an offer to purchase any
Drägerwerk AG & Co. KGaA Analysts Meeting. Frankfurt, March 14, 2012
 Drägerwerk AG & Co. KGaA Analysts Meeting Frankfurt, March 4, 202 Disclaimer This presentation does not constitute an offer of securities for sale or a solicitation of an offer to purchase any securities.
Quarterly Statement January 1 to March 31, 2017 Dräger Group
 Quarterly Statement January 1 to March 31, 2017 Dräger Group THE DRÄGER GROUP OVER THE PAST FIVE YEARS 2013 2014 2015 2016 2017 Order intake million 571.3 544.6 615.3 599.6 639.4 Net sales million 533.8
Quarterly Statement January 1 to September 30, 2017 Dräger Group
 Quarterly Statement January 1 to September 30, 2017 Dräger Group THE DRÄGER GROUP OVER THE PAST FIVE YEARS 2013 2014 2015 2016 2017 Order intake million 1,756.7 1,743.4 1,895.1 1,849.1 1,928.3 Net sales
Quarterly Statement January 1 to March 31, 2018 Dräger Group
 Quarterly Statement January 1 to March 31, 2018 Dräger Group THE DRÄGER GROUP OVER THE PAST FIVE YEARS 2014 2015 2016 2017 2018 Order intake million 544.6 615.3 599.6 639.4 621.4 Net sales million 513.2
Quarterly Statement January 1 to March 31, 2016 Dräger Group
 Quarterly Statement January 1 to March 31, 2016 Dräger Group THE DRÄGER GROUP over the past five years 2012 2013 2014 2015 2016 Order intake million 550.9 571.3 544.6 615.3 599.6 Net sales million 529.3
Q1/2005 report Dräger Group
 Q1/2005 report Dräger Group D 3 Contents 4 Preliminary remarks 4 Preparation of the interim financial statements 5 Business performance Q1/2005 5 Dräger Group 8 Business performance of the segments 8
H1/2005 report Dräger Group
 H1/2005 report Dräger Group D 3 Contents 4 Preliminary remarks 4 Preparation of the interim financial statements 5 Business performance H1/2005 5 Dräger Group 8 Business performance of the segments 8
Nine months 2011: Dräger increases order intake and earnings
 Page 1 / 5 Nine months 2011: Dräger increases order intake and earnings - Order intake grows by 7.8 percent - EBIT margin reaches 9.0 percent - Equity ratio continues to rises to 34.7 percent - Sales reorganization
Interim Results 9-month figures FY 14
 HEIDELBERGER DRUCKMASCHINEN AG, FEBRUARY 5, 214 Interim Results 9-month figures 14 Gerold Linzbach, CEO Dirk Kaliebe, CFO Robin Karpp, Head of IR Interim Results 9-month figures 14 February 5th, 214 Improved
Financial Information
 Financial Information H1 revenues reached 12.8bn up 9.8%, flat org. in Q2 Adj. EBITA reached 1.6bn, up 6.4%, Adj. EBITA margin flat excl. Invensys in a challenging environment 2015 targets: Around flat
Zumtobel Group AG FY 2014/15 results
 Zumtobel Group AG FY 2014/15 results June 24, 2015 1 24 June 2015 Annual Results 2014/15 Improvement in revenues and earnings, restructuring measures on track Financials FY 2014/15 at a glance Group revenues
Interim Report Q4 FY 17
 Interim Report Q4 FY 17 Quarter 4 / Fiscal Year 2017 Sustained positive development Sivantos delivered 3.1% organic growth 1) in Q4 FY2017. The moderate growth rate compared to previous quarters was a
Full-Year 2017/18 Results Stäfa, May 22, 2018 Arnd Kaldowski, CEO Hartwig Grevener, CFO Thomas Bernhardsgrütter, IR
 Full-Year 2017/18 Results Stäfa, Arnd Kaldowski, CEO Hartwig Grevener, CFO Thomas Bernhardsgrütter, IR Disclaimer This presentation contains forward-looking statements, which offer no guarantee with regard
Hill-Rom Fourth Quarter 2016 Financial Results. November 3, 2016
 Hill-Rom Fourth Quarter 2016 Financial Results November 3, 2016 Forward Looking Statements Certain statements in this presentation contain forward-looking statements, within the meaning of the Private
Philips Lighting reports 0.5% full year comparable sales growth, 10% operational profitability and EUR 403 million free cash flow
 Philips Lighting reports 0.5% full year comparable sales growth, 10% operational profitability and EUR 403 million free cash flow Q4 & Full Year 2017 presentation February 2, 2018 Important information
Wacker Neuson Group Quarterly report Q3/2018. November 8, 2018, unaudited
 Wacker Neuson Group Quarterly report Q3/2018 November 8, 2018, unaudited Foreword Dear Ladies and Gentlemen, In the third quarter of 2018, the Wacker Neuson Group continued to build on its success from
Quarterly Report January 1 to September 30, 2012 Dräger Group
 Quarterly Report January 1 to September 30, Dräger Group THE DRÄGER GROUP OVER THE PAST FIVE YEARS Nine months 2008 Nine months 2009 Nine months 2010 Nine months Nine months Change on in % Order intake
Half-yearly financial report January 1 to June 30, 2012 Dräger Group
 Half-yearly financial report January 1 to June 30, Dräger Group THE DRÄGER GROUP OVER THE PAST FIVE YEARS Six months 2008 Six months 2009 Six months 2010 Six months Six months Change on in % Order intake
Conference Call Results Q November 5, 2014
 Conference Call Results Q3 2014 November 5, 2014 Q3 2014: Key developments Despite a more difficult environment, ongoing start-up losses in battery technology, and a slump in Brazilian market, EK delivered
Eng US. 14 July 2017
 Eng US 14 July 2017 Presentation 2017 Eng US Disclaimer This presentation has been prepared by Duni AB (the Company ) solely for use at this investor presentation and is furnished to you solely for your
INTERIM REPORT FOURTH QUARTER SANDVIK: Interim Report on the third quarter 2015
 INTERIM REPORT FOURTH QUARTER 2016 1 SANDVIK: Interim Report on the third quarter 2015 SUMMARY STABILIZING MARKETS STRONG ORDER INTAKE +8% SUPPORTED BY ALL BUSINESS AREAS EARNINGS GROWTH AND MARGIN IMPROVEMENT
ZEBRA TECHNOLOGIES FIRST QUARTER 2016 RESULTS May 10, 2016
 ZEBRA TECHNOLOGIES FIRST QUARTER 2016 RESULTS May 10, 2016 Anders Gustafsson Chief Executive Officer Mike Smiley Chief Financial Officer 2 Safe Harbor Statement Statements made in this presentation which
HELLA Investor Update H1 FY 2016/17
 HELLA Investor Update 2016/17 Conference Call on January 12th, 2017 Dr. Rolf Breidenbach, CEO Bernard Schäferbarthold, CFO HF-7761DE_C (2012-12) Disclaimer This document was prepared with reasonable care.
Interim report 3,
 Richard Laube, CEO Oliver Walker, CFO Zurich 8 November 2012 Disclaimer This presentation contains forward-looking statements based on beliefs of Nobel Biocare's management. When used in this presentation,
Zumtobel Group AG H1 2018/19. 4 December 2018
 Zumtobel Group AG H1 2018/19 4 December 2018 Improvement of profitability despite challenging market environment Financials H1 2018/19 at a glance Group revenues 4.7% below prior year, UK (minus 15%) and
July 26, 2017 LafargeHolcim Ltd 2015
 Second Quarter 2017 Results Beat Hess, Chairman and Interim CEO Roland Köhler, Interim COO and Regional Head of Europe, Australia/NZ & Trading Ron Wirahadiraksa, CFO July 26, 2017 LafargeHolcim Ltd 2015
Half-yearly financial report January 1 to June 30, 2017 Dräger Group
 Half-yearly financial report January 1 to June 30, 2017 Dräger Group THE DRÄGER GROUP OVER THE PAST FIVE YEARS Six months 2013 Six months 2014 Six months 2015 Six months 2016 Six months 2017 Order intake
Quarterly Report January 1 to March 31, 2011 Dräger Group
 Quarterly Report January 1 to March 31, 2011 Dräger Group THE DRÄGER GROUP over the past five years 2007 2008 2009 2010 2011 Change on 2010 in % Order intake million 444.9 493.8 448.6 488.2 553.6 +13.4
Zumtobel Group AG H1 2016/ December 2016
 Zumtobel Group AG H1 2016/2017 6 December 2016 Nr. 2 Substantial increase in profitability despite lower revenues Financials H1 FY 2016/17 at a glance Fx-adjusted decline of 1.5% in Group revenues with
Interim Results 6-month figures FY 13
 Interim Results 6-month figures FY 13 Gerold Linzbach, CEO Dirk Kaliebe, CFO Robin Karpp, Head of IR HEIDELBERG, NOVEMBER 7TH, 2012 Review FY 2012/2013 Order intake of 668m in on par with previous year
Financial Information
 Accelerating & profit in H1: Revenue up +4% reported, Adj. EBITA +8%, Net Income +18%, FCF +15% H1 revenue of 12.2bn, +2.7% organic, +4.1% outside Infrastructure H1 adj. EBITA margin up 60bps 1 org., to
KION Q3 UPDATE CALL Gordon Riske, CEO Thomas Toepfer, CFO Wiesbaden, 14 November 2013
 KION Q3 UPDATE CALL 2013 Gordon Riske, CEO Thomas Toepfer, CFO Wiesbaden, 14 November 2013 AGENDA 1 Highlights 2013 Gordon Riske 2 Financial Update Thomas Toepfer 3 Outlook Gordon Riske 14 November 2013
Siemens Gamesa Renewable Energy Q3 18 Results
 Siemens Gamesa Renewable Energy Q3 18 Results 27 July 2018 Disclaimer This material has been prepared by Siemens Gamesa Renewable Energy, and is disclosed solely for information purposes. This document
INTERIM PRESENTATION Q October 2018
 INTERIM PRESENTATION 25 October JUAN VARGUES, PRESIDENT & CEO HIGHLIGTHS Organic growth Good organic growth in EMEA Flat organic growth in Americas despite -7% RV OEM APAC down due to softer market in
Investor presentation
 Investor presentation Important information Forward-Looking Statements and Risks & Uncertainties This document and the related oral presentation contain, and responses to questions following the presentation
Philips Lighting reports comparable sales growth of 1.3% and continued improvement in operational profitability
 Philips Lighting reports comparable sales growth of 1.3% and continued improvement in operational profitability Q3 2017 results Analyst & Investor presentation October 19, 2017 Important information Forward-Looking
Steady top line growth in a mixed market
 Steady top line growth in a mixed market Orders and revenues increased 1, orders steady to higher in all regions Operational EBITDA 2 and margin lower vs Q2 2011, margin up 1% point vs Q1 2012 Thomas &
Q Results. Lars Brorsen (CEO) Christoph Hobo (CFO) November 22, 2018
 Christoph Hobo (CFO) November 22, 2018") Q3 2018 Results Lars Brorsen (CEO) Christoph Hobo (CFO) November 22, 2018 Agenda 1. Highlights Q3 2018 2. Market outlook 3. Detailed results review 4. Company outlook 5. Q&A Appendix 1 Business summary
Q3 2018 Results Lars Brorsen (CEO) Christoph Hobo (CFO) November 22, 2018 Agenda 1. Highlights Q3 2018 2. Market outlook 3. Detailed results review 4. Company outlook 5. Q&A Appendix 1 Business summary
Zumtobel Group AG Q1 2017/ September 2017
 Zumtobel Group AG Q1 2017/18 05 September 2017 Despite stalling growth momentum Group adj. EBIT only slightly below prior year Financials Q1 FY 2017/18 at a glance Group revenues fx-adjusted 0.7% below
Full year and Q results March 15, 2017
 Full year and Q4 2016 results March 15, 2017 Disclaimer This document and its related communication ( Presentation ) have been issued by windeln.de SE and its subsidiaries ( Company ) and do not constitute
Henkel FY Kasper Rorsted Carsten Knobel. Düsseldorf March 4, 2015
 Henkel FY 2014 Kasper Rorsted Carsten Knobel Düsseldorf March 4, 2015 Disclaimer This information contains forward-looking statements which are based on current estimates and assumptions made by the corporate
Henkel Shaping Henkel towards 2020 and beyond. Hans Van Bylen, Carsten Knobel German Investment Seminar 2017 January 2017
 Henkel 2020 + Shaping Henkel towards 2020 and beyond Hans Van Bylen, Carsten Knobel German Investment Seminar 2017 January 2017 Disclaimer This information contains forward-looking statements which are
HELLA Investor Update FY 2016/17
 HELLA Investor Update FY 2016/17 Conference Call on August 10th, 2017 Dr. Rolf Breidenbach, CEO Bernard Schäferbarthold, CFO HF-7761DE_C (2012-12) Disclaimer This document was prepared with reasonable
Q1 FY14 Management Presentation
 www.osram-licht.ag FY14 Management Presentation (preliminary figures) Solid start into FY14 OSRAM Licht AG January 29, 2014 Safe Harbor Statement This presentation may contain forward-looking statements
Henkel Our strategic priorities for the future. Hans Van Bylen / Carsten Knobel Press Conference, November 17, 2016
 Henkel 2020 + Our strategic priorities for the future Hans Van Bylen / Carsten Knobel Press Conference, November 17, 2016 Disclaimer This information contains forward-looking statements which are based
REXEL. Q3 & 9-month 2009 results. November 12, 2009
 REXEL Q3 & 9-month 2009 results November 12, 2009 Q3 2009 & 9-month results Q3 and 9-month 2009 at a glance Financial review Outlook 3 Q3 & 9-month 2009 at a glance Q3 & 9-month 2009 highlights: Quarter-on-quarter
EDITED TRANSCRIPT. Q Draegerwerk AG & Co KGaA Earnings Call EVENT DATE/TIME: OCTOBER 30, 2018 / 2:00PM GMT THOMSON REUTERS
 THOMSON REUTERS EDITED TRANSCRIPT Q3 2018 Draegerwerk AG & Co KGaA Earnings Call EVENT DATE/TIME: OCTOBER 30, 2018 / 2:00PM GMT 1 CORPORATE PARTICIPANTS CONFERENCE CALL PARTICIPANTS Aliaksandr Halitsa
Interim Results 9-month figures FY 11
 Interim Results 9-month figures FY 11 Bernhard Schreier, CEO Dirk Kaliebe, CFO Robin Karpp, Head of Investor Relations Heidelberger Druckmaschinen AG February 09, 2011 Highlights FY 11 Order intake increased
Full-Year / Fourth Quarter 2010 Results
 Full-Year / Fourth Quarter 2010 Results 16 February 2011 Disclaimer This presentation contains certain statements that are neither reported financial results nor other historical information. This presentation
Sivantos Investor Presentation
 Sivantos Investor Presentation Dr. Roger Radke, CEO Jens Due Olsen, CFO 6 June 2016 Sivantos 2015 All rights reserved/restricted. Disclaimer This document contains statements related to our future business
KONE s interim report for January June 2016 JULY 19, 2016 HENRIK EHRNROOTH, PRESIDENT & CEO
 KONE s interim report for January June 2016 JULY 19, 2016 HENRIK EHRNROOTH, PRESIDENT & CEO Figures Key figures for for January June 2016 Q2 2016 Key figures STRONG EXECUTION AND PROFITABLE SALES GROWTH
Important notice. Consolidated Financial Results for FY2014 and Guidance for FY2015. François-Xavier Roger Chief Financial Officer
 Consolidated Financial Results for FY2014 and Guidance for FY2015 François-Xavier Roger Chief Financial Officer May 15, 2015 Important notice Forward-Looking Statements This presentation contains forward-looking
Investor Conference Call
 Investor Conference Call FY/Q4 2015 Results February 25, 2016 / Marijn Dekkers, CEO Page 1 Q4/FY 2015 Investor Conference Call Marijn Dekkers Disclaimer This presentation may contain forward-looking statements
Interim Results 6-month figures FY 11
 Interim Results 6-month figures FY 11 Bernhard Schreier, CEO Dirk Kaliebe, CFO Andreas Trösch, Head of Investor Relations Heidelberger Druckmaschinen AG November 10, 2010 Highlights Q2 FY 11 650 million
Half-year 2012 Results. August 1, 2012
 Half-year 2012 Results August 1, 2012 Disclaimer All forward-looking statements are Schneider Electric management s present expectations of future events and are subject to a number of factors and uncertainties
Investor Update Media and Investor presentation, October 31, Dr. Norbert Klapper, Group CEO. Joris. Gröflin,.. Group. CFO...
 Investor Update 2018 Media and Investor presentation, October 31, 2018 Dr. Norbert Klapper, Group CEO. Joris. Gröflin,.. Group. CFO Agenda 1. Key Messages Dr. Norbert Klapper 2. Order Intake 2018 Joris
HELLA Investor Update H1 FY 2017/18
 HELLA Investor Update 2017/18 Conference Call on January 11, 2018 Dr. Rolf Breidenbach, CEO Bernard Schäferbarthold, CFO HF-7761DE_C (2012-12) Disclaimer This document was prepared with reasonable care.
Nemetschek Group. Financial Highlights Third Quarter / 9 Months Results 2018 October 30, 2018
 Nemetschek Group Financial Highlights Third Quarter / 9 Months Results 2018 October 30, 2018 Top key figures Q3 2018: Continued fast, double-digit growth and strong increase in earnings Revenues m Recurring
FINANCIAL ANALYST MEETING March 1st, 2018
 FINANCIAL ANALYST MEETING 2018 March 1st, 2018 DISCLAIMER Some of the statements made in this presentation contain forward-looking information that involve a number of risks and uncertainties. Such statements
Investor Presentation
 14 MAR 2016 Investor Presentation 4Q and FY 2015 Results Hussein Hachem, CEO Bashar Obeid, CFO Management Update 4Q 2015 Results FY 2015 Results Long-term Performance Outlook & Guidance Page 1 Disclaimer
Henkel Q Kasper Rorsted Carsten Knobel. London. 1 August 08, Q Henkel Analyst & Investor Call
 Henkel Q2 2013 London August 08, 2013 Kasper Rorsted Carsten Knobel 1 August 08, 2013 Disclaimer This information contains forward-looking statements which are based on current estimates and assumptions
Financial Year March 15, Leveraging the Group s Position
 Financial Year 2011 Media and Analysts Meeting March 15, 2012 2011 Leveraging the Group s Position Safe Harbour Statement The information made available in this conference may include forward-looking statements
Zumtobel Group. Q1 2012/13 results. September 5, September
 Zumtobel Group Q1 2012/13 results September 5, 2012 1 September 2012 1 Solid results in a challenging operating environment Financial Highlights 1 st quarter 2012/13 Lighting Segment (Zumtobel / Thorn)
H Financial Results. Milan July 28th, 2016
 H1 2016 Financial Results Milan July 28th, 2016 Agenda H1 2016 Highlights o o o Group overview Results by business Outlook Financial results Appendix H1 2016 Financial Results 2 H1 2016 Highlights Organic
HUGO BOSS First Nine Months Results 2011
 HUGO BOSS First Nine Months Results 2011 Mark Langer (CFO) November 2, 2011 Conference Call, First Nine Months Results 2011 HUGO BOSS November 2, 2011 2 / 30 AGENDA OPERATIONAL HIGHLIGHTS FIRST NINE MONTHS
Schaeffler Group at a glance
 Facts and figures 9M 2016 Schaeffler Group at a glance Key figures 1 st nine months Income statement (in millions) 2016 2015 Revenue 9,977 9,958 0.2 % at constant currency 2.7 % EBIT 1,276 1,251 2.0 %
February 29 th, FY 2015 Results Presentation
 February 29 th, 2016 FY 2015 Results Presentation 1 GROWTH Excellent results in Spain and Argentina Positive organic growth in Brazil Sales growth of 4.7% including FX rate LatAm organic growth above 12%
H1/2018 Results u-blox Holding AG
 H1/2018 Results August 24, 2018 Thomas Seiler, CEO Roland Jud, CFO Disclaimer This presentation contains certain forward-looking statements. Such forward-looking statements reflect the current views of
Earnings Release Q January 1 to March 31, 2011
 Outstanding Broad-Based Growth Customer wins drive orders growth Substantial gain on sale of Areva NP interest Peter Löscher, President and Chief Executive Officer of Siemens AG We ve achieved outstanding,
Henkel Q Hans Van Bylen, Carsten Knobel Düsseldorf, November 15, 2018
 Henkel Q3 2018 Hans Van Bylen, Carsten Knobel Düsseldorf, November 15, 2018 Disclaimer This information contains forward-looking statements which are based on current estimates and assumptions made by
Fresenius Medical Care achieves revised 2018 targets and accelerates investments for future growth
 0 Press Release Media Contact Matthias Link T +49 6172 609-2872 matthias.link@fresenius.com Contact for analysts and investors Dr. Dominik Heger T +49 6172 609-2601 dominik.heger@fmc-ag.com www.freseniusmedicalcare.com
Interim Report Q2 FY 18
 Interim Report Q2 FY 18 Quarter 2 / Fiscal Year 2018 Strong revenue growth driven by Signia Nx Sivantos delivered a strong organic growth 1) of 9.8% in Q2 2018 while nominal growth at 3.6% accounted negative
HELLA Investor Update 9M FY 2017/18
 HELLA Investor Update 2017/18 Conference Call on March 22, 2018 Dr. Rolf Breidenbach, CEO Bernard Schäferbarthold, CFO HF-7761DE_C (2012-12) Disclaimer This document was prepared with reasonable care.
Henkel FY Kasper Rorsted Carsten Knobel. Düsseldorf, February 25th, 2016
 Henkel FY 2015 Kasper Rorsted Carsten Knobel Düsseldorf, February 25th, 2016 Disclaimer This information contains forward-looking statements which are based on current estimates and assumptions made by
SMART STEEL. Q Results. Detlef Borghardt, CEO Dr. Matthias Heiden, CFO. August 14, 2018
 SMART STEEL Q2 218 Results Detlef Borghardt, CEO Dr. Matthias Heiden, CFO August 14, 218 Agenda Business Summary Guidance adjustment FY 218 Market update Regional trends: Status and profitability trend
HELLA Investor Update FY 2017/18
 HELLA Investor Update FY 2017/18 Conference Call on August 10, 2018 Dr. Rolf Breidenbach, CEO Bernard Schäferbarthold, CFO HF-7761DE_C (2012-12) Disclaimer This document was prepared with reasonable care.
ANSELL LIMITED Half Year Results to December Magnus Nicolin Chief Executive Officer Neil Salmon Chief Financial Officer
 ANSELL LIMITED Half Year Results to December 2014 Magnus Nicolin Chief Executive Officer Neil Salmon Chief Financial Officer Disclaimer The following presentation has been prepared by Ansell Limited for
Siemens Gamesa Renewable Energy Q Results
 Siemens Gamesa Renewable Energy Q2 208 Results 04 May 208 Disclaimer This material has been prepared by Siemens Gamesa Renewable Energy, and is disclosed solely for information purposes. This document
CONTENT FINANCIAL HIGHLIGHTS BUSINESS OVERVIEW Highlights
 FINANCIAL HIGHLIGHTS BUSINESS OVERVIEW CONTENT FINANCIAL HIGHLIGHTS 2013 Highlights Revenue Analysis Operating Income Analysis Cash Flows Currency Analysis Second half 2013 BUSINESS OVERVIEW 2 FINANCIAL
Zumtobel Group AG Q1 2018/19 & Strategic Outlook. September 2018
 Zumtobel Group AG Q1 2018/19 & Strategic Outlook September 2018 AGENDA Q1 2018/19 financial results Corporate Strategy Outlook ) Q1 2018/19 results & strategic outlook 04.09.2018 2 Stabilisation measures
HELLA Investor Update H1 FY 2018/19
 HELLA Investor Update 2018/19 Conference Call on January 11, 2019 Dr. Rolf Breidenbach, CEO Bernard Schäferbarthold, CFO HF-7761DE_C (2012-12) Disclaimer This document was prepared with reasonable care.
ZEBRA TECHNOLOGIES. William Blair Growth Stock Conference June 16, 2016
 ZEBRA TECHNOLOGIES William Blair Growth Stock Conference June 16, 2016 Safe Harbor Statement Statements made in this presentation which are not statements of historical fact are forward-looking statements
Q Results. Strong start in May 3, 2016
 Q1 2016 Results Strong start in 2016 May 3, 2016 Legal Disclaimer Information in this presentation may involve guidance, expectations, beliefs, plans, intentions or strategies regarding the future. These
April-September 2017 Results: short term impacts, long term actions. November 6, 2017
 April-September 2017 Results: short term impacts, long term actions November 6, 2017 Disclaimer This material has been prepared by Siemens Gamesa Renewable Energy, and is disclosed solely for information
In 2015, we moved to a new organizational model:
 9M 2016 Results In 2015, we moved to a new organizational model: One Group, Three Businesses Leading the industry development Accelerate growth Increase specialization and efficiency Transforming the sector
Interim Report Q1 FY 18
 Interim Report Q1 FY 18 Quarter 1 / Fiscal Year 2018 Continued positive development extends into the new fiscal year Sivantos delivered 3.5% organic growth 1) in Q1 2018 with negative Fx translation effects
ElringKlinger Group. Mobilität erfahren Zukunft entwickeln. Experience mobility Drive the future. Conference Call Results Third Quarter 2009
 ElringKlinger Group Mobilität erfahren Zukunft entwickeln. Experience mobility Drive the future. Conference Call Results Third Quarter 2009 1 Q3 2009: News and Business Trends! Unprecedented weakness in
Financial results & business update. Quarter and year ended 31 December February 2016
 Financial results & business update Quarter and year ended 31 December 2015 11 February 2016 Disclaimer 3 Any remarks that we may make about future expectations, plans and prospects for the company constitute