Investor Teleconference Presentation Third Quarter Fastenal Company October 10, 2018
|
|
|
- Frank Woods
- 5 years ago
- Views:
Transcription


1 Investor Teleconference Presentation Third Quarter 2018 Fastenal Company October 10,
2 Safe Harbor Statement All statements made herein that are not historical facts (e.g., goals regarding Onsite and vending signings as well as expectations regarding FTE, leverage, cash flow, and capital expenditures) are forward-looking statements within the meaning of the Private Securities Litigation Reform Act of Such statements involve known and unknown risks, uncertainties, and other factors that may cause actual results to differ materially. More information regarding such risks can be found in the Form 10-K for Fastenal Company for the year ended December 31, 2017 filed with the Securities & Exchange Commission and our earnings release issued on October 10, Any numerical or other representations in this presentation do not represent guidance by management and should not be construed as such. The appendix to the following presentation includes a discussion of certain non-gaap financial measures. Information required by Regulation G with respect to such non-gaap financial measures can be found in the appendix. 2
3 CEO Messages on 3Q18 18% 16% 14% 12% 10% 8% 6% 4% 2% 0% $0.90 $0.80 $0.70 $0.60 $0.50 $0.40 $0.30 $0.20 $0.10 $0.00 Daily Sales Rate (DSR) Growth 13.6% 14.8% 13.2% 13.1% 13.0% 10.6% 6.2% 1.9% 1.6% 1.8% 2.7% EPS (Fully-Diluted) $0.69 $0.50 Strong demand and internal execution of growth drivers drove 13.0% sales growth in 3Q18, consistent with the the first half of 2018 and the sixth straight quarter of sales growth greater than 10%. Excellent leverage of operating expenses generated a higher incremental margin and raised our operating margin 30 bps in 3Q18 to 20.5% year-over-year. EPS grew 38.3% in 3Q18, aided by tax reform. Absent this effect, EPS grew 15.0%, the fastest rate this cycle. Incremental pricing was realized in 3Q18, and largely offset incremental cost increases in the period. We have not recovered the 1H18 price/cost deficit and challenges remain from inflationary pressures and new tariffs on Chinese-sourced goods. Cash generation allowed us to reduce debt and pay a larger dividend in 3Q18. Conversion is being impacted by external pressures on working capital assets. 3
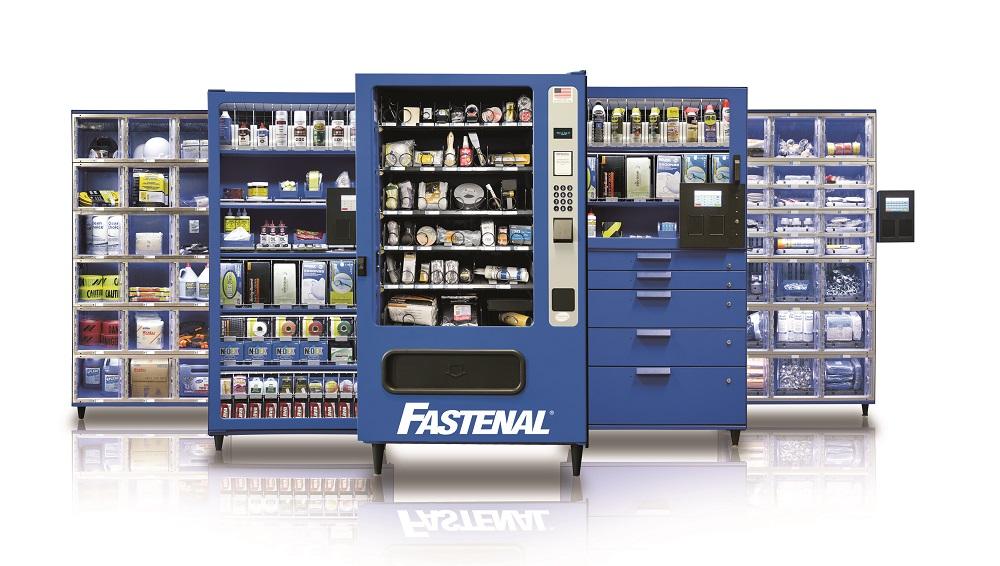
4 3Q18 Growth Driver Update Onsite Signings and Active Locations 0 Active Locations Signings Vending Device Signings and Installed Base 2 (in thousands) We signed 88 Onsites in 3Q18, +8.6% from 3Q17, and have 828 active sites, +49.2% from 3Q17. Sales growth, excl. transferred branch sales, was roughly 20%. We have signed 269 Onsites YTD, with our pace of signings near the low end of our 2018 goal of 360 to 385 Onsites. We signed 5,877 vending devices in 3Q18, +23.2% from 3Q17; our installed base is +14.0% annually. Product sales through our vending devices grew roughly 20%. We have signed 17,093 vending devices YTD, with our pace of signings in the upper half of our 2018 goal of 21,000 to 23,000 vending devices Total in-market 1 locations were 3,089 at the end of 3Q18, up from 2,973 at the end of 3Q17, with growth in Onsites outpacing a decline in public branches. National Accounts daily sales rose 18.0% in 3Q18 from 3Q17. Non-U.S. daily sales, which are about 15% of total sales, rose 20%-plus in 3Q18 despite forex headwinds. Installed Base Signings 1 In-market locations include public branches (U.S. and ROW) plus Onsites 2 Data excludes ~15K vending devices related to our leased locker program 4
5 20% 15% 10% 5% 0% -5% 3Q18 Business Cadence End Market Daily Sales Rate (DSR) Growth % 13.0% Heavy Equipment Total Mftring Construction 14.6% U.S. PMI averaged 59.7 in 3Q18, vs in 2Q18 and 58.6 in 3Q17. U.S. Industrial Production was +4.5% in July/Aug vs. 3Q17 and +0.7% vs. 2Q18. Manufacturing was +13.0% in 3Q18 and is exhibiting stable trends at high levels. Most sub-verticals are growing at healthy levels. Non-Residential Construction daily sales were +16.2% in 3Q18, a new cycle high. September's pace eased (+13.7%), but the outlook remains constructive. 20% 15% 10% 5% 0% -5% Product Category Daily Sales Rate (DSR) Growth 14.9% 10.8% Fasteners (34.7% of Sales) Non-Fasteners (65.3% of Sales) Fastener daily sales were +10.8% and non-fastener sales were +14.9% in 3Q18, with both categories exhibiting stable trends Non-National Account sales growth remained in the mid-to-high single digit range in 3Q18. Sales grew at 66.8% of our branches and at 79 of our Top 100 National Accounts in 3Q18. 1 In July 2017, we reclassified certain end market designations. Values shown in the chart at the top of this page will differ from prior presentations. 5
6 3Q18 Results Summary Annual Rates of Change 3Q18 3Q17 % Chg. Dollar amounts in millions, except per share amounts Net Sales $1,279.8 $1, % DSR Yr./Yr. % Chg. 13.0% Gross Profit $615.8 $ % Gross Profit Margin 48.1% 49.1% (100) bps Employee-Related Exp. 10.3% Occupancy-Related Exp. 2.3% Selling Transportation Exp. 10.7% Operating Income $262.3 $ % Operating Income Margin 20.5% 20.2% 30 bps EPS (Fully-Diluted) $0.69 $ % Onsite Signings % Vending Device Signings 5,877 4, % Branch Count 2,261 2,418 (6.5%) In-market location FTE 11,995 11, % Total FTE 18,314 17, % Operating Cash Flow $184.6 $ % % of Net Earnings 93.4% 113.6% Capital Expenditures (Net) $35.0 $ % Dividends $114.8 $ % Dividends Per Share $0.40 $ % Share Repurchases $25.9 Total Debt $390.0 $440.0 (11.4%) Tot. Debt/Capital 14.4% 17.8% (19.1%) Percentage calculations may not be able to be reproduced due to rounding of dollar values. We realized higher fastener and non-fastener pricing in 3Q18, and estimate overall price realized was bps in the period. We did not meaningfully recover the prior period's price/cost deficit and conditions remain broadly inflationary. Gross margin was 48.1% in 3Q18, down 100 bps from 49.1% in 3Q17. The most significant impactors of this decline were product/customer mix and branch freight costs. Beyond these, smaller items like currency and other organizational elements contributed. Our 3Q18 operating margin was 20.5%, +30 bps. Lower gross margin was more than offset by a 130 bps decline in SG&A to 27.6%, a record low for a third quarter. Incremental operating margins were 23.1%. Employee-related costs leveraged as incentive comp growth moderated. Occupancy costs leveraged, with higher vending charges mitigated by flat facility-related costs. We also leveraged general corporate costs. 6
7 Q18 Cash Flow Profile Operating Cash Flow (in millions) 113.6% * Percentages above the bar represent OCF as a % of Net Earnings Net Capital Expenditures and Depreciation (in millions) 2018 Net CapEx Target: ~$152.0M $ % $35.0 We generated 3Q18 operating cash flow of $184.6M, converting 93.4% of our net earnings. This is below our typical third quarter conversion rate owing to a higher than usual working capital build. Accounts receivable were +22.2% reflecting activity levels, our mix of growth, and customers pushing payments out at quarter end. Inventory was +14.1%. Days on hand declined, though the pace moderated owing to the expanding impact of product inflation. Net capital spending in 3Q18 was $35.0. Year-to-date, net capital spending was $88.8, +16.1%. We now anticipate 2018 capital spending of $152.0 (was $158.0) primarily reflecting the likely timing of certain distribution center spending. Our cash generation allowed for a higher dividend in 3Q18 as well as modest debt reduction. Total debt was 14.4% of total capital in 3Q18, below the levels at the end of 2Q18 (16.0%) and 3Q17 (17.8%). Depreciation Net Capital Expenditures 7
8 Appendix Non-GAAP Financial Measures The appendix includes information on our Return on Invested Capital ( ROIC ), which is a non-gaap financial measure. We define ROIC as net operating profit less income tax expense divided by average invested capital over the trailing 12 months. We believe ROIC is a useful financial measure for investors in evaluating the efficiency and effectiveness of our use of capital and believe ROIC is an important driver of shareholder return over the long-term. Our method of determining ROIC may differ from the methods of other companies, and therefore may not be comparable to those used by other companies. Management does not use ROIC for any purpose other than the reasons stated above. The tables that follow on page 9 include a reconciliation of the calculation of our return on total assets ( ROA ) (which is the most closely comparable GAAP financial measure) to the calculation of our ROIC for the periods presented. On December 22, 2017, new tax legislation commonly referred to as the Tax Cuts and Jobs Act (the 'Tax Act') was signed into law. The information presented on the appendix including the impact of the Tax Act noted on page 9 is a non-gaap financial measure. Management believes reporting this measure will help investors understand the effect of tax reform on comparable reported results. 8
9 Return on Invested Capital* Calculation of Return on Invested Capital TTM 3Q18 (Amounts in millions) TTM 3Q17 Operating Income $ (Income Tax Expense) (222.5) (312.1) Tax Act Adjustment 1 (11.0) NOPAT $ Total Current Assets $ 2, ,853.9 Cash and Cash Equivalents (131.6) (140.2) Accounts Payable (166.6) (132.4) Accrued Expenses (213.2) (193.9) Property & Equipment, Net Other Assets Invested Capital $ 2, ,349.6 ROIC 29.0% 27.7% 1 Reflects application of our expected post-tax Act tax rate to periods in 2017 and exclusion of one-time discrete items in 2018 for purposes of comparison. *Amounts may not foot due to rounding differences. Reconciliation of ROIC to Return on Assets (ROA) (Amounts in millions) TTM 3Q18 TTM 3Q17 Net Earnings $ Total Assets $ 3, ,816.0 ROA 24.1% 19.2% NOPAT $ Add: Income Tax Expense Subtract: Tax Act Adj (103.0) Operating Income Add: Interest Income Subtract: Interest Expense (11.5) (8.4) Subtract: Income Tax Expense (222.5) (312.1) Net Earnings $ Invested Capital $ 2, ,349.6 Add: Cash and Cash Equivalents Add: Accounts Payable Add: Accrued Expenses Total Assets $ 3, ,
10 Sequential Trends* DSR BENCHMARKS Cum. Chg., Cum. Chg., Cum. Chg., Cum. Chg., Jan.** Feb. Mar. Jan. to Mar. Apr. May June Jan. to Jun. July Aug. Sep. Jan. to Sep. Oct. Jan. to Oct. Nov. Dec. BENCHMARK (1.0%) 1.1% 3.9% 5.1% (0.6%) 2.1% 1.9% 8.7% (3.7%) 4.0% 1.7% 10.7% (1.9%) 8.6% (3.8%) (7.1%) 2018 DSR (1.3%) 4.0% 2.1% 6.2% 2.4% 0.6% 3.7% 13.5% (3.6%) 3.8% 3.6% 17.5% Delta v.. Benchmark (0.4%) 2.9% (1.9%) 1.0% 3.1% (1.5%) 1.9% 4.8% 0.0% (0.2%) 1.9% 6.8% 2017 DSR 0.2% 1.5% 3.6% 5.1% 2.2% 1.4% 2.8% 12.0% (2.4%) 2.2% 3.8% 16.0% (2.1%) 13.5% (4.2%) (7.1%) Delta v. Benchmark 1.2% 0.4% (0.4%) 0.0% 2.8% (0.7%) 1.0% 3.3% 1.3% (1.8%) 2.1% 5.3% (0.3%) 4.9% (0.4%) 0.0% 2016 DSR 0.4% (0.8%) 1.5% 0.7% 1.7% 0.6% (0.2%) 2.9% (2.3%) 2.4% 1.5% 4.5% (0.9%) 3.6% (5.5%) (6.6%) Delta v. Benchmark 1.3% (1.9%) (2.5%) (4.4%) 2.3% (1.5%) (2.0%) (5.8%) 1.4% (1.7%) (0.1%) (6.2%) 1.0% (5.1%) (1.7%) 0.5% 2015 DSR (3.6%) (0.1%) 4.2% 4.0% (2.1%) 3.4% 0.9% 6.3% (4.3%) 4.1% (0.9%) 5.0% (2.0%) 2.9% (3.0%) (8.4%) Delta v. Benchmark (2.7%) (1.2%) 0.2% (1.1%) (1.5%) 1.3% (0.9%) (2.4%) (0.6%) 0.1% (2.6%) (5.7%) (0.1%) (5.7%) 0.8% (1.3%) Days Count Total * Acquisition of Mansco lifted the 2017 DSRs for April along with the Jan. to June, Jan. to Sep., and Jan. to Oct. Cumulative Changes by 1.3pps each. ** The January average is based on the historical change in January vs. October. All other months are sequential. Notes: Good Friday was during March in 2018 vs. April in Amounts may not foot due to rounding differences. 10
11 Employee Statistics Absolute Count HEADCOUNT STATISTICS 3Q18 3Q17 Change 4Q17 Change Branches/Onsites 13,749 13, % 13, % Non-Branch Selling 1,767 1, % 1, % Selling Personnel 15,516 14, % 15, % Distribution 3,677 3, % 3, % Manufacturing % % Administrative 1,256 1, % 1, % Non-Selling Personnel 5,666 5, % 5, % Total Personnel 21,182 20, % 20, % FTE Count 1 3Q18 3Q17 Change 4Q17 Change 11,995 11, % 11, % 1,721 1, % 1, % 13,716 13, % 13, % 2,716 2, % 2, % % % 1,201 1, % 1, % 4,598 4, % 4, % 18,314 17, % 17, % NOTES: 1 FTE Full-Time Equivalent. FTE is based on 40 hours per week. 2 Our internal manufacturing (9 locations) and industrial services (12 locations) division, which accounts for approximately 4% of our total revenue and 9% of our fastener revenue, has grown its sales approximately 16% in 3Q18 versus 3Q17 and approximately 24% in 3Q18 versus 4Q17. This division also added 37 fulltime and 5 part-time employees in 3Q18 related to a small bolt-on acquisition. 11
12 In-Market Location Statistics BRANCH STATISTICS New Branch openings 1Q Q Q Q Cumulative Closed/Converted Branches Closed Branches Closed (Curr. Quarter) 0 (1) 0 (11) (6) (2) (41) (9) (65) (36) (30) Closed (Annual) (8) (10) (7) (28) (16) (16) (73) (50) (144) (130) (122) Converted Branches (Annual) Branch-to-Customer Only (2) (1) (1) 0 0 (2) (2) (6) (16) (8) (8) Customer Only-to-Branch Cumulative (10) (11) (6) (27) (13) (18) (74) (56) (159) (138) (130) Branch Count 2,311 2,369 2,490 2,585 2,652 2,687 2,637 2,622 2,503 2,383 2,261 Active Onsites TOTAL IN-MARKET LOCATIONS 2,311 2,369 2,490 2,585 2,652 2,687 2,851 2,886 2,904 2,988 3,089 NOTES: As of September 30, 2018, includes 1,966 branches in the U.S., 185 in Canada, and 110 in the rest of the world. Branch Count includes all locations that sell to multiple customer accounts (traditional branches, overseas branches, and strategic accounts branches). It excludes locations that sell to single customer accounts (strategic accounts sites and Onsite locations). Onsite location information prior to 2014 is intentionally omitted. While such locations have existed since 1992, we did not specifically track their number until we identified our Onsite program as a growth driver in
13 End Market Profile End Market Mix Other, 5.3% Transportation, 2.3% Gov't/Education, 3.7% Reseller, 9.1% Manufacturing, 41.1% Construction, 13.0% Mfg - Heavy Equip., 25.4% MAJOR SEGMENT GROWTH Full (Daily Sales rates) Jan. Feb. Mar. Apr. May June July Aug. Sep. Oct. Nov. Dec. Year Manufacturing % 15.9% 14.0% 14.4% 11.9% 14.0% 11.5% 13.3% 14.7% 13.5% (incl. Heavy Equip.) % 6.4% 8.4% 9.2% 10.3% 14.9% 14.4% 14.6% 16.9% 15.7% 17.2% 16.2% 12.3% Construction % 10.5% 10.9% 13.1% 15.9% 17.4% 16.4% 18.5% 13.7% 13.9% % 4.8% 6.6% 5.8% 6.0% 5.7% 5.7% 5.0% 4.9% 6.0% 10.8% 11.9% 6.1% 13
Investor Teleconference Presentation First Quarter Fastenal Company April 11, 2018
 Investor Teleconference Presentation First Quarter 2018 Fastenal Company April 11, 2018 1 Safe Harbor Statement All statements made herein that are not historical facts (e.g., goals regarding Onsite and
Investor Teleconference Presentation Fourth Quarter Fastenal Company January 17, 2018
 Investor Teleconference Presentation Fourth Quarter 2017 Fastenal Company January 17, 2018 1 Safe Harbor Statement All statements made herein that are not historical facts (e.g., goals regarding Onsite
Investor Teleconference Presentation Third Quarter Fastenal Company October 11, 2017
 Investr Telecnference Presentatin Third Quarter 2017 Fastenal Cmpany Octber 11, 2017 1 Safe Harbr Statement All statements made herein that are nt histrical facts (e.g., gals regarding Onsite and vending
Investor Teleconference Presentation First Quarter Fastenal Company April 12, 2017
 Investr Telecnference Presentatin First Quarter 2017 Fastenal Cmpany April 12, 2017 1 Safe Harbr Statement All statements made herein that are nt histrical facts (e.g., gals regarding Onsite and vending
Fastenal Company Reports 2018 Annual and Fourth Quarter Earnings
 Fastenal Company Reports 2018 Annual and Fourth Quarter Earnings January 17, 2019 WINONA, Minn., Jan. 17, 2019 (GLOBE NEWSWIRE) -- Fastenal Company (Nasdaq:FAST), a leader in the wholesale distribution
Fastenal Company Reports 2017 Annual and Fourth Quarter Earnings
 January 17, 2018 Fastenal Company Reports 2017 Annual and Fourth Quarter Earnings WINONA, Minn., Jan. 17, 2018 (GLOBE NEWSWIRE) -- Fastenal Company (Nasdaq:FAST), a leader in the wholesale distribution
Fastenal Company Reports 2018 First Quarter Earnings
 April 11, 2018 Fastenal Company Reports 2018 First Quarter Earnings WINONA, Minn., April 11, 2018 (GLOBE NEWSWIRE) -- Fastenal Company (Nasdaq:FAST), a leader in the wholesale distribution of industrial
Fastenal Company Reports 2011 Second Quarter Earnings
 Fastenal Company Reports 2011 Second Quarter Earnings WINONA, Minn., July 12, 2011 (GLOBE NEWSWIRE) -- The Fastenal Company of Winona, MN (Nasdaq:FAST) reported the results of the quarter ended June 30,
2016 Financial Update and 2017 Outlook. Webcast Presentation December 13, 2016
 2016 Financial Update and 2017 Outlook Webcast Presentation December 13, 2016 Safe Harbor Statement Note: All statements made herein that are not historical facts should be considered as forwardlooking
We Distribute Products That Deliver Energy to the World. NOW Inc., Third Quarter 2017 Review & Key Takeaways
 We Distribute Products That Deliver Energy to the World NOW Inc., Third Quarter 2017 Review & Key Takeaways Forward Looking Statements Statements made in the course of this presentation that state the
Fourth Quarter and FY 2018 Earnings Presentation November 28, 2018
 Fourth Quarter and FY 2018 Earnings Presentation November 28, 2018 Cautionary statements This presentation contains forward-looking statements that are subject to known and unknown risks and uncertainties,
We Distribute Products That Deliver Energy to the World. NOW Inc., Second Quarter 2016 Review & Key Takeaways
 We Distribute Products That Deliver Energy to the World NOW Inc., Second Quarter 2016 Review & Key Takeaways Forward Looking Statements Statements made in the course of this presentation that state the
THIRD QUARTER FISCAL YEAR 2018 Earnings Conference Call & Presentation. August 7, 2018 at 9:00 a.m. CT (10:00 a.m. ET)
") THIRD QUARTER FISCAL YEAR 2018 Earnings Conference Call & Presentation August 7, 2018 at 9:00 a.m. CT (10:00 a.m. ET) 1 Third Quarter Fiscal Year 2018 Welcome to Nexeo s Earnings Conference Call and Presentation
THIRD QUARTER FISCAL YEAR 2018 Earnings Conference Call & Presentation August 7, 2018 at 9:00 a.m. CT (10:00 a.m. ET) 1 Third Quarter Fiscal Year 2018 Welcome to Nexeo s Earnings Conference Call and Presentation
Fourth Quarter 2014 Earnings Conference Call. 26 November 2014
 Fourth Quarter 2014 Earnings Conference Call 26 November 2014 Safe Harbor Statement & Disclosures The earnings call and accompanying material include forward-looking comments and information concerning
We Distribute Products That Deliver Energy to the World. NOW Inc., Fourth Quarter and Full-Year 2017 Review & Key Takeaways
 We Distribute Products That Deliver Energy to the World NOW Inc., Fourth Quarter and Full-Year 2017 Review & Key Takeaways Forward Looking Statements Statements made in the course of this presentation
2018 Second Quarter Earnings Call. May 8, 2018
 2018 Second Quarter Earnings Call May 8, 2018 Forward Looking Statements / Non-GAAP Measures This presentation contains information about management's view of the Company's future expectations, plans and
First Quarter 2018 May 3, 2018
 First Quarter 2018 May 3, 2018 Safe Harbor Please note that in this presentation, we may discuss events or results that have not yet occurred or been realized, commonly referred to as forward-looking statements.
Allegion Second-Quarter 2016 Results. July 28, 2016
 Allegion Second-Quarter 2016 Results July 28, 2016 Safe Harbor This presentation contains "forward-looking statements" within the meaning of the Private Securities Litigation Reform Act of 1995, including
Second Quarter 2018 Earnings Presentation May 8, 2018
 Second Quarter 2018 Earnings Presentation May 8, 2018 Cautionary statements This presentation contains forward-looking statements that are subject to known and unknown risks and uncertainties, many of
Third Quarter 2015 Earnings Call October 29, 2015
 Third Quarter 2015 Earnings Call October 29, 2015 Rob Wagman President & Chief Executive Officer Nick Zarcone Executive Vice President & Chief Financial Officer Joe Boutross Director, Investor Relations
Second Quarter 2013 Earnings Presentation. August 2, 2013
 Second Quarter 2013 Earnings Presentation August 2, 2013 Agenda Strategic Review Financial Review Questions and Answers Edward Tilly Chief Executive Officer Alan Dean Executive Vice President, CFO and
XML Publisher Balance Sheet Vision Operations (USA) Feb-02
 Feb-02") Page:1 Apr-01 May-01 Jun-01 Jul-01 ASSETS Current Assets Cash and Short Term Investments 15,862,304 51,998,607 9,198,226 Accounts Receivable - Net of Allowance 2,560,786
Page:1 Apr-01 May-01 Jun-01 Jul-01 ASSETS Current Assets Cash and Short Term Investments 15,862,304 51,998,607 9,198,226 Accounts Receivable - Net of Allowance 2,560,786
2018 First Quarter Earnings Call. February 8, 2018
 2018 First Quarter Earnings Call February 8, 2018 Forward Looking Statements / Non-GAAP Measures This presentation contains information about management's view of the Company's future expectations, plans
Fourth-Quarter 2018 Results. January 30, 2019
 Fourth-Quarter 2018 Results January 30, 2019 Safe Harbor This presentation includes forward-looking statements which are statements that are not historical facts, including statements that relate to the
Fourth Quarter & Full Year 2016 Earnings Call
 Fourth Quarter & Full Year 2016 Earnings Call February 23, 2017 Rob Wagman President & Chief Executive Officer Nick Zarcone Executive Vice President & Chief Financial Officer Joe Boutross Director, Investor
Credit Suisse 6 th Annual Industrials Conference November 2018
 Credit Suisse 6 th Annual Industrials Conference November 2018 Safe Harbor This presentation includes forward-looking statements which are statements that are not historical facts, including statements
Investor Deck December 2018
 Investor Deck December 2018 Safe Harbor This presentation includes forward-looking statements which are statements that are not historical facts, including statements that relate to the mix of and demand
Benchmark Electronics, Inc.
 Benchmark Electronics, Inc. Q1 2018 Earnings April 25, 2018 Forward-Looking Statements This document contains forward-looking statements within the meaning of Section 27A of the Securities Act of 1933
Second Quarter 2018 Earnings Conference Call. May 1, 2018
 Second Quarter 2018 Earnings Conference Call May 1, 2018 1 Safe Harbor Statement Our commentary and responses to your questions may contain forward-looking statements, including our outlook for the remainder
Q Conference Call. November 2, 2018
 Q3 2018 Conference Call November 2, 2018 Forward Looking Statements This presentation contains forward-looking information regarding future events or the Company s future financial performance based on
Q3 Fiscal Year 2018 Investor Presentation Financial Results Conference Call
 February Sept 6, 2018 2017 Q3 Fiscal Year 2018 Investor Presentation Financial Results Conference Call Mark D. Morelli President and Chief Executive Officer Gregory P. Rustowicz Vice President Finance
Q Earnings. Webcast Presentation April 26, 2018
 Q1 2018 Earnings Webcast Presentation April 26, 2018 2 Q1 2018 Earnings Webcast 4/26/18 Safe Harbor Statement All statements made herein that are not historical facts should be considered as forward-looking
CDW CORPORATION. Second Quarter 2014 Webcast Conference Call. July 31, investor.cdw.com
 CDW CORPORATION Second Quarter 2014 Webcast Conference Call July 31, 2014 www.cdw.com investor.cdw.com AGENDA 2nd Quarter Results Key Performance Drivers Financial Results Outlook Questions and Answers
Q Earnings Review and Update. May 9, 2016
 Q1 2016 Earnings Review and Update 1 May 9, 2016 Forward looking statements and non-gaap measures This presentation contains forward-looking statements. Forward-looking statements are not guarantees of
Third Quarter 2018 Earnings Conference Call. August 7, 2018
 Third Quarter 2018 Earnings Conference Call August 7, 2018 1 Safe Harbor Statement Our commentary and responses to your questions may contain forward-looking statements, including our outlook for the remainder
Q Earnings. Webcast Presentation November 1, 2018
 Q3 2018 Earnings Webcast Presentation November 1, 2018 2 Q3 2018 Earnings Webcast 11/1/18 Safe Harbor Statement All statements made herein that are not historical facts should be considered as forward-looking
Q4 & Full Year 2017 Earnings. Webcast Presentation February 1, 2018
 Q4 & Full Year 2017 Earnings Webcast Presentation February 1, 2018 2 Q4 & FY 2017 Earnings Webcast 2/1/18 Safe Harbor Statement All statements made herein that are not historical facts should be considered
December Colliers International Group Inc. Investor Presentation
 December 2018 Colliers International Group Inc. Investor Presentation Basis Of Presentation All amounts in millions of US Dollars unless otherwise noted. Adjusted EBITDA ( AEBITDA ) and Adjusted EPS (
Q3 FY 2015 FINANCIAL RESULTS CONFERENCE CALL April 30, 2015 at 5:00 pm ET
 Q3 FY 2015 FINANCIAL RESULTS CONFERENCE CALL April 30, 2015 at 5:00 pm ET SAFE HARBOR This presentation may contain certain comments, which are forward-looking statements that involve plans, strategies,
Allegion Second-Quarter 2018 Results. July 26, 2018
 Allegion Second-Quarter 2018 Results July 26, 2018 Safe Harbor This presentation contains "forward-looking statements" within the meaning of the Private Securities Litigation Reform Act of 1995, including
FINANCIAL RESULTS AND COMPANY OVERVIEW Second-Quarter Performance
 FINANCIAL RESULTS AND COMPANY OVERVIEW 08 Second-Quarter Performance September 5 th, 08 Disclaimer Forward-Looking Statements and Preliminary Results This presentation includes forward-looking statements
4Q17 EARNINGS PRESENTATION NYSE: DOOR
 4Q17 EARNINGS PRESENTATION NYSE: DOOR Safe Harbor / Non-GAAP Financial Measures SAFE HARBOR / FORWARD LOOKING STATEMENT This investor presentation contains forward-looking information and other forward-looking
First Quarter 2018 Earnings Conference Call. April 26, 2018
 First Quarter 2018 Earnings Conference Call April 26, 2018 Forward-Looking Statements NON-GAAP MEASURES The company uses certain non-gaap measures in discussing the company s performance. The reconciliation
WESCO International John Engel Chairman, President and CEO. William Blair & Company 36 th Annual Growth Stock Conference June 14, 2016
 WESCO International John Engel Chairman, President and CEO William Blair & Company 36 th Annual Growth Stock Conference June 14, 2016 Safe Harbor Statement Note: All statements made herein that are not
2016 Second Quarter Earnings Call May 2, 2016
 2016 Second Quarter Earnings Call Highlights Record second quarter sales $823.5 million, nearly double prior year (99.3% growth) Organic growth 27.7% in existing markets (31.4% growth in residential roing)
Fiscal fourth quarter 2018 financial results. October 25, 2018
 Fiscal fourth quarter 2018 financial results October 25, 2018 Safe harbor and fair disclosure statement Any statements made during our call today and information included in the supporting material that
Q3 Fiscal Year 2019 Investor Presentation Financial Results Conference Call
 January Sept 31, 2019 2017 Q3 Fiscal Year 2019 Investor Presentation Financial Results Conference Call Mark D. Morelli President and Chief Executive Officer Gregory P. Rustowicz Vice President Finance
Earnings Conference Call Third Quarter November 20, 2007
 Earnings Conference Call Third Quarter 2007 November 20, 2007 Safe Harbor Statement The Private Securities Litigation Reform Act of 1995 (the Act ) provides protection from liability in private lawsuits
Second-Quarter 2009 Earnings Presentation
 Second-Quarter 2009 Earnings Presentation Ursula Burns Chief Executive Officer Larry Zimmerman Vice Chairman & CFO July 23, 2009 Forward-Looking Statements This presentation contains "forward-looking statements"
FOURTH QUARTER AND FISCAL YEAR 2018 Earnings Conference Call & Presentation. December 6, 2018 at 9:00 a.m. CT (10:00 a.m. ET)
") FOURTH QUARTER AND FISCAL YEAR 2018 Earnings Conference Call & Presentation December 6, 2018 at 9:00 a.m. CT (10:00 a.m. ET) 1 Fourth Quarter & Fiscal Year 2018 Welcome to Nexeo s Earnings Conference Call
FOURTH QUARTER AND FISCAL YEAR 2018 Earnings Conference Call & Presentation December 6, 2018 at 9:00 a.m. CT (10:00 a.m. ET) 1 Fourth Quarter & Fiscal Year 2018 Welcome to Nexeo s Earnings Conference Call
First Quarter 2015 Earnings Presentation. May 1, 2015
 First Quarter 2015 Earnings Presentation May 1, 2015 Agenda Strategic Review Financial Review Questions and Answers Edward Tilly Chief Executive Officer Alan Dean Executive Vice President, CFO and Treasurer
Fourth Quarter 2017 Earnings Conference Call. January 24, 2018
 Fourth Quarter 2017 Earnings Conference Call January 24, 2018 Forward-Looking Statements NON-GAAP MEASURES The company uses certain non-gaap measures in discussing the company s performance. The reconciliation
Fiscal 2018 Fourth Quarter Results. July 26, 2018
 Fiscal 2018 Fourth Quarter Results July 26, 2018 Safe Harbor This presentation contains forward-looking statements within the meaning of Section 27A of the Securities Act of 1933, as amended, and Section
WESCO International John Engel Chairman, President and CEO. EPG Conference May 16, 2016
 WESCO International John Engel Chairman, President and CEO Safe Harbor Statement Note: All statements made herein that are not historical facts should be considered as forwardlooking statements within
February 21, Conduent Q4 & FY 2017 Earnings Results
 February 21, 2018 Conduent Q4 & FY 2017 Earnings Results Cautionary Statements Forward-Looking Statements This report contains forward-looking statements that involve risks and uncertainties. These statements
Dean Foods First Quarter 2014 Earnings Report. May 8, 2014
 Dean Foods First Quarter 2014 Earnings Report May 8, 2014 1 The following statements made in this presentation are forward-looking and are made pursuant to the safe harbor provision of the Private Securities
Fourth Quarter 2018 Conference Call January 22, ATI. All rights reserved.
 Fourth Quarter 2018 Conference Call January 22, 2019 Forward Looking Statements This presentation contains forward-looking statements. Actual results may differ materially from results anticipated in the
Second Quarter 2012 Earnings Presentation. August 2, 2012
 Second Quarter 2012 Earnings Presentation August 2, 2012 Agenda Strategic Review William Brodsky Chairman and CEO Financial Review Alan Dean Executive Vice President, CFO and Treasurer Questions and Answers
Fourth-Quarter 2009 Earnings Presentation
 Fourth-Quarter 2009 Earnings Presentation Ursula Burns Chief Executive Officer Larry Zimmerman Vice Chairman & CFO January 21, 2010 Forward-Looking Statements This presentation contains "forward-looking
Forward-looking Statement Disclosure
 Fourth Quarter 2017 Earnings Call Presentation Valmont Industries. Inc. 2017 Investor Day Forward-looking Statement Disclosure These slides contain (and the accompanying oral discussion will contain) forwardlooking
Results for Q2 Fiscal 2019
 Results for Q2 Fiscal 2019 Earnings Announcement: October 25, 2018 (Quarter Ended September 28, 2018) Risks and Non-GAAP Disclosures This presentation contains forward-looking statements, which are based
Lincoln Electric Holdings, Inc. Q Earnings Conference Call October 25, 2018
 Lincoln Electric Holdings, Inc. Q3 2018 Earnings Conference Call October 25, 2018 Christopher L. Mapes Chairman, President & Chief Executive Officer Vincent K. Petrella Executive Vice President & Chief
\\intranet.barcapint.com\dfs-amer\group\nyk\area\ibd\industrial\companies\jeld-wen\ Project Jamaica Dual Track\ IPO
 \\intranet.barcapint.com\dfs-amer\group\nyk\area\ibd\industrial\companies\jeld-wen\2015.07 Project Jamaica Dual Track\2015.10 IPO Execution\Presentation\Roadshow Presentation\Project Falcon_Roadshow Presentation_(1.13.17)_vNear
September Colliers International Group Inc. Investor Presentation
 September 2018 Colliers International Group Inc. Investor Presentation Basis Of Presentation All amounts in millions of US Dollars unless otherwise noted. Adjusted EBITDA ( AEBITDA ) and Adjusted EPS (
2018 FOURTH QUARTER EARNINGS CALL
 NORTH AMERICA S LEADING BUILDING MATERIALS DISTRIBUTOR RESIDENTIAL COMMERCIAL INTERIOR SOLAR 2018 FOURTH QUARTER EARNINGS CALL Forward Looking Statements / Non-GAAP Measures This presentation contains
MYERS INDUSTRIES, INC. First Quarter 2018 Earnings Presentation
 MYERS INDUSTRIES, INC. First Quarter 2018 Earnings Presentation SAFE HARBOR STATEMENT & NON-GAAP MEASURES Statements in this presentation concerning the Company s goals, strategies and expectations for
Lincoln Electric Holdings, Inc. Fourth Quarter & Full Year 2018 Earnings Conference Call February 14, 2019
 Lincoln Electric Holdings, Inc. Fourth Quarter & Full Year 2018 Earnings Conference Call February 14, 2019 Christopher L. Mapes Chairman, President & Chief Executive Officer Vincent K. Petrella Executive
Q Earnings. Webcast Presentation August 2, 2018
 Q2 2018 Earnings Webcast Presentation August 2, 2018 2 Q2 2018 Earnings Webcast 8/2/18 Safe Harbor Statement All statements made herein that are not historical facts should be considered as forward-looking
CBOE Holdings, Inc. Second Quarter Earnings Conference Call. CBOE Holdings, Inc.
 Second Quarter Earnings Conference Call A August t4 4, 2011 p. 1 Agenda Strategic Review Financial Review Questions and Answers William Brodsky Chairman and CEO Alan Dean Executive Vice President, CFO
First Quarter 2018 Earnings Conference Call. February 6, 2018
 First Quarter 2018 Earnings Conference Call February 6, 2018 1 Safe Harbor Statement Given the complexities associated with the Tax Cuts and Jobs Act (the Tax Act ), the ultimate effects on repatriation
Financial Results: Third Quarter Fiscal June 26, 2018
 Financial Results: Third Quarter Fiscal 2018 June 26, 2018 Safe Harbor SAFE HARBOR Statements and information included in this presentation by Schnitzer Steel Industries, Inc. (the "Company") that are
HUD NSP-1 Reporting Apr 2010 Grantee Report - New Mexico State Program
 HUD NSP-1 Reporting Apr 2010 Grantee Report - State Program State Program NSP-1 Grant Amount is $19,600,000 $9,355,381 (47.7%) has been committed $4,010,874 (20.5%) has been expended Grant Number HUD Region
First-Quarter 2018 Results. April 25, 2018
 First-Quarter 2018 Results April 25, 2018 Safe Harbor This presentation includes forward-looking statements which are statements that are not historical facts, including statements that relate to the mix
ITW Conference Call First Quarter 2013
 ITW Conference Call First Quarter 2013 April 23, 2013 SOLID GROWTH. STRONG RETURNS. BEST-IN-CLASS OPERATOR. Forward-Looking Statements Safe Harbor Statement This conference call contains forward-looking
Where Intelligence Meets Infrastructure
 Where Intelligence Meets Infrastructure Earnings Conference Call For The Fourth Quarter and Year Ended September 30, 2018 November 6, 2018 These slides are not intended to be a stand-alone presentation,
Earnings Presentation October 25, 2018
 nvent Third Quarter 2018 Earnings Presentation October 25, 2018 Forward-Looking Statement CAUTION CONCERNING FORWARD-LOOKING STATEMENTS This presentation contains statements that we believe to be "forward-looking
DAVID POPLAR. Second-Quarter 2014 Conference Call August 7, Vice President Investor Relations 8/7/2014 7:11:27 AM.
 Second-Quarter 2014 Conference Call August 7, 2014 2013 Oldemark LLC DAVID POPLAR Vice President Investor Relations 2013 Oldemark LLC 2 1 Today s Agenda CEO Overview Financial Update Q&A Emil Brolick Todd
2018 Outlook. Webcast Presentation December 13, 2017
 2018 Outlook Webcast Presentation December 13, 2017 Safe Harbor Statement All statements made herein that are not historical facts should be considered as forward-looking statements within the meaning
27 July 2018 Interim Results
 27 July 2018 Interim Results for the half year ended 30 June 2018 Disclaimer This presentation may contain forward-looking statements, including forward-looking statements within the meaning of the United
2018 SECOND QUARTER FINANCIAL RESULTS
 2018 SECOND QUARTER FINANCIAL RESULTS July 30, 2018 0 SAFE HARBOR STATEMENT The 2018 second quarter news release, conference call webcast, and the following slides contain forward-looking statements. The
Fourth Quarter and FY 2017 Earnings Presentation November 29, 2017
 Fourth Quarter and FY 2017 Earnings Presentation November 29, 2017 Cautionary statements This presentation contains forward-looking statements that are subject to known and unknown risks and uncertainties,
Q EARNINGS CALL May 1, :00 am ET
 Q1 2018 EARNINGS CALL May 1, 2018 9:00 am ET Forward-Looking Statements This presentation contains or may contain forward-looking statements within the meaning of Section 27a of the Securities Act of 1933,
Review of Membership Developments
 RIPE Network Coordination Centre Review of Membership Developments 7 October 2009/ GM / Lisbon http://www.ripe.net 1 Applications development RIPE Network Coordination Centre 140 120 100 80 60 2007 2008
First Quarter 2019 Earnings Presentation February 6, 2019
 First Quarter 2019 Earnings Presentation February 6, 2019 Cautionary statements This presentation contains forward-looking statements that are subject to known and unknown risks and uncertainties, many
Second Quarter 2016 Earnings Presentation. July 29, 2016
 Second Quarter 2016 Earnings Presentation July 29, 2016 Agenda Strategic Review Financial Review Questions and Answers Edward Tilly Chief Executive Officer Alan Dean Executive Vice President, CFO and Treasurer
2018 Second Quarter August 8, 2018
 2018 Second Quarter August 8, 2018 Safe Harbor Disclaimer Cautionary Statement Regarding Forward-Looking Statements We have made statements in this document that are forward-looking statements within the
Responsible investment in growth
 Responsible investment in growth Issued: 1 March 2016 Legal notice This presentation has been prepared to inform investors and prospective investors in the secondary markets about the Group and does not
Q1 FY14 Management Presentation
 www.osram-licht.ag FY14 Management Presentation (preliminary figures) Solid start into FY14 OSRAM Licht AG January 29, 2014 Safe Harbor Statement This presentation may contain forward-looking statements
MYERS INDUSTRIES, INC. MARCH 9, 2017 FOURTH QUARTER & FULL YEAR EARNINGS PRESENTATION
 MYERS INDUSTRIES, INC. MARCH 9, 2017 FOURTH QUARTER & FULL YEAR EARNINGS PRESENTATION SAFE HARBOR STATEMENT Statements in this presentation concerning the Company s goals, strategies, and expectations
XYLEM INC. Q EARNINGS RELEASE JULY 31, 2018
 XYLEM INC. Q2 2018 EARNINGS RELEASE JULY 31, 2018 Q2 2018 EARNINGS RELEASE FORWARD-LOOKING STATEMENTS This presentation contains information that may constitute forward-looking statements. within the meaning
IBM 1Q 2018 Earnings. April 17, ibm.com/investor
 IBM 1Q 2018 Earnings April 17, 2018 ibm.com/investor Forward Looking Statements and Non-GAAP Information 2 Certain comments made in this presentation may be characterized as forward looking under the Private
Bank of America Fourth Quarter 2006 Results
 Bank of America Fourth Quarter 2006 Results Ken Lewis Chairman, CEO and President Joe Price Chief Financial Officer January 23, 2007 Forward Looking Statements This presentation contains forward-looking
MSCI THIRD QUARTER 2016
 MSCI THIRD QUARTER 2016 Earnings Presentation October 27, 2016 2016 MSCI Inc. All rights reserved. Please refer to the disclaimer at the end of this document. FORWARD-LOOKING STATEMENTS Forward-Looking
more On Aug. 17, 2016, Target provided third quarter 2016 GAAP EPS from continuing operations and Adjusted EPS guidance of $0.75 to $0.95.
 FOR IMMEDIATE RELEASE Contacts: John Hulbert, Investors, (612) 761-6627 Erin Conroy, Media, (612) 761-5928 Target Media Hotline, (612) 696-3400 Target Reports Third Quarter Earnings GAAP EPS from continuing
Third-Quarter 2012 Earnings Presentation
 Third-Quarter 2012 Earnings Presentation Ursula Burns Chairman & CEO Luca Maestri Chief Financial Officer October 23, 2012 Forward-Looking Statements This presentation contains "forward-looking statements"
2018 First Quarter May 2, 2018
 2018 First Quarter May 2, 2018 Safe Harbor Disclaimer Cautionary Statement Regarding Forward-Looking Statements We have made statements in this document that are forward-looking statements within the meaning
2015 Fourth-Quarter and Fiscal Year Performance
 205 Fourth-Quarter and Fiscal Year Performance Financial Results and Company Highlights March 5, 206 Disclaimers Forward-Looking Statements This presentation includes forward-looking statements within
3Q 2017 Earnings Call November 10, :00am ET
 2017 Earnings Call November 10, 2017 8:00am ET 1 Safe Harbor Statement Certain statements made within this presentation contain forward-looking statements, within the meaning of the Private Securities
Q Earnings Presentation
 Q3 2017 Earnings Presentation October 18, 2017 design develop deliver advanced technology Forward-Looking Statements This document contains forward-looking statements within the scope of the Securities
Fiscal 2019 First Quarter Results. October 30, 2018
 Fiscal 2019 First Quarter Results October 30, 2018 Safe Harbor This presentation contains forward-looking statements within the meaning of Section 27A of the Securities Act of 1933, as amended, and Section