Q Earnings Review and Update. May 9, 2016
|
|
|
- Brittney Pitts
- 5 years ago
- Views:
Transcription

1 Q Earnings Review and Update 1 May 9, 2016
2 Forward looking statements and non-gaap measures This presentation contains forward-looking statements. Forward-looking statements are not guarantees of future performance and involve certain risks, uncertainties and assumptions. Actual results may differ materially from those expressed herein. Additional information concerning factors that could affect the Company s actual results is included in the Company s filings with securities regulators. The Company undertakes no obligation to update publicly any forward-looking statements except as required by securities legislation. This presentation contains non-gaap financial measures. For a discussion of non-gaap measures and the most directly comparable GAAP financial measures, see the Appendix to this presentation as well as our earnings release and our Form 10-Q interim report, which are available at: investor.ritchiebros.com All figures are in US dollars, unless otherwise noted. While rounding may occur in performance numbers for presentation purposes, percent change figures are calculated using full, unrounded numbers. 2 2
3 3 Update from Ravi Saligram Chief Executive Officer
4 Q financial highlights We grew all key financial metrics significantly in Q Foreign exchange continues to have an impact on quarterly comparators Reported - % Growth Organic - % Growth Versus Q Versus Q GAP 7% 9% Revenue 14% 17% Operating Income 19% 17% 27%* Diluted EPS attributable to stockholders 23% n/a Operating Free Cash Flow (12 month rolling) RONA (12 month rolling) ROIC (12 month rolling) 20% n/a 1350 bps n/a 250 bps 4 4 * Excludes the impact of both translational and transactional foreign exchange in Q and Q % improvement if FX gains are included in both periods, due to fluctuations in FX gains.
5 Meaningful growth in Revenue Rate in Q1: +84 bps Translational foreign exchange continued to affect revenue line Quarterly revenue & revenue rate ($US millions) $175 $ % 12.9% 16.0% 14.0% Revenue Rate Revenue $ % $ % 8.0% $75 6.0% $50 4.0% $25 $0 $102 $128 $106 $131 $99 $142 $102 $139 $116 $156 $109 $136 $132 Q1 Q2 Q3 Q4 Q1 Q2 Q3 Q4 Q1 Q2 Q3 Q4 Q % 0.0% 5 5
6 Volume & rate increases contributed to revenue growth FX continues to mute reported revenue growth Breakdown of revenue growth/decline, % attributable to item Q revenue compared to Q revenue 20% 15% 10% 9% Includes new service fee-based revenue from Mascus and Xcira 8% 17% -3% Changes in foreign exchange had a negative impact on reported revenue growth 14% 5% 0% -5% Total Volume Rate Total Organic Growth FX Impact Total Growth 6 6
7 Revenue rate strength from various components Our core auction business is performing well Our service businesses, both new and existing, are rapidly contributing to revenue growth New services based business units (Mascus and Xcira) contributed 16 bps of revenue rate growth Growth in revenue from existing services based businesses (RBFS, refurbishment, painting, shipping, etc.) improved the Q rate by 38 bps compared to Q Our auction businesses continue to generate healthy revenue rates: Ritchie Bros. Auctioneers EquipmentOne 11.85% revenue rate (Q1 2016) 13.96% revenue rate (Q1 2016) Components of Rev Rate improvement 0 Basis Point Improvement Q vs. Q basis points 38 bps 16 bps 1 bp 29 bps Existing service business revenue New service business revenue EquipmentOne Ritchie Bros. Auctioneers We continue to believe that an 11 to 12% revenue rate for the core auction business (Ritchie Bros. Auctioneers) is appropriate. Service based businesses will further bolster the total revenue rate. We believe about 12% or more is an appropriate revenue rate for the total company on an annual basis* *Quarterly fluctuations should be expected given the lumpy nature of the business. 7 7
8 RBA Core Auction business continues to perform well Auction volumes up 9%, supporting revenue growth; Revenue rate +29 bps Strong straight commission and buyers fee performance Underwritten business performed extremely well; albeit slight decrease in rate vs. Q In Q underwritten business rate was significantly better than the previous three quarters Underwritten business remains a key priority However, will achieve optimal balance in rate improvement vs. GAP growth in 2016 to drive revenue growth On a trailing 12 month basis (to Q1 2016), our underwritten rate has increased over 100 bps. Underwritten as a % of Total GAP Volume in line with 2013 and 2014, and closer to 2015 after removing Casper, WY impact 40.00% 35.00% 30.00% 25.00% 20.00% 15.00% 10.00% 5.00% 0.00% 20.4% 26.5% 28.3% 32.0% 24.0% 32.2% 30.1% 34.6% 28.5% 31.9% 29.3% 24.0% 29.3% 23.2% Q1 Q2 Q3 Q4 Q1 Q2 Q3 Q4 Q1 Q2 Q3 Q4 Q
9 Most geographies contributed to strong revenue growth Revenue growth in Canada, Australia and the Middle East drove most of the revenue growth in Q relative to Q US performed as expected, in light of very difficult comp ($54 mil Casper auction in March last year) Geographic breakdown of Q1 revenue $US revenue 10% 9% US Canada Europe Other 100% Q1 Core auction revenue growth rates $US growth; local currency US dollar growth Local currency growth 47% 37% 78% 75% 24% 57% Year prior - Q (US portion larger due to Casper, WY auction) 10% 7% -20% 14% -2% -2% -7% -8% US Canada Europe Other RBA - All 20% 63% 9 9
10 Construction and sales/rental customers bolstered volume Auction volumes increased 28% to a Q1 record of 93,000 lots during Q Increased consignments from construction related customers drove most of the volume increase Consignments from equipment distributors grew 20% compared to Q1 last year Q1 Auction volumes (Lot count) Q Incremental Lots per Customer sector Total lots sold per quarter Lot growth per customer (seller) sector, compared to Q1 2015¹ Number of Lots 100,000 90,000 80,000 70,000 60,000 50,000 40,000 30,000 28% 93,000 72,500 16% 61,500 62,000 62,500 7% 1% 1% Q Q Q Q Q % 25% 20% 15% 10% 5% 0% Growth from prior Q1 Lot growth per customer sector 4,000 3,000 2,000 1,000-70% % % 33% ,440 21% 2,340 3,034 17% 20% 140% 120% 100% 80% 60% 40% 20% 0% Growth of lots from customer sector ¹ Selected customer sectors. Does not include all sectors equipment came from.
11 Growth of target sectors evident GAP is growing in all our key sectors: Construction, Agriculture and Transportation; Transportation led the growth Lot volume in each sector is driving the growth given slightly softer pricing for some assets relative to the pricing peak of Q ,000 Construction Lots 5,000 Agriculture Lots Transportation Lots 12,000 Q vs. Q By ASSET CATEGORY 25,000 4,500 4,000 10,000 Construction assets: Lots 16% 20,000 3,500 3,000 8,000 Agricultural assets: Lots 32% 15,000 10,000 5,000 2,500 2,000 1,500 1, ,000 4,000 2,000 Transportation assets: Lots 47% * By asset category, not by customer sector. For example, a truck sold by a construction company would be allocated to the construction sector by customer, but to the transportation sector by asset type


12 Q auction highlights Bonanza, Alberta March 30, 2016 CA$24+ million of GAP LARGEST ON-THE-FARM AG AUCTION EVER HELD BY RBA Denver, Colorado March 17-18, 2016 US$46+ million of GAP LARGEST EVER DENVER AUCTION Grande Prairie, Alberta March 14-15, 2016 CA$62+ million of GAP LARGEST EVER GRANDE PRAIRIE AUCTION Fort Worth, Texas March 2-3, 2016 US$57+ million of GAP 5,850+ LOTS SOLD (A TEXAS RECORD) Post Q1 2016: Massive CA$240 million auction in Edmonton: April 26 30, 2016 Dubai, UAE March 1-2, 2016 US$41+ million of GAP (54% INCREASE RELATIVE TO LAST YEAR!) Edmonton, Alberta February 24-26, 2016 CA$120+ million of GAP Orlando, Florida February 15-19, 2016 US$172+ million of GAP 12 12
13 Strong auction operational performance The number of consignors, registered bidders and buyers has grown meaningfully relative to prior first quarters¹ Demonstrates the operational strength of our core business 12,000 Consignors 140,000 Registered Bidders 35,000 Buyers 10, ,000 30,000 8, ,000 25,000 6,000 80,000 20,000 60,000 15,000 4,000 40,000 10,000 2,000-8,900 8,900 11, The number of consignors increased 27% compared to Q ,000-90, , , The number of registered bidders increased 18% compared to Q ,000-21,900 25,200 31, The number of buyers increased 26% compared to Q ¹ Data is for Industrial auctions only.
14 Highest proportion of GAP from 3-5 yr old equipment since 2011 Age of Equipment sold at Ritchie Bros. Auctions¹ 3-5 yrs old: 29.6% of GAP¹ 8.5% 10.9% 10.2% 10.9% 8.7% 4.6% 18.5% of GAP¹ 8.7% 4.8% 5.0% New 1 New Yr Old to 1 yr Old 2 Yrs Old 3 Yrs Old 4 Yrs Old 5 Yrs Old 6+ Yrs YrsOld Old 3.6% 5.0% 10.3% 7 Yrs Old 8 Yrs Old 4.2% 11.0% 12.2% 9 Yrs Old 10 Yrs Old 9.6% 12.1% 12.1% 11.5% 3-5 yrs old: 35.8% of GAP¹ 13.1% 11.2% 0% 10% 20% 30% 40% 50% 60% 70% 80% 90% 100% ¹ Industrial auctions only. Excludes equipment over 10+ years and equipment with unknown ages.
15 50% of our buyers are now online The strength of our live (simulcast) online bidding capabilities is valued by our customers During Q we attracted record first quarter online bidder registrations 62% of registered bidders during Q1 were online bidders Sold approx. $449 million of assets through online transactions during Q1 2016, an increase of 11% from Q1 2015; comprising 44% of Q1 2016GAP Percent of buyers: On site or online 80% 70% 64% 60% 50% 50% 36% 40% 30% 20% 10% 0% Q Q 2 Q 3 Q 4 Q Q 2 Q 3 Q 4 Q Q 2 Q 3 Q 4 Q Q 2 Q 3 Q 4 Q Online Onsite *Industrial auction data


16 The Ritchie Bros. App Sample Screens 16 16

17 The Ritchie Bros. App: Phase 1 Features The Ritchie Bros. app provides a mobile channel with which to stay connected to and purchase equipment at auction. Feature list: Equipment Search Equipment Details Auction Listing / Details Auction Registration Sign In / Authentication Profile & Bidding Limit Information Live Auction Bidding and Viewing Multi Ring participation and navigation Purchase History (proforma invoice) Key Milestones Completed version 1 In Q1 Currently beta testing at live auctions First mobile bidding transactions in Q1 Full roll-out 17 17


18 Other sales channels continue to perform well EquipmentOne and Mascus are now reporting as Other business segment Both are considered to be online only service models, to facilitate the sale of equipment Segment produced $4.6 million of revenue in Q (Mascus contribution not a full quarter, acquired in February 2016) Generated $0.5 million of Costs of Services; $3.5 mil of SG&A (excl. Dep & Amort) Both businesses operated EBITDA positive Mascus contributed positively to earnings; Depreciation and Amortization of intangible assets main drag on E1 earnings 18 18
 sold through E1 during Q1 2016, a 9% increase from Q1 2015 Revenues grew 12% EquipmentOne metrics Q1 2016 performance GTV $23.7 million Revenue Rate 13.")
19 EquipmentOne performing as expected Strategies to grow EquipmentOne taking hold Expanded EquipmentOne into Canada during Q $23.7 million of Gross Transaction Value (GTV) sold through E1 during Q1 2016, a 9% increase from Q Revenues grew 12% EquipmentOne metrics Q performance GTV $23.7 million Revenue Rate 13.96% Revenue $3.3 million (12% improvement to Q1 2015) Cost of Services $0.4 million SG&A expenses $2.5 million 19 19

20 Mascus acquisition in Q1 drove slight fee revenue increase Contributing positively to our results Mascus contribution was not a full quarter; acquired on February 19, 2016 Generated positive earnings, but relatively immaterial impact in Q1 No operational impacts to Mascus as a result of our acquisition No integration of systems ; business as usual Current mandate to Do no harm to existing Mascus business Mascus generated 3.6 million of average monthly users to its website in Q Mascus metrics Revenue Cost of Services SG&A expenses Q performance (Partial quarter contribution) $1.3 million $0.1 million $0.7 million 20 20
21 Ritchie Bros. Financial Services LOANS LEASING STRUCTURED FINANCE DEALER SOLUTIONS Q revenue from RBFS grew 53% compared to Q Penetration into addressable market increased 83% $450 $400 $350 Credit Applications ($US millions) $395 63% growth $80 $70 $60 Funded Volume ($US millions) $70 71% growth $300 $250 $243 $50 $40 $41 $200 $150 $30 $100 $20 $50 $ $0 Q Q $0 Q Q1 2016
22 22 Q Performance Sharon Driscoll, Chief Financial Officer
23 Quarterly gross auction proceeds (GAP) Quarterly Gross Auction Proceeds ($US millions) $1,500 $4,600 $1,250 $4,312 $4,400 $1,000 $750 $500 $4,200 $4,000 $3,800 $3,600 $250 $0 $865 $1,195 $849 $1,000 $845 $1,073 $790 $1,107 $855 Q1 Q2 Q3 Q4 Q1 Q2 Q3 Q4 Q1 Q2 Q3 Q4 Q1 Q2 Q3 Q4 Q months trailing GAP Quarterly GAP $1,229 $887 $1,241 $956 $1,262 $895 $1,135 $1,020 $3,400 $3,
24 Strong earnings growth Q net income grew 24% relative to Q Driven by strong revenue growth Quarterly Adjusted Net Income attributable to Stockholders¹ ($US millions) 24% increase from Q % increase from Q $14 $30 $16 $30 $13 $37 $15 $36 $24 $45 $21 $31 $29 Q1 Q2 Q3 Q4 Q1 Q2 Q3 Q4 Q1 Q2 Q3 Q4 Q ¹ Earnings attributable to Ritchie Bros. Incorporated. Excludes minority interest of Ritchie Bros. Financial Services and Xcira.
25 Income statement scorecard Q GAP and revenue rate growth bolstered earnings Operating income would have grown 29% if not for FX gains now accounted for above the line (US GAAP) Q Income statement scorecard 3 months trailing ($US Millions except for EPS, %) March 31, 2016 March 31, 2015 Better / (Worse) GAP $1,019.9 $ % Revenues $131.9 $ % Revenue Rate 12.94% 12.10% 84 bps Adjusted Operating Income* $39.2 $ % Adjusted Operating Income Margin* 29.7% 28.5% 120 bps EBITDA $49.3 $ % Diluted EPS attributable to stockholders $0.27 $ % *There were no adjusting items during Q and Q
26 Impact of FX on our Q performance in Millions GAP/GTV and FX Q $86M, 9% -$22M, -2% $64M, 7% in Millions Revenue and FX Q $19M, 17% -$3M, -3% $16M, 14% Organic Growth FX effect Total Growth 0 Organic Growth FX effect Total Growth in Millions Expenses (DE, SG&A, D&A) and FX Q $13M, 16% $10M, 12% -$3M, -4% Organic Growth FX effect Total Growth in Millions Operating Income and FX Q $6M, 17% $0.5M, 2% $6M, 19% Organic Growth FX effect Total Growth * Figures rounded to the million
27 Revenue grew at twice the rate of SG&A Committed to keeping expense growth lower than revenue growth on annual basis Reported revenue grew 14%, while SG&A grew 7% On an organic comparable basis revenue grew 17% while SG&A grew 14% Q Quarterly revenue and SG&A growth ($US mil) Reported Revenue and SG&A $160 $140 $120 $100 $80 $60 $40 $20 $0 Revenue Growth: 14% $115.6 $131.9 Revenue Expense Growth: 7% $63.8 $68.3 SG&A $160 $140 $120 $100 Organic Revenue and Organic Comparable SG&A $80 $60 $40 $20 $0 Revenue Growth: 17% $115.6 $134.9 Revenue Expense Growth: 14% $61.7 $70.5 SG&A SG&A normalized to: Exclude $2.1 mil of restructuring expenses in Q Exclude acquisition related expenses in Q YoY SG&A expense increases related to: Bonus accrual increase Planned staffing changes (YoY) Mark-to-market adjustments for share based comp expenses Increase in IT license fees Q Q Q Q1 2016
28 Modeling expense lines Introducing Costs of Services to better reflect the cost of offering online No longer called Direct Expense to better reflect our broader service offering Acquisitions of Mascus and Xcira generate revenue not associated with direct auction activity 28 Prior Direct Expense definition Direct Labour, Buildings & Facilities charges and travel, advertising and promotion costs associated with auction activity 28 New Costs of Services definition Direct Labour, Buildings & Facilities and Technology charges and travel, advertising and promotion costs associated with auction activity PLUS: Costs of services incurred in earning other fee revenues (such as revenue from Mascus and Xcira) including: direct labour (including commissions on sales), software maintenance fees, and materials. Q Costs of Services breakdown (US$ mil) Brand Core Auction business 92% Q Cost of Services Xcira (incl. in Core) 4% Q Direct expense Core auction business (excl. Xcira) $14.1 $11.6 Xcira $ EquipmentOne $0.4 Previously recorded within SG&A Mascus (partial quarter) $ Total $15.3 $11.6 EquipmentOne 3% Mascus 1%

29 Tax rate assumptions for 2016 Estimate our annual 2016 tax rate will be approx. 26% US GAAP tax practices require an estimation of the annual rate Based on our expectations that a greater portion of earnings are likely to be generated in lower tax jurisdictions (ie. Canada, UAE) New arrangements within the business in Q4 resulted in reliable projections of future taxable profits in regions with tax loss carryforwards These are forward looking estimates, that could vary with actual performance 29 29
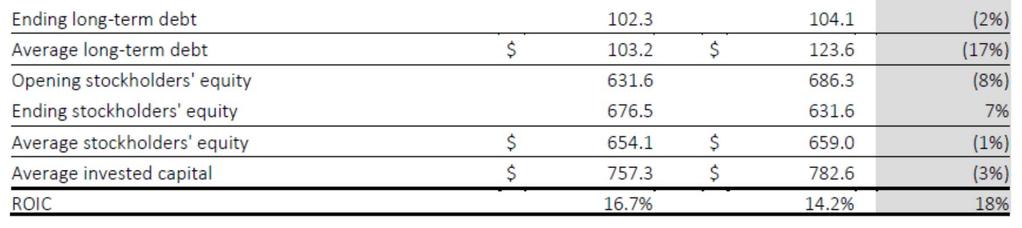
30 Balance sheet scorecard Q Q Balance sheet scorecard 12 months trailing ($US Millions except for percent figures) March 31, 2016 March 31, 2015 Better / (Worse) Operating free cash flow $205.5 $ % Working Capital Intensity -34.6% -27.7% 690 bps Capex Intensity 2.7% 4.9% 220 bps ROIC (Return on Invested Capital) 16.7% 14.2% 250 bps RONA (Return on Net Assets) 34.8% 21.3% 1350 bps RONA excluding term loan reclassification 31.3% 21.3% 1000 bps Debt / Adjusted EBITDA 0.7x 0.6x (0.1x) 30 30
31 Capital allocation priorities Priority Discussion 1. Grow dividends with earnings Highly valued return of cash to shareholders 2. Hold fully-diluted shares flat Offset dilution from management stock options through share buybacks 3. Acquisitions Accelerate top-line growth and leverage the model 4. Share buy-backs Growth initiatives are a higher priority at this time 5. Pay down debt Only if better economic returns are not available Consistently make use of cash on our balance sheet to facilitate underwritten transactions; The strength of our balance sheet is a competitive advantage. US$36.7 million spent on share repurchases during Q May 9, 2016: Company declares a dividend of $0.16 per common share, payable on June 14, 2016 to shareholders of record on May 24, *Priorities for cash utilization after operating CAPEX needs have been met.
32 32 Final Comments Ravi Saligram, Chief Executive Officer

33 Acquisition of the minority interest in RBFS Ritchie Bros. Financial Services has performed extremely well in the last 18 months We currently own 51% of this business; have signed a binding letter of intent to acquire 100% of the company Transaction closing expected by July 1, 2016, at which time we will make a formal announcement Contributions from RBFS are already accounted for on a fully consolidated basis in our financial statements Allocation of 49% interest is noted within the minority interest line of our income statement Minority interest valued at US$41.4 million; final purchase price could differ from fair value estimates contained in our Q disclosure 33 33


34 We are fast becoming a multichannel, digital powerhouse Ritchie Bros. now offers four main sales channels to equipment owners Business units are supported through Ritchie Bros. ownership of Xcira (online auction technology provider) and Ritchie Bros. Financial Services (financial solutions partner for equipment buyers). RITCHIE BROS. GROUP OF COMPANIES: 75% ownership 51% ownership Integrated technology platform Integrated onsite/online unreserved auction network Online marketplace Online listing service Financial intermediary capitalizing on captive customer base to provide an alternative source of capital Brokerage channel for highly specialized assets
35 YTD GAP continues to trend above 2015 Auction timing had a significant impact on April GAP Due mostly to the timing of the Edmonton Auction (auction was attributed to April in 2016 but May in 2015 due to the date of the last day of the sale) Edmonton contributed US$191+ mil to April 2016 GAP Comparable Edmonton auction of 2015 ended in May, and contributed US$177+ mil to May 2015 GAP Other auction timing difference contributed to April 2016 monthly metrics: Auctions held in April 2015, but in prior months in 2016: Albuquerque, Raleigh-Durham, Chilliwack, Hamilton Auctions held in April 2015, but in later months in 2016: Donington Park, Linton Auctions held in April 2016, but in later months in 2015: Phoenix and Kearney Adjusting YTD 2015 to include the comparable Edmonton sale, 2016 YTD GAP grew 3% Cumulative GAP growth YTD (US$ 000) Jan Feb Mar Apr w/ Edmn $1,415 $1,368 $1,
36 36 Q&A Ravi Saligram, Chief Executive Officer Sharon Driscoll, Chief Financial Officer Jim Barr, Group President Terry Dolan, President US and Latin America Randy Wall, President Canada


37 Appendix Evergreen Model Reconciliation of Non-GAAP measures Non- GAAP Measures The following tables reconcile non-gaap measures referred to in this presentation to the most directly comparable GAAP measure reflected in the Company s financial statements 37
38 RBA s evergreen financial model Performance Metric Avg. Annual Growth Targets 2015 performance GAP Growth (%) High Single Digit to Low Double Digits Revenue Growth (%) (1) Mid Single Digit to High Single Digit +8% (organic) +16% (organic) SG&A Growth (%) Will grow slower than revenues +12% (organic, excl. D&A) Operating Income Margin 50 bps bps EPS Growth (%) (2) High Single Digit to Low Double Digits +22% (adjusted) Net Capex Intensity (3) <10% 2.8% (abnormally low) OFCF (4) % of Net Earnings >100% 150% RONA (5) Increase 50 bps bps Dividend Payout Ratio 55% to 60% * 53% Net Debt / EBITDA <2.5X 0.5x (excl. current portion of long term debt) (*announced 14% increase in dividend in Aug based on TTM earnings) Above model reflects our aspiration on how the model should work in the next 5 to 7 years (1) Includes Tuck In and Bolt On acquisitions (2) Variances may occur in certain years based on tax rate that is influenced by geographic revenue mix (3) Net Capital Spending as % of Revenue (4) Operating Free Cash Flow (5) Return on Net Assets

39 39 Reconciliation of Non-GAAP Measures

40 40 Reconciliation of Non-GAAP Measures

41 41 Reconciliation of Non-GAAP Measures

42 42 Reconciliation of Non-GAAP Measures

43 43 Reconciliation of Non-GAAP Measures

44 44 Reconciliation of Non-GAAP Measures
A global leader in used equipment sales
 A global leader in used equipment sales Investor overview presentation 1 August 2016 Jefferies Conference Forward looking statements and non-gaap measures This presentation contains forward-looking statements.
Forward looking statements and non-gaap measures
 February 27, 2018 Forward looking statements and non-gaap measures Caution Regarding Forward-Looking Statements This presentation contains forward-looking statements and forward-looking information within
Forward looking statements and non-gaap measures
 February 27, 2018 Forward looking statements and non-gaap measures Caution Regarding Forward-Looking Statements This presentation contains forward-looking statements and forward-looking information within
Forward looking statements and non-gaap measures
 February 27, 2018 Forward looking statements and non-gaap measures Caution Regarding Forward-Looking Statements This presentation contains forward-looking statements and forward-looking information within
Q Quarterly Report
 Q1 2015 Quarterly Report Casper, WY Management s Discussion and Analysis of Financial Condition and Results of Operations of Ritchie Bros. Auctioneers Incorporated for the quarter ended March 31, 2015
Forward looking statements and non-gaap measures
 February 27, 2018 Forward looking statements and non-gaap measures Caution Regarding Forward-Looking Statements This presentation contains forward-looking statements and forward-looking information within
Forward looking statements and non-gaap measures
 February 27, 2018 Forward looking statements and non-gaap measures Caution Regarding Forward-Looking Statements This presentation contains forward-looking statements and forward-looking information within
Forward Looking Statements and Non-GAAP Measures Caution Regarding Forward-Looking Statements
 Ravi Saligram, CEO Forward Looking Statements and Non-GAAP Measures Caution Regarding Forward-Looking Statements This presentation contains forward-looking statements and forward-looking information within
A global leader in used equipment sales. June
 A global leader in used equipment sales June 2017 1 Forward looking statements and non-gaap measures Caution Regarding Forward-Looking Statements This presentation contains forward-looking statements and
UNITED STATES SECURITIES AND EXCHANGE COMMISSION Washington, D.C FORM 10-K
 UNITED STATES SECURITIES AND EXCHANGE COMMISSION Washington, D.C. 20549 FORM 10-K ANNUAL REPORT PURSUANT TO SECTION 13 OR 15(d) OF THE SECURITIES EXCHANGE ACT OF 1934 For the fiscal year ended December
Investor Teleconference Presentation Third Quarter Fastenal Company October 10, 2018
 Investor Teleconference Presentation Third Quarter 2018 Fastenal Company October 10, 2018 1 Safe Harbor Statement All statements made herein that are not historical facts (e.g., goals regarding Onsite
2Q17 EARNINGS AUGUST 2017
 2Q17 EARNINGS AUGUST 2017 FORWARD-LOOKING STATEMENTS The statements contained in this release that refer to plans and expectations for the next quarter, the full year or the future are forward-looking
The Global Leader in Used Equipment Sales
 The Global Leader in Used Equipment Sales 2015 Investor & Analyst Day New York January 12, 2015 Forward looking statements This presentation contains forward-looking statements (as such term is defined
4Q17 EARNINGS FEBRUARY 2018
 4Q17 EARNINGS FEBRUARY 218 2 FORWARD-LOOKING STATEMENTS The statements contained in this release that refer to plans and expectations for the next quarter, the full year or the future are forward-looking
PTC PREPARED REMARKS FOURTH QUARTER AND FULL YEAR FISCAL 2017 OCTOBER 25, 2017
 PTC PREPARED REMARKS FOURTH QUARTER AND FULL YEAR FISCAL 2017 OCTOBER 25, 2017 Please refer to the Important Disclosures section of these prepared remarks for important information about our operating
Second Quarter 2018 Earnings Conference Call. May 1, 2018
 Second Quarter 2018 Earnings Conference Call May 1, 2018 1 Safe Harbor Statement Our commentary and responses to your questions may contain forward-looking statements, including our outlook for the remainder
4Q18 EARNINGS. February NASDAQ: GRPN /
 4Q18 EARNINGS February 2019 NASDAQ: GRPN / ir@groupon.com Forward-Looking Statements The statements contained in this release that refer to plans and expectations for the next quarter, the full year or
February 21, Conduent Q4 & FY 2017 Earnings Results
 February 21, 2018 Conduent Q4 & FY 2017 Earnings Results Cautionary Statements Forward-Looking Statements This report contains forward-looking statements that involve risks and uncertainties. These statements
Third Quarter 2018 Earnings Review
 Citi Investor Relations Third Quarter 2018 Earnings Review October 12, 2018 Overview Solid operating results in 3Q 18 Continued momentum in Institutional accrual businesses and strong results in Fixed
ITW Conference Call First Quarter 2013
 ITW Conference Call First Quarter 2013 April 23, 2013 SOLID GROWTH. STRONG RETURNS. BEST-IN-CLASS OPERATOR. Forward-Looking Statements Safe Harbor Statement This conference call contains forward-looking
Fourth Quarter 2016 Earnings Conference Call
 Fourth Quarter 2016 Earnings Conference Call Larry Merlo President & Chief Executive Officer Dave Denton Executive Vice President & Chief Financial Officer February 9, 2017 Revised 2/9 Forward-looking
Third Quarter 2015 Earnings Call October 29, 2015
 Third Quarter 2015 Earnings Call October 29, 2015 Rob Wagman President & Chief Executive Officer Nick Zarcone Executive Vice President & Chief Financial Officer Joe Boutross Director, Investor Relations
Q FINANCIAL HIGHLIGHTS. July 18, 2018
 Q2 2018 FINANCIAL HIGHLIGHTS July 18, 2018 DISCLOSURES This presentation contains non-gaap measures relating to our performance. You can find the reconciliation of these measures to the nearest comparable
Q FINANCIAL HIGHLIGHTS. January 31, 2018
 Q4 FINANCIAL HIGHLIGHTS January 31, 2018 DISCLOSURES This presentation contains non-gaap measures relating to our performance. You can find the reconciliation of these measures to the nearest comparable
Q Financial Highlights. July 17, 2013
 July 17, 2013 This presentation contains non-gaap measures relating to the company's performance. You can find the reconciliation of these measures to the nearest comparable GAAP measures in the appendix
Fourth Quarter 2018 Earnings Review
 Citi Investor Relations Fourth Quarter 2018 Earnings Review January 14, 2019 Overview 4Q 18 showed continued progress in a challenging environment Continued momentum in Institutional accrual businesses
EMERSON REPORTS STRONG SECOND QUARTER 2018 RESULTS AND RAISES FULL-YEAR GUIDANCE
 Investor Contact: Tim Reeves (314) 553-2197 Media Contact: Pat Kane (314) 982-8726 EMERSON REPORTS STRONG SECOND QUARTER 2018 RESULTS AND RAISES FULL-YEAR GUIDANCE Net sales of $4.2 billion increased 19
CDW Corporation. Webcast Conference Call May 4, CDW.com
 CDW Corporation Webcast Conference Call May 4, 2016 CDW.com 800.800.4239 Today's Agenda 1st Quarter Results Key Performance Drivers and Strategic Progress Financial Results Outlook Q&A 1 Disclaimers This
1Q18 EARNINGS MAY 2018
 1Q18 EARNINGS MAY 2018 FORWARD-LOOKING STATEMENTS The statements contained in this release that refer to plans and expectations for the next quarter, the full year or the future are forward-looking statements
Fiscal 2018 Fourth Quarter Results. July 26, 2018
 Fiscal 2018 Fourth Quarter Results July 26, 2018 Safe Harbor This presentation contains forward-looking statements within the meaning of Section 27A of the Securities Act of 1933, as amended, and Section
August 8, Conduent Q Earnings Results
 August 8, 2018 Conduent Q2 2018 Earnings Results Cautionary Statements Forward-Looking Statements This report contains forward-looking statements, as defined in the Private Securities Litigation Reform
Trimble Second Quarter 2018 Results Summary
 Trimble Second Quarter 2018 Results Summary Forward-looking statements Certain statements made in this presentation and any subsequent Q&A period are forward-looking statements, within the meaning of Section
Q Earnings. Webcast Presentation April 26, 2018
 Q1 2018 Earnings Webcast Presentation April 26, 2018 2 Q1 2018 Earnings Webcast 4/26/18 Safe Harbor Statement All statements made herein that are not historical facts should be considered as forward-looking
Q and Full Year 2012 Financial Highlights. January 16, 2013
 Q4 2012 and Full Year 2012 Financial Highlights January 16, 2013 This presentation contains non-gaap measures relating to the company's performance. You can find the reconciliation of those measures to
Q Financial Highlights. July 16, 2014
 July 16, 2014 This presentation contains non-gaap measures relating to the company's performance. You can find the reconciliation of these measures to the nearest comparable GAAP measures in the appendix
CDW Corporation. Webcast Conference Call February, CDW.com
 CDW Corporation Webcast Conference Call February, 7 2018 CDW.com 800.800.4239 Today's Agenda Fourth Quarter and YTD 2017 Results Key Performance Drivers and Strategic Progress Financial Results ASC 606
First Quarter 2018 Earnings Review
 Citi Investor Relations First Quarter 2018 Earnings Review April 13, 2018 Overview 1Q 18 showed strong operating results and balanced franchise performance Revenue growth in both Cards and Retail Banking
more On Jan. 9, 2018, Target updated fourth quarter guidance for comparable sales, GAAP EPS from continuing operations, and Adjusted EPS.
 FOR IMMEDIATE RELEASE Contacts: John Hulbert, Investors, (612) 761-6627 Erin Conroy, Media, (612) 761-5928 Target Media Hotline, (612) 696-3400 Target Reports Fourth Quarter and Full-Year Earnings Strong
1Q15 Earnings May 2015
 1Q15 Earnings May 2015 Forward-Looking Statements The statements contained in this presentation that refer to plans and expectations for the next quarter, the full year or the future are forward-looking
Sysco 2Q16 Earnings Results. February 1, 2016
 Sysco 2Q16 Earnings Results February 1, 2016 Forward-Looking Statements Statements made in this presentation or in our earnings call for the second quarter of fiscal 2016 that look forward in time or that
CDW Corporation. Webcast Conference Call October 31, CDW.com
 CDW Corporation Webcast Conference Call October 31, 2018 CDW.com 800.800.4239 Today's Agenda Third Quarter and YTD 2018 Results Performance Drivers 2018 Annual Medium Term Targets Modeling Thoughts Q&A
Q FINANCIAL HIGHLIGHTS. January 29, 2019
 Q4 FINANCIAL HIGHLIGHTS January 29, 2019 DISCLOSURES This presentation contains non-gaap measures relating to our performance. You can find the reconciliation of these measures to the nearest comparable
Investor Teleconference Presentation Fourth Quarter Fastenal Company January 17, 2018
 Investor Teleconference Presentation Fourth Quarter 2017 Fastenal Company January 17, 2018 1 Safe Harbor Statement All statements made herein that are not historical facts (e.g., goals regarding Onsite
Financial and Operating Results. Second Quarter and First Half 2016
 Financial and Operating Results Second Quarter and First Half 2016 August 2016 Safe Harbor Statement Forward Looking Statements In addition to historical information, this earnings presentation contains
3Q 2017 Earnings Call November 10, :00am ET
 2017 Earnings Call November 10, 2017 8:00am ET 1 Safe Harbor Statement Certain statements made within this presentation contain forward-looking statements, within the meaning of the Private Securities
2Q15 Earnings August 2015
 2Q15 Earnings August 2015 Forward-Looking Statements The statements contained in this presentation that refer to plans and expectations for the next quarter, the full year or the future are forward-looking
ACXIOM Q2 FY18 Conference Call. November 1, 2017
 ACXIOM Q2 FY8 Conference Call November, 207 SAFE HARBOR STATEMENT Some of the matters discussed in this presentation contain forward-looking statements regarding the company s future business prospects
Whole Foods Market Reports Fourth Quarter and Fiscal Year 2016 Results
 NEWS RELEASE Whole Foods Market Reports Fourth Quarter and Fiscal Year Results 11/2/ Company Produces Record Sales of $3.5 Billion and Delivers EPS of $0.28; Increases Quarterly Dividend and Provides Targets
4Q13 Earnings February 2014
 4Q13 Earnings February 2014 Forward-Looking Statements The statements contained in this presentation that refer to plans and expectations for the next quarter or the future are forward-looking statements
2Q 2017 Highlights and Operating Results
 2Q 2017 Highlights and Operating Results July 25, 2017 1 2Q 2017 Highlights and Operating Results Table of Contents Page(s) 1 Sales Overview and Highlights 4-5 2 NSS Overview 6-7 3 EES Overview 8-9 4 UPS
Earnings Release 4Q18. Fourth Quarter 2018 Key Financial and Operating Highlights. Full Year 2018 Key Financial and Operating Highlights
 Despegar.com Announces 4Q18 year-over-year Growth of 11% in Transactions and Gross Bookings up 28% on an FX neutral basis driving further Market Share Gains Buenos Aires, March 7, 2019 Despegar.com, Corp.
Albemarle Corporation Fourth Quarter 2018 Earnings. Conference Call/Webcast Thursday, February 21 st, :00am ET
 Albemarle Corporation Fourth Quarter 2018 Earnings Conference Call/Webcast Thursday, February 21 st, 2019 9:00am ET Forward-Looking Statements Some of the information presented in this presentation, the
September Colliers International Group Inc. Investor Presentation
 September 2018 Colliers International Group Inc. Investor Presentation Basis Of Presentation All amounts in millions of US Dollars unless otherwise noted. Adjusted EBITDA ( AEBITDA ) and Adjusted EPS (
2015 Fourth-Quarter and Fiscal Year Performance
 205 Fourth-Quarter and Fiscal Year Performance Financial Results and Company Highlights March 5, 206 Disclaimers Forward-Looking Statements This presentation includes forward-looking statements within
Earnings Call Presentation
 Exhibit 99.2 May 1, 2017 Earnings Call Presentation 1 st Quarter 2017 Safe Harbor Statement 2 Our disclosures in this presentation, including without limitation, those relating to future financial results
Q & Year-to-Date Earnings Slides August 8, 2017
 Q2 2017 & Year-to-Date Earnings Slides August 8, 2017 Forward-Looking Statements This presentation includes forward-looking statements as that term is defined in the Private Securities Litigation Reform
Q Earnings. Webcast Presentation November 1, 2018
 Q3 2018 Earnings Webcast Presentation November 1, 2018 2 Q3 2018 Earnings Webcast 11/1/18 Safe Harbor Statement All statements made herein that are not historical facts should be considered as forward-looking
February 11, Whole Foods Market, Inc. (NASDAQ: WFM) today reported results for the 16-week first quarter ended January 18, 2015.
 today reported results for the 16-week first quarter ended January 18, 2015.") Whole Foods Market Delivers Record Q1 Sales and EPS Comparable Store Sales Increase 4.5%, Accelerating on a One- and Two-Year Basis due Primarily to Traffic Growth; Sales Increase 10% to Record $4.7 billion;
Whole Foods Market Delivers Record Q1 Sales and EPS Comparable Store Sales Increase 4.5%, Accelerating on a One- and Two-Year Basis due Primarily to Traffic Growth; Sales Increase 10% to Record $4.7 billion;
Q EARNINGS CALL
 Tom Goeke Chief Executive Officer Q2 2017 EARNINGS CALL JULY 27, 2017 IMPORTANT INFORMATION Forward Looking Statements These slides contain (and the accompanying oral discussion will contain) forward looking
CDW Corporation. Webcast Conference Call May 2, CDW.com
 CDW Corporation Webcast Conference Call May 2, 2018 CDW.com 800.800.4239 Today's Agenda First Quarter 2018 Results Key Performance Drivers and Strategic Progress Financial Results Outlook Q&A 2 Disclaimers
2Q17 EARNINGS PRESENTATION NYSE: DOOR
 2Q17 EARNINGS PRESENTATION NYSE: DOOR Safe Harbor / Non-GAAP Financial Measures SAFE HARBOR / FORWARD LOOKING STATEMENT This investor presentation contains forward-looking information and other forward-looking
XYLEM INC. Q EARNINGS RELEASE MAY 1, 2018
 XYLEM INC. Q1 2018 EARNINGS RELEASE MAY 1, 2018 Q1 2018 EARNINGS RELEASE FORWARD-LOOKING STATEMENTS This presentation contains information that may constitute forward-looking statements. Forward-looking
Hertz Investor Presentation. November 5, 2013 Citi North American Credit Conference New York City, NY
 Hertz Investor Presentation November 5, 2013 Citi North American Credit Conference New York City, NY Forward-Looking Statements Certain statements contained in this presentation are forward-looking statements
2017 Second Quarter August 3, 2017
 2017 Second Quarter August 3, 2017 Safe Harbor Disclaimer Cautionary Statement Regarding Forward-Looking Statements We have made statements in this document that are forward-looking statements within the
Q Financial Results August 6, 2018
 Q2 2018 Financial Results August 6, 2018 2 Forward-looking Statements This presentation contains forward-looking statements within the meaning of the federal securities laws. Forward-looking statements
XYLEM INC. Q EARNINGS RELEASE OCTOBER 30, 2018
 XYLEM INC. Q3 2018 EARNINGS RELEASE OCTOBER 30, 2018 Q3 2018 EARNINGS RELEASE FORWARD-LOOKING STATEMENTS This presentation contains information that may constitute forward-looking statements. within the
PTC PREPARED REMARKS SECOND QUARTER FISCAL 2018 APRIL 18, 2018
 PTC PREPARED REMARKS SECOND QUARTER FISCAL 2018 APRIL 18, 2018 Please refer to the Important Disclosures section of these prepared remarks for important information about our operating metrics (including
Despegar.com Announces 4Q17 year-over-year Growth of 26% in Gross Bookings and 30% in Revenues
 Despegar.com Announces 4Q17 year-over-year Growth of 26% in Gross Bookings and 30% in Revenues Buenos Aires, March 8, 2018 Despegar.com, Corp. (NYSE: DESP), ( Despegar or the Company ) a leading online
Overview Presentation to Investors. February 2016
 Overview Presentation to Investors February 2016 Forward-Looking Statements Statements about future results made in this presentation constitute forward-looking statements within the meaning of the Private
XYLEM INC. Q EARNINGS RELEASE FEBRUARY 1, 2018
 XYLEM INC. Q4 2017 EARNINGS RELEASE FEBRUARY 1, 2018 Q4 2017 EARNINGS RELEASE FORWARD-LOOKING STATEMENTS This presentation contains information that may constitute forward-looking statements. Forward-looking
MSCI Reports Financial Results for Fourth Quarter and Full-Year 2017
 MSCI Reports Financial Results for Fourth Quarter and Full-Year 2017 1 PRESS RELEASE New York February 1, 2018 MSCI Inc. (NYSE: MSCI), a leading provider of indexes and portfolio construction and risk
Fourth Quarter 2017 Earnings & 2018 Forecast Conference Call
 Fourth Quarter 2017 Earnings & 2018 Forecast Conference Call February 16, 2018 2015 Ryder System, Inc. Safe Harbor and Non-GAAP Financial Measures Note Regarding Forward Looking Statements: Certain statements
Q4 and FY 2016 Earnings
 Q4 and FY 2016 Earnings Disclaimers Related to Forward-Looking Statements Certain items in this presentation and in today s discussion, including matters relating to revenue, net income (loss), and percentages
4Q 2018 Highlights and Operating Results. Products. Technology. Services. Delivered Globally.
 4Q 2018 Highlights and Operating Results Products. Technology. Services. Delivered Globally. Table of Contents Page 3 Safe Harbor Statement and Non-GAAP Financial Measures 4 Sales Overview 9 Overview of
Fourth Quarter 2017 Earnings Review
 Citi Investor Relations On February 23, 2018, Citi announced that it was adjusting downward its fourth quarter and full year 2017 financial results, from those reported on January 16, 2018, due to an updated
December Colliers International Group Inc. Investor Presentation
 December 2018 Colliers International Group Inc. Investor Presentation Basis Of Presentation All amounts in millions of US Dollars unless otherwise noted. Adjusted EBITDA ( AEBITDA ) and Adjusted EPS (
MSCI THIRD QUARTER 2016
 MSCI THIRD QUARTER 2016 Earnings Presentation October 27, 2016 2016 MSCI Inc. All rights reserved. Please refer to the disclaimer at the end of this document. FORWARD-LOOKING STATEMENTS Forward-Looking
3Q 2018 Highlights and Operating Results. Products. Technology. Services. Delivered Globally.
 3Q 2018 Highlights and Operating Results Products. Technology. Services. Delivered Globally. Table of Contents Page 3 Safe Harbor Statement and Non-GAAP Financial Measures 4 Sales Overview 9 Overview of
FORWARD-LOOKING STATEMENTS:
 Safe Harbor FORWARD-LOOKING STATEMENTS: This presentation contains forward-looking statements concerning management's expectations, goals, objectives and similar matters, which are subject to risks and
THIRD QUARTER FISCAL YEAR 2018 Earnings Conference Call & Presentation. August 7, 2018 at 9:00 a.m. CT (10:00 a.m. ET)
") THIRD QUARTER FISCAL YEAR 2018 Earnings Conference Call & Presentation August 7, 2018 at 9:00 a.m. CT (10:00 a.m. ET) 1 Third Quarter Fiscal Year 2018 Welcome to Nexeo s Earnings Conference Call and Presentation
THIRD QUARTER FISCAL YEAR 2018 Earnings Conference Call & Presentation August 7, 2018 at 9:00 a.m. CT (10:00 a.m. ET) 1 Third Quarter Fiscal Year 2018 Welcome to Nexeo s Earnings Conference Call and Presentation
FORWARD-LOOKING AND CAUTIONARY STATEMENTS
 FORWARD-LOOKING AND CAUTIONARY STATEMENTS Forward-looking statements are included in this presentation. These forward-looking statements are typically identified by the use of terms such as outlook, guidance,
Bruker Corporation (NASDAQ: BRKR)
") Bruker Corporation (NASDAQ: BRKR) Q4 2017 Earnings Presentation February 8, 2018 Frank Laukien, President & CEO Anthony Mattacchione, SVP & CFO Miroslava Minkova, Head of Investor Relations Innovation
Bruker Corporation (NASDAQ: BRKR) Q4 2017 Earnings Presentation February 8, 2018 Frank Laukien, President & CEO Anthony Mattacchione, SVP & CFO Miroslava Minkova, Head of Investor Relations Innovation
ation erials nt Mat ese Pr or lementalestvin Supp
 Supplemental Investor Presentation Materials DENTSPLY International, Inc. Third Quarter 2014 Earnings Supplemental Materials October 29, 2014 2 Forward Looking Statements This presentation contains forward-looking
Q Earnings. Webcast Presentation August 2, 2018
 Q2 2018 Earnings Webcast Presentation August 2, 2018 2 Q2 2018 Earnings Webcast 8/2/18 Safe Harbor Statement All statements made herein that are not historical facts should be considered as forward-looking
Fiscal 2019 First Quarter Results. October 30, 2018
 Fiscal 2019 First Quarter Results October 30, 2018 Safe Harbor This presentation contains forward-looking statements within the meaning of Section 27A of the Securities Act of 1933, as amended, and Section
Q4 & Full Year 2017 Earnings. Webcast Presentation February 1, 2018
 Q4 & Full Year 2017 Earnings Webcast Presentation February 1, 2018 2 Q4 & FY 2017 Earnings Webcast 2/1/18 Safe Harbor Statement All statements made herein that are not historical facts should be considered
Fourth Quarter 2015 Earnings Call
 Fourth Quarter 2015 Earnings Call February 25, 2016 Rob Wagman President & Chief Executive Officer Nick Zarcone Executive Vice President & Chief Financial Officer Joe Boutross Director, Investor Relations
ACXIOM Q3 FY18 Conference Call. February 6, 2018
 ACXIOM Q3 FY18 Conference Call February 6, 2018 SAFE HARBOR STATEMENT Some of the matters discussed in this presentation contain forward-looking statements regarding the company s future business prospects
4Q 2017 Highlights and Operating Results
 4Q 2017 Highlights and Operating Results January 30, 2018 1 4Q 2017 Highlights and Operating Results Table of Contents Page(s) 1 Sales Overview 4-8 2 Financial Performance Trends 9-16 3 Leverage Metrics
Groupon Announces First Quarter 2015 Results
 May 5, 2015 Groupon Announces First Quarter 2015 Results Gross billings of $1.6 billion Revenue of $750.4 million Adjusted EBITDA of $72.4 million GAAP loss per share of $0.02; non-gaap earnings per share
SENSATA SECOND QUARTER 2017 EARNINGS PRESENTATION JULY 25, 2017
 SENSATA SECOND QUARTER 2017 EARNINGS PRESENTATION JULY 25, 2017 Forward-Looking Statements In addition to historical facts, this earnings presentation, including any documents incorporated by reference
We Distribute Products That Deliver Energy to the World. NOW Inc., Fourth Quarter and Full-Year 2017 Review & Key Takeaways
 We Distribute Products That Deliver Energy to the World NOW Inc., Fourth Quarter and Full-Year 2017 Review & Key Takeaways Forward Looking Statements Statements made in the course of this presentation
PTC SECOND QUARTER FISCAL 2017 PREPARED REMARKS APRIL 19, 2017
 PTC SECOND QUARTER FISCAL 2017 PREPARED REMARKS APRIL 19, 2017 Please refer to the Important Disclosures section of these prepared remarks for important information about our operating metrics (including
Earnings Presentation October 25, 2018
 nvent Third Quarter 2018 Earnings Presentation October 25, 2018 Forward-Looking Statement CAUTION CONCERNING FORWARD-LOOKING STATEMENTS This presentation contains statements that we believe to be "forward-looking
Fourth Quarter & Full Year 2016 Earnings Call
 Fourth Quarter & Full Year 2016 Earnings Call February 23, 2017 Rob Wagman President & Chief Executive Officer Nick Zarcone Executive Vice President & Chief Financial Officer Joe Boutross Director, Investor
Autobytel Q Results Presentation. May 4, 2017
 Autobytel Q1 2017 Results Presentation May 4, 2017 Safe Harbor Statement and Non-GAAP Disclosures The statements made in the accompanying conference call or contained in this presentation that are not
Newell Rubbermaid Raises Full Year Guidance on Strong Second Quarter Results
 Newell Rubbermaid Raises Full Year Guidance on Strong Second Quarter Results Jul 31, 2015 Second Quarter Executive Summary 5.1% Core Sales Growth and Normalized EPS of $0.64 3.9% Net Sales Growth and Reported
2018 Outlook. Webcast Presentation December 13, 2017
 2018 Outlook Webcast Presentation December 13, 2017 Safe Harbor Statement All statements made herein that are not historical facts should be considered as forward-looking statements within the meaning
2016 Financial Update and 2017 Outlook. Webcast Presentation December 13, 2016
 2016 Financial Update and 2017 Outlook Webcast Presentation December 13, 2016 Safe Harbor Statement Note: All statements made herein that are not historical facts should be considered as forwardlooking
ITW Conference Call Fourth Quarter 2012
 ITW Conference Call Fourth Quarter 2012 January 29, 2013 SOLID GROWTH. STRONG RETURNS. BEST-IN-CLASS OPERATOR. 100 YEARS STRONG Safe Harbor Statement Forward-Looking Statements This conference call contains