First Quarter 2015 Earnings Presentation. May 1, 2015
|
|
|
- Elwin Miller
- 5 years ago
- Views:
Transcription

1 First Quarter 2015 Earnings Presentation May 1, 2015
2 Agenda Strategic Review Financial Review Questions and Answers Edward Tilly Chief Executive Officer Alan Dean Executive Vice President, CFO and Treasurer Edward Tilly Alan Dean Edward Provost President and Chief Operating Officer 2
3 Forward-Looking Statements This press release may contain forward-looking statements, within the meaning of the Private Securities Litigation Reform Act of Forward-looking statements are those statements that reflect our expectations, assumptions or projections about the future and involve a number of risks and uncertainties. These statements are only predictions based on our current expectations and projections about future events. There are important factors that could cause actual results to differ materially from that expressed or implied by the forward-looking statements, including: the loss of our right to exclusively list certain index options and futures products; increasing price competition in our industry; compliance with legal and regulatory obligations and obligations under agreements with regulatory agencies; decreases in the amount of trading volumes or a shift in the mix of products traded on our exchanges; our ability to operate our business, monitor and maintain our systems or program them so that they operate correctly, including in response to increases in trading volume and order transaction traffic; the accuracy of our estimates and expectations; legislative or regulatory changes; increasing competition by foreign and domestic entities; our index providers ability to perform under our agreements; our ability to operate our business without violating the intellectual property rights of others and the costs associated with protecting our intellectual property rights; our ability to maintain access fee revenues; our ability to protect our systems and communication networks from security risks, including cyber-attacks; economic, political and market conditions; our ability to attract and retain skilled management and other personnel; our ability to maintain our growth effectively; our dependence on third party service providers; and the ability of our compliance and risk management methods to effectively monitor and manage our risks. More detailed information about factors that may affect our performance may be found in our filings with the SEC, including in our Annual Report on Form 10-K for the year ended December 31, 2014 and other filings made from time to time with the SEC. 3
4 Strategic Review Edward Tilly CEO
5 Expanding Our Suite of Premium Products and Global Reach Despite challenging volume conditions, made significant progress on key initiatives Secured rights to trade numerous Russell and FTSE Index products Began exclusive trading in Russell 2000 Index options at CBOE and C2 on April 1 Launched options on two well-known MSCI benchmarks on April 21 Extended trading hours for SPX and VIX options in March 5


6 1Q15 Revenue and Earnings Reflect Impact of Lower Trading Volumes Volume down across each product category 4.95 ¹Adjusted to reflect the impact of certain items. See Appendix for Non-GAAP Information. 6
7 Continue to Lay the Foundation for Future Growth Decrease in VIX options trading Volatility trades work especially well as a hedge against sharp market declines Absent real concerns about a sharp, sustained market pullback Less utility for volatility products Use other index products, such as SPX options, for directional exposure to stock prices SPX options volume up 1% in 1Q15 YOY Users generally expect volume and open interest to pick up as conditions change Believe conditions are generally cyclical 7

8 Advancing CBOE s Index Growth Story Collaborate Create Connect 8


9 Collaborate Growing roster of CBOE indexes 9
10 Collaborate With New Index Providers Forging collaborative partnerships to expand index complex December 2014 licensing agreement with MSCI CBOE exclusive U.S. exchange for trading MSCI Index options First CBOE MSCI options launched April 21: MSCI EAFE Index (Europe, Australasia, Far East) MSCI Emerging Markets Index Adds global dimension to CBOE s index options franchise MSCI volatility products a future possibility 10
11 Collaborate With New Index Providers CBOE entered into an exclusive licensing agreement with London Stock Exchange Group CBOE is the exclusive provider for cash-settled listed options to trade in the U.S. on more than 24 FTSE and Russell Indexes On April 1, became sole provider of listed Russell 2000 (RUT) options Trades exclusively on CBOE and C2 Plan to launch FTSE 100 index options and other Russell and FTSE products later this year Expands our product line across new asset classes and markets Creates new trading opportunities for customers 11
12 Creating More Trading Opportunities and Synergies Leveraging cross-marketing opportunities and education CBOE s expanding suite of index products will allow market participants to hedge and trade: Global Volatility Global Stock Market Broad U.S. Stock Market U.S. Small-Cap Market European and Asian International Equities World s Emerging Markets 12

 Expanding")
13 Connecting With An Expanding Customer Base Leveraging CBOE s ability to connect customers globally across a range of efficient channels Leveraging CBOE s educational resources The Options Institute CBOE TV CBOE.com CBOE s social media platform CBOE s Risk Management Conferences (RMC) Expanding annual RMC beyond the U.S. and Europe to include Asia 13


14 Connect: Broadening Access to Our Premium Products About 8% of VIX futures trading during non-u.s. hours YTD¹ Added extended trading hours session for VIX and SPX options VIX options started March 2 and SPX options started on March 9 New session runs from 2:00 a.m. to 8:15 a.m. CT, Monday through Friday ¹Through March 31, 2015 ²Extended hours to nearly 24X5 on June 22,
15 Create: Weekly VIX Options and Futures Launching Weeklys on VIX options and futures¹ Plan to launch Weeklys on futures this July, with options to follow VIX Weeklys will complement VIX futures and options As SPX Weeklys complement our SPX product Provides volatility exposures that more precisely track our benchmark VIX index Allows users to fine tune the timing of their volatility trades and hedge against event-driven market moves Investors will be able to trade expiring VIX and SPX contracts each week Creates more trading opportunities ¹Pending regulatory approval 15
16 Create New Trading Platform CBOE Vector Systems development is deeply embedded in CBOE s value proposition Development of next generation of trading technology is underway Leveraging our in-house trading and technology expertise Building a customized, state-of-the-art platform Responds to the trading needs of our customers Best supports CBOE s unique product set Continue to drive optimal performance of our current system Build out and implement new systems for CFE first CFE projected for the second half of 2016, with CBOE and C2 to follow 16
17

18 2015 Creating New Opportunities 18
19 Financial Review Alan Dean EVP, CFO and Treasurer
20 1Q15 Financial Overview Adjusted Basis¹ (in millions, except EPS and RPC) 1Q15 1Q14 $ Change % Change Operating Revenues $142.8 $ $ % Adjusted Operating Expenses Adjusted Operating Income $ 69.5 $ $ % Adjusted Operating Margin % 48.7% 53.6% -490 bps Adjusted Net Income Allocated to Common Stockholders $ 42.3 $ $7.7-15% Adjusted Diluted EPS $ 0.50 $ $ % Total ADV % Revenue per Contract $0.340 $0.329 $ % ¹Adjusted to reflect the impact of certain items. See Appendix for Non-GAAP Information. 20
21 Overview of Operating Revenues Transaction fees key driver of revenue decline Transaction fees down $14.1MM 15% decrease in trading volume 3% increase in RPC Lower volume discounts and incentives, offset somewhat by unfavorable shift in product mix Operating Revenues (in millions) 1Q15 1Q14 % Chg Transaction fees $ 98.7 $ % Access fees % Exchange services and other fees % Market data fees % Regulatory fees % Other revenue % Total Operating Revenues $142.8 $ % 21


22 Increase in RPC Primarily Reflects Lower Volume-Based Incentives Trading volume mix and RPC 1Q15 versus 1Q14 22


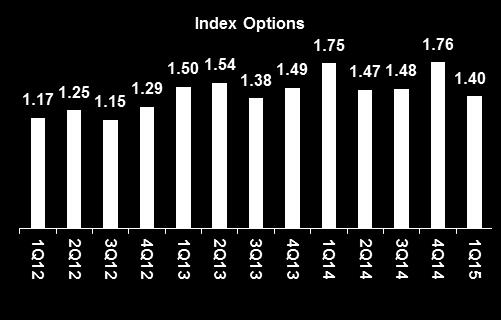
23 Proprietary Products Account for Growing Percentage of Transaction Fee Revenue Index options and futures contracts accounted for 81.3% of transaction fees in 1Q15, up from 81.0% in 1Q14 23
24 Other Factors Influencing Revenue Access fees declined $1.5MM Decrease in trading permits Regulatory fees down $1.5MM Lower trading volume industrywide Elimination of fees related to CBSX Lower rate for ORF in 1Q15 vs 1Q14 Other revenue up $0.9MM Primarily due to increase in fines Market data fees up $0.9MM Operating Revenues (in millions) 1Q15 1Q14 % Chg Transaction fees $ 98.7 $ % Access fees % Exchange services and other fees % Market data fees % Regulatory fees % Other revenue % Total Operating Revenues $142.8 $ % Primarily due to increase in revenue from CBOE s market data services 24
25 Disciplined Control of Expenses Key drivers: Lower expenses - Comp and benefits down $5.4MM Royalty fees down $1.7MM Higher expenses - Prof. fees and outside services up $4.6MM Deprec. and amortization up $1.8MM Technology support services up $0.6MM Adjusted Operating Expenses¹ (in millions) 1Q15 1Q14 % Chg Compensation and benefits $25.4 $ % Depreciation and amortization % Technology support services % Professional fees and outside services % Royalty fees % Order routing % Travel and promotional % Facilities costs % Other expenses % Total Adjusted Operating Expenses $73.3 $ ¹Adjusted to reflect the impact of certain items. See appendix for Non-GAAP Information. May not foot due to rounding. 25
26 Core Operating Expenses In Line With Prior Year Key drivers: Prof. fees and outside services up $4.6MM Primarily due to outsourcing of certain regulatory services to FINRA Technology support up $0.6MM Mainly software and maintenance Travel and promotions up $0.5MM Higher advertising costs Comp and benefits down $5.4MM Primarily due to lower costs for salaries, stock-based compensation and incentive compensation Core Operating Expenses¹ (in millions) 1Q15 1Q14 % Chg Compensation and benefits $25.4 $ % Technology support services % Professional fees and outside services % Travel and promotional % Facilities costs % Other expenses % Total $47.9 $47.7 1% ¹Adjusted to reflect the impact of certain items. See appendix for Non-GAAP Information. May not foot due to rounding. 26
27 2015 Full-Year Guidance As of May 1, 2015 ($ in millions) Current 2015 Full-Year Guidance Prior 2015 Full-Year Guidance Core operating expenses $190 to $194 $195 to $199 Continuing stock-based compensation¹ $12 $12 Depreciation and amortization $46 to $48 $46 to $48 Capital expenditures $37 to $40 $37 to $40 Effective tax rate 38.5% to 39.5% 38.5% to 39.5% 1 Stock-based compensation expense is included in employee costs. 27
28 Volume-based Expenses Royalty fees down $1.7MM Lower trading volume in licensed products Includes index options and VIX futures Volume-based Expenses (in millions) 1Q15 1Q14 % Chg Royalty fees $ 14.2 $ % Order-routing fees $ 0.8 $ % Total $ 15.0 $ % May not foot due to rounding. 28

29 Enhancing Stockholder Value Strong cash flow generation and disciplined approach to managing cash Cash of $138MM at quarter end Generated $78MM in operating cash flow in 1Q15 1Q15 Capital Outlays Regular dividends $ 18 MM Share repurchases¹ 34 MM Capital expenditures 8 MM OCC capital funding 30 MM Total $ 90 MM ¹Includes stock purchased under repurchase plan and from employees 29

30 Enhancing Stockholder Value Priorities regarding use of cash have not changed Reinvest in our business to fund growth Steady, consistent dividend growth Share repurchases ¹Excludes special dividends ²Dividends paid for last two quarters of the year, post IPO 30
31 Remain Focused on Strategic Growth Initiatives Develop New Products Extend Global Customer Reach Provide Highest Standards in Market Regulation and Compliance Maximize Revenue in Multiply-listed Products Invest in Strategic Growth Initiatives Maintain Prudent Fiscal Management Return Value to Stockholders 31
32 Questions & Answers
33 Appendix Materials
34 Optimistic About Long-term Growth Prospects $160 $140 $120 $100 $80 $60 $40 $20 $0 Quarterly Adjusted Operating Revenue and Diluted EPS¹ ($ in millions, except EPS) 1Q11 2Q11 3Q11 4Q11 1Q12 2Q12 3Q12 4Q12 1Q13 2Q13 3Q13 4Q13 1Q14 2Q14 3Q14 4Q14 1Q15 Adjusted Operating Revenue Adjusted Diluted EPS $0.70 $0.65 $0.60 $0.55 $0.50 $0.45 $0.40 $0.35 $0.30 $0.25 $0.20 ¹Adjusted to reflect the impact of certain items. See Appendix for Non-GAAP Information. 34
35 Well Positioned to Gain Additional Leverage $90 $80 $70 Quarterly Adjusted Operating Income and Margin¹ ($ in millions) 54% 52% $60 50% $50 $40 $30 $20 $10 48% 46% 44% 42% $0 1Q11 2Q11 3Q11 4Q11 1Q12 2Q12 3Q12 4Q12 1Q13 2Q13 3Q13 4Q13 1Q14 2Q14 3Q14 4Q14 1Q15 40% Adjusted Operating Income Adjusted Operating Margin ¹Adjusted to reflect the impact of certain items. See Appendix for Non-GAAP Information. 35


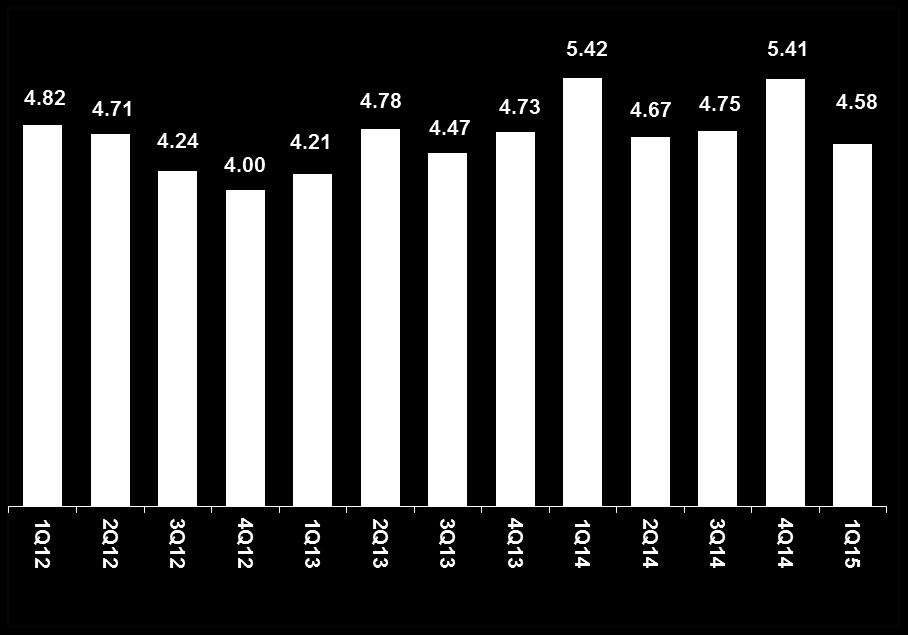
36 Quarterly Options ADV CBOE Holdings Quarterly Options ADV (contracts in millions) 36


37 Trading Volume Mix and RPC 1Q14 vs 1Q15 RPC change primarily reflects higher volume-based incentives 37
38 CBOE Holdings Rolling 3-Month RPC 2015 Jan Feb Mar Apr May Jun Jul Aug Sep Oct Nov Dec Equities $0.069 $0.070 $0.077 Indexes Exchange-traded products Total options RPC Futures Total RPC $0.333 $0.340 $ Jan Feb Mar Apr May Jun Jul Aug Sep Oct Nov Dec Equities $0.079 $0.079 $0.081 $0.082 $0.081 $0.079 $0.074 $0.076 $0.077 $0.078 $0.074 $0.068 Indexes $0.670 $0.671 $ Exchange-traded products $0.111 $0.112 $ Total options RPC $0.275 $0.275 $ Futures $1.639 $1.651 $ Total RPC $0.317 $0.329 $0.329 $0.325 $0.321 $0.322 $0.324 $0.336 $0.329 $0.344 $0.331 $ Jan Feb Mar Apr May Jun Jul Aug Sep Oct Nov Dec Equities $0.149 $0.153 $0.140 $0.114 $0.094 $0.090 $0.082 $0.081 $0.077 $0.076 $0.076 $0.075 Indexes Exchange-traded products Total options RPC Futures Total RPC $0.376 $0.382 $0.378 $0.357 $0.341 $0.334 $0.324 $0.321 $0.315 $0.320 $0.315 $ Jan Feb Mar Apr May Jun Jul Aug Sep Oct Nov Dec Equities $0.151 $0.128 $0.110 $0.112 $0.117 $0.123 $0.124 $0.122 $0.118 $0.121 $0.124 $0.134 Indexes Exchange-traded products Total options RPC Futures Total RPC $0.308 $0.289 $0.280 $0.290 $0.304 $0.314 $0.316 $0.315 $0.317 $0.326 $0.342 $
39 Annual Core Operating Expenses¹ ($ in thousands) 2014 % rev 2013 % rev 2012 % rev 2011 % rev 2010 % rev Total Operating Expenses $303,424 49% $286,236 50% $268,241 52% $266,512 52% $269,763 62% Less: Depreciation and Amortization 39,913 6% 34,488 6% 31,485 6% 34,094 7% 29,891 7% Accelerated stock-based compensation 2,530-3,996 1% ,968 3% Severance 1, ,709 1% - - Estimated liability/expense related to SEC investigation 0-1,000-5,000 1% Volume-based Expense: Royalty Fees 66,110 11% 56,576 10% 46,135 9% 47,822 9% 41,353 10% Trading Volume Incentives 4,080 1% 4,355 1% 6,275 1% 14,239 3% 21,294 5% Core Operating Expenses (non-gaap)¹: $188,928 31% $185,821 32% $179,003 35% $166,195 33% $164,257 38% Less: Continuing stock-based compensation 13,047 2% 16,828 3% 12,005 2% 12,166 2% 7,833 2% Core Operating Expenses excluding continuing stockbased compensation (non-gaap)¹: $175,881 28% $168,993 30% $166,998 33% $154,029 30% $156,424 36% Core Operating Expense Detail: Employee Costs $117,341 19% $114,087 20% $103,853 20% $100,292 20% $93,275 22% Data Processing 19,189 3% 17,898 3% 19,603 4% 17,933 4% 19,501 5% Outside Services 31,976 5% 34,473 6% 36,300 7% 27,310 5% 31,245 7% Travel and Promotion Expenses 9,046 1% 9,806 2% 10,006 2% 9,812 2% 9,569 2% Facilities Costs 5,721 1% 5,053 1% 5,066 1% 5,400 1% 5,801 1% Other Expenses 5,655 1% 4,504 1% 4,175 1% 5,448 1% 4,866 1% Number of Full Time Employees at year end ¹Please see our disclaimer regarding non-gaap financial measures. May not foot due to rounding 39
40 Quarterly Core Operating Expenses¹ ($ in thousands) 1Q 2015 % rev 4Q 2014 % rev 3Q 2014 % rev 2Q 2014 % rev 1Q 2014 % rev Total Operating Expenses $73,286 51% $79,525 48% $73,826 50% $74,226 52% $75,847 48% Less: Depreciation and amortization 10,402 7% 11,053 7% 10,361 7% 9,895 7% 8,604 5% Accelerated stock-based compensation ,530 2% Severance expense - - 1,863 1% Volume-based expense: Royalty fees 14,150 10% 19,266 12% 16,235 11% 14,707 10% 15,902 10% Trading volume incentives 787 1% 874 1% 961 1% 1,120 1% 1,126 1% Core Operating Expenses (non-gaap)¹: $47,947 34% $46,469 28% $46,269 31% $48,504 34% $47,685 30% Less: Continuing stock-based compensation 2,655 2% 2,098 1% 2,109 1% 4,457 3% 4,383 3% Core Operating Expenses excluding continuing stockbased compensation (non-gaap)¹: $45,292 32% $44,371 27% $44,160 30% $44,047 31% $43,302 27% Core Operating Expense Detail: Employee costs $25,439 18% $27,493 17% $28,698 19% $30,306 21% $30,844 20% Data processing 5,325 4% 4,915 3% 4,769 3% 4,783 3% 4,721 3% Outside services 11,950 8% 8,539 5% 8,204 6% 7,855 5% 7,378 5% Travel and promotional expenses 2,501 2% 2,727 2% 1,885 1% 2,446 2% 1,987 1% Facilities costs 1,384 1% 1,445 1% 1,373 1% 1,590 1% 1,313 1% Other expenses 1,348 1% 1,350 1% 1,340 1% 1,524 1% 1,442 1% Total $47,947 $46,469 $46,269 $48,504 $47,685 Number of full-time employees at quarter end ¹Please see our disclaimer regarding non-gaap financial measures. May not foot due to rounding 40
41 GAAP to Non-GAAP Reconciliation For Years 2010 and 2011 GAAP to Non-GAAP Reconciliation (in thousands, except per share amounts) Reconciliation of GAAP Net Income Allocated to Common Stockholder to Non-GAAP 3Q10 4Q10 1Q11 2Q11 3Q11 4Q11 FY2010 FY2011 GAAP net income allocated to common stockholders $ 20,020 $ 30,687 $ 32,089 $ 32,609 $ 40,597 $ 31,287 $ 98,166 $ 136,582 Less: Recognition of prior-period revenue (4,406) (4,406) Add: Accelerated stock-based compensation 10,965 2, , Add: Severance expense pursuant to an executive employment agreement 3,709 3,709 Add: Impairment change 1, , Income tax benefit/(expense) related to the items above (4,461) 291 (337) (46) (1,478) (4,034) (1,861) Add: Income tax provision adjustment 4,223 (322) 3,901 Net income allocated to participating securities - effect on reconciling items (144) 11 (11) (2) (75) (32) (76) (109) Adjusted net income allocated to common stockholders $ 26,380 $ 30,207 $ 32,540 $ 32,674 $ 44,745 $ 33,164 $ 104,238 $ 143,134 Reconciliation of GAAP Diluted EPS to Non-GAAP GAAP diluted earnings per common share $ 0.20 $ 0.31 $ 0.36 $ 0.36 $ 0.45 $ 0.35 $ 1.03 $ 1.52 Per share impact of items above Non-GAAP diluted earnings per common share $ 0.26 $ 0.31 $ 0.36 $ 0.36 $ 0.50 $ 0.37 $ 1.09 $ 1.59 Reconciliation of GAAP Operating Margin to Non-GAAP GAAP operating revenue $ 106,015 $ 117,391 $ 124,042 $ 120,290 $ 143,604 $ 120,208 $ 437,104 $ 508,144 Non-GAAP adjustments noted above (4,406) (4,406) Adjusted operating revenue $ 106,015 $ 112,985 $ 124,042 $ 120,290 $ 143,604 $ 120,208 $ 432,698 $ 508,144 GAAP operating income $ 34,933 $ 51,854 $ 57,535 $ 56,452 $ 74,966 $ 52,679 $ 167,341 $ 241,632 Non-GAAP adjustments noted above 10,965 (2,402) ,709 8,562 4,162 Adjusted operating income $ 45,898 $ 49,452 $ 57,875 $ 56,565 $ 74,966 $ 56,388 $ 175,903 $ 245,794 Adjusted operating margin 43.3% 43.8% 46.7% 47.0% 52.2% 46.9% 40.7% 48.4% For further information go to cboe.com/investor Relations May not foot due to rounding and/or change in shares outstanding 41
42 GAAP to Non-GAAP Reconciliation For 2012 and 2013 GAAP to Non-GAAP Reconciliation (in thousands, except per share amounts) Reconciliation of GAAP Net Income Allocated to Common Stockholder to Non-GAAP 1Q12 2Q12 3Q12 4Q12 FY2012 1Q13 2Q13 3Q13 4Q13 FY2013 GAAP net income allocated to common stockholders $ 32,863 $ 37,903 $ 45,243 $ 39,246 $ 155,254 $ 41,789 $ 45,477 $ 40,955 $ 45,649 $ 173,863 Add: Accelerated stock-based compensation , ,996 Add: Estimated liability related to SEC investigation 5,000 5,000 1,000 1,000 Add: Impairment charge Income tax benefit/(expense) related to the items above (80) (63) (139) (1,311) (313) (1,611) Add: Income tax provision adjustment (7,654) (5,415) (13,054) Net income allocated to participating securities - effect on reconciling items (2) (29) (22) (46) Adjusted net income allocated to common stockholders $ 32,975 $ 37,903 $ 37,675 $ 38,921 $ 147,510 $ 43,874 $ 46,958 $ 40,955 $ 45,649 $ 177,447 Reconciliation of GAAP Diluted EPS to Non-GAAP GAAP diluted earnings per common share $ 0.37 $ 0.44 $ 0.52 $ 0.45 $ 1.78 $ 0.48 $ 0.52 $ 0.47 $ 0.52 $ 1.99 Per share impact of items above (0.09) (0.09) Non-GAAP diluted earnings per common share $ 0.37 $ 0.44 $ 0.43 $ 0.45 $ 1.69 $ 0.50 $ 0.54 $ 0.47 $ 0.52 $ 2.03 Reconciliation of GAAP Operating Margin to Non-GAAP GAAP operating revenue $ 121,392 $ 132,549 $ 128,319 $ 130,077 $ 512,338 $ 142,705 $ 150,772 $ 136,743 $ 141,830 $ 572,050 Non-GAAP adjustments noted above Adjusted operating revenue $ 121,392 $ 132,549 $ 128,319 $ 130,077 $ 512,338 $ 142,705 $ 150,772 $ 136,743 $ 141,830 $ 572,050 GAAP operating income $ 57,415 $ 66,069 $ 60,861 $ 59,752 $ 244,097 $ 69,430 $ 75,358 $ 68,427 $ 72,599 $ 285,814 Non-GAAP adjustments noted above 194 5,149 5,343 3,180 1,816 $ 4,996 Adjusted operating income $ 57,609 $ 66,069 $ 60,861 $ 64,901 $ 249,440 $ 72,610 $ 77,174 $ 68,427 $ 72,599 $ 290,810 Adjusted operating margin 47.5% 49.8% 47.4% 49.9% 48.7% 50.9% 51.2% 50.0% 51.2% 50.8% For further information go to cboe.com/investor Relations May not foot due to rounding and/or change in shares outstanding 42
43 GAAP to Non-GAAP Reconciliation For 2014 and 2015 YTD GAAP to Non-GAAP Reconciliation (in thousands, except per share amounts) Reconciliation of GAAP Net Income Allocated to Common Stockholder to Non-GAAP 1Q14 2Q14 3Q14 4Q14 FY2014 1Q15 2Q15 3Q15 4Q15 FY2015 GAAP net income allocated to common stockholders $ 48,528 $ 42,598 $ 48,146 $ 49,119 $ 188,392 $ 42,079 Add: Accelerated stock-based compensation 2,530 2,530 Add: Sevance expense related to outsourcing certain regulatory services 1,863 1,863 Add: Impairment charge 3,000 3, Add: Tax adjustment related to prior year 1,600 1,600 Income tax benefit/(expense) related to the items above (1,009) (2,005) (2,861) (142) Net income allocated to participating securities - effect on reconciling items (15) (20) (43) (3) Adjusted net income allocated to common stockholders $ 50,034 $ 42,598 $ 48,146 $ 53,557 $ 194,481 $ 42,299 $ - $ - $ - $ - Reconciliation of GAAP Diluted EPS to Non-GAAP GAAP diluted earnings per common share $ 0.56 $ 0.50 $ 0.57 $ 0.58 $ 2.21 $ 0.50 Per share impact of items above Non-GAAP diluted earnings per common share $ 0.58 $ 0.50 $ 0.57 $ 0.64 $ 2.28 $ 0.50 $ - $ - $ - $ - Reconciliation of GAAP Operating Margin to Non-GAAP GAAP operating revenue $ 157,885 $ 143,942 $ 148,910 $ 166,487 $ 617,225 $ 142,839 Non-GAAP adjustments noted above Adjusted operating revenue $ 157,885 $ 143,942 $ 148,910 $ 166,487 $ 617,225 $ 142,839 $ - $ - $ - $ - GAAP operating income $ 82,038 $ 69,716 $ 75,084 $ 86,962 $ 313,801 $ 69,553 Non-GAAP adjustments noted above 2,530 1,863 4,393 - Adjusted operating income $ 84,568 $ 69,716 $ 75,084 $ 88,825 $ 318,194 $ 69,553 $ - $ - $ - $ - Adjusted operating margin 53.6% 48.4% 50.4% 53.4% 51.6% 48.7% For further information go to cboe.com/investor Relations May not foot due to rounding and/or change in shares outstanding 43
44 Non-GAAP Information In addition to disclosing results determined in accordance with GAAP, CBOE Holdings has disclosed certain non-gaap measures of operating performance. The non-gaap measures provided in this presentation include core operating expenses, adjusted operating revenue, adjusted operating expenses, adjusted operating income, adjusted operating margin, adjusted effective tax rate, adjusted net income, adjusted net income allocated to common stockholders and adjusted diluted earnings per share. Management believes that the non-gaap financial measures presented in this presentation, including adjusted net income and core operating expenses, provide useful and comparative information to assess trends in our core operations and a means to evaluate period-to-period comparisons. Non-GAAP financial measures disclosed by management, including adjusted diluted EPS, are provided as additional information to investors in order to provide them with an alternative method for assessing our financial condition and operating results. These measures are not in accordance with, or a substitute for, GAAP, and may be different from or inconsistent with non- GAAP financial measures used by other companies. Core operating expenses is the company s operating expenses after excluding (i) volume-based expenses, (ii) depreciation and amortization expense, (iii) accelerated stock-based compensation expense and (iv) other unusual or one-time expenses. 44
45 CBOE 400 South LaSalle Street Chicago, Illinois
Second Quarter 2016 Earnings Presentation. July 29, 2016
 Second Quarter 2016 Earnings Presentation July 29, 2016 Agenda Strategic Review Financial Review Questions and Answers Edward Tilly Chief Executive Officer Alan Dean Executive Vice President, CFO and Treasurer
Second Quarter 2013 Earnings Presentation. August 2, 2013
 Second Quarter 2013 Earnings Presentation August 2, 2013 Agenda Strategic Review Financial Review Questions and Answers Edward Tilly Chief Executive Officer Alan Dean Executive Vice President, CFO and
Raymond James The 35 th Annual Institutional Investors Conference
 Raymond James The 35 th Annual Institutional Investors Conference Edward Tilly, CEO March 4, 2014 1 Forward-Looking Statements This presentation may contain forward-looking statements, within the meaning
Second Quarter 2012 Earnings Presentation. August 2, 2012
 Second Quarter 2012 Earnings Presentation August 2, 2012 Agenda Strategic Review William Brodsky Chairman and CEO Financial Review Alan Dean Executive Vice President, CFO and Treasurer Questions and Answers
Welcome Annual Meeting of Stockholders. Thursday, May 19, 2016
 Welcome 2016 Annual Meeting of Stockholders Thursday, May 19, 2016 William J. Brodsky Chairman Meeting Agenda Introduction of Board of Directors and Senior Executives Vote on Proposals Business Review
CBOE Holdings, Inc. Second Quarter Earnings Conference Call. CBOE Holdings, Inc.
 Second Quarter Earnings Conference Call A August t4 4, 2011 p. 1 Agenda Strategic Review Financial Review Questions and Answers William Brodsky Chairman and CEO Alan Dean Executive Vice President, CFO
First Quarter Earnings Conference Call May 1, 2012
 First Quarter Earnings Conference Call May 1, 2012 Agenda Strategic Review William Brodsky Chairman and CEO Financial Review Alan Dean Executive Vice President CFO and Treasurer Questions and Answers William
CBOE Press Breakfast at FIA Boca Raton, FL March 11, 2015
 CBOE Press Breakfast at FIA Boca Raton, FL March 11, 2015 Edward Tilly, Chief Executive Officer John Deters, Chief Strategy Officer Bill Speth, Vice President, Research 1 Forward-Looking Statements This
William J. Brodsky, Chairman and CEO CBOE Holdings, Inc Sandler O Neill Global Exchange & Brokerage Conference. June 8, 2012
 William J. Brodsky, Chairman and CEO 2012 Sandler O Neill Global Exchange & Brokerage Conference June 8, 2012 Forward Looking Statements This presentation may contain forward-looking statements, within
CBOE HOLDINGS, INC. Second Quarter 2015 Earnings Call - Prepared Remarks July 31, 2015 Debbie Koopman
 CBOE HOLDINGS, INC. Second Quarter 2015 Earnings Call - Prepared Remarks July 31, 2015 Debbie Koopman Good morning and thank you for joining us for our second quarter 2015 earnings conference call. On
Second Quarter 2018 Earnings Presentation. August 3, 2018
 Second Quarter 2018 Earnings Presentation August 3, 2018 1 Agenda Strategic Review Financial Review Edward Tilly Chairman and Chief Executive Officer Brian Schell Executive Vice President, CFO and Treasurer
Third Quarter 2017 Earnings Presentation. November 7, 2017
 Third Quarter 2017 Earnings Presentation November 7, 2017 Agenda Strategic Review Financial Review Questions and Answers Edward Tilly Chairman and Chief Executive Officer Alan Dean Executive Vice President,
CBOE Holdings, Inc. Reports Second Quarter 2011 Results; Diluted EPS of $0.36, Up 33 Percent
 CBOE Holdings, Inc. Reports Second Quarter 2011 Results; Diluted EPS of $0.36, Up 33 Percent Second Quarter Financial Highlights -- Operating Revenues Increase 7 Percent to $120.3 Million -- Net Income
CBOE Holdings, Inc. Reports First Quarter 2011 Results; Diluted EPS of $0.36, Up 44 Percent
 CBOE Holdings, Inc. Reports First Quarter 2011 Results; Diluted EPS of $0.36, Up 44 Percent Financial Highlights -- Operating Revenues Increase 23 Percent to $124.0 Million -- Net Income Allocated to Common
WELCOME 2017 Annual Meeting of Stockholders. May 18, 2017
 WELCOME 2017 Annual Meeting of Stockholders May 18, 2017 Edward Tilly Chairman and CEO Meeting Agenda Introduction of Board of Directors and Senior Executives Vote on Proposals Business Review and Update
CBOE HOLDINGS, INC. First Quarter 2011 Earnings Call Prepared Remarks May 5, Bill Brodsky, Chairman and CEO
 CBOE HOLDINGS, INC. First Quarter 2011 Earnings Call Prepared Remarks May 5, 2011 Bill Brodsky, Chairman and CEO I m very pleased to be here today to share outstanding results for the first quarter 2011
38 th Annual Institutional Investors Conference
 Raymond James 38 th Annual Institutional Investors Conference Edward Tilly, CEO March 6, 2017 Cautionary Statements Regarding Forward-Looking Information This presentation contains forward-looking statements
(NYSE: ICE) Second Quarter 2015 Earnings Presentation August 5, 2015
 Second Quarter 2015 Earnings Presentation August 5, 2015") (NYSE: ICE) Second Quarter 2015 Earnings Presentation August 5, 2015 Forward-Looking Statement and Legends CAUTIONARY STATEMENT REGARDING FORWARD LOOKING STATEMENTS This presentation may contain forward-looking
(NYSE: ICE) Second Quarter 2015 Earnings Presentation August 5, 2015 Forward-Looking Statement and Legends CAUTIONARY STATEMENT REGARDING FORWARD LOOKING STATEMENTS This presentation may contain forward-looking
Russell 2000 Index Options
 Interactive Brokers Webcast Russell 2000 Index Options April 20, 2016 Presented by Russell Rhoads, Senior Instructor Disclosure Options involve risks and are not suitable for all investors. Prior to buying
CBOE HOLDINGS, INC. Second Quarter 2011 Earnings Call Prepared Remarks August 4, 2011
 CBOE HOLDINGS, INC. Second Quarter 2011 Earnings Call Prepared Remarks August 4, 2011 Bill Brodsky, Chairman and CEO I m very pleased to be here today to share the outstanding results for CBOE Holdings
Sysco Earnings Results 2Q19
 Sysco Earnings Results 2Q19 FORWARD LOOKING STATEMENTS Statements made in this presentation or in our earnings call for the second quarter of fiscal 2019 that look forward in time or that express management
NYSE EURONEXT FIRST QUARTER 2013 EARNINGS PRESENTATION. April 30, 2013
 NYSE EURONEXT FIRST QUARTER 2013 EARNINGS PRESENTATION April 30, 2013 LEGAL DISCLAIMERS Non-GAAP Financial Measures To supplement NYSE Euronext s consolidated financial statements prepared in accordance
Earnings Presentation. Third Quarter 2017
 Earnings Presentation Third Quarter 2017 November 7, 2017 Disclaimer Cautionary Statement Regarding Forward Looking Statements This presentation may contain forward-looking statements made pursuant to
Forward-Looking Statement and Legends
 Forward-Looking Statement and Legends CAUTIONARY STATEMENT REGARDING FORWARD LOOKING STATEMENTS This presentation may contain forward-looking statements made pursuant to the safe harbor provisions of the
LEVERAGING OUR CORE EXPANDING OUR REACH Annual Report
 LEVERAGING OUR CORE EXPANDING OUR REACH 2015 Annual Report Creating Long-Term Shareholder Value CBOE Holdings and its Board of Directors are committed to a corporate mission and strategy, supported by
THIRD QUARTER FISCAL YEAR 2018 Earnings Conference Call & Presentation. August 7, 2018 at 9:00 a.m. CT (10:00 a.m. ET)
") THIRD QUARTER FISCAL YEAR 2018 Earnings Conference Call & Presentation August 7, 2018 at 9:00 a.m. CT (10:00 a.m. ET) 1 Third Quarter Fiscal Year 2018 Welcome to Nexeo s Earnings Conference Call and Presentation
THIRD QUARTER FISCAL YEAR 2018 Earnings Conference Call & Presentation August 7, 2018 at 9:00 a.m. CT (10:00 a.m. ET) 1 Third Quarter Fiscal Year 2018 Welcome to Nexeo s Earnings Conference Call and Presentation
Second Quarter & First Half 2016 Earnings Supplement
 Second Quarter & First Half 216 Earnings Supplement August 3, 216 Forward-Looking Statement and Legends CAUTIONARY STATEMENT REGARDING FORWARD LOOKING STATEMENTS This presentation may contain forward-looking
CME Group 2Q 2009 Earnings Conference Call. July 23, 2009
 CME Group 2Q 2009 Earnings Conference Call July 23, 2009 Forward-Looking Statements Statements in this press release that are not historical facts are forward-looking statements. These statements are not
FOURTH QUARTER AND FISCAL YEAR 2018 Earnings Conference Call & Presentation. December 6, 2018 at 9:00 a.m. CT (10:00 a.m. ET)
") FOURTH QUARTER AND FISCAL YEAR 2018 Earnings Conference Call & Presentation December 6, 2018 at 9:00 a.m. CT (10:00 a.m. ET) 1 Fourth Quarter & Fiscal Year 2018 Welcome to Nexeo s Earnings Conference Call
FOURTH QUARTER AND FISCAL YEAR 2018 Earnings Conference Call & Presentation December 6, 2018 at 9:00 a.m. CT (10:00 a.m. ET) 1 Fourth Quarter & Fiscal Year 2018 Welcome to Nexeo s Earnings Conference Call
4Q2011 Earnings Presentation
 4Q2011 Earnings Presentation 2 Notes & Disclaimers Discussion of Forward-Looking Statements by BGC Partners Information in this document contains forward-looking statements within the meaning of Section
MSCI THIRD QUARTER 2016
 MSCI THIRD QUARTER 2016 Earnings Presentation October 27, 2016 2016 MSCI Inc. All rights reserved. Please refer to the disclaimer at the end of this document. FORWARD-LOOKING STATEMENTS Forward-Looking
Thank you, Paul. And thanks to all of you for joining us for CBOE s 3 rd. Annual European Risk Management Conference.
 Edward Tilly CBOE Chief Executive Officer Risk Management Conference Europe Opening Remarks Thursday, September 4, 2014 9:00 9:30 a.m. Thank you, Paul. And thanks to all of you for joining us for CBOE
Beyond BXM Next Generation Option Strategy Benchmarks
 CBOE Risk Management Conference Europe Beyond BXM Next Generation Option Strategy Benchmarks William Speth, VP Research & Product Development September 28, 215 Forward Looking Statements This presentation
3Q18 Earnings Presentation. October 24, 2018
 3Q18 Earnings Presentation October 24, 2018 NASDAQ 3Q18 HIGHLIGHTS Driving Accelerating Growth, Creating Sustainable Value Nasdaq Net Revenues 3Q18 Revenue Growth 1 : +5% Organic Y-o-Y Non-Trading Segments
Sysco Fiscal 4Q15 and Fiscal 2015 Financial Results. August 10, 2015
 Sysco Fiscal 4Q15 and Fiscal 2015 Financial Results August 10, 2015 Forward-Looking Statements Statements made in this press release or in our earnings call for the third quarter of fiscal 2015 that look
Fourth-Quarter 2009 Earnings Presentation
 Fourth-Quarter 2009 Earnings Presentation Ursula Burns Chief Executive Officer Larry Zimmerman Vice Chairman & CFO January 21, 2010 Forward-Looking Statements This presentation contains "forward-looking
CME Group 3Q 2013 Earnings Conference Call. November 4, 2013
 CME Group 3Q 2013 Earnings Conference Call November 4, 2013 Forward-Looking Statements Statements in this presentation that are not historical facts are forward-looking statements. These statements are
Short Volatility Trading with Volatility Derivatives. Russell Rhoads, CFA
 Short Volatility Trading with Volatility Derivatives Russell Rhoads, CFA Disclosure Options involve risk and are not suitable for all investors. Prior to buying or selling an option, a person must receive
Third Quarter 2015 Earnings Call October 29, 2015
 Third Quarter 2015 Earnings Call October 29, 2015 Rob Wagman President & Chief Executive Officer Nick Zarcone Executive Vice President & Chief Financial Officer Joe Boutross Director, Investor Relations
CBOE Equity Market Volatility Indexes
 Interactive Brokers Webcast CBOE Equity Market Volatility Indexes March 26, 2014 Presented by Russell Rhoads, CFA Disclosure Options involve risks and are not suitable for all investors. Prior to buying
FINANCIAL RESULTS AND COMPANY OVERVIEW Second-Quarter Performance
 FINANCIAL RESULTS AND COMPANY OVERVIEW 08 Second-Quarter Performance September 5 th, 08 Disclaimer Forward-Looking Statements and Preliminary Results This presentation includes forward-looking statements
We Distribute Products That Deliver Energy to the World. NOW Inc., Fourth Quarter and Full-Year 2017 Review & Key Takeaways
 We Distribute Products That Deliver Energy to the World NOW Inc., Fourth Quarter and Full-Year 2017 Review & Key Takeaways Forward Looking Statements Statements made in the course of this presentation
Dean Foods. Earnings Report. February 11, 2009
 Dean Foods Fourth Quarter and Year End 2008 Earnings Report February 11, 2009 Forward Looking Statements The following statements made in this presentation are forward looking and are made pursuant to
NON-GAAP RECONCILIATIONS
 NON-GAAP RECONCILIATIONS IMPACT OF CERTAIN ITEMS Impact of Certain Items and Brakes Sysco s results of operations for fiscal 2018 are impacted by restructuring costs consisting of (1) expenses associated
IntercontinentalExchange First Quarter 2011 Earnings Presentation
 IntercontinentalExchange First Quarter 2011 Earnings Presentation May 4, 2011 Forward-Looking Statement Forward-Looking Statements Information set forth in this communication contains forward-looking statements
Marvell Technology Group Ltd. Third Quarter of Fiscal Year 2018 November 28, 2017
 Marvell Technology Group Ltd Third Quarter of Fiscal Year 2018 November 28, Forward-Looking Statements under the Private Securities Litigation Reform Act of 1995 This press release contains forward-looking
MSCI. J.P. Morgan Global High Yield & Leveraged Finance Conference Kathleen Winters, CFO. February 28, 2017
 MSCI J.P. Morgan Global High Yield & Leveraged Finance Conference Kathleen Winters, CFO February 28, 2017 2017 MSCI Inc. All rights reserved. Please refer to the disclaimer at the end of this document.
MIC. Fourth Quarter 2017 Earnings Conference Call Support Slides. February 2018
 MIC Fourth Quarter 2017 Earnings Conference Call Support Slides February 2018 Disclaimer This presentation by Macquarie Infrastructure Corporation (MIC) is proprietary and all rights are reserved. Any
Earnings Presentation. Fourth Quarter 2017
 Earnings Presentation Fourth Quarter 207 February 8, 208 Disclaimer Cautionary Statement Regarding Forward Looking Statements This presentation may contain forward-looking statements made pursuant to the
2016 Fourth-Quarter and Fiscal Year Performance
 206 Fourth-Quarter and Fiscal Year Performance Financial Results and Company Highlights March 4, 207 Disclaimers Forward-Looking Statements and Preliminary Results This presentation includes forward-looking
Earnings Webcast & Conference Call
 August 9, 2016 Earnings Webcast & Conference Call Fourth Quarter and Fiscal Year 2016 2014 1 Forward-Looking Statements This presentation and other written or oral statements made from time to time by
Autobytel Q Results Presentation. May 4, 2017
 Autobytel Q1 2017 Results Presentation May 4, 2017 Safe Harbor Statement and Non-GAAP Disclosures The statements made in the accompanying conference call or contained in this presentation that are not
Dean Foods First Quarter 2014 Earnings Report. May 8, 2014
 Dean Foods First Quarter 2014 Earnings Report May 8, 2014 1 The following statements made in this presentation are forward-looking and are made pursuant to the safe harbor provision of the Private Securities
Big Walnut Local School District
 Big Walnut Local School District Monthly Financial Report for the month ended September 30, 2013 Prepared By: Felicia Drummey Treasurer BIG WALNUT LOCAL SCHOOL DISTRICT SUMMARY OF YEAR TO DATE FINANCIAL
Q1 FY17 Financial Results
 Q1 FY17 Financial Results August 2, 2016 1 Forward-Looking Statements and Non-GAAP Financial Measures This presentation contains forward-looking statements, as that term is defined under the federal securities
CME Group 3Q 2015 Earnings Conference Call
 CME Group 3Q 2015 Earnings Conference Call October 29, 2015 Forward Looking Statements Statements in this presentation that are not historical facts are forward-looking statements. These statements are
Dividend Income Strategy. 999 Vanderbilt Beach Road, Suite 102 Naples, Florida V:
 Dividend Income Strategy 3/31/2018 999 Vanderbilt Beach Road, Suite 102 Naples, Florida 34108 V: 866-459-9998 10 Executive Summary Experienced Specialists Since it s inception on October 1 st, 2007,The
INTERCONTINENTAL EXCHANGE. Earnings Supplement May 3, 2017
 INTERCONTINENTAL EXCHANGE 1Q17 Earnings Supplement INTERCONTINENTAL EXCHANGE 1Q17 Earnings May 3, 217 Supplement May 3, 217 Forward-Looking Statement and Legends CAUTIONARY STATEMENT REGARDING FORWARD
Forward-Looking Statement and Legends
 Forward-Looking Statement and Legends CAUTIONARY STATEMENT REGARDING FORWARD LOOKING STATEMENTS This presentation may contain forward-looking statements made pursuant to the safe harbor provisions of the
Fourth Quarter 2014 Earnings Conference Call. 26 November 2014
 Fourth Quarter 2014 Earnings Conference Call 26 November 2014 Safe Harbor Statement & Disclosures The earnings call and accompanying material include forward-looking comments and information concerning
27 July 2018 Interim Results
 27 July 2018 Interim Results for the half year ended 30 June 2018 Disclaimer This presentation may contain forward-looking statements, including forward-looking statements within the meaning of the United
4Q 2017 Investor Presentation
 4Q 2017 Investor Presentation Forward-Looking Statements This presentation, including the accompanying oral presentation (collectively, this presentation ), does not constitute an offer to sell or the
Investor Teleconference Presentation Fourth Quarter Fastenal Company January 17, 2018
 Investor Teleconference Presentation Fourth Quarter 2017 Fastenal Company January 17, 2018 1 Safe Harbor Statement All statements made herein that are not historical facts (e.g., goals regarding Onsite
CBOE Volatility Index and VIX Futures Trading
 CBOE Volatility Index and VIX Futures Trading Russell Rhoads, CFA Disclosure In order to simplify the computations, commissions have not been included in the examples used in these materials. Commission
1Q18 Earnings Presentation. April 25, 2018
 1Q18 Earnings Presentation April 25, 2018 NASDAQ 1Q18 HIGHLIGHTS¹ Driving Accelerating Growth, Creating Sustainable Value Nasdaq Net Revenues 1Q18 Revenue Growth: +9% Organic Y-o-Y Information Services
Sysco Earnings Results 3Q18
 Sysco Earnings Results 3Q18 FORWARD LOOKING STATEMENTS Statements made in this presentation or in our earnings call for the third quarter of fiscal 2018 that look forward in time or that express management
FIRST SOLAR Q3 16 EARNINGS CALL
 FIRST SOLAR Q3 16 EARNINGS CALL IMPORTANT INFORMATION Forward Looking Statements This presentation contains forward-looking statements which are made pursuant to the safe harbor provisions of the Private
Sysco 2Q16 Earnings Results. February 1, 2016
 Sysco 2Q16 Earnings Results February 1, 2016 Forward-Looking Statements Statements made in this presentation or in our earnings call for the second quarter of fiscal 2016 that look forward in time or that
2018 SECOND QUARTER FINANCIAL RESULTS
 2018 SECOND QUARTER FINANCIAL RESULTS July 30, 2018 0 SAFE HARBOR STATEMENT The 2018 second quarter news release, conference call webcast, and the following slides contain forward-looking statements. The
Fiscal Year 2018 Project 1 Annual Budget
 Fiscal Year 2018 Project 1 Annual Budget Table of Contents Table Page Summary 3 Summary of Costs Table 1 4 Treasury Related Expenses Table 2 5 Summary of Full Time Equivalent Table 3 6 Positions Cost-to-Cash
Investor Teleconference Presentation Third Quarter Fastenal Company October 10, 2018
 Investor Teleconference Presentation Third Quarter 2018 Fastenal Company October 10, 2018 1 Safe Harbor Statement All statements made herein that are not historical facts (e.g., goals regarding Onsite
Fourth Quarter & Full Year 2016 Earnings Call
 Fourth Quarter & Full Year 2016 Earnings Call February 23, 2017 Rob Wagman President & Chief Executive Officer Nick Zarcone Executive Vice President & Chief Financial Officer Joe Boutross Director, Investor
Weeklys Options and Short Term Strategies. Russell A. Rhoads, CFA
 SM Weeklys Options and Short Term Strategies Russell A. Rhoads, CFA CBOE Disclaimer Options involve risks and are not suitable for all investors. Prior to buying or selling options, an investor must receive
Option Strategies for a Long-Term Outlook
 Option Strategies for a Long-Term Outlook Interactive Brokers Webcast June 20, 2018 Russell Rhoads, CFA Disclosure Options involve risk and are not suitable for all investors. Prior to buying or selling
2017 Third Quarter Results. Maracay Homes Pardee Homes Quadrant Homes Trendmaker Homes TRI Pointe Homes Winchester Homes
 2017 Third Quarter Results Maracay Homes Pardee Homes Quadrant Homes Trendmaker Homes TRI Pointe Homes Winchester Homes Forward Looking Statement Various statements contained in this presentation, including
3Q 2017 Earnings Call November 10, :00am ET
 2017 Earnings Call November 10, 2017 8:00am ET 1 Safe Harbor Statement Certain statements made within this presentation contain forward-looking statements, within the meaning of the Private Securities
2018 Second Quarter Earnings Call. May 8, 2018
 2018 Second Quarter Earnings Call May 8, 2018 Forward Looking Statements / Non-GAAP Measures This presentation contains information about management's view of the Company's future expectations, plans and
Q3 FY 18 Financial Results
 Q3 FY 18 Financial Results February 6, 2018. Forward-Looking Statements and Non-GAAP Financial Measures This presentation contains forward-looking statements, as that term is defined under the federal
Second-Quarter 2009 Earnings Presentation
 Second-Quarter 2009 Earnings Presentation Ursula Burns Chief Executive Officer Larry Zimmerman Vice Chairman & CFO July 23, 2009 Forward-Looking Statements This presentation contains "forward-looking statements"
2Q15 Earnings August 2015
 2Q15 Earnings August 2015 Forward-Looking Statements The statements contained in this presentation that refer to plans and expectations for the next quarter, the full year or the future are forward-looking
Citigroup Annual EMT Conference DAN SCHULMAN, CEO
 Citigroup Annual EMT Conference DAN SCHULMAN, CEO January 8, 2009 PRESENTATION OF FINANCIAL INFORMATION AND FORWARD-LOOKING STATEMENTS The following presentation contains certain forward-looking statements
Alphabet Announces First Quarter 2018 Results
 Alphabet Announces First Quarter 2018 Results MOUNTAIN VIEW, Calif. April 23, 2018 Alphabet Inc. (NASDAQ: GOOG, GOOGL) today announced financial results for the quarter ended. "Our ongoing strong revenue
2017 First Quarter Results. Maracay Homes Pardee Homes Quadrant Homes Trendmaker Homes TRI Pointe Homes Winchester Homes
 217 First Quarter Results Maracay Homes Pardee Homes Quadrant Homes Trendmaker Homes TRI Pointe Homes Winchester Homes Forward Looking Statement Various statements contained in this presentation, including
Marvell Technology Group Ltd. Third Quarter of Fiscal Year 2019 December 4, 2018
 Marvell Technology Group Ltd Third Quarter of Fiscal Year 2019 December 4, 1 Forward-Looking Statements under the Private Securities Litigation Reform Act of 1995 This document and the accompanying press
Lincoln Electric Holdings, Inc. Q Earnings Conference Call October 25, 2018
 Lincoln Electric Holdings, Inc. Q3 2018 Earnings Conference Call October 25, 2018 Christopher L. Mapes Chairman, President & Chief Executive Officer Vincent K. Petrella Executive Vice President & Chief
Marvell Technology Group Ltd. First Quarter of Fiscal Year 2019 May 31, 2018
 Marvell Technology Group Ltd First Quarter of Fiscal Year 2019 May 31, Forward-Looking Statements under the Private Securities Litigation Reform Act of 1995 This document and the accompanying press release
Safe Harbor and Non-GAAP Measures
 Safe Harbor and Non-GAAP Measures Forward-Looking Statements This presentation contains forward-looking statements. All statements other than statements of historical fact included in this presentation
Q3 and Nine Months 2018 Results. October 2018
 Q3 and Nine Months 2018 Results October 2018 1 SAFE HARBOR STATEMENT Forward Looking Statements In addition to historical information, this earnings presentation contains "forward-looking" statements that
Executive Summary. July 17, 2015
 Executive Summary July 17, 2015 The Revenue Estimating Conference adopted interest rates for use in the state budgeting process. The adopted interest rates take into consideration current benchmark rates
MSCI Reports Financial Results for First Quarter 2018
 MSCI Reports Financial Results for First Quarter 2018 New York May 3, 2018 MSCI Inc. (NYSE: MSCI), a leading provider of indexes and portfolio construction and risk management tools and services for global
Financial Results: Fourth Quarter & Fiscal October 24, 2017
 Financial Results: Fourth Quarter & Fiscal 2017 October 24, 2017 Safe Harbor SAFE HARBOR Statements and information included in this presentation by Schnitzer Steel Industries, Inc. (the "Company") that
Introduction to VIX Futures. Russell Rhoads, CFA Instructor The Options Institute
 Introduction to VIX Futures Russell Rhoads, CFA Instructor The Options Institute CBOE Disclaimer Options and futures involve risks and are not suitable for all investors. Prior to buying or selling options,
Second Quarter 2017 Financial Results August 3, 2017
 Second Quarter 2017 Financial Results August 3, 2017 Trademark of Trinseo S.A. or its affiliates Introductions & Disclosure Rules Introductions Chris Pappas, President & CEO Barry Niziolek, Executive Vice
MSCI Reports Financial Results for Fourth Quarter and Full-Year 2018
 MSCI Reports Financial Results for Fourth Quarter and Full-Year 2018 New York January 31, 2019 MSCI Inc. (NYSE: MSCI), a leading provider of indexes and portfolio construction and risk management tools
CBOE HOLDINGS REPORTS FEBRUARY 2015 TRADING VOLUME
 News Release For Immediate Release CBOE HOLDINGS REPORTS FEBRUARY TRADING VOLUME ADV of 4.7 Million Contacts Down 13 vs uary Total Volume of 88.5 Million Contracts Traded CHICAGO, IL -- March 2, -- CBOE
Growth Stock Conference June 11,
 William Blair Growth Stock Conference June 11, 2009 www.theice.com FORWARD-LOOKING STATEMENTS Forward-Looking Statements This presentation may contain forward-looking statements made pursuant to the safe
Lincoln Electric Holdings, Inc. Fourth Quarter & Full Year 2018 Earnings Conference Call February 14, 2019
 Lincoln Electric Holdings, Inc. Fourth Quarter & Full Year 2018 Earnings Conference Call February 14, 2019 Christopher L. Mapes Chairman, President & Chief Executive Officer Vincent K. Petrella Executive
INC Research Q4 & Full Year 2016 Financial Results. February 28, 2017
 INC Research Q4 & Full Year 2016 Financial Results February 28, 2017 Forward Looking Statements & Non-GAAP Financial Measures Forward-Looking Statements Except for historical information, all of the statements,
Invesco Reports Results for the Three Months and Year Ended December 31, 2018
 Press Release For immediate release Brandon Burke, Investor Relations Graham Galt, Media Relations 404-439-3468 404-439-3070 Invesco Reports Results for the Three Months and Year Ended December 31, 2018
CBOE HOLDINGS, INC. First Quarter 2013 Earnings Call - Prepared Remarks Friday, May 3, Debbie Koopman
 CBOE HOLDINGS, INC. First Quarter 2013 Earnings Call - Prepared Remarks Friday, May 3, 2013 Debbie Koopman Good morning and thank you for joining us for our first quarter earnings conference call. On the