August 26 th, 2010 FIRST HALF RESULTS. Mr Jean Paul AGON Chief Executive Officer
|
|
|
- Hortense Price
- 5 years ago
- Views:
Transcription

1 August 26 th, 2010 FIRST HALF RESULTS Mr Jean Paul AGON Chief Executive Officer 26/08/2010


2 I. The Cosmetics Market has picked up well 26/08/2010

3 Worldwide Cosmetics Market 1 st half 2010* Sell in (shipments) ~_ + % * *excluding soaps and toothpastes. 1st half 2010 provisional estimate Source: L Oréal estimates. Excluding exchange rate impact 26/08/2010
4 Worldwide cosmetics market* Estimates ** Sell in 1 st Half 2010 (shipments) Western Europe % North America % Japan 1.3 % New Markets excl. Japan TOTAL % % *excluding soaps and toothpastes 1 st half 2010 provisional estimate **L Oréal estimates. Excluding exchange rate impact 26/08/2010
5 Cosmetic markets in the New Markets zone excluding Japan* Estimates** Sell in 1 st Half 2010 (shipments) Asia Pacific excl. Japan % Latin America % Africa, Middle East % Eastern Europe % TOTAL % *excluding soaps and toothpastes 1 st half 2010 provisional estimate **L Oréal estimates. Excluding exchange rate impact 26/08/2010

6


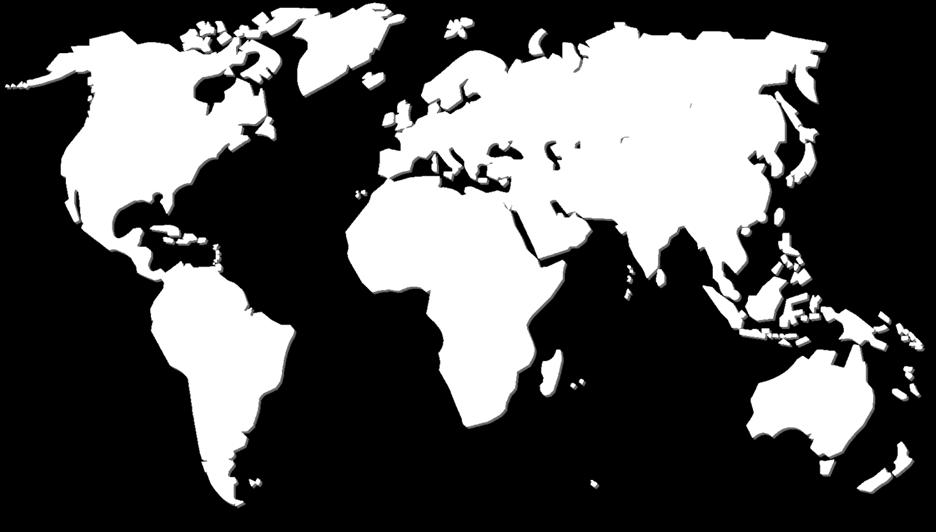
7 53 % OF THE WORLDWIDE MARKET 87 % OF WORLDWIDE MARKET GROWTH


8

9 Worldwide cosmetics market* Estimates** % % 2009 S *excluding soaps and toothpastes 1 st half 2010 provisional estimate **L Oréal estimates. Excluding exchange rate impact 26/08/2010
10 II. The upturn in organic growth bears out our major strategic choices 26/08/2010


11 Consolidated sales growth First half 2010 Impact of changes in consolidation Exchange rate impact Like for like % % % BASED ON REPORTED FIGURES % 26/08/2010
12 Consolidated sales at end June 2010 GROWTH (%) Like for like Professional Products % Consumer Products % Luxury Products % Active Cosmetics % COSMETICS TOTAL % On January 1 st, 2010, Roger & Gallet has been transferred from the Luxury Products Division to the Active Cosmetics Division. The figures for the first half 2009 and full year 2009 have been restated to take into account these changes. 26/08/2010
13 Cosmetic Sales by geographic zone at end June 2010 Like for like Western Europe % North America % New Markets % COSMETICS % On January 1, 2010: The travel retail business of YSL Beauté, which was previously recorded 100% under Western Europe, has now been broken down between the Western Europe, North America and New Markets zones. The Rest of the World zone has become the New Markets zone with the following distribution: Australia, India and New Zealand, which were previously in the Africa, Orient, Pacific zone have been included in the Asia zone which has become the Asia, Pacific zone. The Africa, Orient, Pacific zone has become the Africa, Middle East zone. The figures for the first half 2009 and full year 2009 have been restated to take into account these changes. 26/08/2010
14 Cosmetics sales by business segments at end June st HALF 2010 Like for like Skincare % Haircare % Make up % Hair colourants % Fragrances % Hygiene + Other % COSMETIC % 26/08/2010
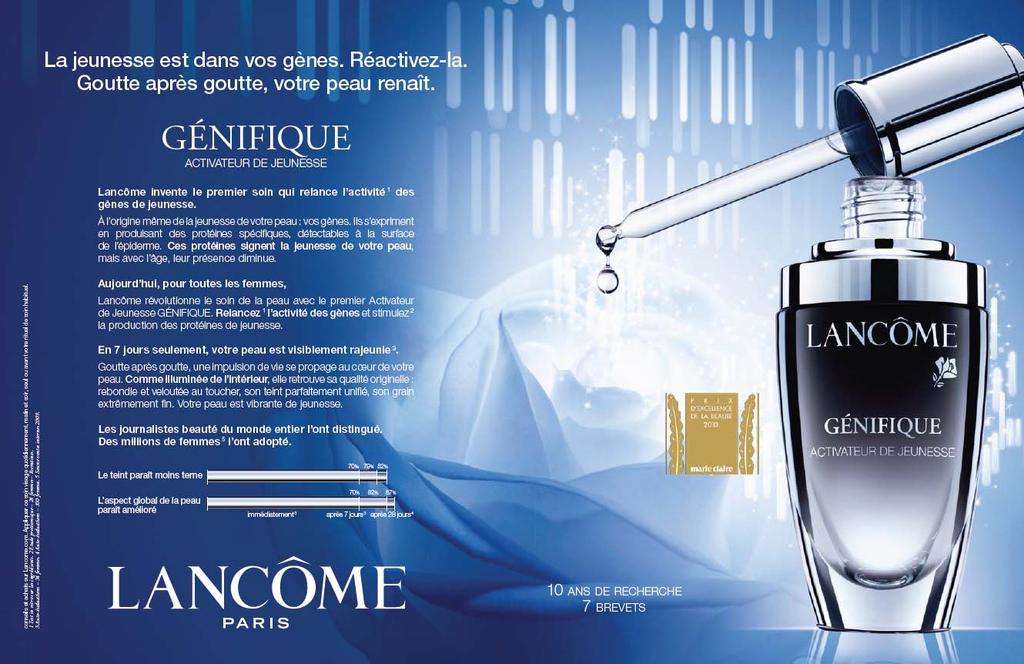
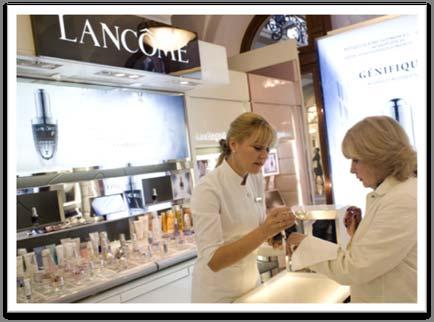
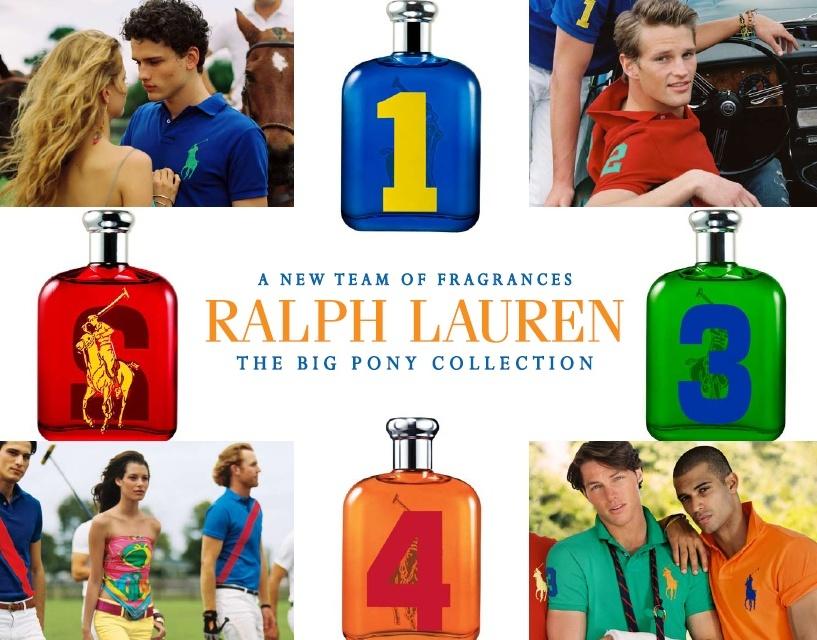
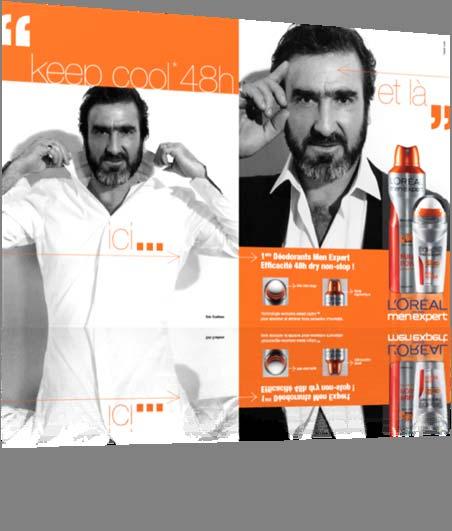
15 Concentrating on high value added worldwide innovations at accessible prices Breakthroughs in new product categories Accelerating international expansion Increasing investments in R&D and advertising and promotion /08/2010


16 26/08/2010


17


18
19


20

21

22

23

24

25

26

27

28

29

30

31
32

33

34


35
36 Concentrating on high value added worldwide innovations at accessible prices Breakthroughs in new product categories Accelerating international expansion Increasing investments in R&D and advertising and promotion /08/2010


37


38


39

40


41

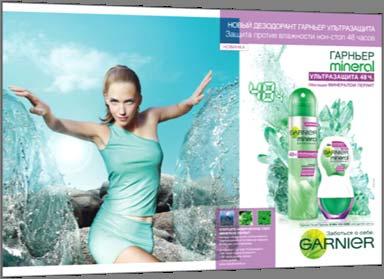

42 Publicités à compléter
43 Concentrating on high value added worldwide innovations at accessible prices Breakthroughs in new product categories Accelerating international expansion Increasing investments in R&D and advertising and promotion /08/2010

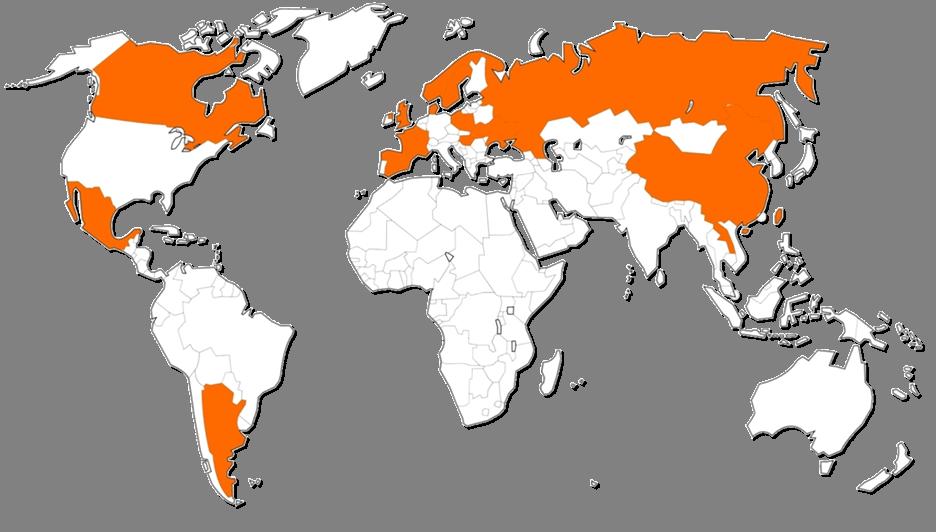
44 CHINA % Cosmetic sales Like for like growth

45 BRAZIL % Cosmetic sales Like for like growth

46 RUSSIA % Cosmetic sales Like for like growth


47 INDIA % Cosmetic sales Like for like growth

48

49 MEXICO % Cosmetic sales Like for like growth 26/08/2010

50 SOUTH KOREA % Cosmetic sales Like for like growth 26/08/2010

51 ARGENTINA ,1 % Cosmetic sales Like for like growth 26/08/2010


52 UKRAINE % Cosmetic sales Like for like growth 26/08/2010

53 INDONESIA % Cosmetic sales Like for like growth 26/08/2010

54 PHILIPPINES % Cosmetic sales Like for like growth 26/08/2010
55 Concentrating on high value added worldwide innovations at accessible prices Breakthroughs in new product categories Accelerating international expansion Increasing investments in R&D and advertising and promotion /08/2010
56 R&D expenses (in millions of euros) 1 st half st half 2010 R&D EXPENSES % 26/08/2010


57 INNOVATION 26/08/2010

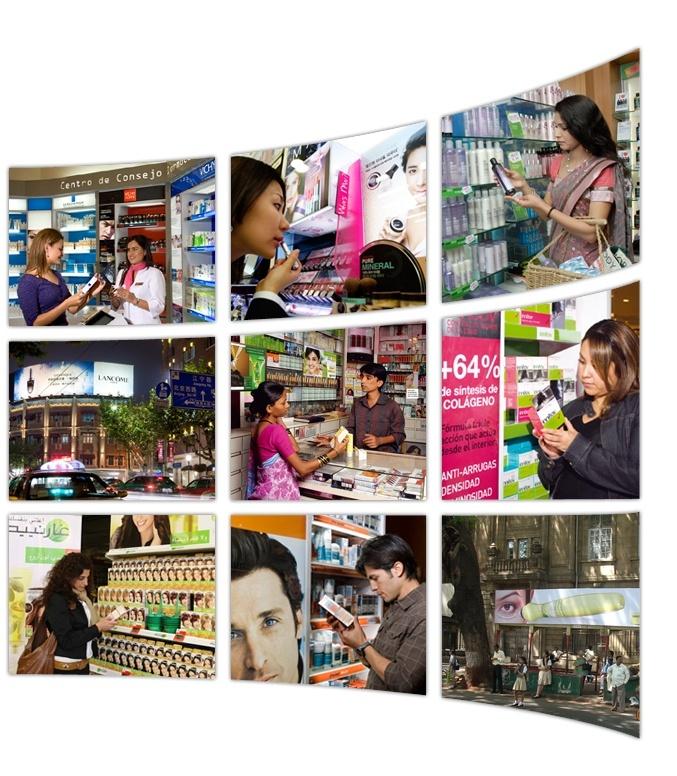
58 UNIVERSALISATION 26/08/2010

59
60 Advertising & Promotion expenses (in millions of euros) 1 st half st half 2010 ADVERTISING & PROMOTION EXPENSES (in millions of euros) % 26/08/2010
61 Continue to increase advertising & promotional investments Optimise their costs and productivity 26/08/2010
62 Concentrating on high value added worldwide innovations at accessible prices Breakthroughs in new product categories Accelerating international expansion Increasing investments in R&D and advertising and promotion /08/2010


63 26/08/2010


64


65


66


67


68


69
70 III. Strong increase in Results in terms of value and quality 26/08/2010


71 CENTRALISATION AND STRATEGISATION IN PURCHASING IMPROVEMENT IN INDUSTRIAL PRODUCTIVITY MODERNISATION AND OPTIMISATION OF THE SUPPLY CHAIN
72 Gross profit (as % of sales) 1 st half st half 2010 GROSS PROFIT (as % of sales) 70.2 % 71.3 % basis points 26/08/2010
73 Selling general and administrative expenses (as % of sales) 1 st half st half 2010 SELLING GENERAL AND ADMINISTRATIVE EXPENSES (as % of sales) 21.3 % 20.3 % 100 basis points 26/08/2010
74 Advertising & Promotion expenses (as % of sales) 1 st half st half 2010 ADVERTISING & PROMOTION EXPENSES (as % of sales) 30.0 % 30.5 % + 50 basis points 26/08/2010
75 Operating profitability (as % of sales) 1 st half st half 2010 OPERATING PROFITABILITY (as % of sales) 15.7 % 17.3 % basis points 26/08/2010
76 Operating net cash (in millions of euros) 1 st half st half 2010 OPERATING NET CASH (in millions of euros) , % 26/08/2010

77 Gearing 1 st half 2009 Full year st half 2010 GEARING* 32.0 % 14.4 % 11.7 % * Net debt / shareholders equity group share 26/08/2010

78


79 OUR AMBITION 1 BILLION NEW CONSUMERS

80
81 Thierry Prevot Group General Manager, Financial Communications Tel.: Fax: tprevot@dgaf.loreal.com finance.com Caroline Millot Head of Investors Relations Tel.: Fax: cmillot@dgaf.loreal.com Avertissement / Disclaimer "This document does not constitute an offer to sell, or a solicitation of an offer to buy, L Oréal shares. If you wish to obtainmore comprehensive information about L Oréal, please refer to the public documents registered in France with the Autorité des Marchés Financiers (which are also available in English on our Internet site: finance.com).this document may contain some forward looking statements. Although the Company considers that these statements are based on reasonable hypotheses at the date of publication of this release, they are by their nature subject to risks and uncertainties which could cause actual results to differ materially from those indicated or projected in these statements."
CA Cheuvreux Autumn Conference. Mr Jean Paul AGON Chief Executive Officer. September 30 th, September 30th,
 CA Cheuvreux Autumn Conference September 30 th, 2010 Mr Jean Paul AGON Chief Executive Officer September 30th, 2010 1 A few figures 1 st cosmetics group worldwide 23 international brands 17.5 billion euros
2010 Half year Results
 2010 Half year Results Thursday, August 26 th 2010 M. Christian MULLIEZ Executive Vice President Administration & Finance Consolidated group sales at the end of June 2010 8,77 Bn 9,67 Bn Growth at constant
KEPLER CHEUVREUX. Jean-Paul AGON. Chairman and CEO. September 18 th 2014
 KEPLER CHEUVREUX September 18 th 2014 Jean-Paul AGON Chairman and CEO AGENDA Our fundamentals A solid but contrasted first half 2014 An unusual year for the cosmetics market Confidence for the future 2
Growth of pre-tax profit of consolidated companies
 Growth of pre-tax profit of consolidated companies 1985-2004 1985 + 11.0 % 1995 + 10.0 % 1986 + 15.7 % 1996 + 12.7 % 1987 + 16.9 % 1997 + 17.0 % 1988 + 24.6 % 1998 + 13.1 % 1989 + 17.1 % 1999 + 15.0 %
1st HALF 2008 RESULTS STRONG GROWTH IN RESULTS AT CONSTANT EXCHANGE RATES*:
 Clichy, Thursday, 28 th August 2008 6 p.m. 1st HALF 2008 RESULTS STRONG GROWTH IN RESULTS AT CONSTANT EXCHANGE RATES*: NET EARNINGS PER SHARE**: +12.3% (+8.5% based on reported figures) NET PROFIT**: +10.1%
Exane BNP Paribas 12th European Seminar Paris June 10th, Mr. Christian MULLIEZ Executive Vice-President Administration & Finance
 12th European Seminar Paris June 10th, 2010 Mr. Christian MULLIEZ Executive Vice-President Administration & Finance Agenda 1. Key figures full year 2009 and first quarter 2010 2. Update on the worldwide
Mr Christian MULLIEZ Executive Vice President, Administration & Finance. Annual General Meeting April 27 th, 2010
 Mr Christian MULLIEZ Executive Vice President, Administration & Finance Annual General Meeting 1 2009 consolidated group sales 17 542 17 473 Growth at constant exchange rates + 0.8 % Of which : Like for
CA Cheuvreux Autumn Conference
 CA Cheuvreux Autumn Conference September 26 th, 2011 Mr Jean-Paul Agon Chairman & Chief Executive Officer CA Cheuvreux 31 août 2011 Autumn Conference 26 th September 2011 Key figures 1 st cosmetics group
2014 Annual Results. Friday, February 13 th Mr. Christian Mulliez Executive Vice-President Chief Financial Officer
 2014 Annual Results Friday, February 13 th 2015 Mr. Christian Mulliez Executive Vice-President Chief Financial Officer 2014 consolidated group sales 22.12Bn 22.53Bn Growth at constant exchange rates +4.1%
2014 Half-year Results
 2014 Half-year Results August 1 st 2014 Mr. Christian Mulliez Executive Vice-President Chief Financial Officer Consolidated group sales at the end of June 2014 11.34Bn 11.17Bn Growth at constant exchange
2004 Results. Mr. Lindsay OWEN-JONES February 17 th. 2005
 2004 Results Mr. Lindsay OWEN-JONES February 17 th. 2005 Growth of pre-tax profit of consolidated companies 1985-2004 1985 + 11.0 % 1995 + 10.0 % 1986 + 15.7 % 1996 + 12.7 % 1987 + 16.9 % 1997 + 17.0 %
2016 Annual Results. Mr. Christian Mulliez. February 10 th, Chief Financial Officer
 2016 Annual Results February 10 th, 2017 Mr. Christian Mulliez Chief Financial Officer 2016 consolidated group sales (in million euros) 25 257 25 837 Growth at constant exchange rates +5.1% Of which: like-for-like
Strong pace of growth continues: +6.6% 1 combined with quality results
 Strong pace of growth continues: +6.6% 1 combined with quality results Sales: 13.39 billion euros o +6.6% like-for-like 1 o +7.0% at constant exchange rates o -0.2% based on reported figures Double-digit
Deutsche Bank Access Asia Conference
 Deutsche Bank Access Asia Conference 30 th May 2012 - Singapore Thierry Prévot Group General Manager, Financial Communications & Strategic Prospective Analysis Agenda 1. L OREAL Strategic Highlights 2.
2017 HALF-YEAR RESULTS
 2017 HALF-YEAR RESULTS Mr. Christian Mulliez Chief Financial Officer Consolidated group sales at the end of June 2017 12.89Bn Reported 13.41Bn Growth at constant exchange rates +4.3% external growth impact
Annual General Meeting
 Annual General Meeting 17 th April 2017 Mr Christian Mulliez Chief Financial Officer 2017 consolidated group sales 25.84Bn Reported 26.02Bn Like-for-like growth +4.8% external growth impact +0.9% TBS disposal
2018 Half-year results
 2018 Half-year results Mr Christian Mulliez Chief Financial Officer Consolidated sales at the end of June 2018 13.41Bn 13.39Bn Growth at constant exchange rates +7.0% Of which: Like-for-like growth +6.6%
Global Construction 2030 Expo EDIFICA 2017 Santiago Chile. 4-6 October 2017
 Global Construction 2030 Expo EDIFICA 2017 Santiago Chile 4-6 October 2017 Graham Robinson Global Construction Perspectives Global Construction 2030 is the fourth in a series of global studies of the construction
Group results over one, five and ten years
 L Oréal financial highlights Group results over one, five and ten years CONSOLIDATED SALES 2008 CONSOLIDATED SALES BY CURRENCY (1) (as %) 17,542 17,063 15,790 14,533 13,641 2004 2005 2006 2007 2008 2.7%
Long-term sustained growth of the cosmetics market. Ability to grow sustainably faster than the market
 1 Long-term sustained growth of the cosmetics market 2 Ability to grow sustainably faster than the market 3 Ability to improve margins for increasingly profitable growth 4 Ability to boost cash flows regularly
2017 Annual Results. 9 February M. Christian MULLIEZ. Chief Financial Officer
 2017 Annual Results M. Christian MULLIEZ Chief Financial Officer 2017 consolidated group sales (in million euros) 25.84Bn Reported 26.02Bn Like-for-like growth +4.8% external growth impact +0.9% TBS disposal
H A L F Y E A R R E S U L T S 30 th June P r e s e n t a t i o n of Mr. C h r i s t i a n M U L L I E Z
 H A L F Y E A R R E S U L T S 30 th June 2004 P r e s e n t a t i o n of Mr. C h r i s t i a n M U L L I E Z Consolidated group sales at the end of June, 2004 (in billions of euros) 7.14 7.4 Growth Like-for-like
L Oréal financial highlights
 L Oréal financial highlights KEY GROUP FIGURES Breakdown of share ownership as at December 31 st 2003 Mrs Bettencourt and her family 51% Gesparal (1) L Oréal 53.8% Gesparal Nestlé 100% 42.3% Public 3.9%
2008 Annual Results IN A DIFFICULT ENVIRONMENT, L'ORÉAL IS PROVING RESILIENT AND CONTINUES TO GROW
 Clichy, February 16th, 2009 at 6:15 pm 2008 Annual Results IN A DIFFICULT ENVIRONMENT, L'ORÉAL IS PROVING RESILIENT AND CONTINUES TO GROW Increase in Sales to 17.542 billion euros + 2.8% based on reported
THIRD QUARTER 2017 OCTOBER 2017
 THIRD QUARTER 2017 OCTOBER 2017 DISCLAIMER Certain information contained in this document, other than historical information, may constitute forward-looking statements or unaudited financial forecasts.
Interim results. for the half-year ended 30 September 2010
 Interim results for the half-year ended 30 September 2010 Agenda Results Highlights Strategic Review and Future Prospects 2 1. Results Highlights (million ) Net sales Operating profit Net profit 1 400
Global Economy is Expected to Grow by 3.4 % in 2016 GDP growth in 2016, %
 Russia Brazil Mexico Rest of Latin America Rest of Eastern Europe Middle East and Africa Global Economy is Expected to Grow by 3.4 % in 216 GDP growth in 216, % 9 8 7 6 5 4 3 2 1-1 -2-3 -4 North America
2017 PhRMA Annual Membership Survey
 2017 PhRMA Annual Membership Survey DEFINITION OF TERMS as well as developmental activities carried on Research and Development (R&D) Expenditure Definitions or supported in the pharmaceutical, biological,
PhRMA Annual Membership Survey
 PhRMA Annual Membership Survey DEFINITION OF TERMS Research and Development Expenditure Definitions R&D Expenditures: Expenditures within PhRMA member companies US and/or foreign research laboratories
Exchange Traded Funds (ETFs): The New Packaged Product of Choice
: The New Packaged Product of Choice") Financial Institutions Profiles Series Exchange Traded Funds (ETFs): The New Packaged Product of Choice (Table of Contents) April 20, 2017 TABLE OF CONTENTS Evolution of the Exchange Traded Funds (ETFs)
Financial Institutions Profiles Series Exchange Traded Funds (ETFs): The New Packaged Product of Choice (Table of Contents) April 20, 2017 TABLE OF CONTENTS Evolution of the Exchange Traded Funds (ETFs)
2016 PhRMA Annual Membership Survey
 2016 2016 PhRMA Annual Membership Survey DEFINITION OF TERMS Research and Development (R&D) Expenditure Definitions R&D Expenditures: Expenditures within PhRMA member companies US and/or foreign research
Global Investments in R&D
 Fact Sheet No. 50 June 2018 FS/2018/SCI/50 Global Investments in R&D The UNESCO Institute for Statistics (UIS) is the statistical office of UNESCO and is the UN depository for global statistics in the
Financial Results for the First Three Months of the Fiscal Year Ending March 31, 2018 [J-GAAP] (Consolidated)
![Financial Results for the First Three Months of the Fiscal Year Ending March 31, 2018 [J-GAAP] (Consolidated)](/thumbs/76/73449530.jpg "Financial Results for the First Three Months of the Fiscal Year Ending March 31, 2018 [J-GAAP] (Consolidated)") Company Name: Stock exchange listed on: Financial Results for the First Three Months of the Fiscal Year Ending March 31, 2018 [J-GAAP] (Consolidated) Kintetsu World Express, Inc. (KWE) Tokyo Stock Exchange
Company Name: Stock exchange listed on: Financial Results for the First Three Months of the Fiscal Year Ending March 31, 2018 [J-GAAP] (Consolidated) Kintetsu World Express, Inc. (KWE) Tokyo Stock Exchange
Group sales, profitability and financial position
 First half of : Nestlé delivers 3.5% organic growth combined with a 30 bps EBIT margin improvement Vevey, Switzerland, August 12, CHF Millions Reported Change vs. Reported Sales Group 52 267 +3.5% -1.5%
THIRD QUARTER 2016 REVENUE. 20 October 2016
 THIRD QUARTER 2016 REVENUE DISCLAIMER Certain information contained in this document, other than historical information, may constitute forward-looking statements or unaudited financial forecasts. These
Financial wealth of private households worldwide
 Economic Research Financial wealth of private households worldwide Munich, October 217 Recovery in turbulent times Assets and liabilities of private households worldwide in EUR trillion and annualrate
Financial Results for the First Nine Months of the Fiscal Year Ending March 31, 2018 [J-GAAP] (Consolidated)
![Financial Results for the First Nine Months of the Fiscal Year Ending March 31, 2018 [J-GAAP] (Consolidated)](/thumbs/92/109817851.jpg "Financial Results for the First Nine Months of the Fiscal Year Ending March 31, 2018 [J-GAAP] (Consolidated)") Company Name: Stock exchange listed on: Financial Results for the First Nine Months of the Fiscal Year Ending March 31, 2018 [J-GAAP] (Consolidated) Kintetsu World Express, Inc. (KWE) Tokyo Stock Exchange
Company Name: Stock exchange listed on: Financial Results for the First Nine Months of the Fiscal Year Ending March 31, 2018 [J-GAAP] (Consolidated) Kintetsu World Express, Inc. (KWE) Tokyo Stock Exchange
First ever quarter with over 200m Gross Profit
 11 July 2018 and H1 2018 Trading Update Steve Ingham Kelvin Stagg Chief Executive Officer Chief Financial Officer First ever quarter with over 200m Gross Profit LSE: PAGE.L Website: http://www.page.com/investors
PRELIMINARY RESULTS February 2016
 25 February 2016 Nicandro Durante Chief Executive A strong performance driven by market share growth Excellent underlying performance, despite significant FX headwinds Outstanding quality share performance,
COUNTRY COST INDEX JUNE 2013
 COUNTRY COST INDEX JUNE 2013 June 2013 Kissell Research Group, LLC 1010 Northern Blvd., Suite 208 Great Neck, NY 11021 www.kissellresearch.com Kissell Research Group Country Cost Index - June 2013 2 Executive
Global Helicopter Forecast
 Global Helicopter Forecast C&P untapped demand is rising Key world economies are still underequipped TOP 10 Countries in 2016 ( H/C fleet in service) U.S.A. Russia Canada Brazil Australia United Kingdom
PRELIMINARY RESULTS rd February 2012
 23 rd February 2012 Nicandro Durante Chief Executive Proven strategy continues to deliver Superior shareholder returns Daily Relative performance to FTSE100 Price GBp 2,800 2,600 2,400 2,200 2,000 1,800
1. Consolidated performance for the third quarter of fiscal year 2015 (from April 1, 2015 to December 31, 2015)
") Translation February 3, 2016 Consolidated Financial Results for the Third Quarter of the Fiscal Year Ending March 31, 2016 [Japan GAAP] Company name: Mitsubishi Motors Corporation Listing: First Section,
Translation February 3, 2016 Consolidated Financial Results for the Third Quarter of the Fiscal Year Ending March 31, 2016 [Japan GAAP] Company name: Mitsubishi Motors Corporation Listing: First Section,
THIRD QUARTER OCTOBER 2018
 THIRD QUARTER 2018 18 OCTOBER 2018 DISCLAIMER Certain information contained in this document, other than historical information, may constitute forward-looking statements or unaudited financial forecasts.
I. Summary of consolidated results
 I. Summary of consolidated results 1 Net sales increased compared to the previous year due to the increase in Europe and North America and also favorable foreign exchange rates, despite decreases in China.
PRELIMINARY RESULTS February 2015
 26 February 2015 Nicandro Durante Chief Executive Summary Financials Volume Current Revenue 14.0bn Profit 5.4bn Margin 38.7% EPS 208.1p Cigarettes -8.4% 2.8% -1.4% 667bn -7.2% 0.5pp -3.9% Constant 4.4%
2009 Half Year Results. August 25, 2009
 1 2009 Half Year Results August 25, 2009 2 Caution statement This presentation may contain forward looking statements, which are subject to risk and uncertainty. A variety of factors could cause our actual
News Release Tupperware Brands Corp S. Orange Blossom Trail Orlando, FL 32837
 News Release Tupperware Brands Corp. 14901 S. Orange Blossom Trail Orlando, FL 32837 Investor Contact: Lien Nguyen (407) 826-4475 Tupperware Brands Reports Second Quarter 2015 Results Second quarter sales
2010 Annual Results. February 10, 2011
 2010 Annual Results February 10, 2011 Disclaimer This presentation contains forward-looking statements. The use of the words "aim(s)," "expect(s)," "feel(s)," "will," "may," "believe(s)," "anticipate(s)"
AXA. Jean-Laurent Granier. Chairman & CEO of AXA Global P&C CEO of the Mediterranean and Latin American Region Member of the Management Committee
 AXA Jean-Laurent Granier Chairman & CEO of AXA Global P&C CEO of the Mediterranean and Latin American Region Member of the Management Committee March 27, 2014 Morgan Stanley European Financials Conference
International Statistical Release
 International Statistical Release This release and additional tables of international statistics are available on efama s website (www.efama.org). Worldwide Investment Fund Assets and Flows Trends in the
2011 First Quarter Results Jean-Jacques Gauthier
 Granulats et Béton - Afrique du Sud, stade Moses Mabhida 2011 First Quarter Results Jean-Jacques Gauthier May 5, 2011 Disclaimer This document may contain forward-looking statements. Such forward-looking
1st Quarter Revenue. April 22, 2010
 1st Quarter Revenue April 22, 2010 Disclaimer This presentation contains forward looking statements. The use of the words "aim(s)," "expect(s)," "feel(s)," "will," "may," "believe(s)," "anticipate(s)"
A n n u a l. R e p o r t. S e n s i e n t T e c h n o l o g i e s C o r p o r a t i o n
 2 0 0 8 A n n u a l R e p o r t S e n s i e n t T e c h n o l o g i e s C o r p o r a t i o n 2008 A R e c o r d Y e a r Sensient Technologies Corporation is a leading global developer, manufacturer and
Summary of Consolidated Financial Statements for First Quarter of Fiscal Year Ending March 31, 2019(Japan GAAP)
") Summary of Consolidated Financial Statements for First Quarter of Fiscal Year Ending March 31, 2019(Japan GAAP) August 10, 2018 Listed Exchanges: TSE Name of Listed Company: Ishihara Sangyo Kaisha, Ltd.
Summary of Consolidated Financial Statements for First Quarter of Fiscal Year Ending March 31, 2019(Japan GAAP) August 10, 2018 Listed Exchanges: TSE Name of Listed Company: Ishihara Sangyo Kaisha, Ltd.
International Statistical Release
 International Statistical Release This release and additional tables of international statistics are available on efama s website (www.efama.org) Worldwide Investment Fund Assets and Flows Trends in the
Updated Summary of Consolidated Financial Statements for First Quarter of Fiscal Year Ending March 31, 2016(Japan GAAP)
") Updated Summary of Consolidated Financial Statements for First Quarter of Fiscal Year Ending March 31, 2016(Japan GAAP) August 10, 2015 Listed Exchanges: TSE Name of Listed Company: Ishihara Sangyo Kaisha,
Updated Summary of Consolidated Financial Statements for First Quarter of Fiscal Year Ending March 31, 2016(Japan GAAP) August 10, 2015 Listed Exchanges: TSE Name of Listed Company: Ishihara Sangyo Kaisha,
Summary of Consolidated Financial Statements for First Quarter of Fiscal Year Ending March 31, 2017(Japan GAAP)
") Summary of Consolidated Financial Statements for First Quarter of Fiscal Year Ending March 31, 2017(Japan GAAP) August 10, 2016 Listed Exchanges: TSE Name of Listed Company: Ishihara Sangyo Kaisha, Ltd.
Summary of Consolidated Financial Statements for First Quarter of Fiscal Year Ending March 31, 2017(Japan GAAP) August 10, 2016 Listed Exchanges: TSE Name of Listed Company: Ishihara Sangyo Kaisha, Ltd.
Q REVENUE April 21, 2015
 Q1 2015 REVENUE April 21, 2015 DISCLAIMER This presentation contains forward-looking statements. The use of the words "aim(s)," "expect(s)," "feel(s)," "will," "may," "believe(s)," "anticipate(s)" and
Net sales Operating income Ordinary income. Net income per Net income per share Return on equity share after full dilution
 Summary of Consolidated Financial Statements for Fiscal Year Ended March 31, 2018 (Japan GAAP) June 2, 2018 Listed Exchanges: TSE Name of Listed Company: Ishihara Sangyo Kaisha, Ltd. Code: 4028 URL http://www.iskweb.co.jp
World s Best Investment Bank Awards 2018
 Global Finance will publish its selections for the 19th Annual World s Best Investment Banks in the April 2018 issue. Winners will be honored at an awards ceremony in New York City in March, and all award
Q sales. April 21, 2010
 2010 sales April 21, 2010 Disclaimer All forward-looking statements are Schneider Electric management s present expectations of future events and are subject to a number of factors and uncertainties that
First-half of which China: up 10% (3), 5 percentage points higher than automotive production
, 5 percentage points higher than automotive production") 15.18 Sales up 15% to 7.3 billion euros Operating margin (1) up 23% to 7.4% of sales Net income up 34% to 4.7% of sales Free cash flow of 306 million euros Order intake (2) up 18% to 10.7 billion euros
15.18 Sales up 15% to 7.3 billion euros Operating margin (1) up 23% to 7.4% of sales Net income up 34% to 4.7% of sales Free cash flow of 306 million euros Order intake (2) up 18% to 10.7 billion euros
News Release Tupperware Brands Corp S. Orange Blossom Trail Orlando, FL 32837
 News Release Tupperware Brands Corp. 14901 S. Orange Blossom Trail Orlando, FL 32837 Investor Contact: Lien Nguyen (407) 826-4475 Tupperware Brands Reports Fourth Quarter 2015 Results Declares Regular
Updated Summary of Consolidated Financial Statements for Third Quarter of Fiscal Year Ending March 31, 2017(Japan GAAP)
") Updated Summary of Consolidated Financial Statements for Third Quarter of Fiscal Year Ending March 31, 2017(Japan GAAP) February 10, 2017 Listed Exchanges: TSE Name of Listed Company: Ishihara Sangyo Kaisha,
Updated Summary of Consolidated Financial Statements for Third Quarter of Fiscal Year Ending March 31, 2017(Japan GAAP) February 10, 2017 Listed Exchanges: TSE Name of Listed Company: Ishihara Sangyo Kaisha,
First Quarter Interim Management Statement. 11 April 2011
 First Quarter Interim Management Statement 11 April 211 Michael Page International First Quarter Interim Management Statement 2 Group Gross profit +29% with growth in every geography Growth Rates Group
2012 FIRST HALF RESULTS. August 31, 2012
 August 31, 2012 1 INTRODUCTORY MATTERS Forward-Looking Information This document contains certain forward-looking statements which speak only as of the date on which they are made. Forward-looking statements
Summary of Consolidated Financial Statements for First Quarter of Fiscal Year Ending March 31, 2018(Japan GAAP)
") Summary of Consolidated Financial Statements for First Quarter of Fiscal Year Ending March 31, 2018(Japan GAAP) August 10, 2017 Listed Exchanges: TSE Name of Listed Company: Ishihara Sangyo Kaisha, Ltd.
Summary of Consolidated Financial Statements for First Quarter of Fiscal Year Ending March 31, 2018(Japan GAAP) August 10, 2017 Listed Exchanges: TSE Name of Listed Company: Ishihara Sangyo Kaisha, Ltd.
Financial Results for the Fiscal Year Ended March 31, 2018 [J-GAAP]
![Financial Results for the Fiscal Year Ended March 31, 2018 [J-GAAP]](/thumbs/83/87456247.jpg "Financial Results for the Fiscal Year Ended March 31, 2018 [J-GAAP]") Company Name: Stock exchange listed on: Financial Results for the Fiscal Year Ended March 31, 2018 [J-GAAP] Kintetsu World Express, Inc. (KWE) Tokyo Stock Exchange (First Section) May 11, 2018 Company
Company Name: Stock exchange listed on: Financial Results for the Fiscal Year Ended March 31, 2018 [J-GAAP] Kintetsu World Express, Inc. (KWE) Tokyo Stock Exchange (First Section) May 11, 2018 Company
Contents. Introducing Global-KDIC KSP. Ⅱ Sharing KDIC s Experience. Lessons and Future Work
 Contents Ⅰ Introducing Global-KDIC KSP Ⅱ Sharing KDIC s Experience Ⅲ Lessons and Future Work 2 Ⅰ. Introducing Global-KDIC KSP 3 Deposit Insurance System (DIS)? Deposit Insurance System (DIS) A system established
FUCHS PETROLUB AG The leading independent lubricants manufacturer of the world
 The leading independent lubricants manufacturer of the world Dr. Alexander Selent, Vice Chairman & CFO Dagmar Steinert, Head of Investor Relations April 2013 FUCHS the leading independent lubricants manufacturer
Flash Economics. The acceleration in global trade is very good for the euro zone; what accounts for it?
 1 July 17 - The acceleration in global trade is very good for the euro zone; what accounts for it? Since the second half of 1, global trade in volume terms has accelerated, lifting euro-zone exports. First,
Report on Finnish Technology Industry Exports
 Report on Finnish Technology Industry Exports Last observation October 2018, 2.1.2019 Goods Export of Technology Industry from Finland Goods Export of Technology Industry from Finland by Branches Source:
Strong performance in a challenging environment
 Investor Relations News February 20, 2014 Henkel delivers on 2013 financial targets Strong performance in a challenging environment Solid organic sales growth of 3.5% Sales impacted by foreign exchange
Another quarter of double digit growth
 11 April 2018 2018 Trading Update Steve Ingham Kelvin Stagg Chief Executive Officer Chief Financial Officer Another quarter of double digit growth LSE: PAGE.L Website: http://www.page.com/investors Headline
IMF-BAFT Trade Finance Survey
 IMF-BAFT Trade Finance Survey A Survey Among Banks Assessing the Current Trade Finance Environment Study Overview & Methodology There is general agreement that the ongoing global financial crisis has produced
Financial Results for the First Six Months of the Fiscal Year Ending March 31, 2019 [J-GAAP] (Consolidated)
![Financial Results for the First Six Months of the Fiscal Year Ending March 31, 2019 [J-GAAP] (Consolidated)](/thumbs/93/113324390.jpg "Financial Results for the First Six Months of the Fiscal Year Ending March 31, 2019 [J-GAAP] (Consolidated)") Company Name: Stock exchange listed on: Financial Results for the First Six Months of the Fiscal Year Ending March 31, 2019 [J-GAAP] (Consolidated) Kintetsu World Express, Inc. (KWE) Tokyo Stock Exchange
Company Name: Stock exchange listed on: Financial Results for the First Six Months of the Fiscal Year Ending March 31, 2019 [J-GAAP] (Consolidated) Kintetsu World Express, Inc. (KWE) Tokyo Stock Exchange
2007 Revenue and Results. 2007: strong increase in results Strengthened growth momentum. February 15 th, 2008
 2007 Revenue and Results 2007: strong increase in results Strengthened growth momentum February 15 th, 2008 2007 revenue and results Agenda A successful 2007 Be the recognized industry leader John Glen
3. Debt Indicators of Households and Corporations
 FINANCIAL STABILITY REPORT FEBRUARY 215 3. Debt Indicators of Households and Corporations 3.1 Households Growth of household indebtedness, as measured by the growth of bank credit to households, decelerated
Global Styrene Butadiene Rubber (SBR) Market Study ( )
 Market Study ( )") Global Styrene Butadiene Rubber (SBR) Market Study (2014 2025) Table of Contents 1. INTRODUCTION 1.1. Introduction to SBR Market Product Description Properties Industry Structure Value Chain Market Dynamics
Global Styrene Butadiene Rubber (SBR) Market Study (2014 2025) Table of Contents 1. INTRODUCTION 1.1. Introduction to SBR Market Product Description Properties Industry Structure Value Chain Market Dynamics
Compagnie Financière Tradition
 Compagnie Financière Tradition H1 2016 results presentation Zurich 1 September 2016 First semester activity in a stabilising market environment Results overview H1 2016 Performance Differentiation in revenue
2015 Half Year Results Strongly improved free cash flow, on track to achieve 2015 targets. 17 July 2015
 Strongly improved free cash flow, on track to achieve 2015 targets 17 July 2015 Gilles Andrier Chief Executive Officer 2 Financial highlights Sales of CHF 2.2 billion, up 1.3% on a like-for-like* basis
!!!1!!!!!!!!!!!!!!!!!!!!!!!!!!!!! The Association of Real Estate Funds & Property Funds Research
 1 The Association of Real Estate Funds & Property Funds Research Global Real Estate Funds Review H1 216 Contents CONTENTS 2 EXECUTIVE SUMMARY 3 UNLISTED FUND UNIVERSE: OVERVIEW (EX FOF) 6 UNLISTED FUNDS
1. Consolidated performance for the second quarter of fiscal year 2015 (from April 1, 2015 to September 30, 2015)
") Translation October 27, 2015 Consolidated Financial Results for the Second Quarter of the Fiscal Year Ending March 31, 2016 [Japan GAAP] Company name: Mitsubishi Motors Corporation Listing: First Section,
Translation October 27, 2015 Consolidated Financial Results for the Second Quarter of the Fiscal Year Ending March 31, 2016 [Japan GAAP] Company name: Mitsubishi Motors Corporation Listing: First Section,
Summary of Consolidated Financial Statements for Second Quarter of Fiscal Year Ending March 31, 2019(Japan GAAP)
") Summary of Consolidated Financial Statements for Second Quarter of Fiscal Year Ending March 31, 2019(Japan GAAP) November 9, 2018 Listed Exchanges: TSE Name of Listed Company: Ishihara Sangyo Kaisha, Ltd.
Summary of Consolidated Financial Statements for Second Quarter of Fiscal Year Ending March 31, 2019(Japan GAAP) November 9, 2018 Listed Exchanges: TSE Name of Listed Company: Ishihara Sangyo Kaisha, Ltd.
Allianz Group Financial information as of 31 March 2018
 Allianz Group Financial information as of 31 March 2018 Reporting by business segments and quarters (starting from 1Q 2017) Consolidated Balance Sheets Asset allocation Allianz Group overview Property-Casualty
Summary of Consolidated Financial Statements for First Quarter of Fiscal Year Ending March 31, 2014(Japan GAAP)
") Summary of Consolidated Financial Statements for First Quarter of Fiscal Year Ending March 31, 2014(Japan GAAP) August 12, 2013 Listed Exchanges: TSE Name of Listed Company: Ishihara Sangyo Kaisha, Ltd.
Summary of Consolidated Financial Statements for First Quarter of Fiscal Year Ending March 31, 2014(Japan GAAP) August 12, 2013 Listed Exchanges: TSE Name of Listed Company: Ishihara Sangyo Kaisha, Ltd.
Global Economy is Expected to Grow by 3,4 % in 2017
 Russia Brazil Mexico Rest of Eastern Europe Rest of Latin A,merica Middle East and Africa Global Economy is Expected to Grow by 3,4 % in 217 GDP growth in 217, % 9 8 7 6 5 4 3 2 1-1 -2-3 -4 North America
Summary of Consolidated Financial Statements for Second Quarter of Fiscal Year Ending March 31, 2018(Japan GAAP)
") Summary of Consolidated Financial Statements for Second Quarter of Fiscal Year Ending March 31, 2018(Japan GAAP) November 10, 2017 Listed Exchanges: TSE Name of Listed Company: Ishihara Sangyo Kaisha,
Summary of Consolidated Financial Statements for Second Quarter of Fiscal Year Ending March 31, 2018(Japan GAAP) November 10, 2017 Listed Exchanges: TSE Name of Listed Company: Ishihara Sangyo Kaisha,
Performance 2017: Global Stock Markets
 Performance 217: Global Stock Markets January 2, 218 Dr. Edward Yardeni 16-972-7683 eyardeni@ Mali Quintana 48-664-1333 aquintana@ Please visit our sites at www. blog. thinking outside the box Table Of
STATISTICS Last update: 03/07/2017
 STATISTICS 2012-2016 Last update: 03/07/2017 BU NEWS BUSINESS [USD, BILLIONS] New business by year, vs. total world exports 3,000 2,500 2,000 1,500 1,000 500 12,131 1,138 40 127 971 14,023 1,323 53 143
Best Treasury & Cash Management Providers 2017
 Page 1 of 5 In March 2017, Global Finance will publish its selections for the Seventeenth Annual World s Best Treasury & Cash Management Providers. Global Finance will select the best overall global cash
Investor Relations Jay Bachmann Danièle Daouphars
 Investor Document Investor Relations Jay Bachmann jay.bachmann@lafarge.com +33 1 44 34 93 71 Granulats et Béton - Afrique du Sud, stade Moses Mabhida Danièle Daouphars daniele.daouphars@lafarge.com +33
Statistics List (Balance of Payments)
") Category of Statistics Name of Statistics [Database Name] Name of Items Balance of Payments Balance of Payments [BP01] Balance of Payments (Data Based on the BPM6) Balance of Payments Goods & services
Category of Statistics Name of Statistics [Database Name] Name of Items Balance of Payments Balance of Payments [BP01] Balance of Payments (Data Based on the BPM6) Balance of Payments Goods & services
Property & Casualty: Accelerating Profitable Growth
 Investor Day December 4, 2013 Property & Casualty: Accelerating Profitable Growth Jean-Laurent Granier CEO, AXA Global P&C Cautionary note concerning forward-looking statements Certain statements contained
L OCCITANE EN PROVENCE EN PROVENCE. Final results. for the year ended 31 March 2011
 Final results for the year ended 31 March 2011 Agenda Results Highlights Strategic Review and Future Prospects 2 1. Results Highlights (million ) Net sales Operating profit Net profit 900 800 +26.1%, +
Global Business and Spending Monitor 2016
 Global Business and Spending Monitor 2016 January 2016 India Copyright 2016 CFO Publishing LLC, which is solely responsible for its content. All rights reserved. Contents This presentation contains survey
Performance 2017: Global Stock Markets
 Performance 217: Global Stock Markets December 6, 217 Dr. Edward Yardeni 16-972-7683 eyardeni@ Mali Quintana 48-664-1333 aquintana@ Please visit our sites at www. blog. thinking outside the box Table Of
Performance 2018: Global Stock Markets
 Performance 218: Global Stock Markets January 22, 218 Dr. Edward Yardeni 16-972-7683 eyardeni@ Mali Quintana 48-664-1333 aquintana@ Please visit our sites at www. blog. thinking outside the box Table Of
Performance 2018: Global Stock Markets
 Performance 218: Global Stock Markets October 3, 218 Dr. Edward Yardeni 16-972-7683 eyardeni@ Mali Quintana 48-664-1333 aquintana@ Please visit our sites at www. blog. thinking outside the box Table Of