2017FY - Results presentation. March 21, 2018
|
|
|
- Jeffry Wilkins
- 5 years ago
- Views:
Transcription


1 2017FY - Results presentation March 21, 2018
2 Disclaimer This presentation has been prepared by SIT S.p.A. only for information purposes and for the presentation of the Group s results and strategies. For further details on the SIT Group, reference should be made to publicly available information. Statements contained in this presentation, particularly those regarding any SIT Group possible or assumed future performance, are or may be forward looking statements and in this respect they involve some risks and uncertainties. Any reference to past performance of the SIT Group shall not be taken as an indication of future performance. This document does not constitute an offer or invitation to purchase or subscribe for any shares and no part of it shall form the basis of or be relied upon in connection with any contract or commitment whatsoever. By attending this presentation you agree to be bound by the foregoing terms. 2
3 2017FY - Key financial results (Euro.000) 2017 % 2016 % diff% Revenues ,0% ,0% 12,4% EBITDA Adjusted (1) ,2% ,5% 2,7% EBITDA ,6% ,0% 2,0% EBITA ,7% ,3% 5,7% EBIT ,8% ,1% 7,2% Net Income Adjusted (2) ,5% ,6% 365% Net Income (23.327) -7,2% ,6% n/a Net Income of the Group (23.327) -7,2% ,6% n/a Operating cash flow Revenue growth of 12,4% is all organic: - Heating, +24,2 +9,7% - Smart Gas Metering,+11,7 +31,1% Revenue growth at same forex rates is +13,2% EBITDA Adjusted is 45,8, +2,7% suffers extra costs due to production capacity constraints and increase in demand Accelerated capex plan underway to open bottlenecks and restore operating flexibility and efficiencies Net Income Adjusted is 8,0, +6,3,+ 365%, thanks to post IPO capital structure and new funding conditions Net financial position (1) Adjusted for non-recurring income and charges. In 2017 non-recurring operating charges mainly refer to AIM Italia listing project. In 2016 non-recurring items are mostly due to restructuring costs (2) Adjusted for non-recurring, non-cash charges due to fair value accounting of the reverse merger with SPAC Industrial Stars of Italy 2. The amount is equal to Euro thousand calculated as the difference between the market value of SIT shares on the merger date and the fair value of the SPAC s assets and liabilities incorporated by SIT. The item is accounted in financial charges and has a related reserve in equity that will be used to offset the charge in 2018 opening of accounts. 3
4 2017FY - Sales bridge Euro millions 7,1 2,3 324,0 45,3 288,1 2016FY Vol/Mix Prices Forex 2017FY 4
5 2017FY - Sales breakdown by division and geography Divisional sales Euro % 2016 % diff % Heating ,6% ,7% 9,7% Smart Gas Metering ,3% ,1% 31,1% Total product sales ,9% ,8% 12,5% Service sales 502 0,1% 608 0,2% -17,4% 5Y Revenues CAGR: 7,7% only internal growth rate Total revenues % % 12,4% Product sales by geography Euro % 2016 % diff % Italy ,6% ,9% 19.3% Europe (excluding Italy) ,1% ,4% 9.1% Smart Gas Metering realized substantially all revenues in Italy America ,3% ,4% 5.6% Asia/Pacific ,9% ,4% 18.8% Total product sales % % 12.5% 5
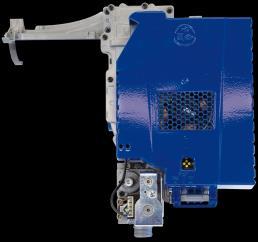
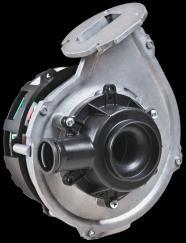
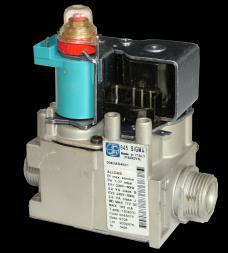
6 2017FY - Heating sales growth driven by emerging markets Heating product sales by application Euro % 2016 % diff % Central Heating ,9% ,6% 15,6% Direct Heating ,2% ,4% 3,4% Storage Water Heating ,3% ,1% -2,6% Catering ,0% ,5% -2,2% Other ,5% ,4% -3,9% Total product sales ,0% ,0% 9,7% 2017FY 0,7% 8,0% 3,3% 11,6% 17,4% Mechanical controls Electronic controls Fans Flue exhaust systems 59,0% Integrated systems Other China, 2017 sales are 20,5 million vs 15,0 million, +36,7% Turkey, 2017 sales are 39,6 million vs 31,3 million, +26,6% Mechanical controls 2017 growth of 10,6 million, +7,0% Fans 2017 growth of 8,3 million, +35,2% Integrated systems 2017 growth of 2,4 million, + 36,9% 6
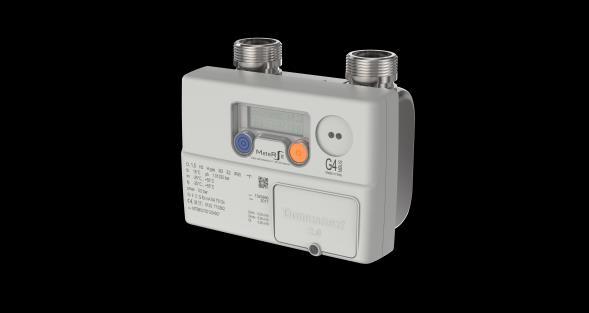
7 2017FY - Smart Gas Metering confirms growth trend Smart Gas Metering product sales by application Euro % 2016 % diff % Residential ,9% ,4% 29,1% Commercial & Industrial ,6% ,6% 61,4% Other 224 0,5% 30 0,1% - Total product sales ,0% ,0% 31,1% only internal growth rate (CAGR) 77,4% 37,7 49,5 At Feb 2018, Revenues are 9,0 million and order portfolio stands at 66,9 million of which 56,5 is for delivery in (At Feb 2017 Revenues and portfolio were respectively 6,4 and 27,0) 20,0 15,6 Reference market is still Italy Product qualification and pilot testing in foreign markets are in process 1,0 5,
8 2017FY EBITDA Adjusted bridge Euro millions 44,6 5,8 0,6 2,3 1,0 0,7 45,8 EBITDA Adj FY16 Vol/Mix Prices, net Operations Forex, net Other EBITDA Adj FY17 8
9 2017FY Financial charges Euro diff Net financial charges - reported Fair value accounting effect of merger Net financial charges - Adjusted (4.075) Reported financial charges include: Write off of amortized cost Unwinding of interest rate swaps Net financial charges normalized* (9.284) * Reported financial charges are affected by one-off charges related to: 2016 partial reimbursement of Shareholder loan 2017 residual reimbursement of Shareholder loan and Bank loan refinancing with new Senior Financial Agreement 9
10 2017FY Net financial position Euro millions 124,8 10,8 7,8 8,0 BoP NFP/EBITDA Adj: 2,8x EoP NFP/EBITDA Adj : 1,4x 48,1 17,3 6,5 48,4 2,4 65,1 NFP 2016 Current Cash flow Change in NWC Capex, net Interest paid Amortized cost write off Equity increase SPAC merger, net Forex translation reserve and other NFP
11 2017FY Net trade working capital Euro diff Inventory (360) Accounts receivables Accounts payables (8.402) Reported Net Trade Working Capital (1.296) NTWC / Revenues 6,8% 8,0% (1,2%) Non recourse factoring (902) Capex accounts payables Net Trade Working Capital Adjusted (1.053) NTWC Adjusted/ Revenues 11,0% 12,7% (1,7%) End of Period 11
12 Contacts Paul Fogolin Chief Financial Officer & Investor Relator SIT S.P.A. Viale dell'industria Padova (Italy) Ph Fax
Company presentation. AIM Italia Conference London Stock Exchange. October
 Company presentation Federico de' Stefani, Executive Chairman Paul Fogolin, Chief Financial Officer AIM Italia Conference London Stock Exchange October 9-10 2017 Disclaimer This presentation has been prepared
PRESS RELEASE NEW ENTRIES REINFORCE MANAGEMENT TEAM
 PRESS RELEASE 2018H1 REVENUES: EURO 175,4 MILLION (+17,6%) EBITDA ADJUSTED: EURO 23,4 MILLION (+8,1%, +13,4% AT SAME FOREX RATES) NET INCOME: EURO 8,4 MILLION (+7,5 MILLION) NEW ENTRIES REINFORCE MANAGEMENT
PRESS RELEASE SIT: REVENUES AND EBIT GREW IN FIRST HALF 2017
 PRESS RELEASE SIT: REVENUES AND EBIT GREW IN FIRST HALF 2017 Revenues up 10.7% in H1 to Euro 149.1 million (Euro 134.7 million in H1 2016). EBITDA up 2.9 % to Euro 21.6 million (Euro 21.0 million in H1
H Results. H Results
 1 H1 17 Highlights Market demand continue to increase (+2.0) Net Sales strong increase 12.6, driven by strong Cooking Own brand business performance +21 EBITDA adjusted* increase by 13.0, positively impacted
9M 2016 RESULTS NICE PRESENTATION. November 2016, 11 th
 NICE PRESENTATION November 2016, 11 th 1 FINANCIAL OVERVIEW 2 Consolidated Sales: 230.0m (+7.3% vs. 9M 2015) Gross margin: 53.1% (vs. 54.9% in 9M 2015) EBITDA margin: 15.0% (vs. 15.8% in 9M 2015) HIGHLIGHTS
1H 2016 RESULTS NICE PRESENTATION. August 2016, 5 TH
 NICE PRESENTATION August 2016, 5 TH 1 FINANCIAL OVERVIEW 2 Consolidated Sales: 150.2m (+5.3% vs. 1H 2015) Gross margin: 53.7% (vs. 55.1% in 1H 2015) EBITDA margin: 15.0% (vs. 14.7% in 1H 2015) HIGHLIGHTS
FY 2017 CONSOLIDATED RESULTS
 Gruppo FY 2017 CONSOLIDATED RESULTS Conference Call Contents Financial highlights Ascopiave Group structure as of 31st December 2017 FY 2017 consolidated income statement Consolidated balance sheet as
1stQ 2018 CONSOLIDATED RESULTS
 Gruppo 1stQ 2018 CONSOLIDATED RESULTS Conference Call Contents Financial highlights Ascopiave Group structure as of 31st march 2018 1stQ 2018 consolidated income statement Consolidated balance sheet as
LU-VE incontra la comunità finanziaria. 24 ottobre 2016
 LU-VE incontra la comunità finanziaria 24 ottobre 2016 Disclaimer This presentation has been prepared by LU-VE S.p.A. for information purposes only and for use in presentations of the Group s results and
FY2017 FILA Group Results
 FY2017 FILA Group Results Disclaimer This document has been prepared by F.I.L.A. S.p.A. ( F.I.L.A. or the Company ), for information purposes only, exclusively with the aim of assisting you to understand
FY 2017 results. 26 st March 2018
 FY 2017 results 26 st March 2018 CONTENTS 1. Financial highlights 2. Net sales breakdown 3. Profit & loss 4. Net working capital 5. Net cash flow 6. Balance sheet 7. Future developments 8. Group structure
FY 2018 FINANCIAL RESULTS
 FY FINANCIAL RESULTS Full Year LRG shows strong performance improvement compared to, with results in line with outlook FY Revenue (M ) Adjusted Ebitda (M ) Ebit (M ) NPF (M ) 184,2 38,9 206,3 39,2 +20,9
H results. 25 st September 2018
 H1 2018 results 25 st September 2018 2018 financial highlights: strong first half Consolidated sales (1) : 152,8 m (+14,9% vs. H1 17; +16,6% on a constant FX basis) Order backlog as of 30 June 2018: 42,5
Star Conference 2014 London
 Star Conference 2014 London 2 AGENDA 1. Company Overview 2. Market Development & Strategic Direction 3. Financial 3 Elica Group Founded in 1970 Today N#1 Player Worldwide in Hoods Market Leader 2013 Turnover
9M 2017 FILA Group Results
 9M 2017 FILA Group Results Disclaimer This document has been prepared by F.I.L.A. S.p.A. ( F.I.L.A. or the Company ), for information purposes only, exclusively with the aim of assisting you to understand
Q Results. Lars Brorsen (CEO) Christoph Hobo (CFO) November 22, 2018
 Christoph Hobo (CFO) November 22, 2018") Q3 2018 Results Lars Brorsen (CEO) Christoph Hobo (CFO) November 22, 2018 Agenda 1. Highlights Q3 2018 2. Market outlook 3. Detailed results review 4. Company outlook 5. Q&A Appendix 1 Business summary
Q3 2018 Results Lars Brorsen (CEO) Christoph Hobo (CFO) November 22, 2018 Agenda 1. Highlights Q3 2018 2. Market outlook 3. Detailed results review 4. Company outlook 5. Q&A Appendix 1 Business summary
Fourth Quarter 2015 Performance Summary
 Fourth Quarter 2015 Performance Summary Operational and Financial Highlights - 2015 Grifols revenues grow by 17.3% to Euros 3,935 million, and net profit grows by 13.2% reaching Euros 532 million of the
9M 2018 Results Ended September 30, 2018
 9M 2018 Results Ended September 30, 2018 November 13, 2018 Disclaimer This proprietary presentation (including any accompanying oral presentation, question and answer session and any other document or
Q results. April 27, 2018
 Q1 2018 results April 27, 2018 Consolidated financial statements as of March 31, 2018 were authorized for issue by the Board of Directors held on April 26, 2018. Q118 KEY HIGHLIGHTS Q1 2018 in line with
First Quarter 2016 Performance Summary
 First Quarter 2016 Performance Summary Operational and Financial Highlights - 1Q 2016 Grifols' revenues increase by +5.6% to Euros 959 million, driven by growth of +10.9% for the Bioscience Division The
STAR Conference. 6 th October 2016, London
 STAR Conference 6 th October 2016, London Elica Corporation N#1 PLAYER WORLDWIDE IN HOODS 13% MARKET SHARE 2015 TURNOVER 421.6 M 8 INDUSTRIAL PLANTS WORLDWIDE 2 19 Mln Hoods + Motors Cooking Net Sales:
2017 Interim Results. Continuing Execution of Our Strategy. 3 August 2017
 2017 Interim Results Continuing Execution of Our Strategy 3 August 2017 0 Disclaimer THIS PRESENTATION IS NOT FOR RELEASE, PUBLICATION OR DISTRIBUTION, IN WHOLE OR IN PART, IN OR INTO THE UNITED STATES
ISAGRO AS OF DECEMBER 31 ST, 2017
 ISAGRO AS OF DECEMBER 31 ST, 2017 SpA Shareholders Meeting Milan, April 24 th, 2018 EXECUTIVE SUMMARY IN A YEAR PRESENTING UNFAVORABLE CONDITIONS At Market level Drought in South Europe (particularly in
2Q2013 IFRS Consolidated Financial Results. November 14, 2013
 2Q213 IFRS Consolidated Financial Results November 14, 213 Disclaimers This presentation has been prepared by OJSC Gazprom (the Company ), and comprises the slides for a presentation to investors concerning
2014 Results Conference Call. 9 th March, 2015
 2014 Results Conference Call 9 th March, 2015 Agenda 2014 Results Outlook 2 2014 Results 3 2014 Key Factors FOCUS ON CLIENT Anticipate clients needs offering new products to improve their efficiency and
CEVA Logistics AG Investor Call Third Quarter/First 9 Months November CEVA Logistics AG Q3 2018
 CEVA Logistics AG Investor Call Third Quarter/First 9 Months 2018 13 November 2018 1 Highlights Third Quarter of 2018 Revenue up 4.7% year on year in constant currency FM growth +6.8% in constant currency,
H Financial Results
 Milan August 1 st, 2013 1 AGENDA H1 2013 Highlights & FY 2013 Outlook Financial Results Appendix 2 H1 2013 Key Financials Euro Millions, % on Sales Sales Adjusted EBITDA (3) Adjusted EBIT (4) -1.8% * 7,973
Telecom Italia Group FY 06 Financial Results
 FY 06 Financial Results Milan, March 8th, 2007 Telecom Italia Group FY 06 Financial Results TLCne-051027-P1 Safe Harbour These presentations contain statements that constitute forward-looking statements
H FINANCIAL RESULTS. Milan September 18 th, 2018
 H1 2018 FINANCIAL RESULTS Milan September 18 th, 2018 1 AGENDA H1 2018 Highlights o o o Group overview Results by business Outlook Financial results Appendix 2 H1 2018 Financial Highlights Organic sales
1Q Performance Summary
 1Q 2015 - Performance Summary Operational and Financial Highlights - 1Q 2015 Net profit up by +6.2% to Euros 128.5 million Income grows by +13.8% (+1.1% cc*) to Euros 908.4 million, driven by sales of
WDF S.P.A. Q4 & FULL YEAR 2014 RESULTS PRESENTATION
 WDF S.P.A. Q4 & FULL YEAR 2014 RESULTS PRESENTATION 11 th March 2015 WORLD DUTY FREE GROUP AFRICA AMERICAS ASIA EUROPE Important Note THE PROPORTIONAL PARTIAL DEMERGER OF AUTOGRILL S.P.A., WHEREBY AUTOGRILL
H Financial Results. Milan July 28th, 2016
 H1 2016 Financial Results Milan July 28th, 2016 Agenda H1 2016 Highlights o o o Group overview Results by business Outlook Financial results Appendix H1 2016 Financial Results 2 H1 2016 Highlights Organic
Q Presentation. 8 May 2018 Asbjørn Eskild, President and CEO Stephan Révay, CFO
 Q1 2018 Presentation 8 May 2018 Asbjørn Eskild, President and CEO Stephan Révay, CFO Highlights Q1 2018 Organic growth: 2.7% Accessibility +3.3% organically Strong development for Stairlifts: +10% (North
2018 FOURTH QUARTER EARNINGS CALL
 NORTH AMERICA S LEADING BUILDING MATERIALS DISTRIBUTOR RESIDENTIAL COMMERCIAL INTERIOR SOLAR 2018 FOURTH QUARTER EARNINGS CALL Forward Looking Statements / Non-GAAP Measures This presentation contains
FY 2016 Financial Results. Milan March 1st 2017
 FY 2016 Financial Results Milan March 1st 2017 Agenda FY 2016 Highlights o o Group overview Results by business Financial results Appendix FY 2016 Financial Results 2 FY 2016 Highlights Adj. EBITDA at
PIRELLI, GLOBAL HIGH VALUE
 DISCLAIMER_ In General. This disclaimer applies to this document and any oral comments of any person presenting it. This document, taken together with any such oral comments, is referred to herein as the
First Half of 2015 Performance Summary
 First Half of 2015 Performance Summary Operational and Financial Highlights - 1H 2015 Net profit grows +16.3% to Euros 261.5 million and revenues increase +18% exceeding Euros 1,900 million The revenues
9M 2014 Results Presentation November 13, 2014
 9M 2014 Results Presentation November 13, 2014 9M 2014 key facts Sales: Euro 668.4 million +8.1% (+8.8% constant FX) Directly Operated Stores Same Store Sales: +9.4% (vs -5.7% in 9M 13) EBITDA: Euro 46.3
Third Quarter 2016 Performance Summary
 Third Quarter 2016 Performance Summary Operational and Financial Highlights - 9M 2016 Sales of the Bioscience Division grow by +6.5%, increasing Grifols revenues to EUR 2,951.7 million over EUR 1,000 million
Results Presentation Q1 2017
 Results Presentation Q1 2017 May 09 2017 1 IPO Prosegur CASH at a Glance Start of Trading: 17 March 2017 Initial Price: 2 per Share Europe 7% Spain 3% US 37% Subscribed Volume: 412.5 million shares (27.5%
Fare clic per modificare lo stile del titolo FY 2006 Financial Results
 Fare clic per modificare lo stile del titolo FY 2006 Financial Results Star Conference Milan, March 1st 2007 THE GROUP DATALOGIC OFFER UPDATE ON PSC FINANCIAL HIGHLIGHTS TRANSFORMATION PLAN 2 Datalogic
Third Quarter Performance Summary. November 2, 2017
 Third Quarter 2017 Performance Summary November 2, 2017 Legal Disclaimer The facts and figures contained in this report that do not refer to historical data are future projections and assumptions. Words
H FINANCIAL RESULTS. August 30,
 August 30, 2017 1 Disclaimer This presentation contains both historical and forward-looking statements. These forward-looking statements are based on Carrefour management's current views and assumptions.
title 9 Months 2012 title Conference Call 12 th November 2012 date
 title 9 Months 2012 title Conference Call 12 th November 2012 date DISCLAIMER This document has been prepared by Datalogic S.p.A. (the "Company") for use during meetings with investors and financial analysts
FY 2018 FINANCIAL RESULTS. MILAN March 5 th,2019
 FY 2018 FINANCIAL RESULTS MILAN March 5 th,2019 AGENDA FY 2018 Highlights o Group overview o Results by business o Outlook Financial Results Appendix 2 FY 2018 Financial Highlights Fully combined organic
FY 2011 FY 2011 CONSOLIDATED RESULTS
 FY 211 FY 211 CONSOLIDATED RESULTS Conference Call Pag. 1 Contents Financial highlights Ascopiave Group structure as of December, 31st 211 FY 211 income statement Impact of Robin Hood Tax review Balance
1Q2012 IFRS Consolidated Financial Results. September 10th 2012
 1Q212 IFRS Consolidated Financial Results September 1th 212 Disclaimers This presentation has been prepared by OJSC Gazprom (the Company ), and comprises the slides for a presentation to investors concerning
Financial Results. Full Year March 2017
 Financial Results Full Year 2016 March 2017 Disclaimer This presentation is being furnished to you solely for your information and may not be reproduced or redistributed to any other person. This presentation
First Quarter 2017 Earnings Results
 First Quarter 2017 Earnings Results Performance Summary May 3, 2017 Legal Disclaimer The facts and figures contained in this report that do not refer to historical data are future projections and assumptions.
Consolidated Statement of Profit or Loss (in million Euro)
") Consolidated Statement of Profit or Loss (in million Euro) Q1 2016 Q1 2017 % change Revenue 603 588-2.5% Cost of sales (408) (396) -2.9% Gross profit 195 192-1.5% Selling expenses (84) (86) 2.4% Research
Consolidated Statement of Profit or Loss (in million Euro) Q1 2016 Q1 2017 % change Revenue 603 588-2.5% Cost of sales (408) (396) -2.9% Gross profit 195 192-1.5% Selling expenses (84) (86) 2.4% Research
Half Year Results Presentation. For the six months ended 30 June 2016
 Half Year Results Presentation For the six months ended 30 June 2016 Disclaimer By attending the meeting where this presentation is made, or by reading this document, you agree to be bound by the limitations
Consolidated Statement of Profit or Loss (in million Euro)
") Consolidated Statement of Profit or Loss (in million Euro) Q3 2015 Q3 2016 % change 9m 2015 9m 2016 % change Revenue 661 625-5.4% 1,974 1,873-5.1% Cost of sales (453) (415) -8.4% (1,340) (1,239) -7.5%
Consolidated Statement of Profit or Loss (in million Euro) Q3 2015 Q3 2016 % change 9m 2015 9m 2016 % change Revenue 661 625-5.4% 1,974 1,873-5.1% Cost of sales (453) (415) -8.4% (1,340) (1,239) -7.5%
FY 2013 Financial Results
 Milan February 25 th, 2014 1 AGENDA FY 2013 Highlights Group Overview Results by business Financial Results Appendix 2 2013 Key Achievements FY targets achieved despite continuous weak economic environment
9M 2018 FINANCIAL RESULTS. Milan November 14 th, 2018
 9M 2018 FINANCIAL RESULTS Milan November 14 th, 2018 1 AGENDA 9M 2018 Highlights o Group overview o Results by business Financial results Appendix 2 9M 2018 Financial Highlights Organic sales growth at
1H 2014 Results Presentation July 31, 2014
 1H 2014 Results Presentation July 31, 2014 1H 2014 key facts Sales: Euro 400.2 million +3.5% (+4.1% constant FX) Directly Operated Stores Same Store Sales: +8.2% (vs -7.6% in 1H 13) EBITDA: Euro 20.7 million,
Paris. European Midcap Event. 29 June 2017
 Paris European Midcap Event 29 June 2017 CONTENTS 1. Products and Applications 2. Business Model - Highlights 3. Shareholder Structure 4. History of the Group 5. Management Team 6. Strengths 7. Technological
Results Presentation Q1 2018
 Results Presentation 2 Highlights of the First Quarter Total revenues 1,008M +8% Growth in local currency terms 9.9% EBIT Margin Recovering our historical margin level 13,000 new alarms Maintaining growth
ROADSHOW PRESENTATION. March 2010
 ROADSHOW PRESENTATION March 2010 Disclaimer This presentation does not constitute or form part of, and should not be construed as, any offer or invitation to subscribe for, underwrite or otherwise acquire,
During 2016 we have delivered
 FY 2016 Results During 2016 we have delivered EBIT improvement both in absolute and relative terms EBIT improvement +5% 324 342 EBIT margin improvement +60 bps 8.2% 8.8% MM Business figures MM 4Q Recovery
2009 Results as of June 30. July 30, 2009
 2009 Results as of June 30 July 30, 2009 2009 Q2 HIGHLIGHTS (change Vs. 2008) Sales: 613 M (-20.3%) At constant exchange rates 648 M (-15.8%) Operating income*: 32 M (-26.7%) 44 M (-0.6%) Operating margin*:
AIRBUS Q1 Results 2017
 AIRBUS Q1 Results 2017 27 April 2017 Harald Wilhelm Chief Financial Officer SAFE HARBOUR STATEMENT 2 DISCLAIMER This presentation includes forward-looking statements. Words such as anticipates, believes,
Fourth Quarter 2016 Performance Summary
 Fourth Quarter 2016 Performance Summary Operational and Financial Highlights - 2016 Net profit rises by +2.5% to Euros 545.5 million Recurring sales (excluding Raw Materials and Others) rise by +4.5% (+4.6%
FY 2017 FINANCIAL RESULTS. Milan February 27 th, 2018
 FY 2017 FINANCIAL RESULTS Milan February 27 th, 2018 1 AGENDA FY 2017 Highlights o o Group overview Results by business Financial results Appendix 2 Key Achievements of 2017 General Cable Acquisition Leadership
RESULTS 9M17. November 7 th, 2017
 November 7 th, 2017 CONFERENCE CALL DETAILS LIVE EVENT: The Company will host a conference call for investors and analysts today at 18:30 (CET). Please find below conference call telephone numbers: Spain:
Q Financial Results. Milan May 10th, 2016
 Q1 2016 Financial Results Milan May 10th, 2016 Agenda Q1 2016 Highlights o o o Group overview Results by business Outlook Financial results Appendix Q1 2016 Financial Results 2 Q1 2016 Highlights Organic
Gruppo MutuiOnline ITALY \ Diversified Financials
 Gruppo MutuiOnline ITALY \ Diversified Financials 2Q09 Results BUY (Unchanged) Target: 6.2 (prev. 5) Risk: High STOCK DATA Price 4.7 Bloomberg Code MOL IM Market Cap. ( mn) 185 Free Float 40% Shares Out.
First Half 2016 Performance Summary
 First Half 2016 Performance Summary Operational and Financial Highlights - 1H 2016 Strong positive growth for the four main plasma proteins, that jointly with the others, take the revenues of the Bioscience
Disclaimer. We define EBIT as EBITDA less amortizations.
 H1 2012 2 Disclaimer This document is purely informative and does not intend to be comprehensive. Financial information included in this presentation has been calculated in accordance with International
Summary of the Results at December 31, Call on results, March 27, 2017, 17CET
 Summary of the Results at December 31, 2016 Call on results, March 27, 2017, 17CET Disclaimer This presentation has been prepared for information purposes only as part of the conference to present the
April 2015 A LEADING TECH COMPANY
 April 2015 A LEADING TECH COMPANY This presentation has been produced by Indra for the sole purpose expressed therein. Therefore, neither this presentation nor any of the information contained herein constitutes
PRESS RELEASE THE BOARD OF DIRECTORS APPOVES THE RESULTS AS OF 31 DECEMBER 2017
 PRESS RELEASE THE BOARD OF DIRECTORS APPOVES THE RESULTS AS OF 31 DECEMBER 2017 EBITDA EURO 82.1 MILLION, GROWING +17% VS 2016 (+9% VS PRO FORMA) AND NET FINANCIAL DEBT/EBITDA IMPROVING TO 1.9x VS 2.3x
PRESS RELEASE THE BOARD OF DIRECTORS APPROVES THE RESULTS AS OF JUNE 30, 2018
 PRESS RELEASE THE BOARD OF DIRECTORS APPROVES THE RESULTS AS OF JUNE 30, 2018 20% EBITDA GROWTH IN THE FIRST HALF OF 2018 (EURO 43.6 MILLION) VS FIRST HALF OF 2017, LAST TWELVE MONTHS (LTM) EBITDA AT EURO
16 May M FY 2017/18 FINANCIAL RESULTS
 16 May 2018 6M FY 2017/18 FINANCIAL RESULTS NOTICE TO RECIPIENTS This presentation and any materials distributed in connection herewith (together, the Presentation ) have been prepared by Douglas GmbH
EVRY ASA Q4/FY 2017 PRESENTATION. CEO Björn Ivroth CFO Henrik Schibler
 EVRY ASA Q4/FY 2017 PRESENTATION CEO Björn Ivroth CFO Henrik Schibler Agenda Q4/ Preliminary FY 2017 presentation Group highlights Business update & trends Financial highlights Business area performance
Technology for shaping everyday materials. Milan March 2011
 Technology for shaping everyday materials Milan March 2011 Group business structure wood glass & stone mechatronic service tooling 1 1 summary: sales breakdown & orders trend main business divisions market
Full-Year Results January to December 2014
 Panalpina Group March 4, 2015 Full-Year Results January to December 2014 March 4, 2015 2 Highlights and key figures Operating and financial review Outlook and priorities Appendix March 4, 2015 3 Highlights
Hero Acquisitions Limited (subsidiary of HSS Hire Group plc) 9M FY15 Results
 9M FY15 Results") Hero Acquisitions Limited (subsidiary of HSS Hire Group plc) 9M FY5 Results November 205 Agenda John Gill, CEO: Introduction Steve Trowbridge, CFO: 9M Results John Gill, CEO: Summary Q&A Introduction 0.7%
Hero Acquisitions Limited (subsidiary of HSS Hire Group plc) 9M FY5 Results November 205 Agenda John Gill, CEO: Introduction Steve Trowbridge, CFO: 9M Results John Gill, CEO: Summary Q&A Introduction 0.7%
MANAGING HIGH VALUE ADDED PROCESSES GLOBALLY. EARNINGS RELEASE MARCH 31 st 2017
 MANAGING HIGH VALUE ADDED PROCESSES GLOBALLY EARNINGS RELEASE MARCH 31 st 2017 1 DISCLAIMER This document has been prepared by CIE Automotive, S.A. ("CIE Automotive"), and is for information purposes only.
RESULTS February 27 th, 2018
 RESULTS 2017 February 27 th, 2018 CONFERENCE CALL DETAILS LIVE EVENT: The Company will host a conference call for investors and analysts today at 18:30 (CET). Please find below conference call telephone
FY 2016 Results March 2nd, 2017
 FY 2016 Results March 2nd, 2017 Definitions & assumptions In this presentation: ForEx stands for Foreign Exchange Rates; Organic stands for effect net of ForEx and hedging derivatives; Q4 stands for fourth
Nine Months Results January September 2011
 Nine Months Results January September 2011 Analyst Conference Call Cautionary Statement This document has been prepared by PEGAS NONWOVENS SA (the Company ) solely for use at the Presentation. Any forward
Summary of the Results at June 30, Call with Bondholders, August 12, 2016, 17CET
 Summary of the Results at June 30, 2016 Call with Bondholders, August 12, 2016, 17CET Disclaimer This presentation has been prepared for information purposes only as part of the conference to present the
RESULTS 1 st QUARTER 2018 (IFRS, UNAUDITED)
") RESULTS 1 st QUARTER (IFRS, UNAUDITED) April 19, SAFE HARBOR This presentation includes forward-looking statements based on the beliefs of Software AG management. Such statements reflect current views
RESULTS 1 st QUARTER (IFRS, UNAUDITED) April 19, SAFE HARBOR This presentation includes forward-looking statements based on the beliefs of Software AG management. Such statements reflect current views
SecureLink Cybersecurity Services FY 2017 Financial Results Unaudited
 SecureLink Cybersecurity Services FY 2017 Financial Results Unaudited April 23th, 2018 Disclaimer Important information This Presentation (the Presentation") has been produced by SL Bidco B.V. (the Group,
Cash in the media. Relevant news
 RESULTS PRESENTATION. FY 2018 Cash in the media Relevant news Cash payment limit proposed by Spain seems disproportionate for the ECB. The European Central Bank (ECB) has issued an opinion on a draft law
RESULTS 1Q18. May 14 th, 2018
 RESULTS May 14 th, 2018 CONFERENCE CALL DETAILS LIVE EVENT: The Company will host a conference call for investors and analysts today at 12:00 (CET). Please find below conference call telephone numbers:
In 2015, we moved to a new organizational model:
 9M 2016 Results In 2015, we moved to a new organizational model: One Group, Three Businesses Leading the industry development Accelerate growth Increase specialization and efficiency Transforming the sector
Results Q4 & FY 2007 Outlook FY 2008
 Results Q4 & FY 2007 Outlook FY 2008 Analyst Conference February 26, 2008 3:00 p.m. CET Dr. Axel Herberg, CEO Hans-Jürgen Wiecha, CFO 0 Agenda Business Highlights FY 2007 Dr. Axel Herberg, CEO Financial
Q Earnings Presentation. Rainer Beaujean, Speaker of the Management Board and CFO April 12, 2018
 Q1 2018 Earnings Presentation Rainer Beaujean, Speaker of the Management Board and CFO April 12, 2018 Disclaimer This presentation may contain certain forward-looking statements, including assumptions,
Q2 & H1 FINANCIAL RESULTS. July
 Q2 & H FINANCIAL RESULTS July 29 205 Forward Looking Statements This Presentation may include forward-looking statements. Forward-looking statements are statements regarding or based upon our management
Nine Months Results January September 2012
 Nine Months Results January September 2012 Analyst Conference Call Cautionary Statement This document has been prepared by PEGAS NONWOVENS SA (the Company ) solely for use at the Presentation. Any forward
2017 FULL YEAR RESULTS. February 28,
 2017 FULL YEAR RESULTS February 28, 2018 1 Disclaimer This presentation contains both historical and forward-looking statements. These forward-looking statements are based on Carrefour management's current
Q FINANCIAL RESULTS. Milan May 10 th, 2018
 Q1 2018 FINANCIAL RESULTS Milan May 10 th, 2018 1 AGENDA Q1 2018 Highlights o o o Group overview Results by business Outlook Financial results Appendix 2 Q1 2018 Financial Highlights Organic growth recovery
1H15 Results Presentation. July 30, 2015
 1H15 Results Presentation July 30, 2015 1H15 Key facts Sales: Euro 426.9 million +6.7% (+4.0% constant FX) Directly Operated Stores Same Store Sales: +6.4% (2Q15 +7.9%) EBITDA: Euro 26.6 million +28.3%
INTERIM REPORT FOURTH QUARTER SANDVIK: Interim Report on the third quarter 2015
 INTERIM REPORT FOURTH QUARTER 2016 1 SANDVIK: Interim Report on the third quarter 2015 SUMMARY STABILIZING MARKETS STRONG ORDER INTAKE +8% SUPPORTED BY ALL BUSINESS AREAS EARNINGS GROWTH AND MARGIN IMPROVEMENT
FY 2014 Results Presentation March 5, 2015
 FY 2014 Results Presentation March 5, 2015 FY 2014 key facts Sales: Euro 824.2 million +9.3% (+10.1% constant FX) Directly Operated Stores Same Store Sales: +7.9% (vs -3.0% in FY 13) EBITDA: Euro 42.6
Results Q1 2017
 www.heliostowersafrica.com Results Q1 2017 19 May 2017 www.heliostowersafrica.com Agenda 1 Executive Summary 2 Financial Results 3 Q&A 3 Today s Team Team from Helios Towers Africa ( HTA ) Kash Pandya
WDF S.P.A. H RESULTS PRESENTATION
 WDF S.P.A. H1 2015 RESULTS PRESENTATION 30 th July 2015 WORLD DUTY FREE GROUP AFRICA AMERICAS ASIA EUROPE Forward looking statements This presentation is of a purely informative nature and does not constitute
PRESS RELEASE Paris, April 28, 2017
 PRESS RELEASE Paris, April 28, 2017 FIRST-QUARTER 2017 RESULTS (unaudited) GROWTH IN SALES AND IMPROVED PROFITABILITY RETURN TO ORGANIC SALES GROWTH IN THE US FULL-YEAR FINANCIAL TARGETS CONFIRMED SALES
First Half 2011 Conference Call
 Moving ahead First Half 2011 Conference Call 29 th July, 2011 Copyright Datalogic 2007-2011 DISCLAIMER This document has been prepared by Datalogic S.p.A. (the "Company") for use during meetings with investors