MANAGING HIGH VALUE ADDED PROCESSES GLOBALLY. EARNINGS RELEASE MARCH 31 st 2017
|
|
|
- Lewis Hoover
- 6 years ago
- Views:
Transcription

1 MANAGING HIGH VALUE ADDED PROCESSES GLOBALLY EARNINGS RELEASE MARCH 31 st
2 DISCLAIMER This document has been prepared by CIE Automotive, S.A. ("CIE Automotive"), and is for information purposes only. No reliance may or should be placed for any purposes whatsoever on the information contained in this document or on its completeness, accuracy or fairness. This document and the information contained herein are strictly confidential and are being shown to you solely for your information. The information may not be copied, distributed, reproduced or passed on, directly or indirectly, in whole or in part, or disclosed by any recipient, to any other person(whether within or outside such person's organization or firm) or published in whole or in part, for any purpose or under any circumstances. This document is an advertisement and not a prospectus for the purposes of applicable measures implementing EU Directive 2003/71/EC (such Directive, together with any applicable implementing measures in the relevant home Member State under such Directive, the "Prospectus Directive") and as such does not constitute or form part of any offer to sell or issue or invitation to purchase or subscribe for, or any solicitation of any offer to purchase or subscribefor,anysecuritiesofcieautomotiveoranyofitsaffiliatesorsubsidiaries,norshallitoranypartofitnorthefactofitsdistributionformthebasis of, or be relied on in connection with, any contract or investment decision. Investors should not subscribe for or purchase any securities referred to in this advertisement except on the basis of the information contained in any prospectus eventually published in accordance with the Prospectus Directive. The information and opinions contained in this document are provided as at the date of the document and are subject to change. This document is not an offer of securities for sale in the United States, Australia, Canada or Japan. The information contained herein does not constitute an offer of securities for sale in the United States, Australia, Canada or Japan. Securities may not be offered or sold in the United States unless they are registered or are exempt from registration. No money, securities or other consideration is being solicited and, if sent in response to the information contained herein, will not be accepted. Copies of this document are not being, and should not be, distributed or sent into the United States. This document does not constitute an offer of securities to the public in the United Kingdom or in any other jurisdiction. The distribution of this document in other jurisdictions may also be restricted by law and persons into whose possession this document comes should inform themselves about and observe any such restrictions. Certain financial and statistical information contained in this document is subject to rounding adjustments. Accordingly, any discrepancies between the totals and the sums of the amounts listed are due to rounding. Certain management financial measures included in this document have not been subject to a financial audit. The information and opinions contained in this document are provided as at the date of the document and are subject to verification, completion and change without notice. Neither CIE Automotive nor any of its parent or subsidiary undertakings, or the subsidiary undertakings of any such parent undertakings, or any of such person's respective directors, officers, employees, agents, affiliates or advisers, undertakes any obligation to amend, correct or update this document or to provide the recipient with access to any additional information that may arise in connection with it. 2


3 INDEX 1. Group Results March Balance Sheet 3. Strategic Commitments 4. CIE in Stock Exchange 3


4 GroupResults March
 0.29 +47% 0.43 31.03 Share Price ( per share) 15.84 +17% 18.")
5 HIGHLIGHTS MARCH /03/2016 % 31/03/2017 Turnover ( Mio) % EBITDA (*)( Mio) % Net Income(*) ( Mio) % 54.9 Equity ( Mio) % 1,334.6 Income per share ( ) % Share Price ( per share) % (*) EBITDA: Net Operating Income + Depreciation, Net Income: Profit attributable to the company s shareholders. 5
6 MARCH 2017 CIE GROUP RESULTS ( Mio) 31/03/2016 % 31/03/2017 Turnover % EBITDA (*) % % EBITDA on turnover 14.6% 15.1% EBIT (*) % 92.2 % EBIT on turnover 10.0% 10.7% Profit for the year % 64.9 Net Income (*) % 54.9 (*) EBITDA: Net Operating Income + Depreciation, EBIT: Net Operating Income, Net Income: Profit attributable to the company s shareholders 6

7 QUARTERLY EVOLUTION 2014/2015/2016/2017 Net Income ( Mio) Q 2Q 3Q 4Q Growing profit quarter after quarter 7
8 MARCH 2017 AUTOMOTIVE RESULTS ( Mio) 31/03/2016 % 31/03/2017 Turnover % EBITDA (*) % % EBITDA on turnover 16.3% 16.9% EBIT (*) % 85.2 % EBIT onturnover 11.1% 12.1% (*) EBITDA: Net Operating Income + Depreciation, EBIT: Net Operating Income. Significant increase in turnover with organic growth in all geographical areas. Excellent performance of margins in all regions, with a particularly significant EBIT growth reaching a 12.1% margin, in line with the Strategic Plan. 8
9 MARCH 2017 DOMINION RESULTS ( Mio) 31/03/2016 % 31/03/ % Turnover EBITDA (*) % 11.1 % EBITDA on turnover 7.5% 6.9% EBIT (*) % 7.0 % EBIT onturnover 5.0% 4.4% (*) EBITDA: Net Operating Income + Depreciation, EBIT: Net Operating Income. (**) EBITA: Net Operating Income + PPA Depreciation. Organic growth of 9.9%, above the strategic guidance of 7%. Increase of +19% and +23% in EBITDA and EBITA (**) respectively, once normalized in EBIT 1.1 Vs 0.4 million of depreciation in PPAs of the acquisitions, supported by operating leverage and in our digital model of Dominion Smart Innovation. 9
 13.0% Dominion 8.5% Brazil 4.")

10 MARCH 2017 DIVISIONS CONTRIBUTION Turnover EBITDA (*) Dominion 18.5% Brazil 8.1% NAFTA 17.7% Asia (India/China) 13.0% Dominion 8.5% Brazil 4.9% NAFTA 28.2% Asia (India/China) 13.9% Mahindra Europe 14.7% Europe 27.1% Mahindra Europe 12.9% Europe 32.5% (*) EBITDA: Net Operating Income + Depreciation. 10
11 MARCH 2017 DIVISIONS PROFITABILITY EUROPE MAHINDRA EUROPE NAFTA BRAZIL ASIA (INDIA & CHINA) DOMINION 03/16 03/17 03/16 03/17 03/16 03/17 03/16 03/17 03/16 03/17 03/16 03/17 EBITDA 17.6% 18.1% 13.0% 13.2% 23.0% 24.0% 8.5% 9.1% 12.3% 14,0% 7.5% 6.9% EBIT 10.9% 12.2% 8.7% 9.0% 18.6% 19.7% 3.8% 5.2% 7.8% 9,8% 5.0% 4.4% Sustainable margins far above market s average that continue improving thanks to new volumes Stable gradual growth in margins, in its way to achieve CIE Group standards Margins significantly higher than CIE Group average that continue growing thanks partially to excellent performance of new greenfields Margins improvement derived from the operational improvements carried out and supported by market increase Margins beginning to show the fruits of integration of Indian plants in CIE and of new projects industrialization in China In line to achieve Strategic Plan Goals 11
12 MARCH 2017 GROWTH Developed Countries (1) Emerging Countries (2) AUTOMOTIVE TOTAL DOMINION TOTAL CIE TOTAL Organic Growth 17.1% 17.2% 17.4% 9.9% 15.6% Inorganic Growth 6.3% 21.7% 9.9% 18.7% 11.9% 2017 Growth at same exchange rates 23.4% 38.9% 27.3% 28.5% 27.5% Forex 1.3% 15.2% 4.2% 1.5% 3.7% 2017 Total Growth 24.7% 54.1% 31.5% 30.0% 31.2% (1) Europe and Nafta (2) Asia and Brazil 12
 51.9% Market 22.")


13 AUTOMOTIVE GROWTH (%) Market growth vs CIE growth (1) 51.9% Market 22.7% CIE 24.0% 32.1% 23.8% 24.9% 3.0% 6.0% 7.0% 7.0% NAFTA BRAZIL EUROPE INDIA CHINA Global Production +6.0% CIE +27.3% Source: Motor vehicle production IHS March 2017(growth% in units) (1) Increase in revenue including greenfields, considering same exchange rates 13
14 Balance Sheet
15 BALANCE SHEET Mio 31/12/ /03/2017 Fixed Assets 2, ,615.3 Net Working Capital (248.9) (215.0) Total Net Assets 2, ,400.3 Equity 1, ,334.6 Net Financial Debt (*) Others (Net) Total Equity and Liabilities 2, ,400.3 (*) Net Financial Debt = Debt with banks and other financial institutions Cash and equivalents The amount of the non-recourse factoring to is 223 Mio (224 Mio in 2016) NFD/Equity 0.65x 0.68x 15
 Net Operating Working Capital Variation (7.9) Payment of Dividends (26.2) Newcor Acquisition (101.4) Acquisitions to minority shareholders (2) (5.")
16 CASH FLOW Net Financial Debt Movements Mio EBITDA Financial Expenses (10.1) Maintenance CAPEX (1) (37.9) Tax Payments (7.7) OPERATING CASH FLOW: 74.3 % OPERATING CASH FLOW / EBITDA 57.1% Greenfields and Growing Capex (21.3) Net Operating Working Capital Variation (7.9) Payment of Dividends (26.2) Newcor Acquisition (101.4) Acquisitions to minority shareholders (2) (5.8) Previous years acquisition payments (3) (6.2) Exchange rate effect 4.0 Other Movements 2.2 FINANCIAL CASH FLOW (88.2) Net Financial Debt Net Financial Debt NFD/EBITDA (4) 1.98x (1) Maintenance CAPEX: The one related to the renovation of the facilities to face market growth. (2) Acquisition of an additional 34.9% of the capital of the Brazilian subsidiary Durametal, S.A. reaching a percentage share of 84.9%. (3) Dominion Group s pending acquisitions payments: International Chimney Corporation(ICC) and Dominion Energy, S.L. (4) Last annualized 12 months EBITDA from new companies integrated during the period. 16
17 Strategic Commitments
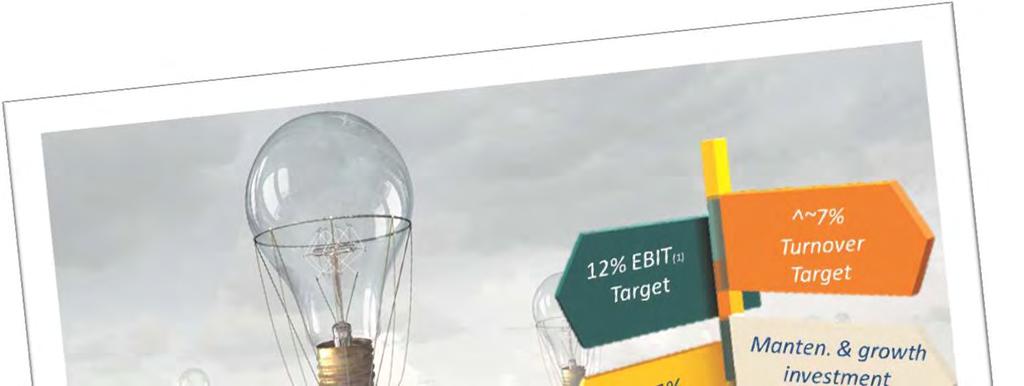
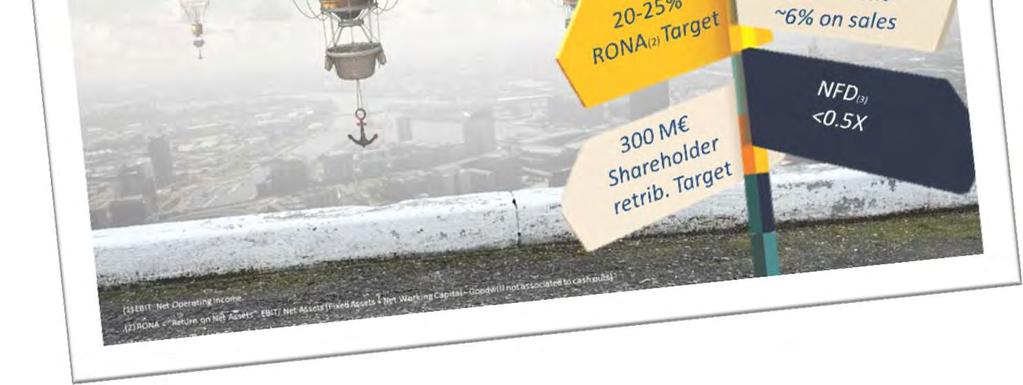


18 STRATEGIC COMMITMENTS Strategic Targets : 18

19 STRATEGIC COMMITMENTS As of today we can say that: NET PROFIT EVOLUTION We will achieve our Strategic Target a year in advance _Target Set ondic 2015 Objetivo marcado en Dic'2015 _CurrentforecastSet ondic 2016 Previsión actual a Dic'
20 CIE in Stock Exchange
21 CIE IN STOCK EXCHANGE CIE share price performance vs Ibex 35 IBEX 35 CIE Automotive 150% 130% 110% 90% 70% 50% 30% 10% -10% -30% -50% 21
 2,539 2,388 1,993 1,453 951 Number of shares")
 ajustada 18.52 15.45 19.69 11.27 8.")
 17.15 11.99 10.65 7.21 5.")
 375 940 814 600 44,953 277 Source: Madrid")
22 CIE IN STOCK EXCHANGE 2017 Until 03/ MarketCap( Mio) 2,539 2,388 1,993 1, Number of shares (Mio) % EBITDA Last price s/ cifra of period negocio (euros) ajustada Maximum price of period (euros) Minimum price of period (euros) Volume (thousand shares) 59,065 60,619 62,970 20,667 Effective ( Mio) , Source: Madrid Stock Exchange 22


23 Further information at MANAGING HIGH VALUE ADDED PROCESSES 23
MID TERM FINANCIAL REPORT MARCH 31 ST 2018 MANAGING HIGH VALUE ADDED PROCESSES GLOBALLY 1
 MID TERM FINANCIAL REPORT MARCH 31 ST 2018 MANAGING HIGH VALUE ADDED PROCESSES GLOBALLY 1 DISCLAIMER This document has been prepared by CIE Automotive, S.A. ("CIE Automotive"), and is for information purposes
SHAREHOLDERS MEETING 24 April 2018
 SHAREHOLDERS MEETING 24 April 2018 TABLE OF CONTENTS 1. CIE Automotive in 2017 1. Milestones 2. Economic results 3. CIE in Stock Exchange 2. Strategic Commitment II Targets update 2016-2020 - Automotive
General Shareholders Meeting APRIL 2015
 General Shareholders Meeting APRIL 2015 1 Table of contents 01 02 03 Group Results 2014 Strategic commitment 2013-2017 Preview of the 1Q 2015 Results 2 Group Results 2014 3 2014 CIE GROUP RESULTS ( Mio)
Business Evolution January September BUSINESS PERFORMANCE January September 2017
 BUSINESS PERFORMANCE January September 2017 1 Disclaimer This presentation, which is personal to the recipient, has been prepared and produced by Bolsas y Mercados Españoles, Sociedad Holding de Mercados
General Shareholders Meeting 30 April Grupo industrial especializado en la gestión de procesos de alto valor añadido 1
 General Shareholders Meeting 30 April 2014 Grupo industrial especializado en la gestión de procesos de alto valor añadido 1 INDEX 2013 Full Year Results Strategic Thinking 2013-2017: REAFIRMING OUR STRATEGY
Presentation of FY 2017 Results. February 26 th, 2018
 Presentation of FY 2017 Results February 26 th, 2018 Gestamp 2018 Disclaimer This presentation has been prepared solely for use at this presentation of our results as of and for the quarter ended December
- 2 - DISCLAIMER The information contained within this document may constitute inside information as stipulated under the Market Abuse Regulation. Upo
 - 2 - DISCLAIMER The information contained within this document may constitute inside information as stipulated under the Market Abuse Regulation. Upon the publication of this document via the web page
February 29 th, FY 2015 Results Presentation
 February 29 th, 2016 FY 2015 Results Presentation 1 GROWTH Excellent results in Spain and Argentina Positive organic growth in Brazil Sales growth of 4.7% including FX rate LatAm organic growth above 12%
Fourth Quarter 2015 Performance Summary
 Fourth Quarter 2015 Performance Summary Operational and Financial Highlights - 2015 Grifols revenues grow by 17.3% to Euros 3,935 million, and net profit grows by 13.2% reaching Euros 532 million of the
Mid-Term Financial Report. 30 th September
 Mid-Term Financial Report 30 th September 2012 1 Disclaimer This document includes or may include statements or estimates about intentions, expectations or forecasts of CIE AUTOMOTIVE or of its management
First Half of 2015 Performance Summary
 First Half of 2015 Performance Summary Operational and Financial Highlights - 1H 2015 Net profit grows +16.3% to Euros 261.5 million and revenues increase +18% exceeding Euros 1,900 million The revenues
Investor presentation. May 2009
 Investor presentation May 2009 1 Agenda Background Fundraising 3i s business and competitive strengths Key financials and valuations Pro forma balance sheet Summary 2 Background Analysis of 3i Strategically
Q Results. Lars Brorsen (CEO) Christoph Hobo (CFO) November 22, 2018
 Christoph Hobo (CFO) November 22, 2018") Q3 2018 Results Lars Brorsen (CEO) Christoph Hobo (CFO) November 22, 2018 Agenda 1. Highlights Q3 2018 2. Market outlook 3. Detailed results review 4. Company outlook 5. Q&A Appendix 1 Business summary
Q3 2018 Results Lars Brorsen (CEO) Christoph Hobo (CFO) November 22, 2018 Agenda 1. Highlights Q3 2018 2. Market outlook 3. Detailed results review 4. Company outlook 5. Q&A Appendix 1 Business summary
CIE Automotive Extraordinary dividend 2018: distribution of Global Dominion Access, S.A. shares
 CIE Automotive Extraordinary dividend 2018: distribution of Global Dominion Access, S.A. shares March 21 2018 MANAGING HIGH VALUE ADDED PROCESSES 1 INDEX 1. Dominion in 2015 2. Dominion Strategic Targets
O&M in the Last Mile Ezentis manages, maintains and deploys infrastructure for telecommunications and utilities companies.
 1 O&M in the Last Mile Ezentis manages, maintains and deploys infrastructure for telecommunications and utilities companies. Focus on Latin America where Ezentis activity represents 91,3% of total Group
2014 Results. 18 February 2015 Madrid
 2014 Results 18 February 2015 Madrid Disclaimer/Notice to Recipients This presentation contains forward-looking statements and information relating to Abertis Infraestructuras, S.A. ( Abertis ) and its
Deutsche Bank 10 th Annual Global Consumer Goods Conference. Building a Stronger Hellenic. 12 June 2013 Coca-Cola HBC
 Deutsche Bank 10 th Annual Global Consumer Goods Conference Building a Stronger Hellenic 12 June 2013 Coca-Cola HBC 1 Disclaimers NOT FOR RELEASE, PUBLICATION OR DISTRIBUTION, DIRECTLY OR INDIRECTLY, IN
In 2015, we moved to a new organizational model:
 9M 2016 Results In 2015, we moved to a new organizational model: One Group, Three Businesses Leading the industry development Accelerate growth Increase specialization and efficiency Transforming the sector
Mark Dickie Business Development Manager. Versarien Advanced Composites
 Versarien Advanced Composites Mark Dickie Business Development Manager Versarien Advanced Composites The Commercial Picture Current global market value for Graphene is estimated to be < US $50M growing
FY 2017 FINANCIAL RESULTS. March 1 st, 2018
 FY 2017 FINANCIAL RESULTS March 1 st, 2018 FY 2017 Results 1. Highlights 2. FY Financial Performance Analysis 3. Appendix Verallia FY 2017 Financial Results 01/03/2018 2 2017 HIGHLIGHTS A very good financial
LIGHT SWEET CRUDE OIL FUTURES CONTRACTS
 LIGHT SWEET CRUDE OIL FUTURES CONTRACTS CL CONTRACT DETAILS 25 april 2018 Moscow Exchange launched Light Sweet Crude Oil Futures, «mirror» to the NYMEX contracts; Trading venue Moscow Exchange, information
Ezentis increases its EBITDA by 142,3% in the first nine months of the year up to 16,4 million Euros
 Results Presentation Ezentis increases its EBITDA by 142,3% in the first nine months of the year up to 16,4 million Euros The revenue of the Company increased by 30% up to 228,5 million Euros thanks to
First Quarter 2016 Performance Summary
 First Quarter 2016 Performance Summary Operational and Financial Highlights - 1Q 2016 Grifols' revenues increase by +5.6% to Euros 959 million, driven by growth of +10.9% for the Bioscience Division The
1Q Performance Summary
 1Q 2015 - Performance Summary Operational and Financial Highlights - 1Q 2015 Net profit up by +6.2% to Euros 128.5 million Income grows by +13.8% (+1.1% cc*) to Euros 908.4 million, driven by sales of
Step Changing The Growth Opportunity
 Step Changing The Growth Opportunity US acquisition, proposed equity placing and trading update -2 October 2017 Disclaimer THIS PRESENTATION IS NOT FOR DISTRIBUTION IN WHOLE OR IN PART (DIRECTLY OR INDIRECTLY)
new business seize the potential H&M GROUP CAPITAL MARKETS DAY 2018
 new business seize the potential H&M GROUP CAPITAL MARKETS DAY 2018 Disclaimer THIS PRESENTATION IS NOT AN OFFER OR SOLICITATION OF AN OFFER TO BUY OR SELL SECURITIES. IT IS SOLELY FOR USE AT A CAPITAL
Highlights from the 17-April CoT survey of IMM leveraged funds
 Highlights from the 17-April CoT survey of IMM leveraged funds Greg Anderson, CFA, PhD - Global head of FX strategy gregory.anderson@bmo.com +1 212 65 149 April 2, 218 Long-GBP is the most concentrated
Highlights from the 10-July CoT survey of IMM leveraged funds
 Highlights from the 1-July CoT survey of IMM leveraged funds Greg Anderson, CFA, PhD - Global head of FX strategy gregory.anderson@bmo.com +1 212 65 149 July 13, 218 Short-NZD the biggest side with short-eur
RESULTS PRESENTATION FOR THE OCTOBER TO DECEMBER PERIOD (Q4) 27 February 2019
 27 February 2019") RESULTS PRESENTATION FOR THE OCTOBER TO DECEMBER PERIOD (Q4) 27 February 2019 Key Highlights The BoD has appointed Jose Diaz as CEO of Parques Reunidos 2019 Key Actions The company is working on a new
RESULTS PRESENTATION FOR THE OCTOBER TO DECEMBER PERIOD (Q4) 27 February 2019 Key Highlights The BoD has appointed Jose Diaz as CEO of Parques Reunidos 2019 Key Actions The company is working on a new
NOT FOR PUBLICATION, DISTRIBUTION OR RELEASE IN OR INTO THE UNITED STATES OF AMERICA, CANADA, JAPAN OR AUSTRALIA
 NOT FOR PUBLICATION, DISTRIBUTION OR RELEASE IN OR INTO THE UNITED STATES OF AMERICA, CANADA, JAPAN OR AUSTRALIA This announcement is an advertisement and not a prospectus and not an offer of securities
Important Regulatory Notice
 Important Regulatory Notice NOT FOR RELEASE, PUBLICATION OR DISTRIBUTION, IN WHOLE OR IN PART, DIRECTLY OR INDIRECTLY, IN OR INTO THE UNITED STATES, AUSTRALIA, CANADA, JAPAN OR ANY JURISDICTION WHERE TO
Investor Call Half-Year Results 2015
 Investor Call Half-Year Results 2015 November 2, 2015 Michael Frick, Corporate EVP and CFO Philipp Kuckuck, Director Corporate Finance Highlights Successful business development in H1 2015 with above market
During 2016 we have delivered
 FY 2016 Results During 2016 we have delivered EBIT improvement both in absolute and relative terms EBIT improvement +5% 324 342 EBIT margin improvement +60 bps 8.2% 8.8% MM Business figures MM 4Q Recovery
BIOPHARMA CREDIT PLC FINAL RESULTS OF THE TENDER OFFERS: APPLICATIONS REPRESENTING SEED ASSETS WITH AN AGGREGATE VALUE OF US$338.
 NOT FOR RELEASE, DISTRIBUTION OR PUBLICATION, IN WHOLE OR IN PART, DIRECTLY OR INDIRECTLY, TO ANY US PERSONS OR IN OR INTO THE UNITED STATES, AUSTRALIA, CANADA, SOUTH AFRICA OR JAPAN, OR ANY OTHER JURISDICTION,
SMART STEEL. Q Results. Detlef Borghardt, CEO Dr. Matthias Heiden, CFO. November 8, 2018
 SMART STEEL Q3 218 Results Detlef Borghardt, CEO Dr. Matthias Heiden, CFO November 8, 218 Agenda Business Summary Preliminaries confirmed Market update Segments: Status and profitability trend in the regions
Fourth Quarter 2016 Performance Summary
 Fourth Quarter 2016 Performance Summary Operational and Financial Highlights - 2016 Net profit rises by +2.5% to Euros 545.5 million Recurring sales (excluding Raw Materials and Others) rise by +4.5% (+4.6%
Coal & renewables in the energy transition
 Coal & renewables in the energy transition JEYAKUMAR JANAKARAJ CEO AND COUNTRY HEAD Brisbane Energy Club 22 March 2018 Confidentiality and Disclaimer This presentation includes proprietary and confidential
1Q18 Key figures SALES 8,671 +3,7% +14,7% EBIT % +16.9% NET PROFIT % +13.4% NET DEBT % BACKLOG 66,677-2,1% +10.
 Key figures Figures in million YoY Var. Like for Like Var. 1 SALES 8,671 +3,7% +14,7% EBIT 473 +7.9% +16.9% NET PROFIT 250 +7.4% +13.4% NET OPERATING CASH FLOW (2) LTM 1,603 +40.9% NET DEBT 359-78.8% BACKLOG
Company Presentation. Managing high value added processes. January 2016
 Company Presentation Managing high value added processes January 2016 1 DISCLAIMER This document has been prepared by CIE Automotive, S.A. ("CIE Automotive"), and is for information purposes only. No reliance
Portucel S.A. Assembleia Geral 21 de Maio de Results Presentation
 Portucel S.A. Assembleia Geral 21 de Maio de 2013 2015 Results Presentation Disclaimer This presentation does not constitute or form part of and should not be construed as any offer or invitation to sell
First Half 2016 Performance Summary
 First Half 2016 Performance Summary Operational and Financial Highlights - 1H 2016 Strong positive growth for the four main plasma proteins, that jointly with the others, take the revenues of the Bioscience
WDF S.P.A. Q4 & FULL YEAR 2014 RESULTS PRESENTATION
 WDF S.P.A. Q4 & FULL YEAR 2014 RESULTS PRESENTATION 11 th March 2015 WORLD DUTY FREE GROUP AFRICA AMERICAS ASIA EUROPE Important Note THE PROPORTIONAL PARTIAL DEMERGER OF AUTOGRILL S.P.A., WHEREBY AUTOGRILL
X-FAB Q Results
 PRESS RELEASE NOT FOR RELEASE, PUBLICATION OR DISTRIBUTION, DIRECTLY OR INDIRECTLY, IN OR INTO THE UNITED STATES OF AMERICA, AUSTRALIA, SOUTH AFRICA, CANADA OR JAPAN OR ANY OTHER JURISDICTION WHERE TO
Third Quarter 2016 Performance Summary
 Third Quarter 2016 Performance Summary Operational and Financial Highlights - 9M 2016 Sales of the Bioscience Division grow by +6.5%, increasing Grifols revenues to EUR 2,951.7 million over EUR 1,000 million
Cash in the media. Relevant news
 RESULTS PRESENTATION. FY 2018 Cash in the media Relevant news Cash payment limit proposed by Spain seems disproportionate for the ECB. The European Central Bank (ECB) has issued an opinion on a draft law
Altran Q results. October 26, 2018
 Altran Q3 2018 results October 26, 2018 Disclaimer 2 This presentation has been prepared by Altran Technologies S.A. ( Altran ) in connection with the publication of its Q3 results and does not purport
2017FY - Results presentation. March 21, 2018
 2017FY - Results presentation March 21, 2018 Disclaimer This presentation has been prepared by SIT S.p.A. only for information purposes and for the presentation of the Group s results and strategies. For
Steinhoff Africa Retail Limited. (Previously K (South Africa) Proprietary Limited) (Incorporated in the Republic of South Africa)
 Proprietary Limited) (Incorporated in the Republic of South Africa)") Steinhoff Africa Retail Limited (Previously K2017221869 (South Africa) Proprietary Limited) (Incorporated in the Republic of South Africa) (Registration number: 2017/221869/06) Share Code: SRR ISIN: ZAE000247995
Steinhoff Africa Retail Limited (Previously K2017221869 (South Africa) Proprietary Limited) (Incorporated in the Republic of South Africa) (Registration number: 2017/221869/06) Share Code: SRR ISIN: ZAE000247995
I N V E S T O R P R E S E N TAT I O N F Y
 I NVESTO R PRESENTATION 2017 FY Disclaimer By opening this presentation and/or attending the meeting where this presentation is made, you agree to be bound by the following limitations and restrictions.
EVRY IFRS 15 Transition 4 MAY 2018
 EVRY Transition 4 MAY 2018 Transition EVRY has adopted using the modified retrospective method Only contracts not completed at 31 December 2017 have been subject to transition to Prior comparative periods
US Rates Outlook: The Fed s Third Mandate
 US Rates Outlook: The Fed s Third Mandate April 2016 Gennadiy Goldberg US Rates Strategist gennadiy.goldberg@tdsecurities.com 1 (212) 827-7180 Lopsided employment picture rapidly improving 2 Wage inflation:
Q Results presentation
 Q1 2016 Results presentation 12 May 2016 1 Disclaimer This presentation (the "Presentation") has been prepared and is issued by, and is the sole responsibility of Telepizza Group, S.A. ( Telepizza" or
ANNOUNCEMENT OF INTENTION TO FLOAT ON THE SPANISH STOCK EXCHANGES
 NOT FOR RELEASE OR DISTRIBUTION OR PUBLICATION IN WHOLE OR IN PART, DIRECTLY OR INDIRECTLY, IN OR INTO THE UNITED STATES, CANADA, AUSTRALIA, JAPAN OR ANY OTHER JURISDICTION WHERE TO DO SO MIGHT CONSTITUTE
November Russian equity market key trends
 November 2017 Russian equity market key trends US France UK India Japan China Germany Russia Brazil Indonesia Russian equity market on a GDP scale Global comparison Trends in Russia MCap / GDP, % Dynamics
INVESTOR PRESENTATION
 HEALTHCARE LIMITED (ASX: ZNT) INVESTOR PRESENTATION NEXTT HOME CARE TRANSACTION 3 JULY 2017 Important Notice and Disclaimer The information contained in this presentation has been prepared by Zenitas Healthcare
WDF S.P.A. H RESULTS PRESENTATION
 WDF S.P.A. H1 2015 RESULTS PRESENTATION 30 th July 2015 WORLD DUTY FREE GROUP AFRICA AMERICAS ASIA EUROPE Forward looking statements This presentation is of a purely informative nature and does not constitute
Conference Call July 28, Build with passion
 Conference Call July 28, 2017 Build with passion 1 WashTec Conference Call July 28, 2017 Activities H1 2017 Growth Shows in Münster, Bologna, Munich, Las Vegas Functional & regional Excellence Centralisation
STRATEGICALLY POSITIONED FOR GROWTH.
 STRATEGICALLY POSITIONED FOR GROWTH. ANNUAL REPORT 2017 SHOP APOTHEKE EUROPE N.V. DR. ULRICH WANDEL, CFO 12 MARCH 2018 DISCLAIMER. 2 THIS PRESENTATION AND ITS CONTENTS ARE NOT FOR RELEASE, PUBLICATION
First Quarter 2017 Earnings Results
 First Quarter 2017 Earnings Results Performance Summary May 3, 2017 Legal Disclaimer The facts and figures contained in this report that do not refer to historical data are future projections and assumptions.
Q RESULTS May 14th, 2018
 Q1 2018 RESULTS May 14th, 2018 1 Disclaimer This document has been prepared by HelloFresh SE (the Company and, together with its subsidiaries, the Group ). All material contained in this document and information
Adif - Alta Velocidad
 Adif - Alta Velocidad Investor Presentation December 2016 Adif - Alta Velocidad Receipt of this presentation implies your agreement with the restrictions outlined below. NOTHING IN THIS PRESENTATION CONSTITUTES
FINAL RESULTS 12 MONTHS TO 31 DECEMBER 2017
 FINAL RESULTS 12 MONTHS TO 31 DECEMBER 2017 AGENDA Overview Financial Highlights SIPP Proposition Progressing the Strategy Appendix 1 Our business Appendix 2 Consolidated statements Appendix 1 summarises
Presentation 4Q Februar 2018-
 Presentation 4Q 2017-9. Februar 2018- Disclaimer This presentation (the Presentation ) has been produced by Master Marine and Jacktel AS (the Issuer, Parties, Master Marine or Jacktel ), solely for use
EN+ GROUP PLC ANNOUNCEMENT OF OFFER PRICE
 **NOT FOR PUBLICATION, DISTRIBUTION OR RELEASE, DIRECTLY OR INDIRECTLY, IN WHOLE OR IN PART, IN OR INTO THE UNITED STATES OF AMERICA, CANADA, JAPAN, THE RUSSIAN FEDERATION, AUSTRALIA, OR TO ANY OTHER JURISDICTION
Q RESULTS November 2017
 Q3 2017 RESULTS November 2017 1 Disclaimer This document has been prepared by HelloFresh SE (the Company and, together with its subsidiaries, the Group ). All material contained in this document and information
Investor Presentation DBS Group Holdings Ltd November 2017
 Investor Presentation DBS Group Holdings Ltd November 2017 Disclaimer: The information contained in this document is intended only for use during the presentation and should not be disseminated or distributed
SMART STEEL. Q Results. Detlef Borghardt, CEO Dr. Matthias Heiden, CFO. August 14, 2018
 SMART STEEL Q2 218 Results Detlef Borghardt, CEO Dr. Matthias Heiden, CFO August 14, 218 Agenda Business Summary Guidance adjustment FY 218 Market update Regional trends: Status and profitability trend
FOLLI FOLLIE GROUP First Quarter 2011 Financial Results. May 26 th, 2011
 FOLLI FOLLIE GROUP First Quarter 2011 Financial Results May 26 th, 2011 Revenue split by geographical region North America 1,2% Asia incl. Japan 39,3% Greece 48,0% Europe 11,5% 763 total POS with 48 new
BREMBO: REVENUES AT 30 SEPTEMBER 2017 UP +8.1% TO 1,852.0 MILLION, EBITDA AT MILLION (+9.5%), EBIT AT MILLION (+6.4%)
, EBIT AT MILLION (+6.4%)") Stezzano, 9 November 2017 BREMBO: REVENUES AT 30 SEPTEMBER 2017 UP +8.1% TO 1,852.0 MILLION, EBITDA AT 369.1 MILLION (+9.5%), EBIT AT 270.3 MILLION (+6.4%) Compared to the first nine months of 2016: Strong
Stezzano, 9 November 2017 BREMBO: REVENUES AT 30 SEPTEMBER 2017 UP +8.1% TO 1,852.0 MILLION, EBITDA AT 369.1 MILLION (+9.5%), EBIT AT 270.3 MILLION (+6.4%) Compared to the first nine months of 2016: Strong
Results Presentation 1Q May 12 th 2017
 Results Presentation 1Q 2017 May 12 th 2017 Executive Summary OPERATING OUTPERFORMANCE 11% Sales & EBIT recovery in CIMIC & margins stability NET PROFIT GROWTH in the HIGH END TARGET 12.6% like-for-like*
2013 IR PRESENTATION albasmelter.com
 2013 IR PRESENTATION Disclaimer This document has been prepared and issued by and is the sole responsibility of Aluminium Bahrain B.S.C. (the Company ). The document is being supplied to you solely for
sustainability leading the change towards a sustainable fashion future H&M GROUP CAPITAL MARKETS DAY 2018
 sustainability leading the change towards a sustainable fashion future Disclaimer THIS PRESENTATION IS NOT AN OFFER OR SOLICITATION OF AN OFFER TO BUY OR SELL SECURITIES. IT IS SOLELY FOR USE AT A CAPITAL
NOT FOR PUBLICATION, DISTRIBUTION OR RELEASE, DIRECTLY OR INDIRECTLY, IN THE UNITED STATES OF AMERICA, AUSTRALIA, CANADA, JAPAN OR SOUTH AFRICA
 RALLYE EUR 200,000,000 5.25 per cent. Non-Dilutive Cash Settled Bonds due 2022 Exchangeable into Existing Shares of Casino, Guichard-Perrachon (the Bonds ) (ISIN code FR0013215415) Capitalised terms not
ADES International Holding announces indicative price range for offering of ordinary shares on the London Stock Exchange
 THIS ANNOUNCEMENT IS NOT BEING MADE IN, IS NOT DIRECTED AT AND MAY NOT BE DISTRIBUTED OR SENT INTO OR OTHERWISE MADE ACCESSIBLE BY PERSONS LOCATED IN THE UNITED STATES OF AMERICA, AUSTRALIA, CANADA, JAPAN
COMISIÓN NACIONAL DEL MERCADO DE VALORES C/ Edison, nº Madrid. Madrid, November 15, 2018
 COMISIÓN NACIONAL DEL MERCADO DE VALORES C/ Edison, nº 4 28006 Madrid Madrid, November 15, 2018 QUABIT INMOBILIARIA, S.A. ( Quabit or the Company ), in compliance with what is established in article 228
Forward-looking Statements
 Forward-looking Statements This presentation has been produced by BW LPG Limited ( BW LPG ) exclusively for information purposes. This presentation may not be reproduced or redistributed, in whole or in
Carrefour places US$500 million non-dilutive cash settled convertible bonds
 This press release does not constitute or form a part of an offer of or solicitation to purchase securities in the United States of America or to, or for the account or benefit of, U.S. Persons (as defined
INVESTOR PRESENTATION Results 2Q2018. August 16, 2018
 INVESTOR PRESENTATION Results 2Q2018 August 16, 2018 RESULTS SECOND QUARTER 2018 DISCLAIMER This presentation provides general information about Sociedad Matriz SAAM S.A. ( SMSAAM ) and related companies.
Q Results presentation
 Q1 2018 Results presentation 12 May 2016 1 15 May, 2018 Disclaimer This presentation (the "Presentation") has been prepared and is issued by, and is the sole responsibility of Telepizza Group, S.A. ( Telepizza"
Case Study 2-and-20 vs. 1-or-30 (no hurdle) February 2017 Jonathan Koerner
 February 2017 Jonathan Koerner") Case Study 2-and-20 vs. 1-or-30 (no hurdle) February 2017 Jonathan Koerner presentation or the contents of this presentation. The VAMI is calculated based on fee structures shown, as applied against HFRIFWI
Case Study 2-and-20 vs. 1-or-30 (no hurdle) February 2017 Jonathan Koerner presentation or the contents of this presentation. The VAMI is calculated based on fee structures shown, as applied against HFRIFWI
RESULTS 1Q18. May 14 th, 2018
 RESULTS May 14 th, 2018 CONFERENCE CALL DETAILS LIVE EVENT: The Company will host a conference call for investors and analysts today at 12:00 (CET). Please find below conference call telephone numbers:
Agenda for the Extraordinary General Meeting of Shareholders on November 19, 2015
 CREDIT SUISSE GROUP AG Paradeplatz 8 Tel. +41 844 33 88 44 P.O.Box Fax +41 44 333 88 77 CH-8070 Zurich media.relations@credit-suisse.com Switzerland This document is not for release, publication or distribution
Delivering our Global Growth Strategy. Proposed Acquisition of AST Farma and Le Vet Beheer
 Delivering our Global Growth Strategy Proposed Acquisition of AST Farma and Le Vet Beheer Disclaimer NOT FOR REDISTRIBUTION OR RELEASE, DIRECTLY OR INDIRECTLY, IN OR INTO THE UNITED STATES OR ANY OTHER
( million) Change. Revenues % EBITDA % on revenues EBIT % on revenues Pre-tax profit % on revenues Net profit % on revenues
 Change. Revenues % EBITDA % on revenues EBIT % on revenues Pre-tax profit % on revenues Net profit % on revenues") Stezzano, 14 May 2015 BREMBO GOOD START OF 2015: REVENUES FOR Q1 2015 UP 15.1% TO 514.3 MILLION, EBITDA AT 85.7 MILLION (+21.8%), EBIT AT 59.1 MILLION (+25.1%), NET PROFIT AT 45.8 MILLION (+27.5%) Compared
Stezzano, 14 May 2015 BREMBO GOOD START OF 2015: REVENUES FOR Q1 2015 UP 15.1% TO 514.3 MILLION, EBITDA AT 85.7 MILLION (+21.8%), EBIT AT 59.1 MILLION (+25.1%), NET PROFIT AT 45.8 MILLION (+27.5%) Compared
Sanlam Limited. Proposed placing of new ordinary shares to raise up to ZAR 5,700 million
 Sanlam Limited Incorporated in the Republic of South Africa Registration number: 1959/001562/06 JSE share code: SLM NSX share code: SLA ISIN: ZAE000070660 ("Sanlam" or the "Company") THIS ANNOUNCEMENT
PLEASE SEE THE IMPORTANT NOTICE AT THE END OF THIS ANNOUNCEMENT. Resolution For Against Votes Withheld Votes % Votes %
 NOT FOR RELEASE, PUBLICATION OR DISTRIBUTION IN WHOLE OR IN PART, DIRECTLY OR INDIRECTLY IN, INTO OR FROM THE UNITED STATES OF AMERICA, AUSTRALIA, CANADA, JAPAN, SOUTH AFRICA OR ANY JURISDICTION WHERE
Our Brand Mission. COS is a fashion brand for women, men and children. Quality is our essence.
 Disclaimer THIS PRESENTATION IS NOT AN OFFER OR SOLICITATION OF AN OFFER TO BUY OR SELL SECURITIES. IT IS SOLELY FOR USE AT A CAPITAL MARKETS EVENT AND IS PROVIDED AS INFORMATION ONLY. THIS PRESENTATION
Kuehne + Nagel International AG
 Kuehne + Nagel International AG Analyst Conference Call 1 st Half-Year 2011 Results July 18, 2011 (CET 14.00) Schindellegi, Switzerland Agenda Welcome & Highlights 1st Half Year 2011 Gerard van Kesteren
Conference Call 4Q17. Improved business dynamics and return on invested capital
 Conference Call 4Q17 Improved business dynamics and return on invested capital Disclaimer This is a support document for the WEG S.A. 2017 fourth quarter results conference call. Any forecasts contained
Carrefour launches an offering of US$500 million non-dilutive cash settled convertible bonds
 This press release does not constitute or form a part of an offer of or solicitation to purchase securities in the United States of America or to, or for the account or benefit of, U.S. Persons (as defined
Investor Event Mahindra CIE Automotive Limited. 25 th October 2016 Mumbai
 Investor Event Mahindra CIE Automotive Limited 25 th October 2016 Mumbai 1 2 AGENDA 1. Introduction to MCIE 2. MCIE: From 1 st to 2 nd Phase 3. New Organization 4. Bill Forge Acquisition 5. MCIE Strategic
The account opening process will only be completed once the application has been received and accepted by HSBC Bank (Singapore) Limited.
 Limited.") Disclaimer Important information for clients maintaining assets in a country outside their primary country of residence Please read the following carefully as it contains important information governing
Disclaimer Important information for clients maintaining assets in a country outside their primary country of residence Please read the following carefully as it contains important information governing
FF GROUP Nine Months 2017 Financial Results
 FF GROUP Nine Months 2017 Financial Results DISCLAIMER This document is for institutional investors only and is not available to private customers. This document is being supplied to a limited number of
Publication of prospectus - RNS - London Stock Exchange. Publication of prospectus
 Page 1 of 5 Regulatory Story Go to market news section Future PLC - FUTR Publication of prospectus Released 12:33 18-Jul-2018 RNS Number : 0520V Future PLC 18 July 2018 NOT FOR RELEASE, PUBLICATION OR
ANNOUNCEMENT OF CAPITAL RAISING
 ANNOUNCEMENT OF CAPITAL RAISING NOT FOR RELEASE, PUBLICATION OR DISTRIBUTION, IN WHOLE OR IN PART, DIRECTLY OR INDIRECTLY, IN OR INTO OR FROM AUSTRALIA, NEW ZEALAND, SOUTH AFRICA, JAPAN, CANADA OR SWITZERLAND
Valmet focus on profitability improvement
 Valmet focus on profitability improvement SEB Nordic Seminar 2015, Copenhagen Pasi Laine, President and CEO Agenda Valmet Roadshow 1 2 3 4 Valmet overview Financial targets Q3/2014 in brief Conclusions
Consolidated Group results
 PRESS RELEASE Stezzano, 19 March 2009 For immediate release Brembo Board of Directors approves the 2008 Draft Annual Report: Revenues +16.3% EBITDA +2.9% Net profit 38.3% Dividend proposal of 0.225 per
2018 Half Year Results
 A GLOBAL LEADER IN METAL FLOW ENGINEERING 2018 Half Year Results 26 July 2018 Patrick André Chief Executive 1 Disclaimer This presentation, which has been prepared by Vesuvius plc (the Company ), includes
CONDOR GOLD. Mines and Money Conference. 1 st to 3 rd December 2015 CONDOR GOLD PLC
 CONDOR GOLD Mines and Money Conference 1 st to 3 rd December 2015 DISCLAIMER This written presentation (the "Slides") has been prepared by Condor Gold plc (the "Company"). The Slides are the sole responsibility
IQ 2018 RESULTS PRESENTATION
 IQ 2018 RESULTS PRESENTATION 10 MAY 2018 AGENDA Financial data Operational data Market environment Regulatory environment Appendix 2 FINANCIAL DATA FINANCIAL DATA Financial consolidated highlights (in