Paris. European Midcap Event. 29 June 2017
|
|
|
- Antony Robinson
- 6 years ago
- Views:
Transcription


1 Paris European Midcap Event 29 June 2017
2 CONTENTS 1. Products and Applications 2. Business Model - Highlights 3. Shareholder Structure 4. History of the Group 5. Management Team 6. Strengths 7. Technological Leadership 8. Financial Results 9. Spirotech Acquisition 10. From AIM Italia to MTA 11. Share price 12. The path ahead 13. Future Development 14. Disclaimer 2

3 1 Products and Applications Heat exchangers 3


4 1 Products and Applications Refrigeration Storage of fresh foods in general and fast freezing of perishable foods 4

5 1 Products and Applications Air Cooled Equipment - Air Conditioning 5


6 1 Products and Applications Close Control Air Conditioning Precision air conditioning Operating theatres White rooms Data centers and telephone exchanges 6


7 1 Products and Applications Glass doors and closing systems 7

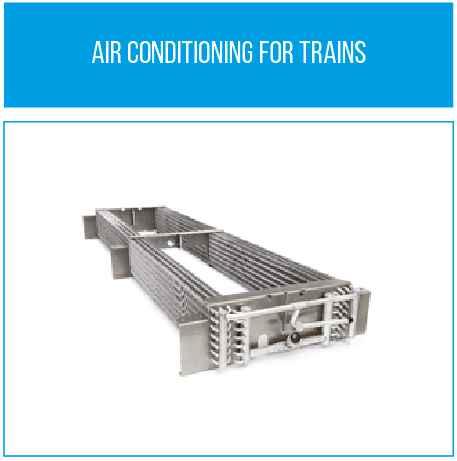
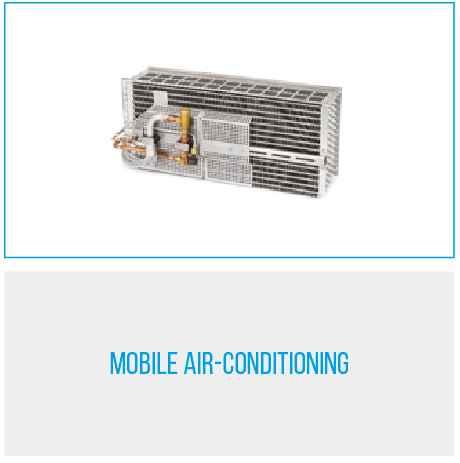

8 1 Products and Applications Mobile applications 8
9 2 LU-VE Business Model Highlights Leadership, growth, global LONG TERM GROWTH AND RESILIENT CASH GENERATION (1) (2) (3) Proforma revenues 2016 ( MN) 251,3 CAGR turnover ,0% Proforma EBITDA 2016 Adjusted ( MN) 35,0 EBITDA ADJ MARGIN % AVERAGE ,2% LEADING MANUFACTURER OF AIR COOLED EQUIPMENT AND HEAT EXCHANGERS European leader for more than 40% of turnover with market share of 40/50% TECHNOLOGICAL LEADERSHIP A GLOBAL GROUP WITH STRONG PRESENCE IN ITALY / EUROPE (3) Over 73% of turnover comes from outside Italy (main export market GERMANY) 50% of production is outside Italy (POL, CZE, SWE, RUS, CHN, IND) 2404 employees (787 in Italy) on October 2016: Acquisition of SPIROTECH (India) 21 st June 2017: listed on MTA market in Milan (1) In data are based on IFRS data are based on ITA GAAP (2) Adjusted to exclude extraordinary items (3) Pro forma means the aggregated result of: a) consolidated results of LUVE Group and b) Spirotech 9
10 2 LU-VE Business Model Highlights BREAKDOWN OF SALES 2015 BY APPLICATION PRODUCTS % of sales (1) APPLICATIONS TYPE OF CUSTOMER Heat exchangers 57% Refrigeration Air conditioning Special applications (whitegoods, transport etc.) OEM Air cooled equipment Glass doors for refrigerated display cabinets 33% Refrigeration Air conditioning Power Generation Distributors/Installers 6% Refrigeration OEM Close control 4% Air conditioning Distributors/Installers (1) Pro-forma data based on 2016 actual results plus Spirotech 10
 Breakdown of")

 Uboldo (VA) Italy Limana (BL) Italy Travacò Sicc.")
 (1) Pro-forma data based on")
11 2 LU-VE Business Model Highlights LU-VE sells its products in more than 100 countries Germany is its main export market (9% of total sales) Breakdown of sales 2016 by geographical area (1) Europe 53% RoW 22% Italy 25% 6 SALES COMPANIES Australia Melbourne China Hong Kong France Lyon Germany Stuttgart India New Delhi Spain Madrid 1 REPRESENTATIVE OFFICE UAE - Dubai 11 PRODUCTION FACILITIES Italy (3) Uboldo (VA) Italy Limana (BL) Italy Travacò Sicc. (PV) Poland Gliwice Czech Republic Novosedly Na Moravĕ Sweden Asarum Russia Lipetsk China Changshu India Bhiwadi (Rajasthan) (1) Pro-forma data based on 2016 actual results plus Spirotech 11
12 3 Shareholder Structure (1) 50.08% 17.56% 32,36% (1) Fully diluted post warrant conversion at end of May

13 4 - History of the Group Tradition, innovation and passion LU-VE: LUcky VEnture The future has an ancient heart Carlo Levi 13

14 4 - History of the Group A history of successful partnerships MTA 2017 MARKET LU-VE financial statements have been audited since 1986 Since 2015 financial statements are based on IFRS 14
 1991 1994 2002 2003 2004 2007 2011 2014 2016 SEST (ITA) HTS (CZE) AIA (SWE) TGD (ITA) SPIROTECH (IND) GREENFIELD ACQUISITIONS")
15 4 - History of the Group Organic growth and acquisitions TECNAIR (ITA) SEST LU-VE (POL) METALLUVE (ITA) SEST LU-VE (RUS) LU-VE (CHN) MANIFOLD (ITA) LU-VE DIGITAL (ITA) SEST (ITA) HTS (CZE) AIA (SWE) TGD (ITA) SPIROTECH (IND) GREENFIELD ACQUISITIONS 15

16 5 Management Team 16
17 6 - Strengths Market Leadership High level of customer loyalty Glocal approach Low cyclicity Technological leadership Half of total turnover comes from areas in which the Group is the European leader High cost of replacing supplier/co-design Brand value Plants in Italy, Poland, Czech Rep., Sweden, Russia, India and China Almost 50% of production is made outside Italy Extensive commercial structure Wide range of fields of application Wide variety of customers and end users Direct sales in more than 100 countries See next page 17
 Main")
18 7 Technological Leadership Strengths Technological leadership R&D leadership First in the world to obtain Eurovent/TÜV SÜD performance certification Definition of new energy efficiency standards for the sector, Constant introduction of technological innovation and patents onto the market First in the world to use nanotechnology in heat exchange process Eurovent Certified LU-VE (Exchangers) Main Failure Value 0% ( ) The largest R&D laboratory for the sector in Europe (the only one able to test CO2 systems) The first to use computational fluid dynamics, CFD First in the sector to use green technology/solutions, LCC/LCA Life Cycle Costing/ Assessment Works with more than 22 universities and research institutes in 13 different countries 18


19 7 - Patents & Innovations «Less raw material, more brain power»
20 8 Financial highlights (IFRS) Pro-forma (1) consolidated sales (2) : 248.3m (+18,8% vs. FY15) ; + 9.7% on LFL basis (3) Pro forma adj. (4) EBITDA : 14.1% (vs 13.9% in FY15) Group net income margin: 7.4% (vs 4.6% in FY15) NFD: (30.2m) (vs 4.2 m as of Dec 2015) Net cash generation (12 months adjusted) (5) : 12.1 m (vs 13.1 in FY15) m 2016 Proforma (1) 2015 LFL Growth (3) Sales of finished products (2) 248,3 100,0% 209,1 100,0% +9,7% EBITDA 33,0 13,3% 26,2 12,5% +17,3% EBITDA adjusted (4) 35,0 14,1% 29,1 13,9% +7,0% Group net income 18,3 7,4% 9,6 4,6% +68,5% Net financial position (debt) (5) (30,2) 4,2 Net cash generation adj (6) 12,1 13,1 Notes (1) Pro-forma means the aggregated results of: a) consolidated results of LUVE Group and b) Spirotech (4) Excluding one time costs (2) Excluding other sales of 3,0 M in 2016 and 3,2 in 2015 (5) Including PUT&CALL on minority (3) LFL = excluding Spirotech (6) See page 10 for details 20
21 8 Financial Results (1) Turnover, EBITDA, Net Income and Cash Generation Trends Turnover EBITDA ADJ (2) ) based on IFRS based on ITA GAAP 2016 proforma 2) Pro forma means the aggregated result of: a) consolidated results of LUVE Group and b) Spirotech 3) Adjustments to exclude extraordinary items Group Net Income Net Cash Generation ADJ (3) AVG = 11,6 M 21
22 9 - Spirotech Acquisition On October 5 th 2016, Luve acquired 95% of Spirotech Spirotech is a leading and fast growing Indian producer of heat exchanger for HVAC (1) industry, home appliances and transportation: turnover of 21 (2) millions with an average EBITDA margin > 20% doubled the turnover during the last 5 years world class customers in Europe, US and India strong management team with international experience state of the art manufacturing plant with expansion opportunities Ideal base to expand production in India, to benefit from long term trend in creation and expansion of cold chain in India and Asia Total consideration (3) : 7,3x FY16 EBITDA 15,6x FY16 Net Earnings (1) Heating Ventilation Air Conditioning (2) Based on 1 = 75 INR (3) Based on audit financial statement FY16 22
23 10 From AIM Italia to MTA On 21 of June 2017 LU-VE completed the transition from AIM Italia market to MTA the main Italian Stock Exchange market: A promise to the market accomplished Better liquidity of the stock Access to a broader investor base Better visibility for the company One time costs in 2016 P&L 23

24 IPO + 11,2% 11 Share price Drop by 24% of FTSE MIB (janfeb 16) H1 16 results Spirotech 2016 results MTA announcement Warrant conversion: + 10% newly issued shares H1 15 results 2015 results apr-15 lug-15 set-15 apr-16 ott-16 March 17 TP CP TP CP TP CP TP CP TP CP UBI NO TP UBI 14,4 11,9 UBI 12,6 10,2 UBI 12,9 9,8 UBI 15,21 9,26 UBI 16,07 13,00 Intermonte NO TP Intermonte 14,5 11,0 Intermonte 14,0 10,0 Intermonte 13,5 9,8 Intermonte 16,00 9,00 Intermonte 16,00 13,31 24
25 Organic growth Geographic expansion 12 The path ahead (5 years timeframe) Growth, expansion and acquisitions Growth of turnover (9,0% CAGR ,4% organic ) Strengthening of the EBITDA margin (Adj 16: 14%) CAPEX anticipation envisaged within the timeframe Strict control of operating working capital (~10-15% of turnover) Development of new products/applications Strong focus on emerging economies with high potential Close relationship with end user Greenfield investments in emerging economies/enlargement of existing plants (Russia) Acquisitions Spirotech (India) acquired in October 2016: the single largest acquisition by LUVE Possible further targets include companies which are Active in the same business: The Americas Emerging economies (see Spirotech acquisition in India) Europe Own complementary technology and/or products Possible use of further financial leverage 25
26 13 - Future Developments 1. Integration of Spirotech In progress 2. Filing MTA spring 2017 Delivered: 21 June Accelerated capex program In progress 4. M&A activity (about 50 millions firepower) In progress 26
27 14 - Disclaimer This presentation has been prepared by LU-VE S.p.A. for information purposes only and for use in presentations of the Group s results and strategies. For further details on the LU-VE Group, reference should be made to publicly available information. Statements contained in this presentation, particularly the ones regarding any LU-VE Group possible or assumed future performance, are or may be forward looking statements and in this respect they involve some risks and uncertainties. Any reference to past performance of the LU-VE Group shall not be taken as an indication of future performance. This document does not constitute an offer or invitation to purchase or subscribe for any shares and no part of it shall form the basis of or be relied upon in connection with any contract or commitment whatsoever. By attending the presentation you agree to be bound by the foregoing terms. 27
28
LU-VE incontra la comunità finanziaria. 24 ottobre 2016
 LU-VE incontra la comunità finanziaria 24 ottobre 2016 Disclaimer This presentation has been prepared by LU-VE S.p.A. for information purposes only and for use in presentations of the Group s results and
FY 2017 results. 26 st March 2018
 FY 2017 results 26 st March 2018 CONTENTS 1. Financial highlights 2. Net sales breakdown 3. Profit & loss 4. Net working capital 5. Net cash flow 6. Balance sheet 7. Future developments 8. Group structure
H results. 25 st September 2018
 H1 2018 results 25 st September 2018 2018 financial highlights: strong first half Consolidated sales (1) : 152,8 m (+14,9% vs. H1 17; +16,6% on a constant FX basis) Order backlog as of 30 June 2018: 42,5
Acquisition of Alfa Laval Air heat exchanger business. December 2018
 Acquisition of Alfa Laval Air heat exchanger business December 2018 Table of contents 1. Disclaimer 2. Transaction overview 3. Alfa Laval air heat exchanger at a glance 4. Transaction strategic rationale
Company presentation. AIM Italia Conference London Stock Exchange. October
 Company presentation Federico de' Stefani, Executive Chairman Paul Fogolin, Chief Financial Officer AIM Italia Conference London Stock Exchange October 9-10 2017 Disclaimer This presentation has been prepared
FY 2018 FINANCIAL RESULTS
 FY FINANCIAL RESULTS Full Year LRG shows strong performance improvement compared to, with results in line with outlook FY Revenue (M ) Adjusted Ebitda (M ) Ebit (M ) NPF (M ) 184,2 38,9 206,3 39,2 +20,9
LA DORIA announces 2014 preliminary consolidated results and Three-Year Plan.
 PRESS RELEASE LA DORIA announces 2014 preliminary consolidated results and 2015-2017 Three-Year Plan. 2014 Preliminary consolidated results Following on from two very strong years, in 2014 the Group again
BANK OF AMERICA MERRILL LYNCH CONSUMER & RETAIL CONFERENCE. March 4, 2015
 2015 BANK OF AMERICA MERRILL LYNCH CONSUMER & RETAIL CONFERENCE March 4, 2015 Whirlpool Corporation Additional Information This document contains forward-looking statements about Whirlpool Corporation
FY 2014 Results Presentation March 5, 2015
 FY 2014 Results Presentation March 5, 2015 FY 2014 key facts Sales: Euro 824.2 million +9.3% (+10.1% constant FX) Directly Operated Stores Same Store Sales: +7.9% (vs -3.0% in FY 13) EBITDA: Euro 42.6
Presentation of FY 2017 Results. February 26 th, 2018
 Presentation of FY 2017 Results February 26 th, 2018 Gestamp 2018 Disclaimer This presentation has been prepared solely for use at this presentation of our results as of and for the quarter ended December
Q Trading Update. May 4, 2016
 Q1 2016 Trading Update May 4, 2016 Forward looking statements This Presentation may include forward-looking statements. Forward-looking statements are statements regarding or based upon our management
9M 2014 Results Presentation November 13, 2014
 9M 2014 Results Presentation November 13, 2014 9M 2014 key facts Sales: Euro 668.4 million +8.1% (+8.8% constant FX) Directly Operated Stores Same Store Sales: +9.4% (vs -5.7% in 9M 13) EBITDA: Euro 46.3
FY2017 FILA Group Results
 FY2017 FILA Group Results Disclaimer This document has been prepared by F.I.L.A. S.p.A. ( F.I.L.A. or the Company ), for information purposes only, exclusively with the aim of assisting you to understand
Star Conference 2014 London
 Star Conference 2014 London 2 AGENDA 1. Company Overview 2. Market Development & Strategic Direction 3. Financial 3 Elica Group Founded in 1970 Today N#1 Player Worldwide in Hoods Market Leader 2013 Turnover
Company Presentation. Star Conference London. October 2007
 Company Presentation Star Conference London October 2007 1 2 Company Overview Landi Renzo World Leader in CNG and LPG Alternative Fuel Systems Integrated Alternative Systems Energy Producer Focus Alternative
2017FY - Results presentation. March 21, 2018
 2017FY - Results presentation March 21, 2018 Disclaimer This presentation has been prepared by SIT S.p.A. only for information purposes and for the presentation of the Group s results and strategies. For
FINANCIAL PRESENTATION. Milan, 15 November 2017
 FINANCIAL PRESENTATION Milan, 15 November 2017 Product range the heart of gas cooking appliances brass valves light alloy valves thermostats accessories hinges standard burners special burners professional
Creating the Clear Leader in the Fast-Growing Russian Food Retail Market
 Creating the Clear Leader in the Fast-Growing Russian Food Retail Market Dr. Lev Khasis, Group CEO, Pyaterochka Holding N.V. Renaissance Capital Annual Conference 20 June 2006, Moscow 1 Introduction Enlarged
Savills plc. Results for the six months ended 30 th June August 2017
 Savills plc Results for the six months ended 30 th June 2017 10 August 2017 Disclaimer: Forward-looking statements These slides contain certain forward-looking statements including the Group s financial
2015 Half-Year Results. July 30, 2015
 201 Half-Year Results July 30, 201 AGENDA 1 2 3 4 HIGHLIGHTS H1 201 ACHIEVEMENTS ONGOING DEVELOPMENT 201 TARGETS 2 1 HIGHLIGHTS 3 1 HIGHLIGHTS HIGHLIGHTS H1 201 achievements Total growth in sales: +8.4%
H FINANCIAL RESULTS. August 30,
 August 30, 2017 1 Disclaimer This presentation contains both historical and forward-looking statements. These forward-looking statements are based on Carrefour management's current views and assumptions.
9M 2016 RESULTS NICE PRESENTATION. November 2016, 11 th
 NICE PRESENTATION November 2016, 11 th 1 FINANCIAL OVERVIEW 2 Consolidated Sales: 230.0m (+7.3% vs. 9M 2015) Gross margin: 53.1% (vs. 54.9% in 9M 2015) EBITDA margin: 15.0% (vs. 15.8% in 9M 2015) HIGHLIGHTS
Interim Results for the 6 months to 30 September NOVEMBER 2010
 Interim Results for the 6 months to 30 September 2010 8 NOVEMBER 2010 Nick Robertson Introduction Strong H1 Retail sales up 50%, group revenues up 45% Strong UK and international retail sales, up 26% and
Worldline H Results Worldline. Presentation to Investors September 2018
 Presentation to Investors September 2018 Disclaimer This document contains forward-looking statements that involve risks and uncertainties, including references, concerning the Group's expected growth
J.P. Morgan Ultimate Services Investor Conference November 14, 2012
 J.P. Morgan Ultimate Services Investor Conference November 14, 2012 2 Safe Harbor Provision This presentation made by management may contain forward-looking statements that involve a number of risks and
2010 Results. Paris - March 2, 2011
 2010 Results Paris - March 2, 2011 > Highlights of 2010 > Financial results > Strategy and outlook 2010 Results 2 2010: A Year of Acceleration Highlights of 2010 Revenue of 3,892m, up 19.1% Operating profit
The KME Group. Roadshow. July, 2006
 The KME Group Roadshow July, 2006 Disclaimer THESE SLIDES HAVE BEEN PREPARED BY THE COMPANY SOLELY FOR THE USE AT THE ANALYST PRESENTATION THE INFORMATION CONTAINED HEREIN HAS NOT BEEN INDEPENDENTLY VERIFIED.
Savills plc. Results for the year ended 31 December March 2018
 Savills plc Results for the year ended 31 December 2017 15 March 2018 Disclaimer: Forward-looking statements These slides contain certain forward-looking statements including the Group s financial condition,
1H 2016 RESULTS NICE PRESENTATION. August 2016, 5 TH
 NICE PRESENTATION August 2016, 5 TH 1 FINANCIAL OVERVIEW 2 Consolidated Sales: 150.2m (+5.3% vs. 1H 2015) Gross margin: 53.7% (vs. 55.1% in 1H 2015) EBITDA margin: 15.0% (vs. 14.7% in 1H 2015) HIGHLIGHTS
BAML Conference - Miami
 BAML Conference - Miami Francois Luscan, President & CEO Xavier Leclerc de Hauteclocque, CFO December 3, 2013 Forward Looking Statement This presentation may include forward-looking statements. Forward-looking
Superior Essex Investor Relations Update. Second Quarter 2007
 Superior Essex Investor Relations Update Second Quarter 2007 Statements regarding forward-looking information and non-gaap financial information This document contains forward-looking statements that involve
STAR Conference. 6 th October 2016, London
 STAR Conference 6 th October 2016, London Elica Corporation N#1 PLAYER WORLDWIDE IN HOODS 13% MARKET SHARE 2015 TURNOVER 421.6 M 8 INDUSTRIAL PLANTS WORLDWIDE 2 19 Mln Hoods + Motors Cooking Net Sales:
1H15 Results Presentation. July 30, 2015
 1H15 Results Presentation July 30, 2015 1H15 Key facts Sales: Euro 426.9 million +6.7% (+4.0% constant FX) Directly Operated Stores Same Store Sales: +6.4% (2Q15 +7.9%) EBITDA: Euro 26.6 million +28.3%
Creating Value Profitable Growth Strategy
 Profitable Growth Strategy 2013-2015 London, January 16 th 2013 Jo Lunder CEO Delivering on the Value Agenda Objectives FY 11 Objectives 2012 2014 (announced 15 November 2011) YTD 3Q12 Revenue +5 % * CAGR
LU-VE. Perfect storm in 1H17 but investment case still intact. Buy (maintained) Company Update
 Company Update") Company Update Buy (maintained) 5:30 PM MARKET PRICE: EUR10.47 TARGET PRICE:EUR13.60 (from EUR16.07) Heat exchangers, refrigeration Data Shares Outstanding (m): 22.2 Market Cap. (EURm): 232.8 Enterprise
Company Update Buy (maintained) 5:30 PM MARKET PRICE: EUR10.47 TARGET PRICE:EUR13.60 (from EUR16.07) Heat exchangers, refrigeration Data Shares Outstanding (m): 22.2 Market Cap. (EURm): 232.8 Enterprise
Business plan Accelerating growth. Milan, 13th April 2005
 Business plan 2005-2007 Accelerating growth Milan, 13th April 2005 Refocusing to accelerate growth Announcement of strategic plan based on 3 key pillars Achievements Tiscali today Growth in ADSL Focus
FINANCIAL PRESENTATION. STAR CONFERENCE London, 9-10 October 2017
 FINANCIAL PRESENTATION STAR CONFERENCE London, 9-10 October 2017 Product range the heart of gas cooking appliances brass valves light alloy valves thermostats accessories hinges standard burners special
FY 2018 Results for Rocket Internet SE & Selected Companies 4 APRIL 2019
 FY 2018 Results for Rocket Internet SE & Selected Companies 4 APRIL 2019 1 Disclaimer This document is being presented solely for informational purposes and should not be treated as giving investment advice.
1H 2017 Results. July Marzo 2014
 1H 2017 Results July 2017 Marzo 2014 1 Group structure as of 30 June 2017 45.3% 56.8% 59.5% Non-core investments Revenues 2016 586 M 1.574 M 461 M -- Total 2.621 M Businesses Italian media group, with
Hewitt Associates, Inc Robert W. Baird Business Solutions Conference
 February 26, 2009 Hewitt Associates, Inc. 2009 Robert W. Baird Business Solutions Conference Forward-Looking Statements and Non-GAAP Financial Measures This presentation contains forward-looking statements
2016 INVESTOR MEETINGS FIRST QUARTER 2016 WHIRLPOOL CORPORATION
 2016 INVESTOR MEETINGS FIRST QUARTER 0 FIRST-QUARTER INVESTOR MEETINGS WHIRLPOOL CORPORATION ADDITIONAL INFORMATION This Presentation contains forward-looking statements about Whirlpool Corporation and
FY 2016 Results March 2nd, 2017
 FY 2016 Results March 2nd, 2017 Definitions & assumptions In this presentation: ForEx stands for Foreign Exchange Rates; Organic stands for effect net of ForEx and hedging derivatives; Q4 stands for fourth
AXA. Henri de Castries. Chairman & CEO. London - October 2, Sanford C. Bernstein Strategic Decisions Conference
 AXA Henri de Castries Chairman & CEO London - October 2, 2013 Sanford C. Bernstein Strategic Decisions Conference Cautionary note concerning forward-looking statements Certain statements contained herein
ANNUAL GENERAL MEETING METRO AG. 15 February 2019
 ANNUAL GENERAL MEETING METRO AG 15 February 2019 DISCLAIMER AND NOTES To the extent that statements in this presentation do not relate to historical or current facts, they constitute forward-looking statements.
De'Longhi S.p.A.: consolidated results of year 2017
 PRESS RELEASE De'Longhi S.p.A.: consolidated results of year 2017 Today, the Board of Directors of De Longhi S.p.A. has approved the consolidated results as of December 31, 2017. Following the recent agreement
FULL YEAR 2011 RESULTS
 FULL YEAR 2011 RESULTS February 28 th 2012 1 28 February 2011 This document does not constitute a purchase, sales or exchange offer, nor is it an invitation to draw up a purchase, sales or exchange offer,
Henkel AG & Co. KGaA. Klaus Keutmann Frankfurt,
 Henkel AG & Co. KGaA Klaus Keutmann Frankfurt, 21.01.2015 Disclaimer This information contains forward-looking statements which are based on current estimates and assumptions made by the corporate management
Elis 2017 annual results MARCH 7, 2018
 Elis 2017 annual results MARCH 7, 2018 Forward looking statements This document may contain information related to the Group s outlook. Such outlook is based on data, assumptions and estimates that the
Forward-Looking Statements
 William Blair & Company 27 th Annual Growth Stock Conference June 20, 2007 0 Forward-Looking Statements This presentation contains forward-looking statements that are subject to a number of risks and uncertainties,
2018 Edelman Trust Barometer
 2018 Edelman Trust Barometer Snapshot Australia #TrustBarometer Trust Index A World of Distrust Average trust in institutions, general population, 2017 vs. 2018 Global Trust Index remains at distruster
Half Year Earnings Press conference August 2, 2018
 Half Year Earnings 2018 Press conference August 2, 2018 IMPORTANT LEGAL INFORMATION AND CAUTIONARY STATEMENTS CONCERNING FORWARD-LOOKING STATEMENTS Certain statements contained herein may be forward-looking
INDUSTRIAL STARS OF ITALY
 Italian Research New Coverage Milan, April 2, 2015 SECTOR: Industrials INDUSTRIAL STARS OF ITALY Jacopo Tagliaferri +39-02-77115.230 e-mail: jacopo.tagliaferri@intermonte.it LU-VE: Born a Lucky Venture,
DXP Enterprises, Inc. Acquisition of
 DXP Enterprises, Inc. Acquisition of Presented by: David Little Chairman, President & CEO Mac McConnell Senior Vice President & CFO Kent Yee Senior Vice President of Corporate Development NASDAQ: DXPE
Imerys and S&B: A strategic combination
 Accelerating development, strengthening core business, creating value Gilles MICHEL - Chairman & CEO Michel DELVILLE - CFO Disclaimer More comprehensive information about Imerys may be obtained on its
February 25, Q Earnings Presentation
 Q4 2015 Earnings Presentation Certain statements contained in this presentation that are not historical facts, including any statements as to future market conditions, results of operations and financial
ASSET MANAGEMENT. D. Frigerio Head of Private Banking & Asset Management Division
 ASSET MANAGEMENT D. Frigerio Head of Private Banking & Asset Management Division AGENDA Asset Management at a glance CEE - the story so far Poland the benchmark Opportunities and challenges The approach
INTERIM MANAGEMENT STATEMENT QUARTER ENDED 31 MARCH 2012
 INTERIM MANAGEMENT STATEMENT QUARTER ENDED 31 MARCH 2012 12 April 2012 Financial summary Growth in net fees for the quarter ended 31 March 2012 (Q3) (versus the same period last year) Actual Growth LFL*
INVESTOR PRESENTATION FY Copyright PRICOL Limited Slide 1
 INVESTOR PRESENTATION FY 2016-17 Copyright PRICOL Limited Slide 1 DISCLAIMER This presentation has been prepared by Pricol Limited (the Company ) solely for your information and for your use and may not
Investor Presentation
 Investor Presentation May 2013 48,000 employees 200 offices 70 countries 1 global platform Table of Contents I. Company Description II. Global Growth Strategy III. Financial Overview IV. Appendix 2 Company
Cover-More Group. UBS Australasia Conference. November 2015
 Cover-More Group UBS Australasia Conference November 2015 Executive summary: FY15 overview Cover-More delivered another year of double digit earnings growth, with offshore business growing substantially.
1H 2007 CONSOLIDATED RESULTS. September 11, 2007
 1H 2007 CONSOLIDATED RESULTS September 11, 2007 1 THIS DOCUMENT MAY NOT BE DISTRIBUTED, PUBLISHED OR REPRODUCED IN WHOLE OR IN PART OR DISCLOSED BY RECIPIENTS TO ANY OTHER PERSON. NEITHER THIS DOCUMENT
FY2017 Earnings presentation. Landis+Gyr June 5, 2018
 FY2017 Earnings presentation Important notices This presentation includes forward-looking information and statements including statements concerning the outlook for our businesses. These statements are
AXA. Gérald Harlin. Group CFO. May 28, Deutsche Bank Global Financial Services Investor Conference 2014
 AXA Gérald Harlin Group CFO May 28, 2014 Deutsche Bank Global Financial Services Investor Conference 2014 Cautionary note concerning forward-looking statements Certain statements contained herein may be
Financial results & business update. Quarter and year ended 31 December February 2017
 Financial results & business update Quarter and year ended 31 December 2016 14 February 2017 Disclaimer 3 Any remarks that we may make about future expectations, plans and prospects for the company constitute
Technology for shaping everyday materials. Milan March 2011
 Technology for shaping everyday materials Milan March 2011 Group business structure wood glass & stone mechatronic service tooling 1 1 summary: sales breakdown & orders trend main business divisions market
GEOX GROUP 2014 RESULTS
 PRESS RELEASE GEOX GROUP 2014 RESULTS GEOX ACCELERATES AGAIN AND CLOSES 2014 WITH GROWTH IN TURNOVER OF 9.3%. EXCELLENT RESULTS IN ITALY, FRANCE AND SPAIN THAT HAVE DRIVEN EXPANSION WITH INCREASES OF RESPECTIVELY
Creating a GLOBAL PACKAGING LEADER
 Creating a GLOBAL PACKAGING LEADER January 26, 2015 Page 1 Forward Looking Statements Forward-Looking Statements This document contains forward-looking statements within the meaning of the Private Securities
Q1 2017/18 RESULTS PRESENTATION. 13 February 2018
 Q1 2017/18 RESULTS PRESENTATION 13 February 2018 DISCLAIMER AND NOTES To the extent that statements in this presentation do not relate to historical or current facts, they constitute forward-looking statements.
Siemens Gamesa Renewable Energy Q Results
 Siemens Gamesa Renewable Energy Q2 208 Results 04 May 208 Disclaimer This material has been prepared by Siemens Gamesa Renewable Energy, and is disclosed solely for information purposes. This document
Disclaimer. Worldline
 1 Disclaimer This communication does not contain or constitute an offer of Worldline s shares for sale or an invitation or inducement to invest in Worldline s shares in France, the United States of America
Disclosure Statement. Page 2
 Disclosure Statement Page 2 This presentation and the accompanying slides (the Presentation ) which have been prepared by Samsonite International S.A. ( Samsonite or the Company ) do not constitute any
Q EARNINGS CALL
 Tom Goeke Chief Executive Officer Q2 2017 EARNINGS CALL JULY 27, 2017 IMPORTANT INFORMATION Forward Looking Statements These slides contain (and the accompanying oral discussion will contain) forward looking
Financial Results Investor Presentation
 26.3.2013 2012 Financial Results Investor Presentation SAFE HARBOR STATEMENT Certain statements in this slide show, including those addressing the Company s beliefs, f, plans, objectives, estimates or
Star Conference LONDON. 2015, October 5 th - October 6 th
 Star Conference LONDON 2015, October 5 th - October 6 th BOLZONI AT A GLANCE 2 Our market and our customers Dealers of Lift Trucks & Material Handling Lift Truck Manufacturers - OEM Logistics 30% Material
TELECONFERENCE Q2 2018
 TELECONFERENCE Q2 2018 Copenhagen, 9 August 2018 1 Disclaimer Certain statements in this presentation constitute forwardlooking statements. Forward-looking statements are statements (other than statements
London Stock Exchange Group plc. Preliminary Results 22 May 2008
 London Stock Exchange Group plc Preliminary Results 22 May 2008 Agenda Introduction Financial Review CEO Overview Chris Gibson-Smith Chairman Massimo Capuano Deputy CEO Clara Furse Chief Executive Officer
FY 2012 Results. March 12 th, 2013
 FY 2012 Results March 12 th, 2013 Fiscal Year 2012 Results Highlights FY 2012 results showing top line growth and profitability increase*, in line with company expectations Net Revenues up 15.1% to 279.3mln
Interim Results. For the six months ended June 30, 2011
 Interim Results For the six months ended June 30, 2011 Agenda Business and Financial Highlights Business Overview Financial Overview Concluding Remarks 2 Business Highlights in 1H 2011 Significant sales
PRESS RELEASE. De'Longhi S.p.A. The Shareholders Annual General Meeting, held today in ordinary session:
 PRESS RELEASE De'Longhi S.p.A. The Shareholders Annual General Meeting, held today in ordinary session: (i) approved the consolidated 2017 results, confirming the data approved by the Board of Directors
/// The New Wabtec. February 25, 2019
 The New Wabtec February 25, 2019 DISCLAIMER / FORWARD-LOOKING STATEMENTS Caution Concerning Forward-Looking Statements This presentation contains forward-looking statements as that term is defined in Section
Q4 & FY 2017 EARNINGS PRESENTATION MARCH 13, 2018
 Q4 & FY 2017 EARNINGS PRESENTATION MARCH 13, 2018 FORWARD-LOOKING STATEMENTS & NON-GAAP FINANCIAL INFORMATION 2 FORWARD-LOOKING STATEMENTS This presentation contains, and management may make on our call
INTERIM MANAGEMENT STATEMENT QUARTER ENDED 30 SEPTEMBER 2011
 INTERIM MANAGEMENT STATEMENT QUARTER ENDED 30 SEPTEMBER 2011 6 October 2011 Financial summary Growth in net fees for the quarter ended 30 September 2011 (Q1) (versus the same period last year) actual growth
Q trading update
 Q3 2018 trading update October 25, 2018 Louis Guyot, CFO We empower your day Disclaimer This document may contain information related to the Group s outlook. Such outlook is based on data, assumptions
Klöckner Pentaplast. FY 2017 Q2 update call. June 2017
 Klöckner Pentaplast FY 2017 Q2 update call June 2017 Disclaimer Unless otherwise indicated, this presentation and the information contained herein has been prepared and provided by Kleopatra Holdings 2
Q EARNINGS REVIEW GORENJE GROUP
 WebCast, June 4th Dr. Peter Groznik, CFO 1 EARNINGS REVIEW GORENJE GROUP : Highlights / Gorenje Group Change Plan Plan track Comparable* Change Consolidated revenue 299.1 370.2-19.2% 1,391.4 21.5% 299.1
1H 2014 Results Presentation July 31, 2014
 1H 2014 Results Presentation July 31, 2014 1H 2014 key facts Sales: Euro 400.2 million +3.5% (+4.1% constant FX) Directly Operated Stores Same Store Sales: +8.2% (vs -7.6% in 1H 13) EBITDA: Euro 20.7 million,
+3% INCREASE IN REVENUES TO MILLION DRIVEN BY A POSITIVE PERFORMANCE
 PRESS RELEASE - 2016 RESULTS +3% INCREASE IN REVENUES TO 900.8 MILLION DRIVEN BY A POSITIVE PERFORMANCE OF THE WHOLESALE CHANNEL, UP 12%, AND ONLINE SALES, WHICH GREW BY MORE THAN 30%. +9% INCREASE IN
2011 Nine-Month Results
 2011 Nine-Month Results November 4, 2011 Contents 2011 Nine-month highlights 3 to 4 Net sales 5 to 9 Profitability, cash generation and balance sheet 10 to 14 Appendices 15 to 38 2 HIGHLIGHTS 3 2011 Nine-Month
9M 2017 FILA Group Results
 9M 2017 FILA Group Results Disclaimer This document has been prepared by F.I.L.A. S.p.A. ( F.I.L.A. or the Company ), for information purposes only, exclusively with the aim of assisting you to understand
1H 2017 RESULTS CONF CALL
 1H 2017 RESULTS CONF CALL August 03 rd 2017 Antonio Converti CEO Gabriella Fabotti CFO Chiara Locati IR 1 Disclaimer This presentation contains certain forward-looking statements that reflect the Company
Luxottica sees strong growth in 1Q08 net sales: +17% at constant exchange rates, +8% at current exchange rates
 Luxottica sees strong growth in 1Q08 net sales: +17% at constant exchange rates, +8% at current exchange rates Milan, Italy April 24, 2008 The Board of Directors of Luxottica Group S.p.A. (NYSE: LUX; MTA:
Disclosure Statement. Page 2
 Disclosure Statement Page 2 This presentation and the accompanying slides (the Presentation ) which have been prepared by Samsonite International S.A. ( Samsonite or the Company ) do not constitute any
INTERIM RESULTS PRESENTATION Strong start to the year, with a strong order book for the second half of September 2017
 INTERIM RESULTS PRESENTATION Strong start to the year, with a strong order book for the second half of 2017 11 September 2017 AGENDA Introduction and highlights John Hornby Financial review David Main
2012 Results. 28 February 2013
 2012 Results 28 February 2013 Legal Notice This document is for informational purposes only and does not constitute an offer to sell, exchange or buy, or an invitation to make offers to buy, securities
Q EARNINGS CALL FEBRUARY 20, 2018
 Q4 2017 EARNINGS CALL FEBRUARY 20, 2018 1 IMPORTANT INFORMATION Forward Looking Statements These slides contain (and the accompanying oral discussion will contain) forward looking statements. All statements
July 26, 2017 LafargeHolcim Ltd 2015
 Second Quarter 2017 Results Beat Hess, Chairman and Interim CEO Roland Köhler, Interim COO and Regional Head of Europe, Australia/NZ & Trading Ron Wirahadiraksa, CFO July 26, 2017 LafargeHolcim Ltd 2015
Q EARNINGS CALL JULY 26, 2018
 Q2 2018 EARNINGS CALL JULY 26, 2018 IMPORTANT INFORMATION Forward Looking Statements These slides contain (and the accompanying oral discussion will contain) forward looking statements. All statements
2017 FULL YEAR RESULTS. February 28,
 2017 FULL YEAR RESULTS February 28, 2018 1 Disclaimer This presentation contains both historical and forward-looking statements. These forward-looking statements are based on Carrefour management's current
2018 Interim Results 30 August 2018
 2018 Interim Results 30 August 2018 Disclaimer Statements in this presentation with respect to each of Total Produce s and Dole Food Company's ("Dole") business, strategies, projected financial figures,
PERNOD RICARD A value-creative business model. Deutsche Bank conference 20 June 2012
 PERNOD RICARD A value-creative business model Deutsche Bank conference 20 June 2012 Deutsche Bank conference 20th June 2012 A value-creative business model Spirits within the consumers - TEXT goods universe