Star Conference LONDON. 2015, October 5 th - October 6 th
|
|
|
- Emmeline Little
- 5 years ago
- Views:
Transcription


1 Star Conference LONDON 2015, October 5 th - October 6 th
2 BOLZONI AT A GLANCE 2


3 Our market and our customers Dealers of Lift Trucks & Material Handling Lift Truck Manufacturers - OEM Logistics 30% Material Handling 70% Lift Truck Manufacturers (OEM) End users (Logistics, Industrial, Large Retail companies) 3


4 Our product lines Lift tables 5% (*) Other revenues 5% Forks 7% 69,3 M First Half 2015 Lift truck attachments 83% (* ) Other Revenues: Rental business and Customer care 4

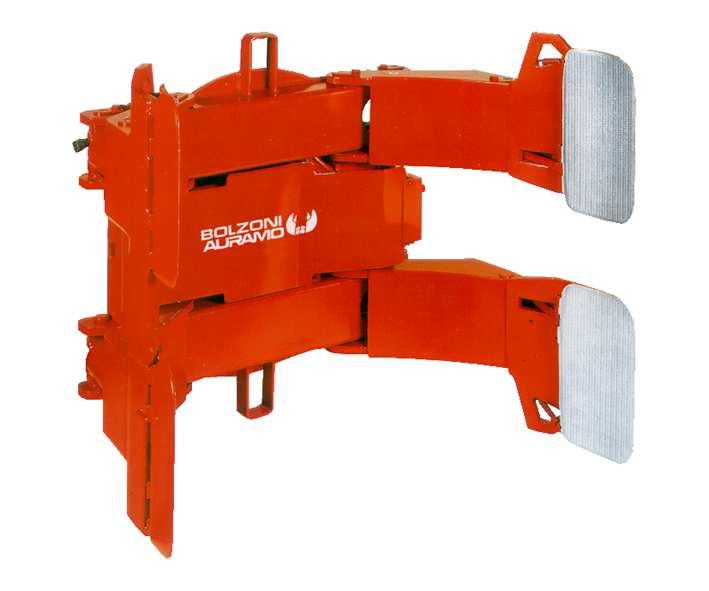

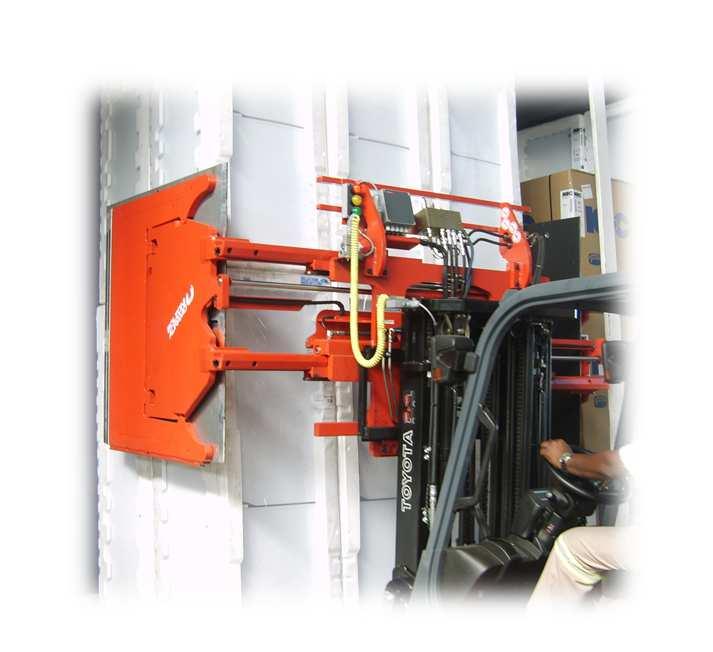
5 MAIN PRODUCTS 5


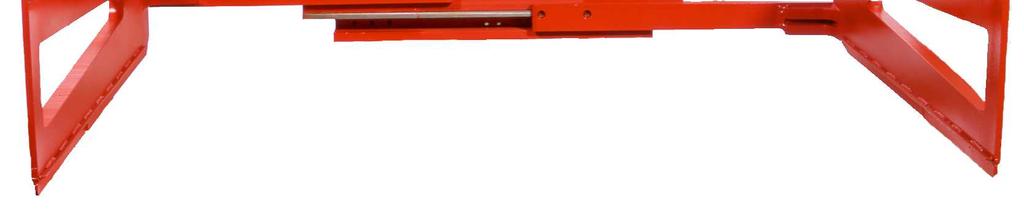
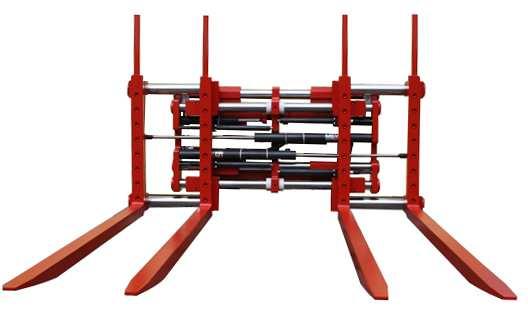

6 MAIN PRODUCTS 6

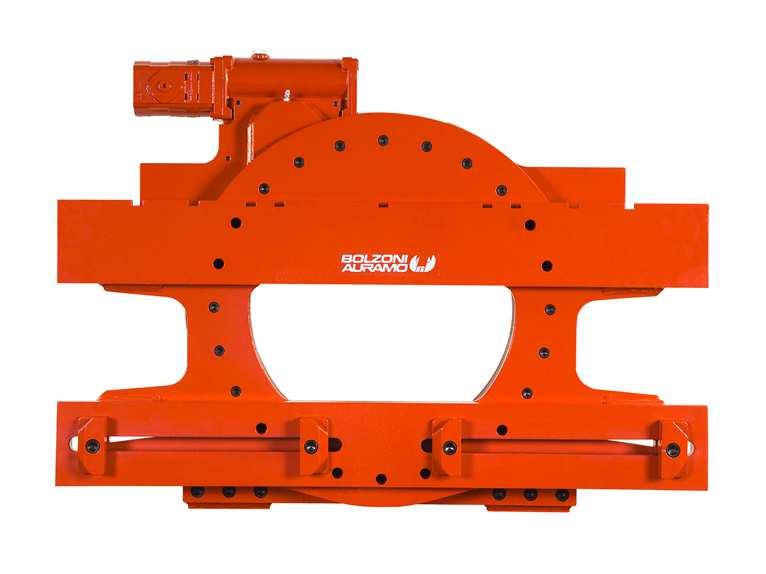
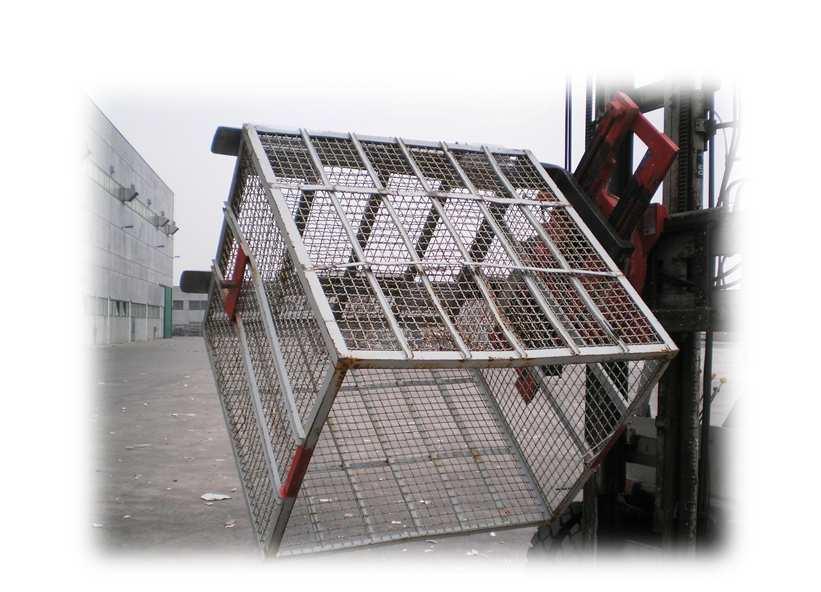


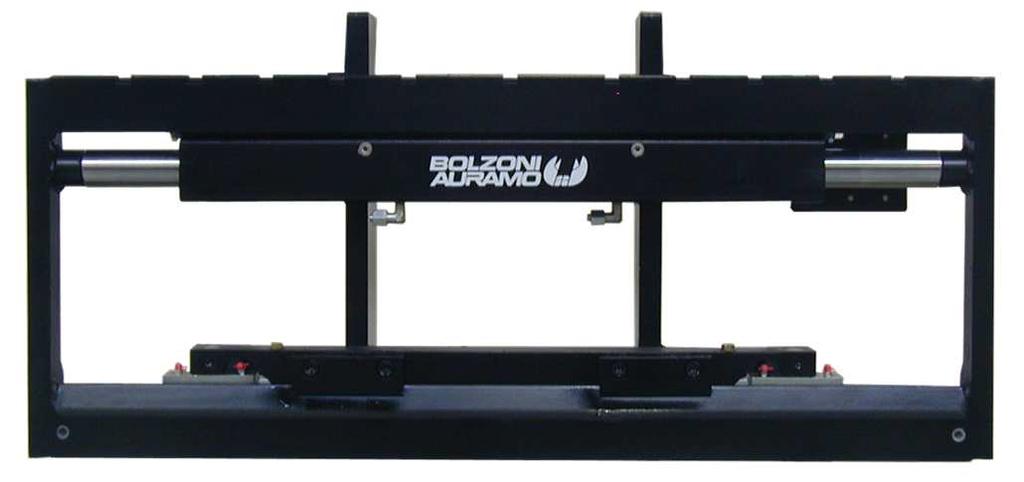
7 MAIN PRODUCTS 7

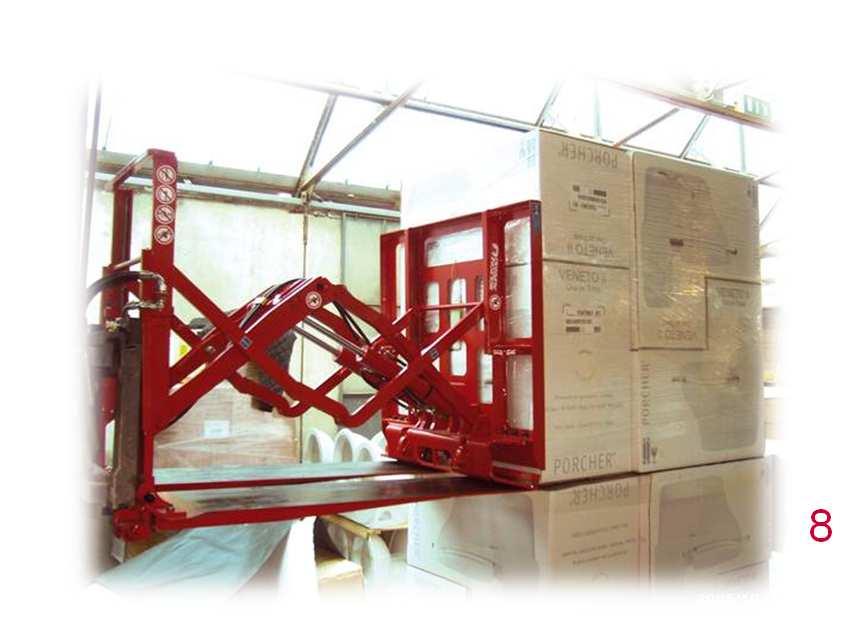
8 MAIN PRODUCTS 8


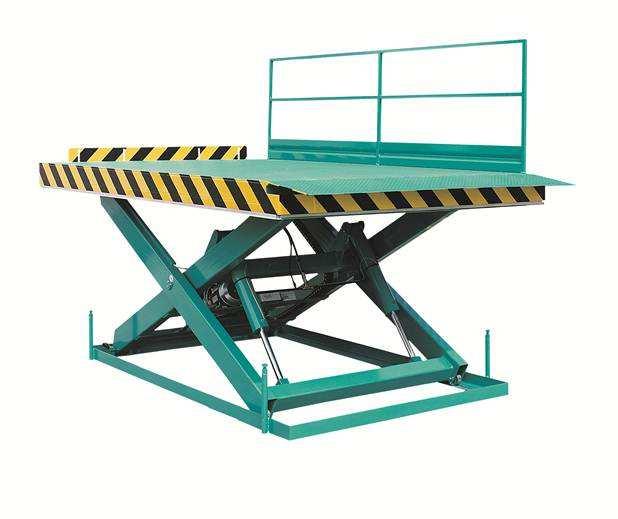

9 MAIN PRODUCTS 9

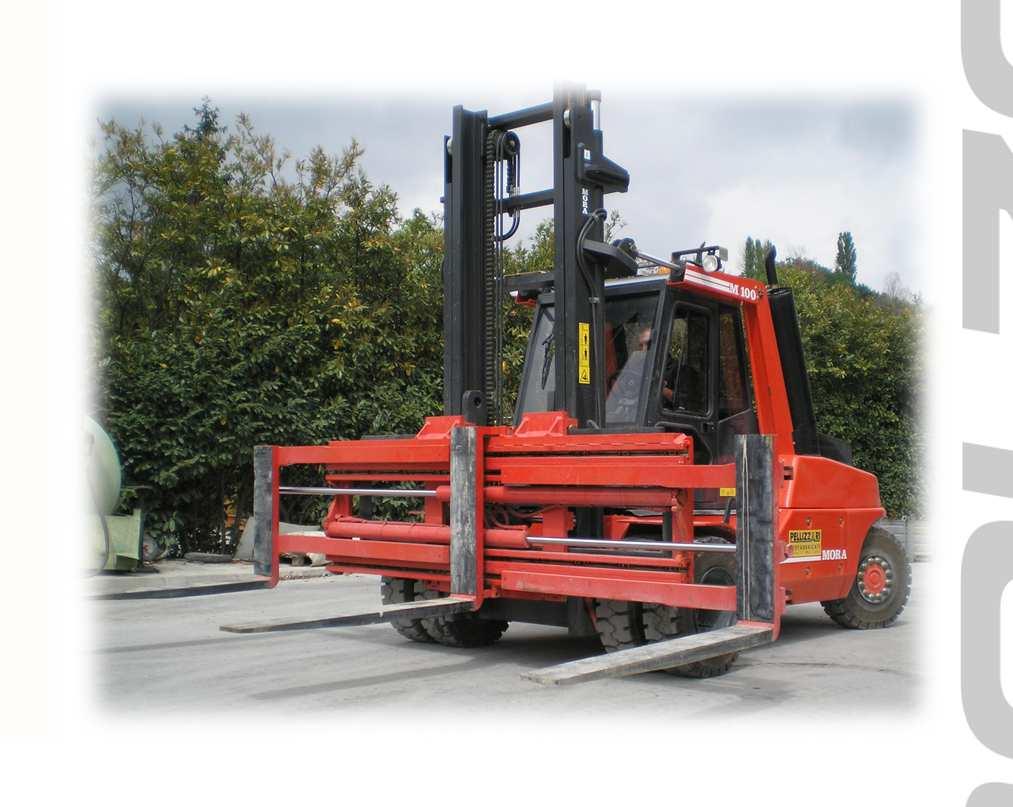


10 MAIN PRODUCTS 10
11 HISTORY 1945: Bolzoni SpA: founded in 1945 by Luigi and Livio Bolzoni for the production of agricultural machinery. 1950: In the early 50s Bolzoni entered the attachment world with a brick fork attachment and, subsequently, fork lift truck attachments became the core business. 1960: High focus on foreign markets. 1975: First branch in France. 1986: Bolzoni merged with the Teko company adding lifting tables and hand pallet trucks to its product range. 1991: Acquisition of Elman, the lift truck attachment company leader in Spain. 2001: Banca Intesa s subscription of 30%. 2001: Acquisition of Auramo in Finland, a worldwide specialized company in forest products handling attachments. 2002: Acquisition of Brudi in USA, a pioneer and market leader in palletless handling attachments worldwide. 2006: Bolzoni s listing on Italian Stock Exchange (STAR segment). 2006: Acquisition of Meyer (Germany production plant) : Investment in China: Bolzoni Huaxin for the lift truck fork production. Bolzoni Wuxi for the attachment production. 2014: New production plant in Auramo OY 11
 Includes (for 10 months) the acquisition of the Finnish company Auramo OY, a leading manufacturer of Lift Truck attachments (pulp & paper")
12 Net sales trend % % 145,6 141,1 37,4 41,8 53,2 76,2 78,9 75,1 (1) (2) (3) 84,0 94,7 107,1 76,9 93,5 115,8 119,1 121,2 119,9 H , H (1) Includes (for 10 months) the acquisition of the Finnish company Auramo OY, a leading manufacturer of Lift Truck attachments (pulp & paper clamps) (2) Includes acquisition of Brudi (3) Sale of masts activity 12
13 Market trend AREA PEAK (n. of lift trucks; year) H annualized (*) 2015 vs PEAK Italy Y ,9% Germany Y ,4% WEST EUROPE(**) Y ,1% N. AMERICA Y ,2% CHINA Y ,4% ROW Y ,7% (*) H number of lift truck x 2 (**) Germany and Italy included 13
14 World market trend World 2014 World 2015 China 2014 China Jan Feb Mar Apr May Jun Jul Aug YEAR Jan Feb Mar Apr May Jun Jul Aug Jul- Aug '15 Jul- Aug ' vs World ,0% -4,0% World Country/month Jan Feb Mar Apr May Jun Jul Aug Jul- Aug '15 Jul- Aug ' vs China ,3% -15,2% China
15 World market trend WEST EUROPEAN MARKET West Europe 2015 West Europe 2014 N. AMERICAN MARKET N. America 2015 N. America Jan Feb Mar Apr May Jun Jul Aug Jan Feb Mar Apr May Jun Jul Aug Country/month Jan Feb Mar Apr May Jun Jul Aug Jul- Aug '15 Jul- Aug ' vs West Europe ,1% 7,6% West Europe Country/month Jan Feb Mar Apr May Jun Jul Aug Jul- Aug '15 Jul- Aug ' vs N. America ,8% 7,1% N. America
16 THE BOLZONI GROUP Worldwide presence operating under the brands «Bolzoni Auramo» and «Meyer». Leading position in Europe. The second largest manufacturer worldwide. The second largest manufacturer in USA. Employs about 750 persons. Today Bolzoni has 7 manufacturing plants and 11 commercial plants. 16


17 Main production plants Italy Piacenza Finland m 2 Järvenpää m 2 Germany Salzgitter m 2 USA Homewood - Illinois m 2 China Longhua - Hebei District m 2 China Wuxi - Shanghai District m 2 17


18 Auramo OY: New production plant Plant based: Järvenpää. Location: 40 km from Helsinki Port, 25 km from Helsinki Airport. Starting production: August Land size: sqm. The new production plant in Järvenpää Building size: sqm. Type of agreement: Rental Capex in tangible assets : 3,8 M The first deliveries from Järvenpää 18

19 Key success factors Worldwide presence: 18 direct branches covering all continents. Distribution network: Bolzoni distributes its products through a network of more than 3,000 lift truck dealers worldwide. Specialized production plant: one product in one place. Quality of network: the worldwide commercial and after sales network to support the dealers. Innovation: state of the art of product and process innovation. Customer relationship: worldwide leader in the relationship with the OEMs. Company Years with Bolzoni Linde >15 Nacco M.H. S.p.A. >15 Jungheinrich AG / GmbH >15 Toyota Ind. Equipment 15 Nacco M.H. USA 14 OM Carrelli Elevatori 14 Mitsubishi 12 Nissan 12 19


20 Group structure Bolzoni Spa Italy Bolzoni Auramo Inc- USA 100% Bolzoni Italia Srl Italy 100% Auramo OY Finland 100% Meyer GmbH Germany 100% Bolzoni Auramo Shanghai China 60% Bolzoni Sarl France 100% Bolzoni Ltd UK 100% Auramo ZA South Africa 40% Meyer OOO Russia 80% Bolzoni Auramo Zoo Polska 60% Bolzoni Auramo SL Spain 100% Bolzoni Auramo Ltd Canada 100% Bolzoni Holding Hong Kong 80% Bolzoni Auramo BV Holland 51% Bolzoni Auramo AB Sweden 100% Bolzoni Auramo Pty Australia 100% Bolzoni Auramo Wuxi China 100% Bolzoni Huaxin China 80% Xin Huaxin China 20% Bolzoni Portugal Lda Portugal 31% Eurolift Pty Australia 100% 20
21 Net Sales Geographic Area breakdown North America: 16% Rest of the Europe: 58% Far East: 5% Italy: 13% 7 Manufacturing plants 11 Commercial branches 1 Financial Holding RoW: 8% 3 affiliated company. and more than 20 distributors(*) (*) Data source: Bolzoni Marketing dep. 1H
22 Specialized plants 22

 83,5 89,3 +6,9% Data")
23 Bolzoni positioning in the reference market Market Share Worldwide 9,3% 14,7% 25,3% 50,7% Cascade Bolzoni Kaup Other Market Share in Europe 25,5% 6,2% Cascade Bolzoni EUROPE Y 2006 Y 2014 % N. of lift trucks ,9% 40,0% 28,3% Kaup Other BOLZONI TURNOVER (M) 83,5 89,3 +6,9% Data source: Bain&Co (2006) 23
24 Year 2012: KION SUPPLIER OF THE YEAR award KION GROUP Turnover : Euro 4,3 billions in 2011 and about 22,000 employee European leading provider and second worldwide of forklifts, warehouse equipment and other industrial trucks With the brands Linde, STILL, Fenwick, OM, Baoli and Voltas, Kion is present in more than 100 countries, with more then worldwide suppliers Bolzoni has shown very strong willingness to improve in all aspects, thus becoming an active partner in our KIPS (Kion Group Improvement Process with Suppliers) program from day one. Very strong lean mindset, strong focus on internal cost reduction and improvement of quality and delivery service leading to extended long-term agreements between KION and Bolzoni. Understanding that joint improvement is not finished when the contract is signed but needs to continue exemplary attitude among KION suppliers. 24

25 BOLZONI IN CHINA 25
26 Lift trucks market volumes 2004 vs West Europe Volumes for lift trucks in the China market (*) North America have exceeded those of the North American and West EU markets combined; China CAGR : +14,8% (*) Data source: Bolzoni Marketing dep. 26


27 Rate of Adoption West Europe vs China West Europe Attachment Value for fork lift in Euro Euro x 7,7 China Euro 276 In China each lift truck is equipped with attachments for the amount of 276 compared to average of a European lift truck; so, in future, the potential rate of adoption in the attachment market could be almost 8 times the present. (*) Data source: Bolzoni Marketing dep. 27

In July Bolzoni Huaxin stake passes from 60% to 80%.")
28 Group structure in China Bolzoni Spa Headquarters Italy Tiger Technologies China 80% 20% Bolzoni Holding Hong Kong Huaxin Fork Co. Ltd China 100% 80% 20% 20% 80% Bolzoni Auramo Wuxi China 100% Bolzoni Huaxin China 80% (*) Xin Huaxin China 20% Lift truck attachments business Fork business (*)In July Bolzoni Huaxin stake passes from 60% to 80%. The cost of the purchase has been determined on the basis of the company s Equity value. 28


29 Lift truck fork plant Plant based in Longhua Town (Jing County, Hebei), 250 km south west from Beijing Start-up: June 2012 Land size: sq.m. Building size: sq.m. Production capacity: pcs per year in Y2015, up to pcs per year following plant modification Actual employees : approx 110 people Features: low costs, industrial district skilled in fork manufacturing, steel factories in the area, facilitated taxation in the first years of activity Total investment: 3,8 M, of which 1,8 M paid by Bolzoni Number of forks invoiced: about in H
30 Lift truck attachment plant Plant based in Wuxi, 160 km from Shanghai port Start-up: beginning of 2013 Land size: sq.m. Building size: sq.m. Production capacity: 20 M Actual employees: 110 employees. Features: lower costs respect to suburban area of Shanghai, good availability of technicians, favorable logistics, presence of suppliers in the area, facilitated taxation in the first years of activity Total investment: 8,5 M, of which 6,8 M paid by Bolzoni 30

31 BUSINESS PLAN 31
32 TOYOTA- CASCADE DEAL 22 October 2012: Toyota announced the agreement under which TICO intended acquiring Cascade for USD759 million Share Price: 65 USD, 23% premium 7,5 times the EbitDA 27 March 2013: Antitrust clearance 32


33 Net Sales Geographic Area breakdown North America: ROW and CHINA 15 % 30 % 11 % 18 % 74% 52 % Europe YEAR 2014 Business Plan 15% 11% EU 18% 74% USA ROW & CHINA 30% 52% 33

34 Turnover and Ebitda ,6% 14,20% 16,00% 14,00% 12,00% TURNOVER (K ) ,20% 10,00% 8,00% 6,00% 4,00% 20 2,00% - H Business Plan 0,00% EBITDA% Net Sales Ebitda margin 34
")

35 Net financial position and working capital ,01% 20,20% 24,00% 30 16,60% 19,00% NET DEBT (K ) ,00% 9,00% ,00% H Business Plan Net Debt Working capital/turnover -1,00% 35
36 FINANCIALS
37 Net sales breakdown: 2Q 2014 vs 2Q ,6% 35,3 3,6 3,6 29,0 4,8 6,0 +32,5% +65,7% +12,5% 21,8 24,5 Q Q EUROPE NORTH AMERICA REST OF THE WORLD 37

38 Net sales breakdown: vs ,5% 59,0 9,3 69,3 +21,1% +62,1% 7,7 6,9 11,1 +10,0% 44,5 48, EUROPE NORTH AMERICA REST OF THE WORLD 38
39 Consolidated income statement in Q Thousands of Euro Q Q % Var vs 2014 TURNOVER ,6% EBITDA ,0% EBITDA margin % 7,4% 11,2% EBIT ,1% EBIT margin % 2,3% 6,6% RESULT BEFORE TAXES ,0% margin % 1,6% 3,6% TURNOVER: +21,6 % YOY EBITDA stands at 11,2%, increased by 3,8 points from 2Q NET RESULT has been affected by a negative effect on exchange rates for 0,6 M GROUP RESULT AFTER TAXES ,5% margin % 0,8% 1,8% 39
40 Consolidated income statement at 30 th June Thousands of Euro % Var vs 2014 TURNOVER ,5% EBITDA ,7% EBITDA margin % 7,2% 10,6% EBIT ,2% EBIT margin % 2,2% 6,0% RESULT BEFORE TAXES ,6% margin % 1,1% 5,9% TURNOVER: +17,5 % YOY EBITDA stands at 10,6%, increased by 3,4 points from the first half of NET RESULT has been positively affected by a effect on exchange rates for 0,7 M. GROUP RESULT AFTER TAXES ,4% margin % 0,4% 4,1% 40
41 Consolidated cash flow statement Thousands of Euro NET DEBT (37.052) Net result Changes in reserves (169) Depreciation Changes in net working capital (561) - Inventories (1.912) - Trade receivables (3.075) - Trade payables Others Net capital expenditure (*) (2.848) FREE CASH FLOW Equity and third parties changes (**) Dividend distribution (1.021) NET DEBT (34.214) NET DEBT has passed from 37,1 M at to 34,2 M at This was mainly the result of the improvement in the Group s profitability. Cash flow from operating activities grew very significantly, up to 5,7 M against 2,6 M in the first half of Opposite, net debt has been absorbed by 1,0 M dividend distribution. (*) of which - 1,2 M of exchange rate effect (**) of which 1,1 M of exchange rate effect 41
42 Cash flow statement: bridge analysis Thousands of Euro Cash and cash equivalent Current portion of long term debts (24.714) (25.098) Net financial position - short term (20.648) (16.541) Non current portion of long term debts (16.404) (17.673) Net financial position - M/L term (16.404) (17.673) Net financial position (37.052) (34.214) 42
43 Working capital and other KPI Million % on net sales 26,1 26,7 18,4 18,1 21,1 24,5 26,5 25,9 27,7 30,2 28,2 17,90% 18,90% 24,00% 19,30% 18,20% 20,61% 20,10% 23,06% 21,74% 21,87% 20,20% Accounts payable turnover ratio at : 84 days vs 86 days at and vs 87 days at Accounts receivables turnover ratio at : 71 days vs 75 days at and vs 77 days at Inventory turnover ratio at : 69 days vs 71 days, at and vs 73 days at
 (4.934) Net capital employed 77.392 77.970 Net Equity 36.429 39.559 Minority interest 3.911 4.197 Net financial position 37.052 34.")
44 Assets and liabilities Thousands of Euro Net fixed assets Net working capital Leaving indemnity and other reserves (4.685) (4.934) Net capital employed Net Equity Minority interest Net financial position Net Debt / Equity 0,92 0,78 44
45 SHAREHOLDERS STRUCTURE 45
46 Shareholders structure Market Segment: STAR MTA Reuters Code : BLZ IM Bloomberg Code: BLZ IM Specialist: Intermonte Auditing company: Deloitte Market cap (@ 21st September 2015): 90,19 M Number of shares: % var. since January 1 st, 2015: +27,11% Price per share (@ 30th September 2015): 3,47 (*) Shareholders are: Emilio Bolzoni, Franco Bolzoni, Paolo Mazzoni, Roberto Scotti, Pierluigi Magnelli 46
47 Market share trend 30/09/2015: Euro 3, ,6% 01/10/2012: Euro 1,50 +39,1% Sep-12 Dec-12 Mar-13 Jun-13 Sep-13 Dec-13 Mar-14 May-14 Aug-14 Nov-14 Feb-15 May-15 Aug-15 Bolzoni IT ALL SHARE 47
48 Contacts: Visit our web site:
ANNUAL SHAREHOLDER MEETING
 ANNUAL SHAREHOLDER MEETING Piacenza April 29, 2013 FINANCIALS YEAR 2012 Net sales breakdown: 2009-2012 + 15,7% 115.8 119.1 CAGR 76.9 93.5 +21.6% +28.6% +13.1% Fork clamps Net sales trend CAGR: years 1998-2012
The European Leader in Lift Truck Attachments. August 01, 2006
 The European Leader in Lift Truck Attachments August 01, 2006 Overview Shareholders structure Shareholders pre IPO (%) Shareholders post IPO (%) Shareholders before June 2006, 8 th Shareholders at June
Bolzoni SpA Interim Management Report at Interim Management Report. for the Bolzoni Group
 Interim Management Report for the Bolzoni Group at 30 September 2012 1 INDEX Corporate offices pg. 3 Group activity pg. 5 Group structure pg. 6 Comments of the Directors on the Company s performance pg.
Interim Management Report Bolzoni Group at 31 March Interim Management Report. Bolzoni Group
 Interim Management Report Bolzoni Group at March 31st, 2016 1 INDEX Corporate offices page 3 Group activity page 5 Group structure page 6 Comments of the Directors on the Company s performance page 7 Accounting
Bolzoni SpA Interim Management Report as at Group s activity
 Group s activity For over sixty years the Bolzoni Group has been active in the design, production and distribution of lift truck attachments and industrial material handling equipment. The close connection
The graph below illustrates the presence worldwide of the Group companies, giving work to 541 people (on 31st December 2005).
.") Bolzoni SPA Management Report 2005 The Group s Activity Bolzoni has been active since the early fifties in the engineering, manufacturing and marketing of attachments for fork lift trucks and industrial
Bolzoni SPA Management Report 2005 The Group s Activity Bolzoni has been active since the early fifties in the engineering, manufacturing and marketing of attachments for fork lift trucks and industrial
Earnings after taxes, as at June , totalled 4 million Euro, an increase of 54.7% compared to the 2.6 million achieved at June
 PRESS RELEASE BOLZONI S.p.A.: the Board of Directors approves the results of the Half Yearly Report for the period which ended June 30th 2007; excellent results with rising profits and revenue. A Consolidated
Half year Report of the Bolzoni Group as at
 Half year Report of the Bolzoni Group as at 30.06.2006 1 INDEX Group s activity page 3 Group structure page 4 Half year Report of the Bolzoni Group as at 30.06. 2006 page 5 Synthetic Consolidated Accounting
Balance Sheet Press Conference
 Hans-Georg Frey (Chairman of the Board of Management) Dr. Volker Hues (Member of the Board of Management) Frankfurt, March 22, 2017 Content 1. Jungheinrich at a Glance 2. World Material Handling Equipment
1Q 2014 Conference Call. May 7 th, 2014
 1Q 2014 Conference Call May 7 th, 2014 Agenda 1Q 2014 Outlook 2 1Q 2014 3 Highlights 1Q 2014 Sales growth continues thanks to retailers market recovery and products launched last year Strong improvement
GCL Holdings Group. Company presentation 1H 2013 results
 GCL Holdings Group Company presentation 1H 2013 results Alessandria, September 13, 2013 Forward-looking statements This presentation may include, and the Company and its representatives may from time to
BORSA ITALIANA - STAR segment PRESS RELEASE. INTERIM REPORT AS AT SEPTEMBER 30 th 2017 (in brackets results as at 30/09/2016)
") BORSA ITALIANA - STAR segment PRESS RELEASE INTERIM REPORT AS AT SEPTEMBER 30 th 2017 (in brackets results as at 30/09/2016) GROWTH CONTINUES FOR THE GROUP NET PROFIT MORE THAN DOUBLED FURTHER STRONG PROGRESS
BORSA ITALIANA - STAR segment PRESS RELEASE INTERIM REPORT AS AT SEPTEMBER 30 th 2017 (in brackets results as at 30/09/2016) GROWTH CONTINUES FOR THE GROUP NET PROFIT MORE THAN DOUBLED FURTHER STRONG PROGRESS
Second estimate for the third quarter of 2008 EU27 current account deficit 39.5 bn euro 19.3 bn euro surplus on trade in services
 STAT/09/12 22 January 2009 Second estimate for the third quarter of 20 EU27 current account deficit 39.5 bn euro 19.3 bn euro surplus on trade in According to the latest revisions1, the EU272 external
Hyster-Yale Capital Holding Italy S.r.l. NOT FOR DISTRIBUTION IN THE UNITED STATES
 Hyster-Yale Capital Holding Italy S.r.l. Registered Office: Masate (MI), Via Confalonieri 2, 20060 Milan Companies Register, Tax Code and VAT No. 09416080969 NOT FOR DISTRIBUTION IN THE UNITED STATES Notice
GCL Holdings Group. Company presentation 9M 2015 results
 GCL Holdings Group Company presentation 9M results November 27, Forward-looking Statements This presentation may include, and the Company and its representatives may from time to time make, written or
FULL YEAR REPORT, 2017 TELEPHONE/AUDIO CONFERENCE 8 FEBRUARY 2018, AT CET TOMMY ANDERSSON, PRESIDENT AND CEO HELENA WENNERSTRÖM, EVP AND CFO
 TELEPHONE/AUDIO CONFERENCE 8 FEBRUARY 2018, AT 15.30 CET TOMMY ANDERSSON, PRESIDENT AND CEO HELENA WENNERSTRÖM, EVP AND CFO DIRECT LINK AUDIOCAST: HTTPS://TV.STREAMFABRIKEN.COM/BULTEN Q4 2017 TELECONFERENCE:
9M 2014 Results Presentation November 13, 2014
 9M 2014 Results Presentation November 13, 2014 9M 2014 key facts Sales: Euro 668.4 million +8.1% (+8.8% constant FX) Directly Operated Stores Same Store Sales: +9.4% (vs -5.7% in 9M 13) EBITDA: Euro 46.3
GCL Holdings Group. Company presentation 1Q 2014 results
 GCL Holdings Group Company presentation 1Q 2014 results Alessandria, May 29, 2014 Forward-looking Statements This presentation may include, and the Company and its representatives may from time to time
NASDAQ Global Index. More information about the Index can be found at
 NASDAQ Global Index The NASDAQ Global Index is a float adjusted market capitalization-weighted index designed to track the performance of global equities covering over 98% of the entire listed market capitalization
LU-VE incontra la comunità finanziaria. 24 ottobre 2016
 LU-VE incontra la comunità finanziaria 24 ottobre 2016 Disclaimer This presentation has been prepared by LU-VE S.p.A. for information purposes only and for use in presentations of the Group s results and
Company Presentation. London Star Event 2006
 Company Presentation London Star Event 2006 Introduction to Trevisan Cometal Group Trevisan Cometal is a global leader and the only General Contractor in design, engineering and manufacturing of industrial
PRIMA INDUSTRIE GROUP GAINING HEIGHT AGAIN
 PRIMA INDUSTRIE GROUP PRIMA INDUSTRIE GAINING HEIGHT AGAIN London STAR Conference October 7, 2010 EXECUTIVE SUMMARY 1. Prima highlights 2. Market trend 3. Order acquisition recovery 4. Geographical coverage
KION UPDATE CALL Q Gordon Riske, CEO Thomas Toepfer, CFO Wiesbaden, 7 May 2015
 KION UPDATE CALL 2015 Gordon Riske, CEO Thomas Toepfer, CFO Wiesbaden, 7 May 2015 AGENDA 1 Highlights Gordon Riske 2 Market update Gordon Riske 3 Financial update Thomas Toepfer 4 Outlook Gordon Riske
FY 2017 results. 26 st March 2018
 FY 2017 results 26 st March 2018 CONTENTS 1. Financial highlights 2. Net sales breakdown 3. Profit & loss 4. Net working capital 5. Net cash flow 6. Balance sheet 7. Future developments 8. Group structure
Consolidated Financial Results for the 1 st Half of FYE 2019
 Consolidated Financial Results for the 1 st Half of SUBARU CORPORATION Toshiaki Okada Corporate Executive Vice President & CFO November 5 th, 2018 1 Summary Consolidated Financial Results for the 1 st
Systemair ab Interim Report Q3 1 May January 2015
 Systemair ab Interim Report Q3 1 May 2014 31 January 2015 Third quarter, November 2014 January 2015 Net sales increased by 10 percent to SEK 1,432 million (1,298). Operating profit (EBIT) totalled SEK
NICE S.P.A. CONSOLIDATED FIRST QUARTER 2014 REPORT
 NICE S.P.A. CONSOLIDATED FIRST QUARTER 2014 REPORT Nice S.p.A. Consolidated Third Quarter 2014 Report March 31, 2014 INDEX General Informations Directors, Officers and Corporate Informations Economic and
Table Lamp & Reading Light Produced by IAR Team Focus Technology Co., Ltd
 Table Lamp & Reading Light 2012.12 Produced by IAR Team Focus Technology Co., Ltd Contents 1. Chinese Table Lamps & Reading Lights Industry Export from Jan. to Nov. in 2012... 3 1.1. Export Quantity &
NASDAQ-100. More information about the Index can be found at
 NASDAQ-100 The NASDAQ-100 Index includes 100 of the largest domestic and international non-financial companies listed on The NASDAQ Stock Market based on market capitalization. The Index reflects companies
Interim Financial Report as of March 31, 2018
 Interim Financial Report as of March 31, 2018 Board of Directors Meeting, May 7, 2018 INDEX CHAPTER 1. PRIMA INDUSTRIE SPA MANAGEMENT AND CONTROL 4 CHAPTER 2. PRIMA INDUSTRIE GROUP STRUCTURE 6 CHAPTER
Cembre SpA. Report on the Quarter ended December 31, Consolidated Income Statement
 Cembre SpA Registered Office: Via Serenissima 9, Brescia, Italy Share Capital: Euro 8.840.000 (fully paid-up) Registration no: FC 00541390175 (Commercial Register of Brescia) Report on the Quarter ended
Outlook 2015: Europe & Germany
 Part of the M&G Group Outlook 215: Europe & Germany Research presentation 27 th November 214 European Economic Fundamentals Update & Outlook 2 Economic recovery broadening GDP growth by country Q3 214
Nasdaq AlphaDEX Large Cap Value Index
 Nasdaq AlphaDEX Large Cap Value Index The NASDAQ AlphaDEX US Index Family employs the AlphaDEX stock selection methodology to select stocks from the Nasdaq US Select Index Family and the Nasdaq US Select
FTSE Global Equity Index Series
 FTSE Global Equity Index Series THE FTSE GLOBAL EQUITY INDEX SERIES With an unparalleled record of flexibility, transparency, consistent accuracy and the ability to meet any mandate, FTSE indices are already
Manitou: 2016 Results
 Manitou: 2016 Results Sales revenue of 1,332 million growing at a rate of +3.5% against 2015 (+5% at constant exchange rate) Recurring operating income at 71 million (5.3%) against 61 million (4.7%) in
Deutsche Global Infrastructure Fund (TOLLX)
") Global Infrastructure Fund (TOLLX) A step beyond MLPs Important risk information Any fund that concentrates in a particular segment of the market will generally be more volatile than a fund that invests
Global Infrastructure Fund (TOLLX) A step beyond MLPs Important risk information Any fund that concentrates in a particular segment of the market will generally be more volatile than a fund that invests
Months Consolidated Results. 28 April 2015
 1 28.04.2015 2015 3 Months Consolidated Results 28 April 2015 2 28.04.2015 DISCLAMIER Ereğli Demir Çelik Fabrikaları T.A.Ş. (Erdemir) may, when necessary, make written or verbal announcements about forward-looking
Interim results briefing. Jyri Luomakoski President and CEO Riitta Palomäki CFO 1 9 / 2016
 Interim results briefing Jyri Luomakoski President and CEO Riitta Palomäki CFO 1 9 / 2016 Q3/2016: Performance in Europe improved, supply issues impacted North American business July - September, M Net
Smaller Companies. June Andrew Paisley
 June 2018 Smaller Companies Andrew Paisley This communication is intended for investment professionals only and must not be relied on by anyone else. Aberdeen Standard Investments is a brand of the investment
Nasdaq Victory US 100 Large High Div Vol Wt L/C TR
 Nasdaq Victory US 100 Large High Div Vol Wt L/C TR The Nasdaq Victory U.S. Large Cap High Dividend 100 Long/Cash Volatility Weighted Total Return Index is based on the Nasdaq Victory U.S. Large Cap High
CONSOLIDATED GROUP RICE PASTA
 CONSOLIDATED GROUP RICE PASTA ANNUAL REPORT Business areas 59 Pasta, sauces and others This division is represented by the companies new world pasta (leader in the United States and Canada), Panzani (no.
Nasdaq AlphaDEX Large Cap Growth Index
 Nasdaq AlphaDEX Large Cap Growth Index The NASDAQ AlphaDEX US Index Family employs the AlphaDEX stock selection methodology to select stocks from the Nasdaq US Select Index Family and the Nasdaq US Select
SUMMARY. 1 Tourism statistics, February 2017 Rovaniemi. Registered overnight stays up 6 per cent in Rovaniemi
 1 SUMMARY Registered overnight stays up 6 per cent in In February 2017, 68 900 overnight stays were registered in, of which Finns accounted for 12 500 and foreigners 56 400 nights. In total, overnight
Nasdaq US Price Setters Index
 Nasdaq US Price Setters Index The Nasdaq US Price Setters Index is designed to provide exposure to US companies within the Nasdaq US Large Mid Cap Index which exhibit high degrees of pricing power. The
Agenda. 1. Highlights FY 2012 Results. 2. Operational Performance Priorities for Financials. 5. Conclusion
 1MARCH 2013 Legal Disclaimer Information in this presentation may involve guidance, expectations, beliefs, plans, intentions or strategies regarding the future. These forward-looking statements involve
Nasdaq Victory International 500 Vol Wt TR
 12/11 3/12 6/12 9/12 3/13 6/13 9/13 12/13 6/14 9/14 12/14 3/15 9/15 12/15 3/16 6/16 12/16 3/17 6/17 9/17 3/18 6/18 9/18 12/18 Nasdaq Victory International 500 Vol Wt TR The Nasdaq Victory International
Nasdaq AlphaDEX Mid Cap Core Index
 Nasdaq AlphaDEX Mid Cap Core Index The NASDAQ AlphaDEX US Index Family employs the AlphaDEX stock selection methodology to select stocks from the Nasdaq US Select Index Family and the Nasdaq US Select
BORSA ITALIANA - STAR segment PRESS RELEASE
 BORSA ITALIANA - STAR segment PRESS RELEASE INTERIM REPORT AS AT MARCH 31 st 2018 (in brackets results as at 31/03/2017) GROWTH OF REVENUES AND ORDER ACQUISITION PROFITABILITY IMPROVEMENT CONTINUES Consolidated
FY 2016 Results March 2nd, 2017
 FY 2016 Results March 2nd, 2017 Definitions & assumptions In this presentation: ForEx stands for Foreign Exchange Rates; Organic stands for effect net of ForEx and hedging derivatives; Q4 stands for fourth
: 40 SPARKLING YEARS
 1977-2017 : 40 SPARKLING YEARS ISMO Paris June 6 th, 2018 Prima Group at a glance Founded in 1977, Prima Industrie is a global leader in high technology laser and sheet metal processing systems and electronic
: 40 SPARKLING YEARS. Company profile
 1977-2017 : 40 SPARKLING YEARS Company profile July 2018 Prima Group at a glance Founded in 1977, Prima Industrie is a global leader in high technology laser and sheet metal processing systems and electronic
Nasdaq US Large Cap Equities for Rising Rates Index
 Nasdaq US Large Cap Equities for Rising Rates Index The Nasdaq US Large Cap Equities for Rising Rates Index (NQERR) consists of 5 U.S. securities whose stock prices have historically exhibited relatively
NKT Holding. Interim Report Q Audiocast presentation 8 November 2012 at 10:00 am CET
 NKT Holding Interim Report Q3 2012 Audiocast presentation 8 November 2012 at 10:00 am CET Agenda Page Page 2 2 NKT Group Highlights Q3 2012 Financial results Q3 2012 Companies NKT Cables Nilfisk-Advance
TIGER: Tracking Indexes for the Global Economic Recovery By Eswar Prasad and Karim Foda
 TIGER: Tracking Indexes for the Global Economic Recovery By Eswar Prasad and Karim Foda Technical Appendix Methodology In our analysis, we employ a statistical procedure called Principal Component Analysis
Travel Insurance and Assistance
 Travel Insurance and Assistance Worldwide research covering over 40 countries Series Prospectus Finaccord Ltd., 2016 Web: www.finaccord.com. E-mail: info@finaccord.com 1 Prospectus contents Page What is
Nasdaq US Large Cap Equities for Rising Rates Index
 Nasdaq US Large Cap Equities for Rising Rates Index The Nasdaq US Large Cap Equities for Rising Rates Index (NQERR) consists of 5 U.S. securities whose stock prices have historically exhibited relatively
Nasdaq Victory International 500 Vol Wt NTR Index
 Nasdaq Victory International 500 Vol Wt NTR Index The Nasdaq Victory International 500 Volatility Weighted Net Total Return Index contains the 500 largest publicly traded stocks within the Nasdaq Global
1Q of FY ending December 31, (0.2) (1.9) 11.3 (0.2) (0.2) (0.2) (0.2) (1.2) (89.2) 0.1
 (1.9) 11.3 (0.2) (0.2) (0.2) (0.2) (1.2) (89.2) 0.1") August 6, ISEKI & CO., LTD. Supplementary Information to Consolidated Financial Results (April 1, June 30, ) I. Consolidated business results for the three months ended June 30, (Billions of yen, %) Year-on
August 6, ISEKI & CO., LTD. Supplementary Information to Consolidated Financial Results (April 1, June 30, ) I. Consolidated business results for the three months ended June 30, (Billions of yen, %) Year-on
Consolidated Financial Results for FYE 2018
 Consolidated Financial Results for SUBARU CORPORATION Toshiaki Okada Corporate Executive Vice President & CFO May 11 th, 20180 0 Summary Consolidated Financial Results for Net sales and global unit sales
Arçelik Month Financial Results
 Arçelik 2016 12-Month Financial Results 2016 Q4 Key Developments 2 Strong sales in domestic MDA market both in sell-in and sell-out Slowing growth in European MDA market at retail level First signs of
RENAULT GROUP CHEUVREUX AUTUMN CONFERENCE. RENAULT GROUP 20th, SEPTEMBER 2012 RENAULT PROPERTY
 RENAULT GROUP CHEUVREUX AUTUMN CONFERENCE DISCLAIMER Information contained within this document may contain forward looking statements. Although the Company considers that such information and statements
Interim Results for the 6 months to 30 September NOVEMBER 2010
 Interim Results for the 6 months to 30 September 2010 8 NOVEMBER 2010 Nick Robertson Introduction Strong H1 Retail sales up 50%, group revenues up 45% Strong UK and international retail sales, up 26% and
NASDAQ Composite INDEX TICKERS
 NASDAQ Composite The Nasdaq Composite Index measures all Nasdaq domestic and international based common type stocks listed on The Nasdaq Stock Market. To be eligible for inclusion in the Index, the security's
Travel Insurance and Assistance
 Travel Insurance and Assistance Worldwide research covering over 40 countries Series Prospectus Finaccord 1 Prospectus contents Page What is the research? Which countries are covered What methodology has
Travel Insurance and Assistance
 Travel Insurance and Assistance Worldwide research covering over 40 countries Series Prospectus Finaccord Web: www.finaccord.com. E-mail: info@finaccord.com 1 Prospectus contents Page What is the research?
Global Equity Trading Volumes Surge 36% in 1 st half 2015 driven by Mainland China
 EMBARGO: :1BST/1:1CET/19:1EDT Global Equity Trading Volumes Surge 36% in 1 st half 215 driven by Mainland China Global Equity Trading Volumes Ex Mainland China Up 5% Mainland China Share Trading Vols Rise
Order intake increased by 31 per cent to 78,3 (59,6) MEUR. Adjusted for acquisition and
 MEUR. Adjusted for acquisition and") Interim report Q2 2017 January - June Troax Group AB (publ) Hillerstorp 16th August, 2017 INTERIM REPORT 2017 APRIL JUNE 2017 Order intake increased by 30 per cent to 39,8 (30,5) MEUR. Adjusted for acquisition
Interim report Q2 2017 January - June Troax Group AB (publ) Hillerstorp 16th August, 2017 INTERIM REPORT 2017 APRIL JUNE 2017 Order intake increased by 30 per cent to 39,8 (30,5) MEUR. Adjusted for acquisition
KION Group on course for strong full-year results after a solid third quarter
 Press release Website: kiongroup.com/mediasite Twitter: @kion_group KION Group on course for strong full-year results after a solid third quarter Total value of order intake between July and September
BUSINESS YEAR 2009 RESULTS
 BUSINESS YEAR 2009 RESULTS Madrid, 26 February 2010 WORLD PRODUCTION OF STAINLESS STEEL Thousand Mt. 30,000 28,000 26,000 24,000 22,000 20,000 18,000 16,000 14,000 12,000 10,000 8,000 6,000 4,000 2,000
VINX 30 Index. More information about the Index can be found at
 VINX 30 Index The VINX 30 Index is the leading share index of the Nordic Exchanges and the Oslo exchange. The index consists of the 30 largest and most actively traded shares listed on NASDAQ OMX Nordic
Nasdaq Chaikin Power US Small Cap Index
 Nasdaq Chaikin Power US Small Cap Index The Nasdaq Chaikin Power Indexes are rules-based, quantitatively enabled indexes designed to augment existing Index benchmarks based on the Chaikin Investment Strategy
FY 2012 Results. March 12 th, 2013
 FY 2012 Results March 12 th, 2013 Fiscal Year 2012 Results Highlights FY 2012 results showing top line growth and profitability increase*, in line with company expectations Net Revenues up 15.1% to 279.3mln
June Todd Hale James Russo Jonathan Banks Jean-Jacques Vandenheede
 June 20 Todd Hale James Russo Jonathan Banks JeanJacques Vandenheede Nielsen Global Scorecard Shopping measures appear to be trending upward, driven by gains in China, India, Canada and the U.S., with
Months Results. November 12 th, 2013
 2013 9 Months Results November 12 th, 2013 9 Months 2013 Results - Highlights Sustainable growth and healthy profitability in the first nine months 2013, consistent with sophisticated consumer demand,
QUARTERLY REPORT JUNE 30 TH, 2007
 QUARTERLY REPORT JUNE 30 TH, 2007 BIESSE S.p.A. QUARTERLY REPORT AT JUNE 30 TH, 2007 SUMMARY Group structure page 3 Explanatory Notes page 4 Parent company corporate bodies page 5 Highlights page 6 General
Advanced and Emerging Economies Two speed Recovery
 Advanced and Emerging Economies Two speed Recovery 23 November 2 Bauhinia Foundation Research Centre Masaaki Shirakawa Governor of the Bank of Japan Slide 1 Japan s Silver Yen and Hong Kong s Silver Yuan
GLOBAL EMERGING MARKETS: IT IS THE STOCKS THAT MATTER ANWAAR WAGNER
 GLOBAL EMERGING MARKETS: IT IS THE STOCKS THAT MATTER ANWAAR WAGNER Portfolio Manager at Electus AGENDA Emerging Markets (EM) Crises? EM vs Developed Markets (DM) OM GEM Fund It s the shares that matter
PROPERTY EU EUROPEAN LOGISTICS INVESTMENT BRIEFING
 PROPERTY EU EUROPEAN LOGISTICS INVESTMENT BRIEFING RICHARD HOLBERTON, SENIOR DIRECTOR, EMEA RESEARCH, CBRE FEBRUARY 19 TH 2015 AGENDA Economy Market Activity Forecasts Issues ECONOMY 2014 Some Alarms and
BOARD OF DIRECTORS REPORT ON OPERATIONS IN THE 4 TH QUARTER OF 2002
 MERLONI ELETTRODOMESTICI SPA Registered office: V.le A. Merloni, 47-60044 Fabriano Rome office: Via della Scrofa, 64 00186 Roma Capital stock: 99,416,219.40 fully paid in Tax/VAT code: 00693740425 Court
The Capital Strength Index
 The Capital Strength Index The Capital Strength Index seeks to provide exposure to well-capitalized companies with strong market positions that have the potential to provide their stockholders with a greater
Hong Kong s Experience
 Cross Border Issues IMF Conference on Operationalizing Systemic Risk Monitoring Washington, D. C. 26 May 21 Hong Kong s Experience Dong He Executive Director (Research) Hong Kong Monetary Authority 1 Outline
Fourth Quarter 2016 Performance Summary
 Fourth Quarter 2016 Performance Summary Operational and Financial Highlights - 2016 Net profit rises by +2.5% to Euros 545.5 million Recurring sales (excluding Raw Materials and Others) rise by +4.5% (+4.6%
Months Consolidated Results. 25 April 2016
 1 25.04.2016 2016 3 Months Consolidated Results 25 April 2016 2 25.04.2016 DISCLAMIER Ereğli Demir Çelik Fabrikaları T.A.Ş. (Erdemir) may, when necessary, make written or verbal announcements about forward-looking
May Domestic Exports Imports. Volume Tonnes SW. MAT May-14 4, ,960 38, ,
 May 2014 Overview Table 1.1 Overview trends for Domestic, Export and Import trade Domestic Exports Imports Month Slaughter Pigmeat (Tonnes) Volume Tonnes SW Value $AUD (Million) Volume Tonnes SW Value
Operating result totalled EUR 14.3 (12.1) million, equalling 11.0 (10.5) per cent of net sales.
 million, equalling 11.0 (10.5) per cent of net sales.") PONSSE PLC, STOCK EXCHANGE RELEASE, 25 APRIL 2017, 9:00 a.m. PONSSE S INTERIM REPORT FOR 1 JANUARY 31 MARCH 2017 Net sales amounted to EUR 129.9 (115.1) million. Operating result totalled EUR 14.3 (12.1)
PONSSE PLC, STOCK EXCHANGE RELEASE, 25 APRIL 2017, 9:00 a.m. PONSSE S INTERIM REPORT FOR 1 JANUARY 31 MARCH 2017 Net sales amounted to EUR 129.9 (115.1) million. Operating result totalled EUR 14.3 (12.1)
NASDAQ OMX Green Economy Europe USD
 NASDAQ OMX Green Economy Europe USD The NASDAQ OMX Green Economy Europe Index is a market-capitalization weighted designed to track the performance of companies across the spectrum of industries most closely
Systemair YEAR-END REPORT. 1 May April 2008 (SEK million) Strong finish to year
 Strong finish to year") Systemair YEAR-END REPORT 1 May 2007 30 April 2008 (SEK million) Strong finish to year Fourth quarter February April 2008 Net sales increased by 23% to SEK 769 million (650). Operating profit (EBIT) rose
Systemair YEAR-END REPORT 1 May 2007 30 April 2008 (SEK million) Strong finish to year Fourth quarter February April 2008 Net sales increased by 23% to SEK 769 million (650). Operating profit (EBIT) rose
FINAL RESULTS ANNOUNCEMENT FOR THE YEAR ENDED 31 MARCH 2010 FINANCIAL HIGHLIGHTS. Own stores number reached 764, increased by 11.
 Hong Kong Exchanges and Clearing Limited and The Stock Exchange of Hong Kong Limited take no responsibility for the contents of this announcement, make no representation as to its accuracy or completeness
EU-China FDI Monitor
 EU-China FDI Monitor 1Q 215 Update: Public Version This report was produced for the European Commission under the China Observatory project. See final page for full disclaimer. 1 East 4 th Street, Suite
PRESS RELEASE. The following table shows a breakdown of sales by geographical area:
 PRESS RELEASE H1 2012 results approved: slight decrease in sales (-2.7%), the good level of profitability confirmed (EBITDA 17% of sales), net financial position improved. Net sales: 121.5 million euro
Power of Travel Promotion Evolution
 Power of Travel Promotion Evolution Promotion More Important than Ever Power of Promotion $7 million Median state = marketing budget FY 2014-15 OR 45 seconds worth of Super Bowl ads $100 million = Presidential
Financial & Business Highlights For the Year Ended June 30, 2017
 Financial & Business Highlights For the Year Ended June, 17 17 16 15 14 13 12 Profit and Loss Account Operating Revenue 858 590 648 415 172 174 Investment gains net 5 162 909 825 322 516 Other 262 146
Troax Group AB (publ) Hillerstorp 13th of February, 2019
 Hillerstorp 13th of February, 2019") Troax Group AB (publ) Hillerstorp 13th of February, 2019 INTERIM REPORT JANUARY - DECEMBER 2018 OCTOBER - DECEMBER Order intake increased by 9 per cent to 41,7 (38,4) MEUR. Adjusted for currency the increase
Troax Group AB (publ) Hillerstorp 13th of February, 2019 INTERIM REPORT JANUARY - DECEMBER 2018 OCTOBER - DECEMBER Order intake increased by 9 per cent to 41,7 (38,4) MEUR. Adjusted for currency the increase
Santander 11 th Annual Conference. August 22-24, 2010 São Paulo 1
 Santander 11 th Annual Conference August 22-24, 2010 São Paulo 1 Disclaimer The information contained in this presentation may include statements which constitute forward-looking statements, within the
UK retail sales 137, ,967 26% International retail sales 214, ,954 39%
 2 3 000s Six months to 28 February 2013 Six months to 29 February 2012 Change Group revenues 1 359,731 269,926 33% Retail sales 352,263 262,921 34% UK retail sales 137,579 108,967 26% International retail
Erdemir Group Months Consolidated Financial Results
 1 / 35 Erdemir Group 2014 6 Months Consolidated Financial Results 12 August 2014 2 / 35 DISCLAIMER Ereğli Demir Çelik Fabrikaları T.A.Ş. (Erdemir) may, when necessary, make written or verbal announcements
INVESTMENT MARKET UPDATE UBC FACULTY PENSION PLAN
 INVESTMENT MARKET UPDATE UBC FACULTY PENSION PLAN MIKE LESLIE, FACULTY PENSION PLAN NEIL WATSON, LEITH WHEELER FEBRUARY 11, 2015 Presenters Mike Leslie Executive Director, Investments Faculty Pension Plan
Three-speed recovery. GDP growth. Percent Emerging and developing economies. World
 Three-speed recovery GDP growth Percent 1 8 6 4 2-2 -4-6 198 1985 199 1995 2 25 21 215 Source: IMF WEO; Milken Institute. Emerging and developing economies Advanced economies World Output is still below
INTERIM REPORT Q2-2011
 INTERIM REPORT Q2-2011 Live presentation 23 August 2011 at 11:00 am NKT Holding A/S / IR presentation / Interim Report 2, 2011 1 Agenda Highlights Q2 Financial results Q2 2011 Companies - NKT Cables -
FY 2014 Results Presentation March 5, 2015
 FY 2014 Results Presentation March 5, 2015 FY 2014 key facts Sales: Euro 824.2 million +9.3% (+10.1% constant FX) Directly Operated Stores Same Store Sales: +7.9% (vs -3.0% in FY 13) EBITDA: Euro 42.6