Power of Travel Promotion Evolution
|
|
|
- Neil Owens
- 5 years ago
- Views:
Transcription


1 Power of Travel Promotion Evolution

2
3 Promotion More Important than Ever


4 Power of Promotion $7 million Median state = marketing budget FY OR 45 seconds worth of Super Bowl ads $100 million = Presidential election TV advertisements through early August 2016

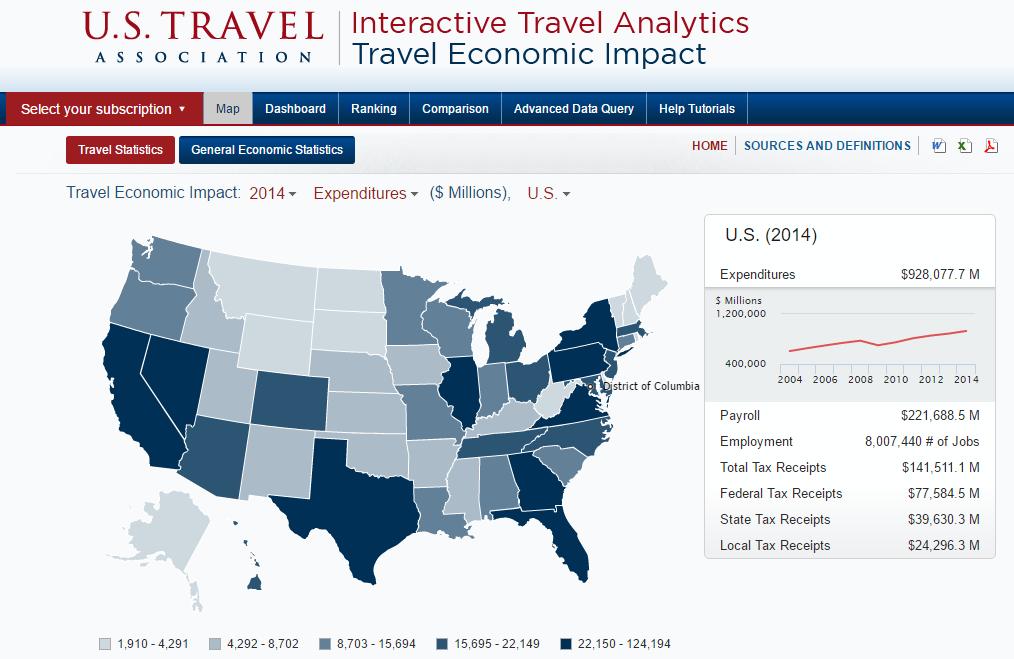
5 Travel Drives America s Economy

6 Revenue Generator
7 Educator

8 Travel Promotion s Virtuous Cycle

9 Case Studies


10 Halo Effect


11 Influencer

12 Economic Driver

13 Building U.S. Market Share


14 Partner
15 $ millions Economic Risks of Cutting Tourism Promotion $30 $25 Total Budget $20 $15 $10 $5 $ * Pennsylvania United States Average Source: U.S. Travel Association *Note - 46 states reporting in FY

16 Economic Risks of Cutting Tourism Promotion 2014/2010 Growth Rates U.S. total Competitive region 0% 5% 10% 15% 20% 25% Direct Travel Spending State and Local Travel Tax Revenues Travel Employment Note - The nine-state region includes: PA, NY, NJ, DE, MD, DC, VA, WV, OH. Source: U.S. Travel Association


17 Weathering the Storm


18 Back in the Game
19 Key Takeaways 1. Travel gives back to local communities. 2. Investment in travel promotion helps destinations compete and thrive. 3. Enhanced travel-related offerings help states and destinations attract visitors and businesses. 4. Brand USA boosts tourism to the United States. 5. Decreases in travel promotion investments have an immediate and long-term negative impact.


20 Resources

21 The Rising Dollar and International Travel to the United States With post-brexit update
22 Currency movements and global economy impact trade Percent growth 20% 15% 10% Value of Dollar (Jan 1997=100) % 80 0% -5% -10% -15% % Exports Trade-Weighted GDP Growth (Outside U.S.) Dollar 0 Source: U.S. Department of Commerce, Federal Reserve and Oxford Economics
23 Travel not as adversely affected as other sectors Percent growth 25% Value of Dollar (Jan 2007=100) % % 10% 5% % -5% % 20-15% Manufacturing Exports Agriculture Exports Travel Exports Dollar 0 Source: U.S. Department of Commerce and Oxford Economics
24 Remarkable scale of U.S. dollar appreciation in 2015 Largest single-year appreciation in 33 years Appreciation against all major currencies in 2015 Appreciation against the U.K. pound has been relatively low Foreign currency per U.S. dollar Australia Canada Eurozone United Kingdom Source: Oxford Economics
25 Appreciated currency = higher relative prices A 12% increase in U.S. prices compared to OECD average; not seen since 2002 Total (OECD = 100) United States OECD Source: The Organization for Economic Cooperation and Development (OECD)
26 What has happened in first part of 2016? A slight reversal of dollar appreciation trends Changes in U.S. dollar exchange in first half of 2016 United Kingdom (pound) 11.2% Mexico (peso) 7.5% China (yuan) 2.1% India (rupee) 1.9% South Korea (won) -1.9% Australia (dollar) -1.9% Eurozone (euro) -2.0% Canada (dollar) -6.2% Japan (yen) -14.9% Brazil (real) -19.2% Slight depreciation of U.S. dollar against many currencies. But significant appreciation against the U.K. pound. This was due to Brexit. Source: x-rates.com
27 Major fluctuations against top inbound markets over past year U.S. dollar appreciation, June 30, 2015-June 30, 2016 Change in value of U.S. dollar 25% 20% 15% 10% 5% 0% -5% -10% -15% #1 Overseas United Kingdom #2 Overall Mexico China India Canada Australia South Korea Brazil Eurozone Japan #2 Overseas -20% Source: x-rates.com
28 The rise of the dollar in perspective Change in value of U.S. dollar Total U.S. dollar appreciation, through June 30, % 90% 80% 70% 60% 50% 40% 30% 20% 10% 0% Brazil (2011) Mexico (2011) India (2010) Australia (2012) Source: x-rates.com and U.S. Travel Association Canada (2011) Japan (2011) Eurozone (2011) United Kingdom (2014) Eurozone (2014) South Korea (2014) China (2014)
29 So why is Brexit so significant for the U.S. travel market? 1. Was quite sudden, and affected a relatively strong currency Dollars per Pound 1.5 June 23, 2016 Brexit Referendum $ Source: x-rates.com
30 So why is Brexit so significant for the U.S. travel market? 2. Visitations from the U.K. to the U.S. are relatively sensitive to currency rate fluctuations Growth in visitations from the U.K. 15% Fluctuation of dollar/pound exchange rates -15% 10% 5% 0% -5% -10% -15% % -5% 0% 5% 10% 15% -20% Visitations from the U.K. Source: U.S. Department of Commerce and Oxford Economics U.S. dollar/u.k. pound nominal exchange rate 20%

31 So why is Brexit so significant for the U.S. travel market? 3. The U.K. is our largest overseas market Other Overseas, 40% Italy, 3% India, 3% Australia, 4% Source: U.S. Department of Commerce United Kingdom, 13% Japan, 10% China, 7% Brazil, 6% Germany, 6% South Korea, 5% France, 5% Top long-haul U.K. outbound markets U.K. % of total LH to each country % of total LH from U.K. United States 13% 24% United Arab Emirates 11% 6% India 20% 5% Thailand 12% 5% Egypt 11% 5% Canada 14% 4% Australia 9% 3% China 8% 3% Mexico 10% 3% Morocco 5% 2% Source: Oxford Economics
32 Brexit: Impact on U.K. Inbound Travel To the U.S. Annual Percent Change in U.K. Visitations to the U.S. 6% 4% 2% 2.7% A percentage point loss of 7.7% in % -2% % -6% U.K (pre-brexit) U.K (post-brexit) -5.0% Source: Oxford Economics
33 A projected loss of half a million U.K. inbound travelers in 2017 Visitations from the U.K. (thousands) U.K. (pre-brexit) 4, % 5, % 5,150 U.K. (post-brexit) 4, % 4, % 4,624 Loss to Brexit (visitations) Loss to Brexit (%) -2.9% -10.2% Source: U.S. Travel Association based on data from U.S. Department of Commerce and Oxford Economics 10.2% loss in U.K. visitations next year 10.2% * 12.8% (U.K. share in overseas) = 1.3% loss in Overseas visitations
34 Signs of change in demand from the U.K. in Second Half of 2016 YoY % change in share of searches 30% 20% 10% 0% June 23rd - Polling day for EU referendum -10% -20% -30% -40% -50% -60% U.K. Demand for U.S. Search Week Source: Nsight

35
36 Overall Current Travel Indicator (CTI) Index (>50=expansion, <50=decline) Mar Feb-06 Jan-07 Dec-07 Nov-08 Oct-09 Sep-10 Aug-11 Jul-12 Jun-13 May-14 Apr-15 Mar Financial crisis 45 Source: Oxford Economics and U.S. Travel Association
37 Domestic vs. International Current Travel Indicators (CTI) Index (>50=expansion, <50=decline) Mar-05 Feb-06 Jan-07 Dec-07 Nov-08 Oct-09 Sep-10 Aug-11 Jul-12 Jun-13 May-14 Apr-15 Mar International (3 month moving average) Domestic (3 month moving average) 35 Source: Oxford Economics and U.S. Travel Association
38
Advanced and Emerging Economies Two speed Recovery
 Advanced and Emerging Economies Two speed Recovery 23 November 2 Bauhinia Foundation Research Centre Masaaki Shirakawa Governor of the Bank of Japan Slide 1 Japan s Silver Yen and Hong Kong s Silver Yuan
Three-speed recovery. GDP growth. Percent Emerging and developing economies. World
 Three-speed recovery GDP growth Percent 1 8 6 4 2-2 -4-6 198 1985 199 1995 2 25 21 215 Source: IMF WEO; Milken Institute. Emerging and developing economies Advanced economies World Output is still below
UK Economic Outlook March 2017
 www.pwc.co.uk/economics Contents 1 2 3 4 Global outlook UK economic trends and prospects Consumer spending prospects after Brexit Will robots steal our jobs? 2 Global growth in 2017 should be slightly
B-GUIDE: Economic Outlook
 Aug-12 Apr-13 Dec-13 Aug-14 Apr-15 Dec-15 Aug-16 Apr-17 Jul-15 Nov-15 Mar-16 Jul-16 Nov-16 Mar-17 Jul-17 Quarterly Economic Outlook: Quarter 4 2017 4 January 2018 B-GUIDE: Economic Outlook The economy
Monetary Policy: A Key Driver for Long Term Macroeconomic Stability
 Monetary Policy: A Key Driver for Long Term Macroeconomic Stability Julio Velarde Governor Central Bank of Peru March 2016 Agenda 1. Peru s growth is based on strong fundamentals 2. Recent economic developments
Eurozone Economic Watch. February 2018
 Eurozone Economic Watch February 2018 Eurozone: Strong growth continues in 1Q18, but confidence seems to peak GDP growth moderated slightly in, but there was an upward revision to previous quarters. Available
ECONOMIC BULLETIN - No. 41, NOVEMBER Statistical tables
 ECONOMIC BULLETIN - No. 41, NOVEMBER 2005 APPENDIX Appendix Statistical tables The world economy Table a1 GDP at constant prices a2 Industrial production a3 Consumer prices a4 External current account
CALHOUN COUNTY CHAMBER OF COMMERCE AND VISITORS CENTER
 2017 Economic Forum CALHOUN COUNTY CHAMBER OF COMMERCE AND VISITORS CENTER Information provided by School of Business and Industry THANK YOU to our SPONSORS Calhoun County Economy Forum National Update
Consolidated Financial Results for the 1 st Half of FYE 2019
 Consolidated Financial Results for the 1 st Half of SUBARU CORPORATION Toshiaki Okada Corporate Executive Vice President & CFO November 5 th, 2018 1 Summary Consolidated Financial Results for the 1 st
Real Effective Exchange Rate based on CPI as Price Index for India*
 Real Effective Exchange Rate based on CPI as Price Index for India ARTICLE Real Effective Exchange Rate based on CPI as Price Index for India* Effective exchange rates are summary indicators of movements
Quarterly Investment Update First Quarter 2017
 Quarterly Investment Update First Quarter 2017 Market Update: A Quarter in Review March 31, 2017 CANADIAN STOCKS INTERNATIONAL STOCKS Large Cap Small Cap Growth Value Large Cap Small Cap Growth Value Emerging
Finally, A Global Tailwind for U.S. Manufacturing Growth
 Finally, A Global Tailwind for U.S. Manufacturing Growth MAPI Foundation Webinar December 12, 217 Cliff Waldman Chief Economist cwaldman@mapi.net Key Takeaways The global economic recovery is both strengthening
1Q of FY ending December 31, (0.2) (1.9) 11.3 (0.2) (0.2) (0.2) (0.2) (1.2) (89.2) 0.1
 (1.9) 11.3 (0.2) (0.2) (0.2) (0.2) (1.2) (89.2) 0.1") August 6, ISEKI & CO., LTD. Supplementary Information to Consolidated Financial Results (April 1, June 30, ) I. Consolidated business results for the three months ended June 30, (Billions of yen, %) Year-on
August 6, ISEKI & CO., LTD. Supplementary Information to Consolidated Financial Results (April 1, June 30, ) I. Consolidated business results for the three months ended June 30, (Billions of yen, %) Year-on
The Global Economic Crisis: Asia and the role of China Elliott School of International Affairs, George Washington University March 31, 2009
 The Global Economic Crisis: Asia and the role of China Elliott School of International Affairs, George Washington University March 31, 29 Anoop Singh Asia and Pacific Department IMF 1 Five key questions
Business Cycle Index July 2010
 Business Cycle Index July 2010 Bureau of Trade and Economic Indices, Ministry of Commerce, Tel. 0 2507 5805, Fax. 0 2507 5806, www.price.moc.go.th Thailand economic still expansion. Medium-run Leading
The Internationalisation of the Renminbi
 Tel: (852)3550-7070; Fax: (852)2104-6938 Email: lawrence@lawrencejlau.hk; WebPages: www.igef.cuhk.edu.hk/ljl *All opinions expressed herein are the author s own and do not necessarily reflect the views
TIGER: Tracking Indexes for the Global Economic Recovery By Eswar Prasad and Karim Foda
 TIGER: Tracking Indexes for the Global Economic Recovery By Eswar Prasad and Karim Foda Technical Appendix Methodology In our analysis, we employ a statistical procedure called Principal Component Analysis
Those who are interested in international business may wish to take FIN 430 which is our course on international financial management.
 1 For the most part, the basic principles you ll learn in this class apply to both domestic and international businesses. However, two important differences you ll find when doing business internationally
August 8, 2006 Authorized for Public Release 148 of 158. Appendix 1: Materials used by Mr. Kos
 August 8, 6 Authorized for Public Release 148 of 158 Appendix 1: Materials used by Mr. Kos Class II -- Restricted FR Page 1 of 4 Realized Volatility of MSCI Equity Indices 35 25 15 5 22 August 8, 6 Authorized
ECONOMIC OUTLOOK FINALLY, SYNCHRONIZED GLOBAL GROWTH
 ECONOMIC OUTLOOK FINALLY, SYNCHRONIZED GLOBAL GROWTH Augustine Faucher Chief Economist November 13, 2017 Senior Economic Advisor Chief Economist BETTER GROWTH THIS YEAR, AND AN UPGRADE TO 2018 World output,
4.1 Foreign Exchange Average Rates Pak Rupees per US Dollar
 4.1 Foreign Exchange Average Rates Pak Rupees per US Dollar PERIOD Jul. Aug. Sep. Oct. Nov. Dec. Jan. Feb. 1990-91 21.7944 21.8083 21.7944 21.8440 21.9107 21.9099 22.1296 22.2054 1991-92 24.6281 24.7185
2016 Economic Outlook for Ireland & Eurozone IFP Launch
 2016 Economic Outlook for Ireland & Eurozone IFP Launch December 3 rd 2015 Jim Power Global Background US & UK growing at reasonable pace Euro Zone growing well below potential Emerging markets in some
Economic Outlook: Global and India. Ajit Ranade IEEMA T & D Conclave December 12, 2014
 Economic Outlook: Global and India Ajit Ranade IEEMA T & D Conclave December 12, 2014 Global scenario US expected to drive global growth in 2015 Difference from % YoY Growth October Actual October Projections
Russia: Macro Outlook for 2019
 October 2018 Russia: Macro Outlook for 2019 Natalia Orlova Head of Alfa Bank Macro Insights +7 495 795 36 77 norlova@alfabank.ru Egypt Saudi Arabia Brazil S. Africa UAE Iraq China Japan US Mexico UK Russia
Fuji Heavy Industries Ltd.
 President & CEO, Yasuyuki Yoshinaga Fuji Heavy Industries Ltd. May 9, 2014 0 Business Results for the FYE2014 ( 100M) Consolidated automobile sales FYE2013 FYE2014 YoY 724,000 825,000 High +13.9 % Net
Recent developments in the Mexican Peso market. March 2009
 Recent developments in the Mexican Peso market March 2009 1 Index 1. The FX market before the financial turmoil 2. What we got right what we missed 3. Structural change in the FX market 4. Final remarks
FY ended December 31, 2015 Restated basis *1. Year-on-year change. FY ended December 31, 2016 Forecast *2. Difference (forecast/ actual)
") February 14, 2017 ISEKI & CO., LTD. Supplementary Information to Consolidated Financial Results (January 1, ) I. Consolidated business results for the fiscal year ended (Billions of yen, %) 2015 Restated
February 14, 2017 ISEKI & CO., LTD. Supplementary Information to Consolidated Financial Results (January 1, ) I. Consolidated business results for the fiscal year ended (Billions of yen, %) 2015 Restated
Economic Outlook January, 2012
 Economic Outlook January, 2012 Summary Global economy Low global growth scenario, tail risks have become smaller. Risks (Debt Ceiling, elections in Italy, growth in Europe). Brazil Activity shows signs
International Travel & Tourism Study (Published March 2005)
") International Travel & Tourism Study (Published March 2005) Roy Morgan International conducts surveys in the US,, Australia, New Zealand and Indonesia on a continuous basis. Respondents are asked about
International Travel & Tourism Study (Published March 2005) Roy Morgan International conducts surveys in the US,, Australia, New Zealand and Indonesia on a continuous basis. Respondents are asked about
The Forecast for Emerging Markets
 The Forecast for Emerging Markets Monday, April 27, 2009 09:30 AM - 10:45 AM Moderator Komal Sri-Kumar, Managing Director, Chief Global Strategist, TCW Group Inc.; Senior Fellow, Milken Institute Speakers
Table Lamp & Reading Light Produced by IAR Team Focus Technology Co., Ltd
 Table Lamp & Reading Light 2012.12 Produced by IAR Team Focus Technology Co., Ltd Contents 1. Chinese Table Lamps & Reading Lights Industry Export from Jan. to Nov. in 2012... 3 1.1. Export Quantity &
FY2018, FY2019 Economic Outlook - The Japanese economy is continuing to follow a recovery track -
 REVISED to reflect the 2 nd QE for the Apr-Jun Qtr of 2018 FY2018, FY2019 Economic Outlook - The Japanese economy is continuing to follow a recovery track - September 10, 2018 Copyright Mizuho Research
2Q of FY ended December 31, 2015 Restated basis *1. Year-on year change (Restated basis) 2Q of FY ending December 31, 2016 Forecast
 2Q of FY ending December 31, 2016 Forecast") August 10, 2016 ISEKI & CO., LTD. Supplementary Information to Consolidated Financial Results (January 1, 2016 June 30, 2016) I. Consolidated business results for the six months ended June 30, 2016 (Billions
August 10, 2016 ISEKI & CO., LTD. Supplementary Information to Consolidated Financial Results (January 1, 2016 June 30, 2016) I. Consolidated business results for the six months ended June 30, 2016 (Billions
Economic & Financial Indicators. November Banco de Cabo Verde
 Economic & Financial Indicators November Banco de Cabo Verde Monetary Policy Report BANCO DE CABO VERDE Department of Economic Studies and Statistics Avenida Amílcar Cabral, 27 CP 7600-101 - Praia - Cabo
ABI MONTHLY REPORT 1 March 2018 (Main evidence)
") ABI MONTHLY REPORT 1 March 2018 (Main evidence) LOANS AND DEPOSITS 1. In February 2018, loans to customers granted by banks operating in Italy, totalling 1,777.2 billion euro (cf. Table 1) was almost 70
ABI MONTHLY REPORT 1 March 2018 (Main evidence) LOANS AND DEPOSITS 1. In February 2018, loans to customers granted by banks operating in Italy, totalling 1,777.2 billion euro (cf. Table 1) was almost 70
June Todd Hale James Russo Jonathan Banks Jean-Jacques Vandenheede
 June 20 Todd Hale James Russo Jonathan Banks JeanJacques Vandenheede Nielsen Global Scorecard Shopping measures appear to be trending upward, driven by gains in China, India, Canada and the U.S., with
The External Environment for Developing Countries
 d Public Disclosure Authorized Public Disclosure Authorized Public Disclosure Authorized The External Environment for Developing Countries July 2009 The World Bank Development Economics Prospects Group
The Economic & Financial Outlook
 The Economic & Financial Outlook James Marple Director & Senior Economist TD Economics May 3, 2018 Global Economies Break Pattern Of Serial Disappointment 4.0 World GDP, Year/Year % Change 3.9 3.8 3.7
Global Themes and Risks
 The Goldman Sachs Group, Inc. Goldman Sachs Research Global Themes and Risks April 2013 Abby Joseph Cohen, CFA Goldman, Sachs & Co. 1-212-902-4095 abby.cohen@gs.com Rachel Siu Goldman, Sachs & Co. 1-212-357-0493
Eurozone Economic Watch. November 2017
 Eurozone Economic Watch November 2017 Eurozone: improved outlook, still subdued inflation Our MICA-BBVA model for growth estimates for the moment a quarterly GDP figure of around -0.7% in, after % QoQ
Financial Analysts Meeting. 4 th November 2010
 Financial Analysts Meeting 4 th November EH world macro economic scenario -2011 World economy has registered a clear rebound World GDP rebounded by +5,8% between Q1- and Q2-. with a strong upturn of world
Otaviano Canuto Vice President & Head of Network Poverty Reduction and Economic Management The World Bank
 Otaviano Canuto Vice President & Head of Network Poverty Reduction and Economic Management The World Bank The 11th International Academic Conference on Economic and Social Development April 6-8, 2010 Moscow
Inspiring consumer confidence in challenging economic times. Graham Pickett Lead Partner Travel, Hospitality & Leisure June 2013
 Inspiring consumer confidence in challenging economic times Graham Pickett Lead Partner Travel, Hospitality & Leisure June 2013 Inspiring consumer confidence in challenging economic times Agenda Europe
Sovereign Risks and Financial Spillovers
 Sovereign Risks and Financial Spillovers International Monetary Fund October 21 Roadmap What is the Outlook for Global Financial Stability? Sovereign Risks and Financial Fragilities Sovereign and Banking
South Region Committee Brexit and the Associated Challenges
 South Region Committee Brexit and the Associated Challenges event in Tralee with Jim Power Tralee, 17 October 2017 Brexit and the Associated Challenges The Institute of Banking, Tralee October 17 th 2017
Mexico s Macroeconomic Outlook and Monetary Policy
 Mexico s Macroeconomic Outlook and Monetary Policy Javier Guzmán Calafell, Deputy Governor, Banco de México* XP Securities Washington, DC, 13 October 2017 */ The opinions and views expressed in this document
December Overview. Table 1.1 Overview trends for Domestic, Export and Import trade
 December 2018 Overview Table 1.1 Overview trends for Domestic, Export and Import trade Domestic Exports Imports Month Slaughter Pigmeat (Tonnes) Volume Tonnes SW Value $AUD (Million) Volume Tonnes SW Value
World Economy Geopolitics Investment Strategy. The Impact of EU s Sovereign Risks on Turkish Economy. Presentation given by
 World Economy Geopolitics Investment Strategy OUTLOOK FOR WORLD S MAJOR FINANCIAL MARKETS The Impact of EU s Sovereign Risks on Turkish Economy Presentation given by Dr. Michael Ivanovitch, President MSI
P R O F E S S I O N A L S O N LY. Milan IFTA Conference "Sailing to the Future" October 2017
 P R O F E S S I O N A L S O N LY Milan IFTA Conference "Sailing to the Future" October 2017 Frédéric Leroux Global Fund Manager Head of Cross Asset Team 2 The Importance of Being a Risk Manager 3 Over
2018 Economic Forum CALHOUN COUNTY CHAMBER OF COMMERCE AND VISITORS CENTER. School of Business and Industry. Information provided by
 2018 Economic Forum CALHOUN COUNTY CHAMBER OF COMMERCE AND VISITORS CENTER Information provided by School of Business and Industry THANK YOU to our SPONSORS Calhoun County Economy Forum National Update
Six months of FY ending December 31, (0.4) (1.9) 22.5 (0.4) (0.3) (0.4) (0.1) (0.4) (0.7) (2.0) 0.9 (1.
 (1.9) 22.5 (0.4) (0.3) (0.4) (0.1) (0.4) (0.7) (2.0) 0.9 (1.") November 11, ISEKI & CO., LTD. Supplementary Information to Consolidated Financial Results (April 1, September 30, ) I. Consolidated business results for the six months ended September 30, (Billions of
November 11, ISEKI & CO., LTD. Supplementary Information to Consolidated Financial Results (April 1, September 30, ) I. Consolidated business results for the six months ended September 30, (Billions of
First Quarter of the Fiscal Year Ending December 31, 2015 Unicharm Presentation Materials for Investor Meeting
 First Quarter of the Fiscal Year Ending December 31, 2015 Unicharm Presentation Materials for Investor Meeting May 8, 2015 Takahisa Takahara President and CEO Unicharm Corporation Projections stated herein
The Korean Economy: Resilience amid Turbulence
 The Korean Economy: Resilience amid Turbulence Dr. Il SaKong Special Economic Advisor Adviser to the President Republic of Korea November 17, 17, 2008 November 17, 2008 1. Recent Macroeconomic Developments
Inflation Report. April June 2013
 April June 2013 August 7, 2013 1 Outline 1 External Conditions 2 Economic Activity in Mexico 3 Monetary Policy and Inflation Determinants Forecasts and Balance of Risks 2 External Conditions Global Environment
INVESTMENT MARKET UPDATE UBC FACULTY PENSION PLAN
 INVESTMENT MARKET UPDATE UBC FACULTY PENSION PLAN MIKE LESLIE, FACULTY PENSION PLAN NEIL WATSON, LEITH WHEELER FEBRUARY 12, 2014 Presenters Mike Leslie Executive Director, Investments Faculty Pension Plan
Financial Results of FY2014 Third Quarter
 Financial Results of FY2014 Third Quarter Mitsubishi Motors Corporation February 3, 2015 FY2014 Third Quarter Financial Results All-new Triton 1 FY2014 1-3Q Results Summary (vs. 1-3Q) Increased Year-on-year
Online International Activity of UK Local Authorities 2017
 Online International Activity of UK Local Authorities 2017 Text & Graphs Victor Chuah Editor Andrew Stevens A data analysis of the level of international activity carried out by local authorities since
PRESENTATION BY JACOB A. FRENKEL AT THE FORUM: INTELLIGENCE ON THE WORLD, EUROPE, AND ITALY. Villa d'este, Cernobbio - September 7, 8 and 9, 2012
 PRESENTATION BY JACOB A. FRENKEL AT THE FORUM: INTELLIGENCE ON THE WORLD, EUROPE, AND ITALY Villa d'este, Cernobbio - September 7, 8 and 9, 1 Working paper, September 1. Kindly authorized by the Author.
Progress Towards Strong, Sustainable, and Balanced Growth. Figure 1: Recovery From Financial Crisis (100 = First Quarter of Real GDP contraction)
") Progress Towards Strong, Sustainable, and Balanced Growth Figure 1: Recovery From Financial Crisis ( = First Quarter of Real GDP contraction) 13 125 196-26 AE Recessions' Range*** 196-26 AE Recessions**
Progress Towards Strong, Sustainable, and Balanced Growth Figure 1: Recovery From Financial Crisis ( = First Quarter of Real GDP contraction) 13 125 196-26 AE Recessions' Range*** 196-26 AE Recessions**
FY ending. 3Q of FY ended December 31, 2015 Restated basis *1. Year-on-year change (Restated basis) 3Q of FY ending
 3Q of FY ending") November 11, 2016 ISEKI & CO., LTD. Supplementary Information to Consolidated Financial Results (January 1, 2016 September 30, 2016) I. Consolidated business results for the nine months ended September
November 11, 2016 ISEKI & CO., LTD. Supplementary Information to Consolidated Financial Results (January 1, 2016 September 30, 2016) I. Consolidated business results for the nine months ended September
GLOBAL EMERGING MARKETS: IT IS THE STOCKS THAT MATTER ANWAAR WAGNER
 GLOBAL EMERGING MARKETS: IT IS THE STOCKS THAT MATTER ANWAAR WAGNER Portfolio Manager at Electus AGENDA Emerging Markets (EM) Crises? EM vs Developed Markets (DM) OM GEM Fund It s the shares that matter
Global Economic Prospects
 Global Economic Prospects Back from the Brink? Andrew Burns World Bank Prospects Group April 12, 212 1 Amid some signs of improvement, global recovery remains fragile First quarter of 212 has been generally
NASDAQ Global Index. More information about the Index can be found at
 NASDAQ Global Index The NASDAQ Global Index is a float adjusted market capitalization-weighted index designed to track the performance of global equities covering over 98% of the entire listed market capitalization
ABI MONTHLY REPORT 1 July 2018 (Main evidence)
") ABI MONTHLY REPORT 1 July 2018 (Main evidence) LOANS AND DEPOSITS 1. In June 2018, loans to customers granted by banks operating in Italy, totalling 1,773.8 billion euro (cf. Table 1) was 37 billion higher
ABI MONTHLY REPORT 1 July 2018 (Main evidence) LOANS AND DEPOSITS 1. In June 2018, loans to customers granted by banks operating in Italy, totalling 1,773.8 billion euro (cf. Table 1) was 37 billion higher
2014 Consumer Electronics
 2014 Consumer Electronics 2015.09. Catalog 1. China Consumer Electronics Industry Export Trend Analysis... 4 1.1. China Air Conditioner Export Trend Analysis, from Jan. to Dec. 2014...4 1.1.1. China Air
Financial & Business Highlights For the Year Ended June 30, 2017
 Financial & Business Highlights For the Year Ended June, 17 17 16 15 14 13 12 Profit and Loss Account Operating Revenue 858 590 648 415 172 174 Investment gains net 5 162 909 825 322 516 Other 262 146
Quarterly Meeting # 2/2015
 Quarterly Meeting # 2/2015 1Q15 Performance & Outlook 18 May 2015 The views expressed here contain some information derived from publicly available sources that have not been independently verified. No
Global House View: Market Outlook
 HSBC GLOBAL ASSET MANAGEMENT September 29 Global House View: Market Outlook Contents 1688/HSB1395a Market performance Macro-economic Picture Market Views: high level asset allocation Market Views: Equity
RECENT EVOLUTION AND OUTLOOK OF THE MEXICAN ECONOMY BANCO DE MÉXICO OCTOBER 2003
 OCTOBER 23 RECENT EVOLUTION AND OUTLOOK OF THE MEXICAN ECONOMY BANCO DE MÉXICO 2 RECENT DEVELOPMENTS OUTLOOK MEDIUM-TERM CHALLENGES 3 RECENT DEVELOPMENTS In tandem with the global economic cycle, the Mexican
APPENDIX: A SNAPSHOT OF INDONESIAN ECONOMIC INDICATORS
 APPENDIX: A SNAPSHOT OF INDONESIAN ECONOMIC INDICATORS Appendix Figure : Quarterly and annual GDP growth (percent growth) Appendix Figure : Contributions to GDP expenditures (quarter-on-quarter, seasonally
Travel Insurance and Assistance
 Travel Insurance and Assistance Worldwide research covering over 40 countries Series Prospectus Finaccord 1 Prospectus contents Page What is the research? Which countries are covered What methodology has
Consolidated Financial Results for FYE 2018
 Consolidated Financial Results for SUBARU CORPORATION Toshiaki Okada Corporate Executive Vice President & CFO May 11 th, 20180 0 Summary Consolidated Financial Results for Net sales and global unit sales
European Tax Free Consumption Fondazione Altagamma - October 17, Milan
 European Tax Free Consumption Fondazione Altagamma - October 17, Milan 10/25/2017 Agenda I. Europe & Top countries performance II. Tax Free key drivers in Europe III. Bain & Company Global Blue Analysis
Latin America: the shadow of China
 Latin America: the shadow of China Juan Ruiz BBVA Research Chief Economist for South America Latin America Outlook Second Quarter Madrid, 13 May Latin America Outlook / May Key messages 1 2 3 4 5 The global
TURKEY: RECENT DEVELOPMENTS January March 2018
 TURKEY: RECENT DEVELOPMENTS January March 218 3 81 4 698 961 7 34 7 96 9 66 8 98 1 931 1 6 11 2 11 88 11 19 1 883 1 97 12 48 12 112 Per capita GDP tripled while nominal GDP quadrupled in last 1 years 237
MULTI-ASSET CLASS 1 EQUITIES: DEVELOPED COUNTRIES 1 EQUITY EMERGING COUNTRIES 2
 10 2 3 6 8 9 13 14 MULTI-ASSET CLASS 1 EQUITIES: DEVELOPED COUNTRIES 1 EQUITY EMERGING COUNTRIES 2 Alpha Current Previous Alpha Current Previous Alpha Current Previous weight weight weight weight weight
EU Pigmeat Market Situation. Meat Market Observatory Economic Board meeting 02 October 2018
 EU Pigmeat Market Situation Meat Market Observatory Economic Board meeting 2 October 218 EXCHANGE RATE INDEX/EURO 14 Index of daily exchange rates of the main trading partners compared to the Euro 13 12
TURKEY: RECENT DEVELOPMENTS January June 2018
 TURKEY: RECENT DEVELOPMENTS January June 218 3 81 4 698 961 7 34 7 96 9 66 8 98 1 931 1 6 11 2 11 88 11 19 1 883 1 97 12 48 12 112 Per capita GDP tripled while nominal GDP quadrupled in last 1 years 237
Quarterly Economic Outlook: Quarter on 25 September 2018 Strong Economic Expansions amidst Uncertainty of Trade War
 Foregin Direct Investment (Billion USD) China U.S. Asia World Quarterly Economic Outlook: Quarter 3 2018 on 25 September 2018 Strong Economic Expansions amidst Uncertainty of Trade War Thai Economy: Thai
SPECIAL REPORT: U.S. ALUMINUM IMPORT MONITOR. March Issued: May 2018
 SPECIAL REPORT: U.S. ALUMINUM IMPORT MONITOR March 218 Issued: May 218 OVERVIEW OF SECTION 232 Section 232 of the Trade Expansion Act of 1962, as amended, authorizes the President to adjust the imports
Commodity Overview Bloomberg Commodity Index - 15 Year Performance to Mar 31, 2018
 March, 2018 Commodity Overview Bloomberg Commodity Index - 15 Year Performance to Mar 31, 2018 250 200 150 100 50 0 2003 2004 2005 2006 2007 2008 2009 2010 2011 2012 2013 2014 2015 2016 2017 2018 2 1/1/2003
Eurozone Economic Watch
 BBVA Research - Global Economic Watch December 2018 / 1 Eurozone Economic Watch December 2018 Eurozone GDP growth still slows gradually, but high uncertainty could take its toll GDP growth could grow by
A Global Economic and Market Outlook
 A Global Economic and Market Outlook Presented by Dr Chris Caton December 2008 US Housing starts and Permits 2.3 (Millions) Permits Starts 2.1 1.9 1.7 1.5 1.3 1.1 0.9 0.7 96 97 98 99 00 01 02 03 04 05
FISCAL YEAR MARCH 2019 THIRD QUARTER FINANCIAL RESULTS
 FISCAL YEAR MARCH 2019 THIRD QUARTER FINANCIAL RESULTS PRESENTATION OUTLINE Highlights Fiscal Year March 2019 Nine Month Results Fiscal Year March 2019 Full Year Forecast Progress of Key Initiatives 1
How Much, With Whom and What Does the US Trade? It is important to remember that trade includes both Goods and Services.
 How Much, With Whom and What Does the US Trade? It is important to remember that trade includes both Goods and Services. In 2016 1 : The US exported $1.5 trillion in Goods and $750 billion in Services
GLOBAL FIXED INCOME OVERVIEW
 2016 Global Market Outlook Press Briefing GLOBAL FIXED INCOME OVERVIEW Edward A. Wiese, CFA, Head of Fixed Income November 18, 2015 Global Fixed Income Outlook: Summary Environment Developed market yields
The Economic & Financial Outlook
 The Economic & Financial Outlook Beata Caranci SVP & Chief Economist TD Economics September 217 Key Themes Synchronized global economic acceleration has put monetary policy normalization in focus Canada
PRESS CONFERENCE 2 November 2012
 PRESS CONFERENCE 2 November 212 3Q 212 Fund s market value Quarterly numbers, 3 September 212. Billions of kroner 4 3 5 Asset class Value Percentage fund Equities 2 247 6.3% 3 723 4 3 5 3 Fixed Income
FY2017, FY2018, FY2019 Economic Outlook - Firm outlook on both domestic and overseas economic growth remains unchanged -
 REVISED to reflect the 2 nd QE for the Oct-Dec Qtr of 2017 FY2017, FY2018, FY2019 Economic Outlook - Firm outlook on both domestic and overseas economic growth remains unchanged - March 8, 2018 Copyright
Outlook for the Global Economy and Travel
 Outlook for the Global Economy and Travel Adam Sacks President Tourism Economics @adam_sacks November 2018 Let s pose some questions What s happening now? Outline What could go wrong? What s backwards?
Japan s Efforts to Encourage SMEs to Utilize EPAs
 2012/CTI/WKSP/007 Session 2 Japan s Efforts to Encourage SMEs to Utilize EPAs Submitted by: Japan Workshop on Increasing Free Trade Agreement Utilization by SMEs Tokyo, Japan 7 August 2012 Japan s efforts
Second estimate for the third quarter of 2008 EU27 current account deficit 39.5 bn euro 19.3 bn euro surplus on trade in services
 STAT/09/12 22 January 2009 Second estimate for the third quarter of 20 EU27 current account deficit 39.5 bn euro 19.3 bn euro surplus on trade in According to the latest revisions1, the EU272 external
SPECIAL REPORT: U.S. ALUMINUM IMPORT MONITOR. Data through May Issued: July 2018
 SPECIAL REPORT: U.S. ALUMINUM IMPORT MONITOR Data through May 218 Issued: July 218 OVERVIEW OF SECTION 232 Section 232 of the Trade Expansion Act of 1962, as amended, authorizes the President to adjust
North American Steel Industry Recent Market Developments, Future Prospects and Key Challenges
 North American Steel Industry Recent Market Developments, Future Prospects and Key Challenges OECD Steel Committee December 1-11, 29 Paris, France * American Iron and Steel Institute (AISI) Steel Manufacturers
APPENDIX ECONOMIC INDICATORS DEVELOPED ECONOMIES
 16 QUARTERLY INVESTMENT STRATEGY APPENDIX ECONOMIC INDICATORS DEVELOPED ECONOMIES Purchasing Managers Index EMERGING ECONOMIES Purchasing Managers Index US Eurozone Japan Brazil Russia India China Industrial
ABI MONTHLY REPORT 1 January 2017 (Main evidence)
") ABI MONTHLY REPORT 1 January 2017 (Main evidence) LOANS AND DEPOSITS 1. At the end of 2016, loans to customers granted by banks operating in Italy, totalling 1,807.7 billion euro (cf. Table 1) was nearly
ABI MONTHLY REPORT 1 January 2017 (Main evidence) LOANS AND DEPOSITS 1. At the end of 2016, loans to customers granted by banks operating in Italy, totalling 1,807.7 billion euro (cf. Table 1) was nearly
2015 Market Review & Outlook. January 29, 2015
 2015 Market Review & Outlook January 29, 2015 Economic Outlook Jason O. Jackman, CFA President & Chief Investment Officer Percentage Interest Rates Unexpectedly Decline 4.5 10-Year Government Yield 4 3.5
Mexico: Dealing with international financial uncertainty. Manuel Sánchez
 Manuel Sánchez United States Mexico Chamber of Commerce, Chicago, IL, August 6, 2015 Contents 1 Moderate economic growth 2 Waiting for the liftoff 3 Taming inflation 2 Since 2014, Mexico s economic recovery
April Domestic Exports Imports. Volume Tonnes SW. MAT Apr-16 4, ,332 33, , % Change 2.8% 4.3% 12.6% 5.9% 2.9% 4.
 April 2017 Overview Table 1.1 Overview trends for Domestic, Export and Import trade Domestic Exports Imports Month Slaughter Pigmeat (Tonnes) Volume Tonnes SW Value $AUD (Million) Volume Tonnes SW Value
NASDAQ-100. More information about the Index can be found at
 NASDAQ-100 The NASDAQ-100 Index includes 100 of the largest domestic and international non-financial companies listed on The NASDAQ Stock Market based on market capitalization. The Index reflects companies