Technology for shaping everyday materials. Milan March 2011
|
|
|
- Ashlynn Lee
- 5 years ago
- Views:
Transcription

1 Technology for shaping everyday materials Milan March 2011
2 Group business structure wood glass & stone mechatronic service tooling 1 1
3 summary: sales breakdown & orders trend main business divisions market shares (wood-glass&stone -mechatronic) ongoing projects by business area 2010 consolidated results consolidated financials (three years plan) 2 2
4 Group turnover breakdown December 2010 China 4.7% 8,7% 16,7% 9,3% 15,6% countries 18,5% 31,2% Italy Western E. Eastern E. U.S.A. - Canada Asia Pacific Rest of the W. 16,6% 2,3% 5,8% 15,8% business division w ood glass & stone mechatronic 59,5% tooling service 20.0% end-users housing 16.6% type machines 10.0% 55.0% office store fixture 11.0% systems 15.0% frames 72.4% spare parts & billable services
5 Group orders intake & backlog quarterly trend /mln 140,0 130,0 120,0 110,0 100,0 90,0 orders intakes: FY2010 ags FY2009: +35% orders intake 2 months 2011: +24% ags % ags % ags 2008 backlog February 2011: 92.8 mln 80,0 70,0 60,0 50,0 40,0 30,0 20, IQ 2008 IIQ 2008 IIIQ 2008 IVQ 2009 IQ 2009 IIQ 2009 IIIQ 2009 IVQ 2010 IQ 2010 IIQ 2010 IIIQ 2010 IVQ orders intake backlog 4
6 wood woodworking machines market consensus CAGR 6.6% % company evaluation of the world 2010 market shares entire secondary phase dimension 3.7 bln secondary phase dimension where Biesse is insisting 1.8 bln today TOP tomorrow TOP rest of the Market same product segment HOMAG same product segment SCM same product segment BIESSE MEDIUM LOW MEDIUM LOW 5
7 glass (internal glass market) Italian Association: GIMAV % Basically an italian manufactuging market Only 2 companies have market shares over 10% Biesse S.p.A. (Intermac brand) and Bavelloni (Glaston Group- Finland) are the only listed companies rest of the market BOTTERO BAVELLONI BIESSE 205,000,000. Value of reference markets (company evaluation)
8 stone Italian Association: Marmomacchine % Biesse clear worldwide market leader Only 1 company (Biesse) has market shares over 10% Biesse S.p.A. (Intermac brand) and Bavelloni (Glaston Co.) are the only listed companies rest of the market BOTTERO BAVELLONI BIESSE 46,000,000. Value of reference markets (company evaluation)

9 wood: main business projects R & D increase new products development time to market reduction windows & doors sales increase organic growth product & production supply chain costs reduction widening of the systems activities distribution & sales network improvement 8

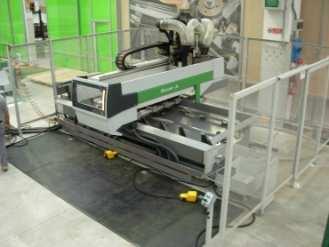
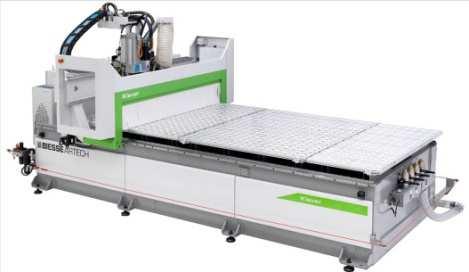
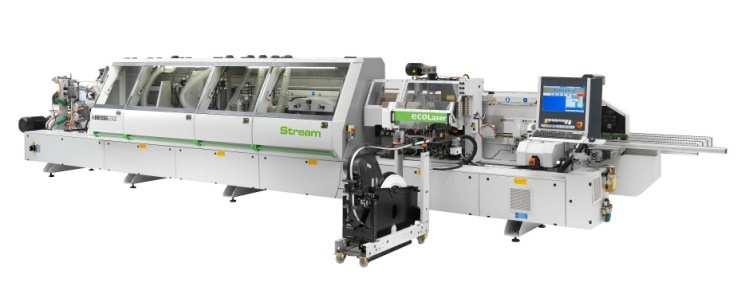
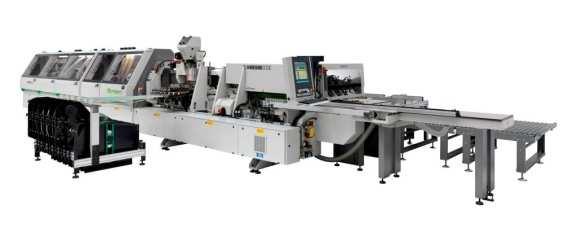
10 wood: new products development new products and gamma fulfilment 9
 strengthness of the systems brand perception (key customers references) dedicated systems service")
11 wood: widening of systems activities market coverage improvement (China, Germany, Poland, Russia,Turkey and Italy) strengthness of the systems brand perception (key customers references) dedicated systems service development 10


12 wood: windows and doors frames new product specialist fully focused on the frames sector increase of internal & external resources to support the sales trend 11
13 wood: distribution and sales network improvement establish a strong presence in major and growing markets (China-Poland-Turkey-Middle East) strengthen the commercial organization and competences through skill allocation & training 12

14 wood: product/production supply chain cost reductions India: transportation, assembly and components purchase costs reduction Italy: layout & wharehouse optimization product engineering cost reduction KAIZEN STRATEGY ORGANIZATION PROCESS PRODUCT BPR 13
15 wood: time to market reduction 12 months launch time for new products structural reaorganization of the engineering, prototipe and pre-serie process concept business plan progettazione prototipazione pre-serie = 12 months 14
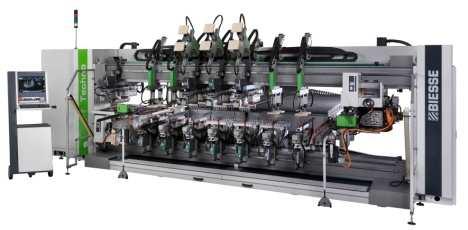
16 wood: R & D increase innovation - technology: B-Cubed line innovation manager & engineers external cooperation (research centres) own and purchased patents 15

17 glass & stone: main business projects products gamma fulfilment organic growth distribution & sales network improvement new products 16


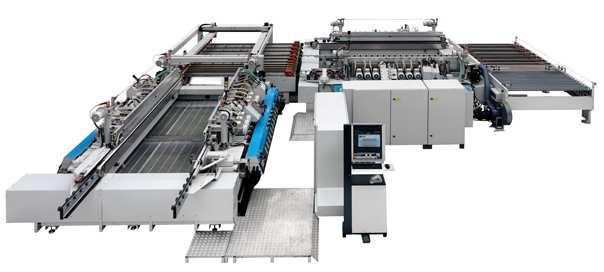
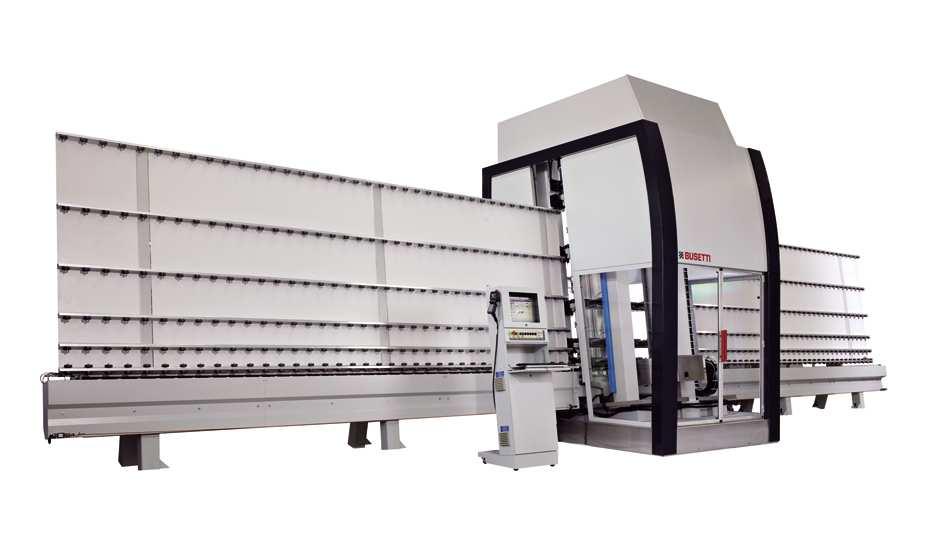
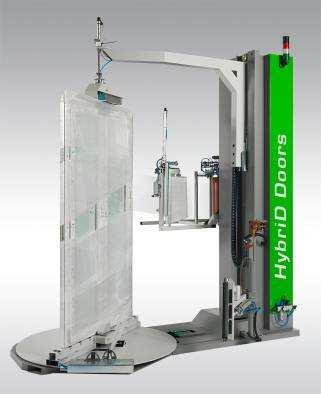
18 glass & stone: new products and gamma fulfilment 17

19 glass & stone: distribution and sales network improvement establish a strong presence in major and growing markets strengthen the commercial organization and competences through skill allocation & training especially using the Biesse Group Subsidiaries 18

20 mechatronic: main business projects distribution and sales network improvement organic growth new products development product & production supply chain cost reduction 19


21 mechatronic: new products development Product Category Electrical spindles Square holes Glass Metal working 20
22 mechatronic: distribution and sales network improvement establish a strong presence in major and mature markets strengthen the commercial organization and competences through skill allocation & training especially 21


23 mechatronic: products/production/supply chain cost reductions purchase costs reduction Kaizen effects processes optimization engineering costs reduction STRATEGY ORGANIZATION KAIZEN PROCESS PRODUCT BPR 22

24 service & tooling: business projects new internal organization efficiensies improvement supply chain & logistic strengthness organic growth dedicated marketing strategy products range development sales network improvement & new potential end markets 23
25 service: new internal organization efficiences improvement with a special focus on spare parts and post-sales services logistic and inventories management structural optimization High rotation Parts Slow Moving Parts Critical Slow Moving Parts 1. Integrated Logistics a. New Subsidiary Parts Planning strategy b. 100% parts fully-managed from headquarters c. Integrated and reinforced Parts Technical Support d. BiessEparts direct to the Customer 2. Service Level improvement Headquarters a. Headquarters Warehouse - Late Pick-up (+ 5% Global Service Level & + 10% Global same day shipment) - internal mechanical area (dedicated to parts needs, 1-2% increase in machine down service level) b. WorldWide Service Level measuring system c. Global & Local Service Level measurement (Area by Area) Parts Hub High rotation Parts Critical Slow Moving Parts Subsidiary High rotation Parts 24

26 service: 24h time & knowledge management 24 hours world-wide key customer support shared web portal with knowledge informations concerning problems solutions Charlotte 9-20 Pesaro 7-19 Bangalore

27 service: dedicated marketing strategy market analysis & shares create a service dedicated image improving the Biesse customers perception 26
28 tooling: sales network improvement & potential new markets new and more focused sales network composed by dealers and agents development of photovoltaic & solar potential end market increase of automotive glass sales expectations development of the Latin America (trade) Asia&Middle East (Subsidiaries) 27


 new")
 new dedicated product")
 28")
29 tooling: products range development high speed wheels for cnc product range (glass) new double edger and straight machines (glass) new dedicated product range for automotive glass high speed routers for engineered stone (stone) new rubber polishing wheels (stone) new dedicated product range for polisher (stone) new dedicated product range for bridge saw (stone) 28
30 2010 consolidated results: consolidated sales P & L details EBITDA bridge cashflow & net debt net operating working capital 29 29
31 Group P&L details: December 2010 /mln Net Sales FY h FY % 2010 vs Value Added % of net sales % % % +39 Labour cost % of net sales % % % EBITDA % of net sales % % % EBIT % of net sales % % % Net result % of net sales % % %
32 Group EBITDA bridge: /mln EBITDA delta sales delta in inventories delta COGS delta personnel cost delta operating expenses & non recurring items 15.7 EBITDA
33 Group Cashflow Net Financial Position /mln vs 2009 Gross Cashflow Net Capex % of net sales (tangible & intangible) % % +2.0 Free Cashflow % of net sales % % N.F.P. % of net sales % % gearing
34 Group Net Operating Working Capital /mln Inventories % on net sales % % DSI Trade receivables % on net sales 162 gg % 172 gg % DSO Trade payables % on net sales 88 gg % 82 gg % DPO 113 gg 128 gg N.O.W.C. % on net sales % % 33
35 three years plan : consolidated sales P & L details EBITDA & EBIT evolution cashflow & net debt ratios - equity informations 34 34
36 Group consolidated revenues /mln three years plan ,0 454,3 456, , ,6 327,5 348, , e 2012e 2013e net sales CAGR : 11.7% 35
37 Group P&L details /mln three years plan Net Sales FY h FY 2010 FY 2011e FY 2012e FY 2013e % % % % 2010 vs Value Added % of net sales % % % % % % Labour cost % of net sales % % % % % % EBITDA % of net sales % % % % % % EBIT % of net sales % % % % % % Net result % of net sales % % % % % %
38 Group Value Added evolution /MIL 240,0 36,9% 37,7% 39,4% 41,0% 42,7% 45,0% 190,0 32,3% 35,0% 31,7% 140,0 25,0% 21,5% 90,0 15,0% 40,0 5,0% -10, e 2012e 2013e -5,0% Value Added Value Added margin 37
39 Group Labour cost evolution /MIL 40,0% 190,0 34,6% 32,9% 33,4% 30,4% 140,0 29,1% 28,5% 30,0% 24,4% 22,6% 90,0 20,0% 40,0 10,0% -10, e 2012e 2013e 0,0% Labour cost Labour cost on sales 38
40 Group EBITDA evolution /MIL 90,0 17,0% 18,0% 80,0 14,2% 70,0 12,5% 13,0% 60,0 10,6% 50,0 40,0 5,9% 8,0% 30,0 4,8% 3,0% 2,6% 20,0 10,0-2,0% 0,0-3,1% e 2012e 2013e -10,0 EBITDA EBITDA margin -7,0% 39
41 Group EBIT evolution /MIL 70 14,0% 15,0% 60 7,7% 10,1% 10,0% 50 6,0% 5,0% 40 1,4% 0,0% 0,0% 30-1,9% -5,0% ,0% -12,3% e 2012e 2013e -15,0% EBIT EBIT margin 40
42 Group EBITDA bridge: e /mln EBITDA EBITDA 2013e delta sales delta COGS delta personnel cost delta operating expenses 41
43 Group Cashflow Net Financial Position /mln three years plan e 2012e 2013e Gross Cashflow Net Capex % of net sales (tangible & intangible) % % % % Free Cashflow % of net sales % % % % N.F.P. % of net sales % % % % 42
44 Group Net Operating Working Capital /mln three years plan e 2012e 2013e Inventories % on net sales % % % % Trade receivables % on net sales % % % % Trade payables % on net sales % % % % N.O.W.C. % on net sales % % % % 43
45 Group net financial position evolution: e 30 three years plan e 2013e e
46 Group net debt against EBITDA: e 4,0 80,0 3,0 60,0 2,0 40,0 20,0 1,0 0, e 2012e 2013e 0,0-20,0-1,0-40,0 net debt EBITDA debt/ebitda -2,0 45
47 Group financial situation: headroom for investments opportunities solid working capital management cash generation credit lines 46
48 Group ratios: e 35,0% 25,0% three years plan 15,0% 5,0% -5,0% e 2012e 2013e -15,0% -25,0% -35,0% r.o.c.e. r.o.e. e.v.a. spread 47


49 shareholders breakdown > 2% treasury shares: 1.78% % 7.1 Bi.Fin s.r.l (Selci family) free float* FCP Echiquier Agenor Pictet - CIE Banquiers 58.5 * Including treasury shares - 48
50 shareholders breakdown by type 12.4 retail 58.5 % 29.1 institutionals Selci family 49
51 shareholders breakdown by country % 74.2* * Including Bi.Fin shares - Italy UE rest of the world France U.K. Luxembourg-the Netherlands Switzerland U.S.A. Norway 50
52 disclaimer This presentation has been prepared by Biesse S.p.A. for information purposes only and for use in presentations of the Group s results and strategies. For further details on the Biesse S.p.A.. reference should be made to publicly available information. including the Quarterly Reports, the Annual Reports and the Three Years Business Plan. Statements contained in this presentation, particularly the ones regarding any Biesse S.p.A. possible or assumed future performance, (business plan) are or may be forward looking statements and in this respect they involve some risks and uncertainties. Any reference to past performance of the Biesse S.p.A. shall not be taken as an indication of future performance. This document does not constitute an offer or invitation to purchase or subscribe for any shares and no part of it shall form the basis of or be relied upon in connection with any contract or commitment whatsoever. By attending the presentation you agree to be bound by the foregoing terms.

53 Alberto Amurri Group Financial Manager & Head of Investor Relations Dept. Via della Meccanica Pesaro ITALY Tel: / Mob: alberto.amurri@biesse.com
Technologies for shaping everyday life
 Technologies for shaping everyday life DO EARLY BIRDS CATCH THE WORMS? Milan, July 15th Banca Akros 1 disclaimer This presentation has been prepared by Biesse S.p.A. for information purposes only and for
Technologies for shaping everyday life
 Technologies for shaping everyday life March 2008 disclaimer This presentation has been prepared by Biesse S.p.A. for information purposes only and for use in presentations of the Group s results and strategies.
Technologies for shaping everyday life
 Technologies for shaping everyday life Italian Small Caps Investor Day London STAR Conference 7-8 October 2009 1 disclaimer This presentation has been prepared by Biesse S.p.A. for information purposes
30 June approves the Interim Financial Report for the six month period to. June IH
 approves the Interim Financial Report for the six month period to 30 June 2016 Compared to the same period of 2015: revenues, net profit and order intake all increase order backlog at a record high net
30 September Biesse: approves quarterly report to. Order intake - backlog - revenues: profitability: net profit: net financial position:
 Biesse: approves quarterly report to 30 September 2017 highlights 9 months 2017: Order intake - backlog - revenues: o order intake (machineries) +16.8% compared to September 2016 o backlog +26.1% compared
BIESSE GROUP. Approves preliminary Consolidated Financial Statements 2013 CONSOLIDATED INCOME STATEMENT. Net revenues
 BIESSE GROUP Approves preliminary Consolidated Financial Statements 2013 CONSOLIDATED INCOME STATEMENT (Euro millions) 2013 2012 Net revenues 378.4 383.1 Gross operating margin (ebitda)* 34.3 22.6 Operating
QUARTERLY REPORT JUNE 30 TH, 2007
 QUARTERLY REPORT JUNE 30 TH, 2007 BIESSE S.p.A. QUARTERLY REPORT AT JUNE 30 TH, 2007 SUMMARY Group structure page 3 Explanatory Notes page 4 Parent company corporate bodies page 5 Highlights page 6 General
Approval of Preliminary Financial Statements
 Approval of Preliminary Financial Statements 2017 Figures in Euro millions 2017 2016 delta Net Revenues 690.1 618.5 +11.6% Gross Operating Margin (EBITDA)* 89.5 75.8 +17.9% Operating Result (EBIT)* 66.9
QUARTERLY REPORT DECEMBER 31 ST, 2004
 QUARTERLY REPORT DECEMBER 31 ST, 2004 BIESSE S.p.A. QUARTERLY REPORT AT DECEMBER 31 ST, 2004 SUMMARY Group structure page 3 Parent company corporate bodies page 5 Highlights page 6 Accounting statements
QUARTERLY REPORT SEPTEMBER 30 TH, 2004
 QUARTERLY REPORT SEPTEMBER 30 TH, 2004 1 BIESSE S.p.A. QUARTERLY REPORT AT SEPTEMBER 30 TH, 2004 SUMMARY Group structure page 3 Parent company corporate bodies page 5 Highlights page 6 Accounting statements
QUARTERLY REPORT MARCH 31 ST, 2004
 QUARTERLY REPORT MARCH 31 ST, 2004 BIESSE S.p.A. QUARTERLY REPORT AT MARCH 31 ST, 2004 SUMMARY Group structure page 3 Parent company corporate bodies page 5 Highlights page 6 Accounting statements page
9M 2016 RESULTS NICE PRESENTATION. November 2016, 11 th
 NICE PRESENTATION November 2016, 11 th 1 FINANCIAL OVERVIEW 2 Consolidated Sales: 230.0m (+7.3% vs. 9M 2015) Gross margin: 53.1% (vs. 54.9% in 9M 2015) EBITDA margin: 15.0% (vs. 15.8% in 9M 2015) HIGHLIGHTS
H results. 25 st September 2018
 H1 2018 results 25 st September 2018 2018 financial highlights: strong first half Consolidated sales (1) : 152,8 m (+14,9% vs. H1 17; +16,6% on a constant FX basis) Order backlog as of 30 June 2018: 42,5
1H 2016 RESULTS NICE PRESENTATION. August 2016, 5 TH
 NICE PRESENTATION August 2016, 5 TH 1 FINANCIAL OVERVIEW 2 Consolidated Sales: 150.2m (+5.3% vs. 1H 2015) Gross margin: 53.7% (vs. 55.1% in 1H 2015) EBITDA margin: 15.0% (vs. 14.7% in 1H 2015) HIGHLIGHTS
STAR Conference. 6 th October 2016, London
 STAR Conference 6 th October 2016, London Elica Corporation N#1 PLAYER WORLDWIDE IN HOODS 13% MARKET SHARE 2015 TURNOVER 421.6 M 8 INDUSTRIAL PLANTS WORLDWIDE 2 19 Mln Hoods + Motors Cooking Net Sales:
1H15 Results Presentation. July 30, 2015
 1H15 Results Presentation July 30, 2015 1H15 Key facts Sales: Euro 426.9 million +6.7% (+4.0% constant FX) Directly Operated Stores Same Store Sales: +6.4% (2Q15 +7.9%) EBITDA: Euro 26.6 million +28.3%
LU-VE incontra la comunità finanziaria. 24 ottobre 2016
 LU-VE incontra la comunità finanziaria 24 ottobre 2016 Disclaimer This presentation has been prepared by LU-VE S.p.A. for information purposes only and for use in presentations of the Group s results and
1Q 14 Results. May 12 th, 2014
 Results May 12 th, 2014 First Quarter 2014 - Highlights Results in line with the Group s sustainable approach, gracious growth and healthy profitability, thus laying the foundations for long-term development
FUCHS PETROLUB AG The leading independent lubricants manufacturer of the world
 The leading independent lubricants manufacturer of the world Dr. Alexander Selent, Vice Chairman & CFO Dagmar Steinert, Head of Investor Relations April 2013 FUCHS the leading independent lubricants manufacturer
FY 2017 results. 26 st March 2018
 FY 2017 results 26 st March 2018 CONTENTS 1. Financial highlights 2. Net sales breakdown 3. Profit & loss 4. Net working capital 5. Net cash flow 6. Balance sheet 7. Future developments 8. Group structure
Financial Results Investor Presentation
 26.3.2013 2012 Financial Results Investor Presentation SAFE HARBOR STATEMENT Certain statements in this slide show, including those addressing the Company s beliefs, f, plans, objectives, estimates or
2014 Results Conference Call. 9 th March, 2015
 2014 Results Conference Call 9 th March, 2015 Agenda 2014 Results Outlook 2 2014 Results 3 2014 Key Factors FOCUS ON CLIENT Anticipate clients needs offering new products to improve their efficiency and
First Half 2011 Conference Call
 Moving ahead First Half 2011 Conference Call 29 th July, 2011 Copyright Datalogic 2007-2011 DISCLAIMER This document has been prepared by Datalogic S.p.A. (the "Company") for use during meetings with investors
FY 2018 FINANCIAL RESULTS
 FY FINANCIAL RESULTS Full Year LRG shows strong performance improvement compared to, with results in line with outlook FY Revenue (M ) Adjusted Ebitda (M ) Ebit (M ) NPF (M ) 184,2 38,9 206,3 39,2 +20,9
title 9 Months 2012 title Conference Call 12 th November 2012 date
 title 9 Months 2012 title Conference Call 12 th November 2012 date DISCLAIMER This document has been prepared by Datalogic S.p.A. (the "Company") for use during meetings with investors and financial analysts
Ordinary and Extraordinary Meeting of Biesse S.p.A. Shareholders
 Ordinary and Extraordinary Meeting of Biesse S.p.A. Shareholders Resolutions: Ordinary session Approval of the Financial Statements to 31 December 2014 Approval of payment of an ordinary dividend of Euro
Star Conference 2014 London
 Star Conference 2014 London 2 AGENDA 1. Company Overview 2. Market Development & Strategic Direction 3. Financial 3 Elica Group Founded in 1970 Today N#1 Player Worldwide in Hoods Market Leader 2013 Turnover
KION UPDATE CALL Q Gordon Riske, CEO Thomas Toepfer, CFO Wiesbaden, 7 May 2015
 KION UPDATE CALL 2015 Gordon Riske, CEO Thomas Toepfer, CFO Wiesbaden, 7 May 2015 AGENDA 1 Highlights Gordon Riske 2 Market update Gordon Riske 3 Financial update Thomas Toepfer 4 Outlook Gordon Riske
PIAGGIO GROUP ANALYST AND INVESTOR MEETING
 PIAGGIO GROUP ANALYST AND INVESTOR MEETING Milan, December 14 th 2011 Disclaimer This presentation contains forward-looking statements regarding future events and future results of Piaggio & C S.p.A (the
The contents of this document must be taken into account by all individuals or entities that may have to make decisions or draw up or
 Corporate Presentation September 2018 Disclaimer This document has been prepared by NATURHOUSE HEALTH S.A. ( NATURHOUSE or the Company ) for its exclusive use during the presentations to investors. NATURHOUSE
9M 2014 Results Presentation November 13, 2014
 9M 2014 Results Presentation November 13, 2014 9M 2014 key facts Sales: Euro 668.4 million +8.1% (+8.8% constant FX) Directly Operated Stores Same Store Sales: +9.4% (vs -5.7% in 9M 13) EBITDA: Euro 46.3
Portucel S.A. Assembleia Geral 21 de Maio de Results Presentation
 Portucel S.A. Assembleia Geral 21 de Maio de 2013 2015 Results Presentation Disclaimer This presentation does not constitute or form part of and should not be construed as any offer or invitation to sell
FY2017 FILA Group Results
 FY2017 FILA Group Results Disclaimer This document has been prepared by F.I.L.A. S.p.A. ( F.I.L.A. or the Company ), for information purposes only, exclusively with the aim of assisting you to understand
1H 2007 CONSOLIDATED RESULTS. September 11, 2007
 1H 2007 CONSOLIDATED RESULTS September 11, 2007 1 THIS DOCUMENT MAY NOT BE DISTRIBUTED, PUBLISHED OR REPRODUCED IN WHOLE OR IN PART OR DISCLOSED BY RECIPIENTS TO ANY OTHER PERSON. NEITHER THIS DOCUMENT
NATUZZI: 2013 DEDICATED TO LAYING THE FOUNDATIONS FOR RESTRUCTURING
 FOR IMMEDIATE RELEASE FULL YEAR 2013 CONSOLIDATED FINANCIAL RESULTS NATUZZI: 2013 DEDICATED TO LAYING THE FOUNDATIONS FOR RESTRUCTURING TOTAL UPHOLSTERY NET SALES AT 402.8 MILLION IN 2013 (+0.3% IN TERMS
Deceuninck doubles 2013 net profit to 8.4m Sales volumes stable, but offset by currencies and mix
 Regulated information results Under embargo until Tuesday 18 February 2014 at 7:00 a.m. CET Deceuninck doubles net profit to 8.4m Sales volumes stable, but offset by currencies and mix Sales decrease 3.7%
The world s leading infrastructure developer. April 2012
 The world s leading infrastructure developer Investors Presentation Company profile, strategy and key financials April 2012 Grupo ACS The world s leading infrastructure developer Engineering contractor
Press Release December 15, 2017
 ISRA VISION AG: 2016 / 2017 financial year Revenues and EBT +11 %, cash flow significantly stronger ISRA again matches full year guidance: Heading for the next revenue level with double-digit growth rates
FY 2014 Results Presentation March 5, 2015
 FY 2014 Results Presentation March 5, 2015 FY 2014 key facts Sales: Euro 824.2 million +9.3% (+10.1% constant FX) Directly Operated Stores Same Store Sales: +7.9% (vs -3.0% in FY 13) EBITDA: Euro 42.6
I QUARTER Consolidated Financial Statements PRESS RELEASE CONSOLIDATED FINANCIAL STATEMENTS
 I QUARTER 2005 Consolidated Financial Statements PRESS RELEASE CONSOLIDATED FINANCIAL STATEMENTS Luxottica Group Net Sales for First Quarter 2005 Up Year-Over-Year by 34.8 percent Milan, Italy April 28,
2017FY - Results presentation. March 21, 2018
 2017FY - Results presentation March 21, 2018 Disclaimer This presentation has been prepared by SIT S.p.A. only for information purposes and for the presentation of the Group s results and strategies. For
LA DORIA announces 2014 preliminary consolidated results and Three-Year Plan.
 PRESS RELEASE LA DORIA announces 2014 preliminary consolidated results and 2015-2017 Three-Year Plan. 2014 Preliminary consolidated results Following on from two very strong years, in 2014 the Group again
EVRY ASA Q PRESENTATION CEO BJÖRN IVROTH CFO HENRIK SCHIBLER
 1 EVRY ASA Q3 2018 PRESENTATION CEO BJÖRN IVROTH CFO HENRIK SCHIBLER Agenda Group highlights Business update Financial highlights Business area performance Concluding remarks Q&A 2 Group highlights Q3
Consolidated revenues: million Euros, EBITDA: million Euros, EBIT: million Euros, Net income: 83.4 million Euros
 Milan March 24 th, 2009 TOD S S.p.A Outstanding growth for Tod s Group s: revenues: +7.7%, net income: + 7.9%. Dividend unchanged at 1.25 Euro per share The Board of Directors approved the 2008 Annual
The contents of this document must be taken into account by all individuals or entities that may have to make decisions or draw up or
 Corporate Presentation April 2018 Disclaimer This document has been prepared by NATURHOUSE HEALTH S.A. ( NATURHOUSE or the Company ) for its exclusive use during the presentations to investors. NATURHOUSE
Sandvik. Good progress towards a more efficient Sandvik. Interim report on fourth quarter Sandvik fourth quarter 2013
 Good progress towards a more efficient 1 fourth quarter 2013 Full-year highlights Strategy execution Supply Chain optimization initiative launched Continued strong progress at Materials Technology Significant
London STAR Conference
 London STAR Conference London Stock Exchange - October 10 th, 2017 Prima Group at a glance Founded in 1977, Prima Industrie is a global leader in high technology laser and sheet metal processing systems
FY2013 Results Presentation. 19 March 2014
 FY2013 Results Presentation 19 March 2014 Disclaimer This document is of a purely informative nature and does not constitute an offer to sell, exchange or buy, or the solicitation of an offer to buy, securities
Bilfinger Berger: Entering new growth phase
 Bilfinger Berger: Entering new growth phase Roadshow London, Roland Koch, CEO Andreas Müller, Head of Corporate Accounting and Investor Relations Agenda 1. Bilfinger Berger Overview 2. Preliminary figures
Financial Results CONFERENCE CALL Third Quarter Results. Cesena 14 th November2014. Ended 30 th September 2014
 Financial Results 2014 Third Quarter Results Ended 30 th September 2014 CONFERENCE CALL Cesena 14 th November2014 1. TREVI Group 2. 9M 2014 Financial Results 3. Q&A 4. Appendix Rome (ITALY) Metro Line
Linde Group. January - March 2006 Conference Call. April 26, Dr Peter Diesch, CFO
 January - March 2006 Conference Call April 26, 2006 Dr Peter Diesch, CFO Contents 04 Linde Group 09 Gas & Engineering 11 Linde Gas 19 Linde Engineering 22 Material Handling 2 Disclaimer This investor presentation
Luxottica Group Net Sales for First Quarter 2005 Up Year-Over-Year by 34.8 percent
 Luxottica Group Net Sales for First Quarter 2005 Up Year-Over-Year by 34.8 percent Milan, Italy April 28, 2005 - Luxottica Group S.p.A. (NYSE: LUX; MTA: LUX), global leader in the eyewear sector, today
FY 2012 Results. March 12 th, 2013
 FY 2012 Results March 12 th, 2013 Fiscal Year 2012 Results Highlights FY 2012 results showing top line growth and profitability increase*, in line with company expectations Net Revenues up 15.1% to 279.3mln
Press Release May 31, 2017
 ISRA VISION AG: 1st half year 2016 / 2017 A further step to 150 +: Revenues and EBT each grow by +11% Double-digit growth in the first six months ISRA continues growth path with high order backlog Revenues
German Investment Seminar
 German Investment Seminar Dr Eckhard Cordes, CEO New York, 13 January 2010 Disclaimer This presentation contains forward-looking statements which are based on certain expectations and assumptions at the
Analysts Conference Full Year Results 2004 Frankfurt, March 22, pm
 Analysts Conference Full Year Results 2004 Frankfurt, March 22, 2005 3.00pm Page 4 Page 17 Page 32 Presentation of Dr Wolfgang Reitzle President & CEO, Linde AG Presentation of Dr Peter Diesch CFO, Linde
SALES IN LINE WITH LAST YEAR THANKS TO THE POSITIVE
 PRESS RELEASE - FIRST HALF 2017 RESULTS SALES IN LINE WITH LAST YEAR THANKS TO THE POSITIVE PERFORMANCE OF THE WHOLESALE CHANNEL, UP 6.7% AND ECOMMERCE UP MORE THAN 30% Biadene di Montebelluna, July 28,
Financial Results. Full Year March 2017
 Financial Results Full Year 2016 March 2017 Disclaimer This presentation is being furnished to you solely for your information and may not be reproduced or redistributed to any other person. This presentation
January March 2010 Conference Call. Georg Denoke Member of the Executive Board & CFO 4 May 2010
 January March 2010 Conference Call Georg Denoke Member of the Executive Board & CFO 4 May 2010 Disclaimer This presentation contains forward-looking statements about Linde AG ( Linde ) and their respective
Breakdown of Consolidated Sales by Brand: significant growth rates for all the brands. million Euros Q Q % change FY 2006
 Milan May 14 th, 2007 TOD S S.p.A.: revenues and profits continue to grow The Board of Directors approved Tod s Group Q1 2007 results. Q1 2007 Group s revenues: 177,7 million Euros, increasing by 10% versus
FY MARCH 2011 TELECONFERENCE PRESENTATION
 FY 2010 TELECONFERENCE PRESENTATION 15 MARCH 2011 1 4 APRIL 2011 DISCLAIMER This presentation contains forward-looking statements that reflect PANDORA s expectations with respect to certain future events
Star Conference 2018, Milan March 27-28, 2018
 Star Conference 2018, Milan March 27-28, 2018 Emak at a glance Outdoor Power Equipment Emak Group is a global player in three business segments Pumps & High Pressure Water Jetting Components & Accessories
1 st quarter 2015 results
 1 st quarter 2015 results continued improvement Jacques van den Broek, CEO Robert Jan van de Kraats, CFO Randstad Holding nv disclaimer & definitions Certain statements in this document concern prognoses
PRESS RELEASE. De'Longhi S.p.A. The Shareholders Annual General Meeting, held today in ordinary session:
 PRESS RELEASE De'Longhi S.p.A. The Shareholders Annual General Meeting, held today in ordinary session: (i) approved the consolidated 2017 results, confirming the data approved by the Board of Directors
PRESS RELEASE. De'Longhi S.p.A.
 PRESS RELEASE De'Longhi S.p.A. The Board of Directors has approved today the consolidated results of the first nine months of 2017: growth was accelerating, supported by United States, China and East Europe:
H Financial Results
 Milan August 1 st, 2013 1 AGENDA H1 2013 Highlights & FY 2013 Outlook Financial Results Appendix 2 H1 2013 Key Financials Euro Millions, % on Sales Sales Adjusted EBITDA (3) Adjusted EBIT (4) -1.8% * 7,973
L OCCITANE EN PROVENCE EN PROVENCE. Final results. for the year ended 31 March 2011
 Final results for the year ended 31 March 2011 Agenda Results Highlights Strategic Review and Future Prospects 2 1. Results Highlights (million ) Net sales Operating profit Net profit 900 800 +26.1%, +
Imerys and S&B: A strategic combination
 Accelerating development, strengthening core business, creating value Gilles MICHEL - Chairman & CEO Michel DELVILLE - CFO Disclaimer More comprehensive information about Imerys may be obtained on its
Presentation of FY 2017 Results. February 26 th, 2018
 Presentation of FY 2017 Results February 26 th, 2018 Gestamp 2018 Disclaimer This presentation has been prepared solely for use at this presentation of our results as of and for the quarter ended December
Company Presentation. Star Conference London. October 2007
 Company Presentation Star Conference London October 2007 1 2 Company Overview Landi Renzo World Leader in CNG and LPG Alternative Fuel Systems Integrated Alternative Systems Energy Producer Focus Alternative
Consolidated net revenues from sales totalled Euro million (Euro million as at 30 September 2017)
") PRESS RELEASE PANARIAGROUP Industrie Ceramiche S.p.A.: The Board of Directors approves the Consolidated Financial Report as of 30 th September 2018. The trend in EUR/USD exchange rate, the international
PRESS RELEASE PANARIAGROUP Industrie Ceramiche S.p.A.: The Board of Directors approves the Consolidated Financial Report as of 30 th September 2018. The trend in EUR/USD exchange rate, the international
FUCHS PETROLUB SE The leading independent lubricants manufacturer of the world
 The leading independent lubricants manufacturer of the world Dr. Alexander Selent, Vice Chairman & CFO Dagmar Steinert, Head of Investor Relations January 2015 The leading independent lubricants manufacturer
FY 2017 CONSOLIDATED RESULTS
 Gruppo FY 2017 CONSOLIDATED RESULTS Conference Call Contents Financial highlights Ascopiave Group structure as of 31st December 2017 FY 2017 consolidated income statement Consolidated balance sheet as
KUKA AG Presentation Financial results 2011
 KUKA AG Presentation Financial results 2011 March 28, 2012 KUKA Aktiengesellschaft page 1 I March 28 2012 Highlights 2011 Record year 2011 for KUKA New record levels achieved Orders received up 36% to
1H 2014 Results Presentation July 31, 2014
 1H 2014 Results Presentation July 31, 2014 1H 2014 key facts Sales: Euro 400.2 million +3.5% (+4.1% constant FX) Directly Operated Stores Same Store Sales: +8.2% (vs -7.6% in 1H 13) EBITDA: Euro 20.7 million,
TOD S S.p.A. Outstanding results in the first half of 2009: sales and net income grew, respectively, by 3.4% and by 3.1%
 Sant Elpidio a Mare August 26 th, 2009 TOD S S.p.A. Outstanding results in the first half of 2009: sales and net income grew, respectively, by 3.4% and by 3.1% Group s revenues: 359 million Euros; EBITDA:
Interim Report January March 2017
 First Quarter - 2017 Interim Report January March 2017 Order intake was MSEK 1,314.0 (1,142.0), which is an overall growth of.1% adjusted to 4.7% for acquisitions of MSEK 118.0. The overall year to date
First ever quarter with over 200m Gross Profit
 11 July 2018 and H1 2018 Trading Update Steve Ingham Kelvin Stagg Chief Executive Officer Chief Financial Officer First ever quarter with over 200m Gross Profit LSE: PAGE.L Website: http://www.page.com/investors
Corporate Presentation
 Corporate Presentation December 2017 Disclaimer This document has been prepared by NATURHOUSE HEALTH S.A. ( NATURHOUSE or the Company ) for its exclusive use during the presentations to investors. NATURHOUSE
Brambles reports results for the half-year ended 31 December 2017
 Brambles Limited ABN 89 118 896 021 Level 10, 123 Pitt Street Sydney NSW 2000 Australia GPO Box 4173 Sydney NSW 2001 Tel +61 2 9256 5222 Fax +61 2 9256 5299 www.brambles.com 19 February 2018 The Manager
2011 Results and Outlook. Paris, February 17, 2012
 2011 Results and Outlook Paris, February 17, 2012 Contents 1. 2011 Highlights 2. 2011 Results 3. Strategy C O N T E N T S 4. Outlook and Objectives for 2012 1. 2011 Highlights 2011 key figures Amounts
KUKA AG Presentation Financial results 2012
 KUKA AG Presentation Financial results 2012 March 26, 2013 KUKA Aktiengesellschaft Page 1 I March 26, 2013 Highlights 2012 Guidance 2012 exceeded New record levels achieved in 2012 Orders received up 22%
1stQ 2018 CONSOLIDATED RESULTS
 Gruppo 1stQ 2018 CONSOLIDATED RESULTS Conference Call Contents Financial highlights Ascopiave Group structure as of 31st march 2018 1stQ 2018 consolidated income statement Consolidated balance sheet as
Tesmec Group Results. Analyst Presentation, 14 March Corporate
 Tesmec Group Results Analyst Presentation, 14 March 2013 Corporate Agenda Business update A.Caccia Dominioni, CEO & Paolo Mosconi, GM Economics Results A.Bramani, CFO - Financial Results A.Bramani, CFO
De'Longhi S.p.A.: consolidated results of year 2017
 PRESS RELEASE De'Longhi S.p.A.: consolidated results of year 2017 Today, the Board of Directors of De Longhi S.p.A. has approved the consolidated results as of December 31, 2017. Following the recent agreement
H Results. H Results
 1 H1 17 Highlights Market demand continue to increase (+2.0) Net Sales strong increase 12.6, driven by strong Cooking Own brand business performance +21 EBITDA adjusted* increase by 13.0, positively impacted
Business Plan FEBRUARY 2013
 Business Plan 2013 2015 12 FEBRUARY 2013 Company development, recent history Euro millions 900 800 700 600 500 400 300 200 100 0 180 160 140 120 100 80 60 40 20 0 Sales Gross profit CAGR 6.9% CAGR 4.8%
Q in brief. Strong sales growth. One-off costs in China. Stable operating margin* Strong cash flow
 Q2 Report 2018 Q2 2018 in brief Strong sales growth Strong growth in Americas, Global Technologies and Entrance Systems Stable growth in EMEA and APAC Strong development for smart door locks and electro-mechanical
Kingspan Full Year Results. 23rd February 2018
 Kingspan Full Year Results 23rd February 2018 Disclaimer Forward Looking Statements This presentation contains certain forward-looking statements including, without limitation, the Group s financial position,
: 40 SPARKLING YEARS
 1977-2017 : 40 SPARKLING YEARS ISMO Paris June 6 th, 2018 Prima Group at a glance Founded in 1977, Prima Industrie is a global leader in high technology laser and sheet metal processing systems and electronic
ISAGRO AS OF DECEMBER 31 ST, 2017
 ISAGRO AS OF DECEMBER 31 ST, 2017 SpA Shareholders Meeting Milan, April 24 th, 2018 EXECUTIVE SUMMARY IN A YEAR PRESENTING UNFAVORABLE CONDITIONS At Market level Drought in South Europe (particularly in
Milan September 11 th, 2003
 Milan September 11 th, 2003 TOD S Group: growth in turnover, speeding up the development plan The Board of Directors of Tod s S.p.A., the Italian company listed on the Milan Stock Exchange and holding
2007 Revenue and Results. 2007: strong increase in results Strengthened growth momentum. February 15 th, 2008
 2007 Revenue and Results 2007: strong increase in results Strengthened growth momentum February 15 th, 2008 2007 revenue and results Agenda A successful 2007 Be the recognized industry leader John Glen
Solid performance in a mixed environment
 2014 Full Year Solid performance in a mixed environment Paris, 2014 Full Year Paris, Solid performance and sustained shareholder return in a mixed environment Sales growth, enhanced competitiveness Strong
Interim results. September/October 2010
 2 0 1 0 Interim results September/October 2010 1 DISCLAIMER Safe Harbour Statement This presentation contains forward-looking statements (made pursuant to the safe harbour provisions of the Private Securities
QUARTERLY REPORT AT 30 SEPTEMBER 2011
 QUARTERLY REPORT AT 30 SEPTEMBER 2011 2 BIESSE S.p.A. QUARTERLY REPORT AT 30 SEPTEMBER 2011 CONTENTS Group Structure page 3 Notes to the Consolidated Financial Statements page 4 Parent Company Office Holders
Overview of Gruppo Campari & 2008 First Half Results
 Overview of Gruppo Campari & 2008 First Half Results Italian Investor Conference Tokyo, 07 October 2008 1 An overview 2 Gruppo Campari is.. > A major player in the global branded beverage industry > A
Increase of profitability
 Increase of profitability Dr. Michael Buscher, CEO Jürg Fedier, CFO Oerlikon Q1 Results 2012 April 30, 2012 Agenda 1 Business Update Q1 2012 2 Financials Q1 2012 3 Outlook 4 Appendix Page 2 Increase transparency
Star Conference Milan 2015
 Star Conference Milan 2015 Emak at a glance Group s shareholders Emak Group designs, manufactures and distributes a wide range of products in three different segments: (i) Outdoor Power Equipment 49% of
Q4 Re Q4 R port 2011 Johan Molin President & CEO 1
 Q4 Report 2011 Johan Molin President & CEO 1 Financial highlights Q4 2011 Strong quarter with record sales and earnings Strong growth in Asia, Africa, Global Tech and Entrance Systems Stable development