Results for six months to 31 December February 2017
|
|
|
- Tamsyn Chase
- 5 years ago
- Views:
Transcription
1 Results for six months to 31 December February 2017
2 Disclaimer and basis of preparation This publication is prepared by the Transurban Group comprising Transurban Holdings Limited (ACN ), Transurban Holding Trust (ARSN ) and Transurban International Limited (ACN ). The responsible entity of Transurban Holding Trust is Transurban Infrastructure Management Limited (ACN ) (AFSL ). No representation or warranty is made as to the accuracy, completeness or correctness of the information contained in this publication. To the maximum extent permitted by law, none of the Transurban Group, its Directors, employees or agents or any other person, accept any liability for any loss arising from or in connection with this publication including, without limitation, any liability arising from fault or negligence, or make any representations or warranties regarding, and take no responsibility for, any part of this publication and make no representation or warranty, express or implied, as to the currency, accuracy, reliability, or completeness of information in this publication. The information in this publication does not take into account individual investment and financial circumstances and is not intended in any way to influence a person dealing with a financial product, nor provide financial advice. It does not constitute an offer to subscribe for securities in the Transurban Group. Any person intending to deal in Transurban Group securities is recommended to obtain professional advice. UNITED STATES OF AMERICA These materials do not constitute an offer of securities for sale in the United States of America, and the securities referred to in these materials have not been and will not be registered under the United States Securities Act of 1933, as amended, and may not be offered or sold in the United States absent registration or an exemption from registration. Copyright Transurban Limited ABN All rights reserved. No part of this publication may be reproduced, stored in a retrieval system, or transmitted in any form or by any means, electronic, mechanical, photocopying, recording or otherwise, without the written permission of the Transurban Group. BASIS OF PREPARATION This document includes the presentation of results on a statutory as well as non-statutory basis. The non-statutory basis includes Proportional Results and Free Cash. Numbers in this presentation are prepared on a proportional basis unless specifically referred to as statutory or total. All financial results are presented in AUD unless otherwise stated. Data used for calculating percentage movements has been rounded to thousands. Refer to the Supplementary Information for an explanation of terms used throughout the presentation. 2

3 Highlights FY17 distribution guidance upgraded to 51.5 cps; growth of 13.2% over FY16 Networks delivered average traffic growth of 4.8% Focus on network efficiencies and customer experience Minimising traffic disruption during construction projects Technology deployment to improve traffic flow Expanding digital offerings for customers $9 billion development pipeline of projects committed or in exclusive negotiations; all projects under construction are on time and budget1 Issued $2.5 billion of capital markets debt at a weighted averaged tenor of greater than 10 years2 TOLL REVENUE GROWTH EBITDA GROWTH 10.9% 12.1% ADT GROWTH FY17 DISTRIBUTION GUIDANCE 4.8% 51.5 Progression of policy and technology advancements including CAV trials announced on CityLink 1. Estimated spend reflects 100% of the total project cost, not Transurban s share. 2. At issue date. 3


4 Strategy To be the partner of choice with governments providing effective and innovative urban road infrastructure utilising core capabilities Network planning / forecasting Community engagement Development / delivery Technology Operations Customer management 4

5 Transurban delivers network benefits Transurban s networks create a unique ability to deliver whole-of-market outcomes to benefit our government partners, customers, investors and the community CUSTOMER BENEFITS $31 billion1 of investment to date to upgrade capacity, ease congestion and provide travel time savings versus alternative roads Fewer network disruptions incident response, network maintenance and project upgrades designed to reduce impacts on motorists Safety priority significantly safer than the alternative road options Early adoption of proven roadside technology variable speed limits, lane-use management, ramp metering, and incident detection Use of R&D to deliver customer service initiatives apps, GPS tolling, travel time information and incident notifications Customer programs First-time Forgiveness and Hardship policies 1. Total construction costs since inception. Includes projects which have reached financial close but are yet to reach practical completion. 5

6 Transurban delivers network benefits Transurban s networks create a unique ability to deliver whole-of-market outcomes to benefit our government partners, customers, investors and the community COMMUNITY BENEFITS Whole-of-city traffic flow benefits from Transurban s network management Reduced government funding contributions road infrastructure delivery and alternate government projects expedited Contribution to policy reform Road Usage Study undertaken in 2016 Leadership in implementation of technologies CAV trials on CityLink and the 95 Express Lanes Commitment to be a good neighbour innovation and community grants, major project stakeholder engagement Approximately 70% of Transurban s security holders are Australian the largest holder represents over 400,000 members of Australia s higher education and research sector 6
7 Core earnings growth drivers Consistent growth in earnings driven by four key factors Compound annual growth excluding acquisitions of greater than 10% since FY % Traffic historically, mature toll roads have delivered on average 2-4% annual traffic growth Prices defined escalation set by the relevant concession agreements 14.0% 12.0% 10.0% 8.0% Operational margin improvement from operational efficiencies 6.0% Development contribution from pipeline of new assets 2.0% 4.0% 0.0% FY09 Acquisitions have contributed $752m to EBITDA since FY09 FY10 FY11 FY12 FY13 FY14 FY15 FY16 Total EBITDA growth including acquisitions FY09 FY10 FY11 FY12 FY13 FY14 FY15 FY16 11% 9% 13% 9% 6% 13% 38% 15% 7
8 1H17 network performance NETWORK HIGHLIGHTS Sydney Network enhancements continuing to deliver traffic growth M2 impacted by NCX construction Large vehicle multipliers now at 3 times cars on M2, LCT, M5, and M7 Melbourne Brisbane1 Greater Washington Area2 Minimising impacts from construction works on the CTW project Average weekend/public holiday traffic increased 0.9% CityLink HCV tolls moving to 3 times cars on 1 April 2017 as per CTW investment agreement with government (2014) AirportlinkM7 traffic and revenue results in line with expectations Logan and Gateway HCV tolls progressively moving up to 3.46 times cars post LEP (completion expected mid-2019) Ramp up continues with traffic and revenue growth Traffic demand drove average dynamic toll price increases of 16.1% for 495 Express Lanes and 18.0% for 95 Express Lanes compared to the pcp TOLL REVENUE CONTRIBUTION ADT GROWTH TOLL REVENUE GROWTH EBITDA GROWTH 40.7% 3.4% 8.8% 10.4% 31.9% (0.7%) 2.7% 2.5% 18.2% 19.4% 31.6% 39.6% 9.2% 11.5% 21.2% 53.1% 1. Excluding AirportlinkM7, ADT increased 2.0%, toll revenue increased 7.8% and EBITDA increased 11.5%. 2. Toll revenue growth and EBITDA growth are calculated in USD. 8
 WEBB DOCK ACCESS6 Melbourne 95 EXPRESS LANES SOUTHERN EXTENSION GWA (US$25 million) MONASH FREEWAY UPGRADE6 Melbourne LOGAN ENHANCEMENT PROJECT Brisbane ($320 million) NORTHCONNEX Sydney")
9 $9 billion development pipeline 7 FY17 FY18 COMMITTED PROJECTS UNDER CONSTRUCTION1 FY19 FY20 FY21 FY22 CITYLINK TULLA WIDENING Melbourne ($1.0 billion) WEBB DOCK ACCESS6 Melbourne 95 EXPRESS LANES SOUTHERN EXTENSION GWA (US$25 million) MONASH FREEWAY UPGRADE6 Melbourne LOGAN ENHANCEMENT PROJECT Brisbane ($320 million) NORTHCONNEX Sydney ($1.3 billion) PENDING FINAL APPROVAL1,5 395 EXPRESS LANES GWA (US$460 million) EXCLUSIVE NEGOTIATIONS1,2 INNER CITY BYPASS Brisbane ($37.5 million)3 WESTERN DISTRIBUTOR Melbourne ($3.5 - $4.0 billion)6 95 EXPRESS LANES ATLANTIC GATEWAY PROJECT4 GWA TRANSURBAN ESTIMATED ANNUAL CAPITAL CONTRIBUTION1, $0.9B $1.7B $1.5B $1.2B $0.8B Estimated spend reflects Transurban s proportion of the total project cost, net of government contribution. Final funding requirement subject to confirmation of project scope and/or competitive procurement process and extent of government funding. ICB project cost of $60 million as per Brisbane City Council announcement on 29 November The 95 Express Lanes Atlantic Gateway Project has not been included in Transurban s estimated annual capital contribution as it is still in early negotiations. Transurban has agreed all key terms to the transaction with Government and submitted a project plan which is expected to be approved by mid-february. Western Distributor project cost to Transurban of $3.5-$4.0 billion. Estimated spend reflects 100% of the total project cost, not Transurban s share. $0.2B 9
10 Potential opportunities in government transport plans FY17-FY19 UNDER CONSTRUCTION/PROCUREMENT2 FY20-FY22 FY23-FY25 FY26-FY28 FY29+ WESTCONNEX STAGE 1A Sydney WESTCONNEX STAGE 1B Sydney WESTCONNEX STAGE 2 Sydney SYDNEY GATEWAY Sydney WESTCONNEX STAGE 3 Sydney POTENTIAL NETWORK ENHANCEMENTS2 CENTENARY/WESTERN MOTORWAY WIDENING1 Brisbane M7 WIDENING1 Sydney PACIFIC MOTORWAY WIDENING1 Brisbane LOGAN MOTORWAY WIDENING1 Brisbane PARADISE ROAD WIDENING1 Brisbane MISSING LINKS2 PARK RIDGE CONNECTOR1 Brisbane WESTERN HARBOUR TUNNEL Sydney NORTH EAST LINK Melbourne BEACHES LINK Sydney F6 EXTENSION1 Sydney INTEGRATED REGIONAL TRANSPORT CORRIDOR1 Brisbane OUTER SYDNEY ORBITAL1 Sydney OUTER MELBOURNE RING Melbourne 1. Timing estimated by Transurban. 2. Revenue sources, if any, are yet to be determined. Some government owned assets may include opportunities for operational and network enhancements which will not include tolls. 10


 Source: Tom Tom 2014 data 1.")
11 North American market opportunities NETWORK POTENTIAL IN NORTH AMERICA S MOST CONGESTED CITIES1 FAVOURABLE DEMOGRAPHICS 50% GOVERNMENT READINESS/ WILLINGNESS FOR PPP 40% Los Angeles San Francisco TIME SAVINGS VALUE TO MOTORISTS NETWORK POTENTIAL Congestion level Vancouver Toronto Greater Washington Area Seattle 30% Miami Orlando Chicago Houston 20% Denver Dallas-Fort Worth Boston Charlotte 10% San Antonio Norfolk / VA Beach 0% Population (millions) Source: Tom Tom 2014 data 1. Bubble size represents network potential. 11
12 Disciplined approach to investment INVESTMENT APPROACH TRANSURBAN TRAFFIC FORECASTING CAPABILITY Vendor/third party forecast Actual Transurban Bid Long-term owner-operator model aligned with government partners Pursue sustainable policy Internal due diligence capability traffic forecasting, operations, maintenance, construction and project valuation Construction risk management use of tier one contractors, fixed-price and fixed-time contracts, inhouse project management FY 11 FY 12 FY 13 FY 14 FY 15 FY 16 Through-the-cycle approach to cost of capital Synergies from leveraging existing business Distribution impacts a key factor in decision making One-quarter of portfolio acquired out of receivership for ~50% of construction cost 12
13 Balance sheet capacity to fund investments Targeting strong investment grade credit metrics and minimum FFO to debt of 8% Incremental funding sources: Enhancing asset capital structures through development funding and capital release DRP delivered $176 million in last 12 months2 BUSINESS GROWTH SUPPORTS GREATER INVESTMENT1 40,000 35,000 30,000 A$ MILLION Earnings growth underpins balance sheet expansion Commitment to strong investment grade credit metrics 25,000 20,000 15,000 10,000 5,000 2H14 1H15 2H15 1H16 2H16 1H17 Capacity to fund current development pipeline Western Distributor is the only project in the current development pipeline potentially requiring additional equity funding 1. Represents Transurban s enterprise value, calculated as the sum of Transurban market capitalisation and proportional drawn debt at the end of each period. 2. DRP for 1H17 and 2H16. 13
14 Financial results
15 Statutory results 1H16 ($M) 1H17 ($M) Toll revenue 919 1,032 EBITDA Net profit H17 distribution Interim distribution of 25.0cps including 3.5cps fully franked component KEY DRIVERS Toll revenue $57 million increase from existing assets driven by traffic growth and toll price escalation $56 million contribution from AirportlinkM7 EBITDA $45 million increase from existing assets $48 million contribution from AirportlinkM7 Net profit Increase in EBITDA offset by higher net finance costs primarily from swap termination due to early refinancing activities and AirportlinkM7 funding costs 15
16 Proportional results 1H16 ($M) 1H17 ($M) % CHANGE Toll revenue 960 1, % Toll revenue Other revenue (6.7%) $70 million increase from existing assets $35 million contribution from AirportlinkM7 Total revenue 990 1, % Total costs (261) (276) 5.7% EBITDA % EBITDA margin 73.7% 74.7% 1.0% KEY DRIVERS Total costs $7 million increase from existing assets $8 million contribution from AirportlinkM7 EBITDA margin Higher margin contributions from Sydney, Brisbane and GWA networks CTW works impacting the Melbourne network 16
17 EBITDA movement +12.1% % (2) TQ integration costs Foreign exchange H16 EBITDA Existing business growth 1H17 existing business EBITDA AirportlinkM7 1H17 EBITDA 17

18 Network EBITDA margins EBITDA MARGINS1 1H16 FY16 1H17 Sydney 79.7% 79.7% 80.9% Melbourne 86.2% 85.5% 86.0% Brisbane 70.2% 69.6% 71.1% GWA 46.1% 49.5% 58.3% Group 73.7% 73.8% 74.7% Increase in Group margin 1H17 EBITDA margin growth across Sydney, Brisbane and GWA Melbourne margin impacted by CTW works disrupting traffic 1. Group EBITDA margins are calculated using total revenue and network EBITDA margins are calculated using toll revenue. 18
19 Cost movement O&M has increased in-line with business activities Continuation of strategic growth projects including technology initiatives and bid costs associated with new development opportunities +5.7% % 5 8 (4) (2) H16 total costs Operations Maintenance Strategic growth projects TQ integration costs Foreign exchange 1H17 existing business costs AirportlinkM7 1H17 total costs 19
20 Free cash flow +47.5% (39) (20) 680 (3) 174 Net finance costs $35 million decrease due timing of interest payments from recent debt refinancings FCF Coverage 510 NWRG $174 million increase due to distributions from NWRG. Capital release proceeds as per NCX development agreement 27 FCF coverage for 1H17 is 133.3% M5 $30 million contribution from M5 primarily due to 2H16 deferred dividend paid in 1H17. No further dividends expected to be received from M5 in FY17 1H16 Free cash flow EBITDA 100% owned entities (cash impact) Distributions non-100 % 1 owned entities NWRG capital release Net finance costs Working capital 100% owned Maintenance 1H17 Free cash flow 1H17 distribution 1. Increased distributions from ED ($5 million) and NWRG ($13 million) associated with EBITDA performance, along with an increased distribution from TQ ($32 million) due to EBITDA performance and timing of interest payment cash flows and distributions from AirportlinkM7. 20
21 Balance sheet positioned for macro environment FUNDING ACTIVITIES 1H17 CAPITAL MARKETS ISSUANCES (TOTAL A$2.5B) Continued to successfully refinance existing term bank debt into long term debt capital markets NOK NOTES 15 Years CHF NOTES 12 Years US PRIVATE PLACEMENT 11 Years AUD NOTES 10 Years USD NOTES (144A) 7 Years Proportion of drawn Group bank debt reduced from 30% to 22% Issued $2.5 billion of capital markets debt at a weighted average tenor of greater than 10 years1 Group weighted average maturity increased to 9.3 years 0 No debt maturities remaining for FY17 Issuances during 1H17 diversified across markets USD 144A, AMTN, NOK notes, CHF notes and USPP Tenor Market A$ MILLION GROUP DEBT2 Group debt Weighted average maturity Weighted average cost of AUD debt Weighted average cost of USD debt Gearing3 FFO/Debt4 1, ,000 A$ MILLION JUN 16 DEC 16 A$12,484M A$13,751M 8.7 years 9.3 years 5.2% 4.9% 4.3% 4.3% 33.3% 38.9% 8.0% 8.2% 1. At issue date. 2. Proportional drawn debt inclusive of issued letters of credit. Debt in AUD, CAD, CHF, EUR, NOK and USD converted at the hedged rate where cross currency swaps are in place. USD debt is converted at the spot exchange rate ($ at 30 June 2016 and $ at 31 December 2016) where no cross currency swaps are in place. 3. Proportional debt to enterprise value. The security price was $11.99 at 30 June 2016 and $10.32 at 31 December 2016 with 2,036 million securities on issue at 30 June 2016 and 2,043 million securities on issue at 31 December Based on S&P methodology. The impact of AirportlinkM7 has been annualised. June 2016 FFO/Debt inclusive of tax benefit was 8.6% (AirportlinkM7 annualised). 21
22 Hedging profile TRANSURBAN INTEREST RATE HEDGING PROFILE1 99.8% interest rate hedged at 31 December ,000 GWA Hedge tenor is matched to the tenor of the debt on 97%2 of drawn debt Currently 100% currency hedged3 Brisbane Corporate Fixed amount 14,000 12,000 A$ MILLION All foreign currency debt issued in 1H17 was swapped to AUD for the life of the debt Sydney 16,000 10,000 8,000 6,000 4,000 2,000 0 Dec 16 Jun 17 Jun 18 Jun 19 Jun 20 Jun 21 Jun 22 Jun 23 Jun 24 Jun 25 Jun 26 Jun 27 Jun 28 Jun 29 Jun 30 Jun 31 Jun 32 Jun 33 Jun 34 Jun Jun Calculated on the full value of drawn debt including 100% of non-recourse drawn debt. Non-AUD debt is converted at the hedged rate where cross currency swaps are in place. USD debt is converted at the spot exchange rate ($ at 30 June 2016 and $ at 31 December 2016) where no cross currency swaps are in place. 2. A$14 million drawn corporate working capital maturing June 2018 is unhedged. A$310 million PABs for 495 Express Lanes maturing in FY48 are hedged to FY28. Up to A$172 million of total A$1.25 billion M7 debt is unhedged between August 2017 and August 2019, dropping to A$22 million unhedged from August 2019 to August A total of US$977 million corporate debt is not swapped to AUD, this debt forms part of the Group s net investment hedge relating to US entities. 22
23 Market update


24 Sydney network 24

25 Sydney network NorthConnex Update Project currently on time and on budget 15 road headers in operation Funding source - M7 large vehicle toll multipliers reached 3 times cars on 1 January 2017 Potential to accelerate NCX and M2 integration works to minimise impact to M2 motorists OPERATIONS POTENTIAL FUTURE DEVELOPMENT FMS roll out via variable speed limits installed on ED Opportunities identified by government: Transurban and RMS joint working group Journey Enhancement Team Forum for sharing traffic data and network performance metrics M7 Widening Western Harbour Tunnel Beaches Link F6 Extension Outer Sydney Orbital Focus on prioritising network congestion points on and off motorway Western Harbour Tunnel and Beaches Link business cases to be released Jointly-developed congestion-relief initiatives Supporting NSW government transport initiatives and awaiting potential WCX sale Project awarded a Leading Infrastructure Sustainability Design rating at the ISCA awards NCX with over 2.9 million hours and no LTIs Incident clearance times ~30% better than TMC targets guidelines over 1H17 25

26 WestConnex 26
 to be determined TRANSURBAN S APPROACH Track record of working with industry and government partners to deliver whole-of-market outcomes Competitive process with significant")
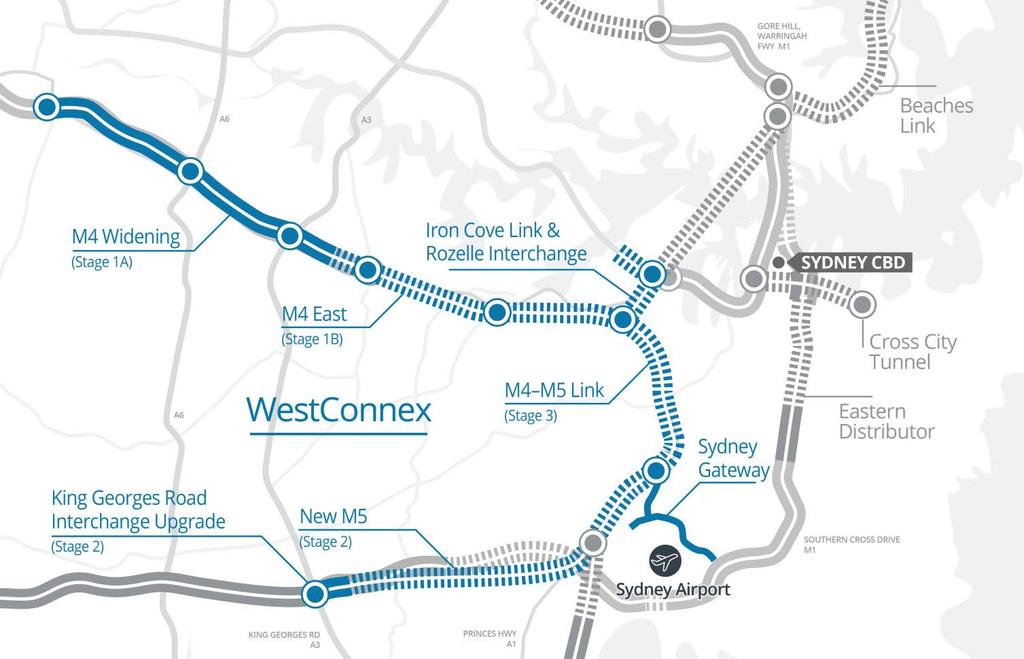
27 WestConnex Transurban continues to prepare for a potential WCX sell-down. Scope of sale (if any) to be determined TRANSURBAN S APPROACH Track record of working with industry and government partners to deliver whole-of-market outcomes Competitive process with significant interest expected from multiple parties Stage 2: King Georges Road Interchange Upgrade (KGRIU) and New M5 are both under construction. Planning is underway for Sydney Gateway Stage 3: Draft design to be released in early 2017 Confirm use Stage 1: Both stage 1A and 1B are under construction OPEN TO TRAFFIC1 MAX TOLLS (2015)1 M4 Widening M4 East $4.21 $3.65 Stage 2 New M5 (incl. KGRIU) 2020 $5.72 Stage 2 Sydney Gateway 2023 TBD (if any) Stage 3 M4-M5 Link 2023 $6.01 STAGE ASSET Stage 1A Stage 1B Construction completion risk to transaction Project capital expenditure forecast $16.8 billion Accelerated upgrades and enhancements e.g. NCX Deployment of technology Customer service initiatives Extensive engagement with community Embedded safety culture Construction management experience and market knowledge Long-term owner-operator to the benefit of NSW Strong understanding of traffic based on existing network position Competitive position through synergies, efficient capital structures and potential partners 1. Figures in table from WestConnex Updated Strategic Business Case, November

28 Melbourne network 28


29 Melbourne network WESTERN DISTRIBUTOR PROJECT CITYLINK TULLA WIDENING Total project cost approximately $5.5 billion Total project cost is approximately $1.3 billion Construction on the MFU commenced September 2016 Minimising traffic impacts from construction works Major Webb Dock Access preparation works on Cook Street complete D&C procurement process in progress EES to be exhibited by mid2017, following selection of preferred tenderer Financial close expected by end 2017 Projected to create 5,600 jobs during construction Major works commenced in March 2016 Construction proceeding on time and on budget project 66% complete CityLink upgrade to be completed early 2018 Funding source HCV tolls moving to 3 times cars on 1 April 2017 CITYLINK OPERATIONS Safe clearance incident response model achieved 50% reduction in customer waiting time since implementation in December 2016 CAV testing on MonashCityLink-Tullamarine corridor from early 2017 FMS continues to be rolled out across broader CityLink network throughout 2017 including: Ramp metering Automated incident detection Variable message signs 29
30 Brisbane network 30
 New south-facing ramps at Compton Road to be tolled Project to generate ~1,300 direct construction jobs and more than $1.")
31 Brisbane network LOGAN ENHANCEMENT PROJECT Queensland Government approved the $512 million LEP in November 2016 Logan and Gateway HCV tolls progressively moving up to up 3.46 times cars post LEP (completion expected mid-2019) New south-facing ramps at Compton Road to be tolled Project to generate ~1,300 direct construction jobs and more than $1.3 billion in economic benefits INNER CITY BYPASS Brisbane City Council announced the $60 million widening of the ICB D&C contract awarded in December 2016 Works are expected to commence in March 2017 TQ in exclusive negotiations to manage delivery and assume operations of the ICB upgrade OPERATIONS AND UPGRADES GLIDe tolling system roll out to commence late 2017, with benefits flowing from 2018 Activities to optimise operations and maintenance contracts underway Gateway Upgrade North Construction progressing Completion expected late 2018 TQ to donate up to $2 million to develop a community complex at Heathwood 31

32 Greater Washington Area network 32


33 Greater Washington Area network OPERATIONS 395 EXPRESS LANES SOUTHERN EXTENSIONS TO 95 EXPRESS LANES Completed insourcing of back office tolling system and road operations and maintenance 13 km extension to the 95 Express Lanes, which will convert two HOV lanes to three Express Lanes Construction commenced in July 2016 on the three km extension to the south of the 95 Express Lanes Total project cost expected to be US$460 million Atlantic Gateway Extension Project: Improving the information available to customers through mobile app and social media: 60,000 app downloads 14 million impressions on social media Commenced partnership to install proof of concept for vehicle occupancy detection technology in 2017 Jones Branch connector being constructed, adding a connection point between the 495 Express Lanes and Tysons All key terms of the transaction have been agreed with Government 14 km extension south to the Fredericksburg area Conceptual scope finalised Project plan submitted, expected to be approved by mid-february Environmental studies commenced Design-builder selected Financial close expected in mid2017 Construction completion expected in the end of

34 Safety highlights Transurban continues to focus on improving safety for our employees, contractors and customers Supporting state governments in their Towards Zero campaigns Adoption of the Safe System four pillars of safer roads, safer speeds, safer vehicles and safer people Roadside signage, social media, TV, radio and website campaigns to target pedestrians, fatigue, speeding, cyclists and drink driving A continued focus on minimising distracted driving Extensive campaign on the 95 Express Lanes and the 495 Express Lanes to more than two million drivers using online advertisements and social media promotion 1H17 highlights RICI continues to trend down Zero LTIs on all active construction projects during the period 34
35 Commitment to sustainability RECOGNITION INFRASTRUCTURE SUSTAINABILITY COUNCIL OF AUSTRALIA Dow Jones Sustainability Index (DJSI): Recognised in World Leadership Index ISCA is the peak sustainability body for Australia s infrastructure DJSI Asia Pacific Leadership Index recognition for the 11th consecutive year Awarded DJSI Industry Mover Sustainability Award 2017 (Infrastructure) Australian Council of Superannuation Investors (ACSI) rated as Leading for sustainability reporting for the ninth consecutive year FTSE4Good Index member for the 12th consecutive year Awarded WGEA Employer of Choice for Gender Equality for the third consecutive year 2016 Award for the Best Action for Supporting Diversity in the ITS Workforce IS rating scheme developed to evaluate sustainability at three phases: Design, As Built and Operations Allows Transurban to set sustainability performance targets on new assets using industry-standard benchmarks Rating system of Leading, Excellent and Commended NCX awarded top rating of Leading and finalist for the 2016 Sustainability in Infrastructure IS Project or Asset Achievement Award. Noted achievements: 26% reduction of scope 1 and 2 carbon emissions 42% reduction in total water use over the life of the project 29% reduction in the life cycle impact of materials 35


36 Transurban technology initiatives Technology to drive improvements in customer experience CITYLINK CAV TRIAL MOBILE TOLL TRIAL CAV testing on Monash-CityLink-Tullamarine corridor from early 2017 CityLink has completed a mobile toll trial using a mobile GPS based app Initial focus on interaction between currently available vehicle models and road infrastructure, including: The tolling app would be an alternative for customers who: prefer account flexibility want to manage their toll road usage trip by trip Overhead lane signals Electronic speed signs Line marking Expected community benefits from reduction in incidents COMMERCIAL GPS TOLLING TRIAL To be conducted in stages over 2017 Learn more about our customers experiences so we can continuously improve the service we provide Leverage existing telematics data to replace tags 36


37 Outlook Distribution guidance upgraded to 51.5 cps represents 13.2% growth year-on-year Initiatives to drive improved customer experience Consultation focus around major projects to ensure best community outcomes Existing development pipeline progressing and new opportunities emerging in each market Operating technologies to drive greater efficiency across networks Working with partners to progress technology initiatives CAV trials 37


38 Supplementary information 1 DETAILED FINANCIALS 2 TREASURY 3 CORPORATE OVERVIEW 4 GLOSSARY
39 Detailed financials
 2.7% (0.7%) Brisbane 32.6% 19.4% 31.6% 19.4% GWA 18.3% 11.4% 21.2% 11.5% 1.")
40 Traffic and revenue performance DEC 16 QUARTER1 PROPORTIONAL TOLL REVENUE % CHANGE 1H171 PROPORTIONAL ADT % CHANGE TOLL REVENUE % CHANGE ADT % CHANGE Sydney 9.7% 3.5% 8.8% 3.4% Melbourne 2.9% (0.9%) 2.7% (0.7%) Brisbane 32.6% 19.4% 31.6% 19.4% GWA 18.3% 11.4% 21.2% 11.5% 1. Compared to pcp. 40
41 Traffic and revenue data 1 ASSET DEC 15 QUARTER DEC 16 QUARTER % CHANGE 1H16 1H17 % CHANGE $ $ % 3.6% $ $ % 3.4% $23 87 $ % 3.7% $45 86 $ % 3.3% $16 39 $ % 2.2% $30 38 $ % 1.6% $32 56 $ % 1.3% $63 56 $ % 0.9% $ $ % 3.6% $ $ % 3.4% $ $ % 4.4% $ $ % 5.0% $ $ % (0.9%) $ $ % (0.7%) Sydney M2 Total Toll Revenue Average Daily Trips ( 000) LCT Total Toll Revenue Average Daily Trips ( 000) CCT Total Toll Revenue Average Daily Trips ( 000) ED Total Toll Revenue Average Daily Trips ( 000) M7 Total Toll Revenue M5 Total Toll Revenue Average Daily Trips ( 000) Average Daily Trips ( 000) Melbourne CityLink Total Toll Revenue Average Daily Transactions ( 000) 1. Assets at 100%. 41
42 Traffic and revenue data 1 ASSET DEC 15 QUARTER DEC 16 QUARTER % CHANGE 1H16 1H17 % CHANGE $ $ % 1.1% $ $ % 1.2% $ $ % 2.8% $ $ % 2.8% 54 $ % 55 $ % $12 26 $ % 4.6% $25 27 $ % 3.3% $6 18 $ % 3.2% $12 18 $ % 3.4% $3 12 $3 11 (4.4%) (5.9%) $7 12 $7 11 (4.7%) (5.8%) $17 $ % $34 $ % % % $14 $ % $27 $ % % % Brisbane Gateway Motorway Total Toll Revenue Average Daily Trips ( 000) Logan Motorway Total Toll Revenue Average Daily Trips ( 000) AirportlinkM7 Total Toll Revenue Average Daily Trips ( 000) Clem7 Total Toll Revenue Average Daily Trips ( 000) Legacy Way Total Toll Revenue Average Daily Trips ( 000) Go Between Bridge Total Toll Revenue Average Daily Trips ( 000) Greater Washington Area 95 Express Lanes 495 Express Lanes Total Toll Revenue ($USDm) Average Daily Trips ( 000) Total Toll Revenue ($USDm) Average Daily Trips ( 000) 1. Assets at 100%. 42

43 Proportional toll revenue by asset OWNERSHIP DEC 16 QUARTER 100% 1H17 PROPORTIONAL 100% PROPORTIONAL M % $71 $71 $138 $138 LCT 100.0% $24 $24 $46 $46 CCT 100.0% $17 $17 $32 $32 ED 75.1% $34 $26 $67 $50 M7 50.0% $100 $50 $196 $98 M5 50.0% $68 $34 $135 $ % $170 $170 $340 $340 Gateway Motorway 62.5% $55 $35 $110 $69 Logan Motorway 62.5% $47 $29 $92 $57 AirportlinkM7 62.5% $28 $18 $56 $35 Clem7 62.5% $13 $8 $27 $17 Legacy Way 62.5% $9 $6 $18 $11 Go Between Bridge 62.5% $3 $2 $7 $4 95 Express Lanes ($USD) 100.0% $20 $20 $41 $ Express Lanes ($USD) 100.0% $17 $17 $33 $33 CityLink 43
44 Statutory results 1H16 ($M) 1H17 ($M) % CHANGE Toll revenue Construction revenue Other revenue Total revenue Employee benefit expense Road operating costs Construction costs Transaction and integration costs Corporate/other expenses Total costs ,056 (71) (148) (107) (7) (47) (380) 1, ,334 (78) (166) (274) (47) (565) 12.3% 156.1% (6.7%) 26.3% 9.9% 12.2% 156.1% 0.0% 48.7% EBITDA Depreciation and amortisation Finance income Finance costs Net finance costs Share of equity accounted investments Profit before tax Tax benefit Net profit 676 (279) 19 (372) (353) (307) 29 (435) (406) % 10.0% 52.6% 16.9% 15.0% 22.2% 26.4% 133.3% 41.9% 44
45 Proportional results PROPORTIONAL EARNINGS Toll revenue 1H16 ($M) 1H17 ($M) % CHANGE 960 1, % Other revenue (6.7%) Total revenue 990 1, % (261) (276) 5.7% % Total costs EBITDA RECONCILIATION OF STATUTORY EBITDA TO PROPORTIONAL EBITDA 1H16 ($M) 1H17 ($M) % CHANGE Statutory EBITDA Less: EBITDA attributable to non-controlling interest ED (13) (13) Less: EBITDA attributable to non-controlling interest TQ (60) (83) 38.3% % % % Add: M7 proportional EBITDA Add: M5 proportional EBITDA Proportional EBITDA 13.8% - 45
46 1H17 proportional result by asset OWNERSHIP 100.0% 100.0% 100.0% 75.1% 100.0% 50.0% 50.0% 100.0% 62.5% 62.5% 62.5% 62.5% 62.5% 62.5% 62.5% 100.0% 100.0% 100.0% ASSET M2 LCT CCT ED Roam Tolling and Tollaust M71 M5 Sydney CityLink Melbourne Gateway Motorway Logan Motorway AirportlinkM7 Clem7 Legacy Way Go Between Bridge TQ Corp Brisbane 495 Express Lanes 95 Express Lanes GWA Corp2 Greater Washington Area Corporate and other Transurban Group 1. Includes NWRG s corporate entities results. 2. Includes DRIVe. D&A $M NET FINANCE COST EXPENSE $M (3) 57 (21) (37) (11) (12) (19) (20) (24) (123) (69) (69) (24) (20) (16) (5) (4) (1) (70) (11) (7) (18) (23) 817 (303) TOLL REVENUE $M OTHER REVENUE $M EBITDA $M , NPBT $M INCOME TAX (EXP) / BENEFIT $M NPAT $M (19) (14) (7) (15) (45) (13) (113) (13) (13) (2) (5) (11) (5) (1) (90) (114) (31) (14) (38) (83) (67) (1) (4) 2 (88) (47) (16) 13 (41) (44) (111) 6 (6) 3 (1) (22) (12) (32) (44) (44) (4) (2) (1) (2) (4) (3) 1 (79) (42) (16) 13 (21) (24) (77) (390) 124 (17)
47 1H16 proportional result by asset OWNERSHIP 100.0% 100.0% 100.0% 75.1% 100.0% 50.0% 50.0% 100.0% 62.5% 62.5% 62.5% 62.5% 62.5% 62.5% 62.5% 100.0% 100.0% 100.0% ASSET M2 LCT CCT ED Roam Tolling and Tollaust M71 M5 Sydney CityLink Melbourne Gateway Motorway Logan Motorway AirportlinkM7 Clem7 Legacy Way Go Between Bridge TQ Corp Brisbane 495 Express Lanes 95 Express Lanes GWA Corp2 Greater Washington Area Corporate and other Transurban Group 1. Includes NWRG s corporate entities results. 2. Includes DRIVe. TOLL REVENUE $M OTHER REVENUE $M EBITDA $M (2) (11) 729 D&A $M NET FINANCE COST EXPENSE $M (36) (8) (12) (19) (3) (20) (24) (122) (69) (69) (23) (23) (5) (3) (1) (55) (13) (6) (19) (14) (279) (21) (6) (7) (14) (37) (11) (96) (13) (13) (3) (6) (7) (1) (1) (66) (84) (33) (14) (70) (117) (36) (346) NPBT $M INCOME TAX (EXP) / BENEFIT $M NPAT $M (1) (4) (6) 1 (66) (41) (31) 4 (70) (97) (61) (1) 4 (11) 1 (42) (42) (3) (2) 1 (20) (2) (6) (1) (3) (26) (1) (37) (38) (31) 4 (64) (91) (35) 98 47
48 1H17 Net finance costs paid NON-CASH ITEMS CONTROLLED ENTITIES CityLink M2 LCT CCT ED 95 Express Lanes 495 Express Lanes Transurban Queensland Corporate M5 TLN Corporate NorthConnex SLN interest income Corporate Other Total controlled entities at 100% EQUITY OWNED ENTITIES NWRG M7 External Interest NWRG NorthConnex SLN interest expense M5 External Interest M5 TLN interest expense Total equity accounted investments at 100% STATUTORY NET INTEREST DEBT FEES CONCESSION PAYMENTS & MAINTENANCE PROVISION UNWIND % % % % 75.10% % % 62.50% % % % (13) (19) (14) (7) (20) (14) (31) (182) 3 15 (124) (406) (3) (15) 12 1 (8) 2 (54) (59) (13) (16) (8) (5) (16) (9) (9) (158) 5 (158) (387) (13) (16) (8) (6) (12) (9) (9) (99) 5 (158) (325) 50.00% 50.00% 50.00% 50.00% (59) (30) (20) (6) (115) (4) 3 (37) (15) (10) (62) (18) (7) (5) (30) (390) (55) (355) (355) OWNERSHIP Proportional net finance costs 1. Interest accrual movements due to the frequency of cash interest payments. INTEREST CAPITALISATION INTEREST ACCRUALS1 NET INTEREST PAID PROPORTIONAL NET INTEREST PAID 48

49 1H16 Net finance costs paid NON-CASH ITEMS CONTROLLED ENTITIES CityLink M2 LCT CCT ED 95 Express Lanes 495 Express Lanes Transurban Queensland Corporate M5 TLN Corporate NorthConnex SLN interest income Corporate Other1 Total controlled entities at 100% EQUITY OWNED ENTITIES NWRG M7 External Interest NWRG NorthConnex SLN interest expense M5 External Interest M5 TLN interest expense Total equity accounted investments at 100% OWNERSHIP DEBT FEES NET INTEREST PAID PROPORTIONAL NET INTEREST PAID % % % % 75.10% % % 62.50% % % % (13) (21) (6) (7) (19) (14) (33) (135) 2 6 (113) (353) 1 1 (3) 2 (5) (6) (27) (13) (8) (17) (5) (6) (17) (12) (9) (111) 2 (126) (309) (8) (17) (5) (6) (12) (12) (9) (69) 2 (126) (262) 50.00% 50.00% 50.00% 50.00% (62) (12) (18) (4) (96) 2 (2) (1) (1) (44) (20) (4) (68) (22) (11) (2) (35) (346) (18) (297) (297) Proportional net finance costs 1. 1H16 proportional interest paid re-stated in Corporate Other. 2. Interest accrual movements due to the frequency of cash interest payments. STATUTORY NET INTEREST CONCESSION PAYMENTS & INTEREST INTEREST MAINTENANCE CAPITALISATION ACCRUALS2 PROVISION UNWIND 49
50 Maintenance provision 1 MAINTENANCE CASH SPEND MAINTENANCE EXPENSE 2 RECOGNISED 1H16 ($M) 1H17 ($M) 1H16 ($M) 1H17 ($M) CityLink (7) (7) (7) (5) M2 (3) (1) (2) (2) LCT (3) (4) (6) (3) CCT (2) (4) (1) (2) ED (4) (3) (4) (5) M7 (4) (6) (1) (2) M5 (3) (2) - - Gateway Motorway (6) (5) (2) (2) Logan Motorway (5) (6) (4) (15) AirportlinkM7 - (2) - - Clem7 (3) (4) - - Legacy Way (2) (4) - - Go Between Bridge (1) Express Lanes (4) (5) - (1) 95 Express Lanes (5) (5) Assets at 100%. 2. Tag purchases put through free cash reconciliation not included above - $3 million in 1H17 and $2 million in 1H16. 50
51 Free cash calculation FREE CASH CALCULATION SOURCE OF INFORMATION/EXPLANATION Cash flows from operating activities (refer Group Statutory accounts) Statutory Transurban Holdings Limited operating cash flow (includes cash inflow from M5 TLNs). Add back transaction and integration costs related to acquisitions (non-100% owned entities) Transaction and integration related cash payments incurred on the acquisition of AirportlinkM7 in pcp. Add back payments for maintenance of intangible assets For statutory purposes payments for maintenance are classified as operating activities. For the calculation of free cash Transurban removes these payments and replaces them with increases or decreases to the maintenance provision recognised in the Statement of Comprehensive Income (see slide 52). This provides a smoother representation of maintenance spend and reflects the incurrence of the damage through the facilities use. Less cash flow from operating activities from consolidated non-100% owned entities 100% of the operating cash flows of ED and TQ are included in the statutory results, however the distribution received by Transurban from these entities better reflects the cash available for distribution to Transurban security holders. The cash flows from operating activities are therefore eliminated and, where applicable, replaced with distributions received. Less allowance for maintenance of intangible assets for 100% owned assets Expenditure for maintenance of intangible assets is provided for over the period of the facilities use. The annual charge to recognise this provision reflects the yearly damage to the facility requiring maintenance. Also includes allowance for expenditure on electronic tags within 100% owned tolling businesses. Adjust for distributions and interest received from non-100% owned entities ED distribution Cash distribution received from ED by Transurban. M5 distribution and TLN interest Cash distribution received from M5 by Transurban and interest received on Transurban's long term loan to M5 (represents a portion of Transurban's ownership interest). TQ distribution and shareholder loan note interest Cash distribution received from TQ by Transurban and interest received on Transurban s long term loan to TQ (represents a portion of Transurban s ownership interest). NWRG distribution Cash distributions received from the NWRG by Transurban. Free cash 51
52 Free cash flow RECONCILIATION OF STATUTORY CASH FLOW FROM OPERATING ACTIVITIES TO FREE CASH 1H16 ($M) 1H17 ($M) Cash flows from operating activities Add back transaction and integration costs related to acquisitions (non-100% owned entities) Add back payments for maintenance of intangible assets 1H16 1H17 % CHANGE Free cash $461M $680M 47.5% Weighted average securities eligible for distribution2 1,922M 2,043M 6.3% Free cash per security 24.0cps 33.3cps 38.8% (130) (130) (26) (29) ED distribution M5 distribution and TLN interest TQ distribution and SLN interest NWRG distribution Less cash flow from operating activities from consolidated non-100% owned entities1 Less allowance for maintenance of intangible assets for 100% owned assets FREE CASH FLOW Adjust for distributions and interest received from non-100% owned entities Free cash 1. Consolidated cash flows from non-100% owned entities includes ED and TQ. 2. Weighted average calculation based on entitlement to distribution. 52
53 Reconciliation of proportional EBITDA to free cash 1H17 Proportional EBITDA Proportional net finance costs paid (cash) 817 (355) Comments Refer to slide 45 for further detail Refer to slides 48 and 49 for further detail 20 Refer to slide 50 for further detail Less proportional maintenance cash spend (non-100% owned assets) (15) Refer to slide 50 for further detail M7 - Non-100% owned assets distribution 174 NWRG capital release proceeds Add back proportional maintenance expense (non-100% owned assets) M5 - Non-100% owned assets distribution timing Working capital M5 - Tax paid Other Free Cash 24 2 (14) 27 M5 dividend deferral Working capital movement Tax paid by M5 TQ debt funding of Logan pavement rectification and swap terminations
54 Treasury
55 Funding structure at 31 December 2016 Transurban Bank Debt1 Capital Markets Debt1 Government Debt1 Non-Recourse Sydney M5 A$0.7B M7 A$1.1B M7 AMTN A$0.5B M2 A$0.8B Corporate Debt Brisbane GWA Capital Markets CCT A$0.3B AMTN A$0.7B LCT Term Debt A$0.2B USPP US$1.1B A$0.2B PABs US$0.2B PABs US$0.2B EMTN 1.6B LCT A$0.2B A$ PP A$0.2B TIFIA US$0.8B TIFIA US$0.3B Maple C$0.3B 495 Express Lanes 95 Express Lanes AMTN A$0.3B ED AMTN A$0.3B EMTN CHF$0.4B NOK NOK0.8B ED A$0.2B TQ A$0.9B USPP US$0.8B A$0.1B Airportlink M7 A$1.0B 144A US$1.1B Bank Debt Working Capital2 A$0.9B Debt facilities including undrawn available facilities, in the base currency of debt before hedging. Corporate working capital facilities are bilateral facilities and can be drawn in AUD and/or USD. 55
56 Group debt at 31 December 2016 FACILITY (US$M)1 FACILITY (A$M)1 TOTAL FACILITY (A$M) TOTAL DRAWN (A$M) PROPORTIONAL DRAWN (A$M) STATUTORY DRAWN (A$M) , , , ,709 1,493 6, , ,709 1,493 5, , ,709 1,493 5, , ,705 1,520 5, ,554 2,521 3, ,623 9,234 14,760 3, ,623 1, ,381 18,243 3, ,623 1, ,530 16,562 1, , ,719 13,751 3, , , ,952 CORPORATE DEBT2 Working capital facilities3 USPP AMTN EMTN (CAD, NOK and EUR Notes) 144A TOTAL CORPORATE DEBT Separate letters of credit4 NON-RECOURSE DEBT2 TQ AirportlinkM7 LCT CCT ED M2 M5 M7 495 Express Lanes5 95 Express Lanes5 TOTAL NON-RECOURSE DEBT Other6 TOTAL GROUP DEBT 1. Shown in effective currency after hedging USD debt is converted at the spot exchange rate ($ at 31 Dec 2016) where no cross currency swaps are in place Working capital facilities are bilateral facilities and can be drawn in AUD and/or USD. 6. Issued in relation to corporate, CityLink, ED, M2, CCT, 95 Express Lanes and NCX. Drawn amount includes A$59 million letters of credit issued from working capital facilities. Statutory drawn debt lower than proportional drawn debt due to this debt being carried at fair value following the consolidation of the US assets in June Consists of shareholder loans and net capitalised borrowing costs. 56
57 Drawn debt PROPORTIONAL BASIS AUD1 30 JUN 16 ($M) 31 DEC 16 ($M) MOVEMENT ($M) Corporate 3,668 4, A$733 million 144A issuance, A$117 million NOK issuance, A$133 million USPP matured, A$55 million working capital repayment Non-recourse 5,159 5, Net A$56 million increase in TQ debt as a result of capital markets issuance, capex facility drawdowns, working capital facility drawdowns and repayment of bank debt. CCT debt increased by A$1 million as a result of December refinance, M7 debt increased by A$353 million due to A$500 million M7 AMTN issuance and repayment of A$148 million bank debt. $200 million LCT debt settlement occurred in July 2016 Total 8,827 9,902 1,075 USD2 30 JUN 16 ($M) 31 DEC 16 ($M) MOVEMENT ($M) Corporate Non-recourse 1,534 1, Total 2,506 2, EXPLANATION3 EXPLANATION3 US$5 million additional working capital drawing TIFIA capitalised interest of US$4 million for the 95 Express Lanes and US$17 million for the 495 Express Lanes. US$1.5 million repayment of the 95 Express Lanes TIFIA funding 1. AUD represents debt issued in AUD plus debt that has been issued in CAD, EUR, CHF, NOK and USD and has been swapped back into AUD. Issued letters of credit are not included. 2. USD represents debt issued in USD (including 144A bonds, 95 Express Lanes, 495 Express Lanes and tranche C of the 2006 USPP which was not swapped back to AUD) and debt issued in EUR that has been swapped back in to USD. Issued letters of credit are not included. 3. Amounts will differ to consolidated accounts due to the spot translation used in financial accounts as opposed to the hedged FX rate. The consolidated accounts include external shareholder loans and a fair value measurement on 95 and 495 Express Lanes. M5 and M7 are not included in the consolidated accounts. 57
58 Key debt metrics 30 JUNE 2016 TRANSURBAN GROUP CORPORATE 31 DECEMBER 2016 NONRECOURSE TRANSURBAN GROUP CORPORATE NONRECOURSE Weighted average maturity (years)1 8.7 yrs 5.8 yrs 10.2 yrs3 9.3 yrs 6.3 yrs 10.8 yrs2 Weighted average cost of AUD debt4 5.2% 5.7% 4.9% 4.9% 5.5% 4.5% Weighted average cost of USD debt4 4.3% 4.2% 4.3% 4.3% 4.2% 4.3% Hedged5 99.5% 98.8% 100.0% 99.8% 99.8% 99.9% Gearing (proportional debt to enterprise value)6 33.3% 38.9% FFO/Debt7 8.0% 8.2% 4.3x 4.0x BBB+/Baa1/A- BBB+/Baa1/A- Corporate senior interest cover ratio (historical ratio for 12 months) Corporate debt rating (S&P/Moody s/fitch) 1. Weighted average maturity calculated on full value of drawn funds at AUD value of debt. CAD, CHF, EUR, NOK and USD debt converted at the hedged rate where cross currency swaps are in place. USD debt is converted at the spot exchange rate ($ at 30 June 2016 and $ at 31 December 2016) where no cross currency swaps are in place. 2. The average weighted maturity of Australian non-recourse debt is 6.1 years at 31 December The average weighted maturity of Australian non-recourse debt is 5.0 years at 30 June Weighted on a proportional drawn debt basis. 5. Hedged percentage comprises fixed rate debt and floating debt that has been hedged and is a weighted average of total proportional drawn debt in AUD. 6. Proportional drawn debt exclusive of issued letters of credit. Debt in AUD, CAD, CHF, EUR, NOK and USD debt converted at the hedged rate where cross currency swaps are in place. USD debt is converted at the spot exchange rate ($ at 30 June 2016 and $ at 31 December 2016) where no cross currency swaps are in place.the security price was $11.99 at 30 June 2016 and $10.32 at 31 December 2016 with 2,036 million securities on issue at 30 June 2016 and 2,043 million securities on issue at 31 December Based on S&P methodology. The impact of AirportlinkM7 has been annualised. June 2016 FFO/Debt inclusive of tax benefit was 8.6% (AirportlinkM7 annualised). 58
59 Extension of Group debt maturity profile JUNE 2016 MATURITY PROFILE A$ MILLION 4,000 DEBT REFINANCED DURING THE PERIOD 3,000 2,000 1,000 - FY17 FY18 FY19 FY20 FY21 FY22 FY23 FY24 FY25 FY26-29 FY30-34 FY35+ FY21 FY22 FY23 FY24 FY25 FY26-29 FY30-34 FY35+ DECEMBER 2016 MATURITY PROFILE A$ MILLION 4,000 DEBT REFINANCED DURING THE PERIOD 3,000 2,000 1,000 - FY17 FY18 FY19 FY20 1. The full value of debt facilities is shown as this is the value of debt for refinancing purposes. This overstates Transurban s ownership share of the debt. 2. Debt is shown in the financial year in which it matures. 3. Debt values are in AUD as at 31 December CHF and USD debt are converted at the hedged rate where cross currency swaps are in place. 59
60 Corporate debt maturities at 31 December ,000 Working Capital Facilities USPP A$ notes EMTN 144A Letters of Credit 1,800 1,600 A$ MILLION 1,400 1, , FY17 FY18 FY FY FY21 FY22 FY23 FY24 FY25 FY FY27 FY28 FY29 FY30 FY31 FY32-41 FY Debt is shown in the financial year in which it matures. 2. Debt values are in AUD as at 31 December CAD, EUR, NOK and USD debt are converted at the hedged rate where cross currency swaps are in place. 3. USD debt is converted at the spot exchange rate ($ at 31 Dec 2016) where no cross currency swaps are in place. 60
61 Non-recourse debt maturities at 31 December ,400 TQ (incl ALM7) ED 2,200 M2 M7 CCT M5 LCT 495 Express Lanes 95 Express Lanes ,000 1,800 A$ MILLION 1, , , , , The full value of debt facilities is shown as this is the value of debt for refinancing purposes. This overstates Transurban s ownership share of the debt. Debt is shown in the financial year in which it matures. Debt values are in AUD as at 31 December CHF and USD debt are converted at the hedged rate where cross currency swaps are in place. USD debt is converted at the spot exchange rate ($ at 31 Dec 2016) where no cross currency swaps are in place. 95 Express Lanes and 495 Express Lanes maturities show final maturity dates. 61
FY16 RESULTS TRANSURBAN FY16 RESULTS 9 AUGUST 2016
 FY16 RESULTS TRANSURBAN FY16 RESULTS 9 AUGUST 2016 DISCLAIMER AND BASIS OF PREPARATION This publication is prepared by the Transurban Group comprising Transurban Holdings Limited (ACN 098 143 429), Transurban
Disclaimer UNITED STATES
 Disclaimer This publication is prepared by the Transurban Group comprising Transurban Holdings Limited (ACN 098 143 429), Transurban Holding Trust (ARSN 098 807 419) and Transurban International Limited
For personal use only
 asx release 11 February 2016 Transurban Investor Presentation Please find attached the Investor Presentation that will be given to analysts this morning. Julie Galligan Company Secretary For further information
Transurban FY17 proportional EBITDA up 10.1%; customer enhancements and technology driving additional operating improvements for all stakeholders
 8 August 2017 Transurban proportional EBITDA up 10.1%; customer enhancements and technology driving additional operating improvements for all stakeholders highlights: Continued focus on customer experience:
Results for FY18. 7 August 2018
 Results for FY18 7 August 2018 Disclaimer and basis of preparation This publication is prepared by the Transurban Group comprising Transurban Holdings Limited (ACN 098 143 429), Transurban Holding Trust
Results for six months ended 31 December February 2018
 Results for six months ended 31 December 2017 13 February 2018 This publication is prepared by the Transurban Group comprising Transurban Holdings Limited (ACN 098 143 429), Transurban Holding Trust (ARSN
Transurban 1H18 proportional EBITDA up 11.6%
 13 February 2018 highlights: Transurban proportional EBITDA up 11.6% distribution of 28.0 cents per security (cps) FY18 distribution guidance of 56.0 cps, growth of 8.7% over FY17 Continued focus on customer
Transurban FY16 proportional EBITDA up 14.8% and guides to 11% FY17 DPS growth
 9 August 2016 Transurban FY16 proportional EBITDA up 14.8% and guides to 11% FY17 DPS growth FY16 financial highlights: Statutory profit from ordinary activities of $22 million Proportional toll revenue
Transurban 1H16 proportional EBITDA up 14.6% and FY16 DPS guidance upgraded
 11 February 2016 Transurban 1H16 proportional EBITDA up 14.6% and FY16 DPS guidance upgraded 1H16 financial highlights: Statutory profit from ordinary activities of $62 million Proportional toll revenue
Transurban. Investor Day May 2017
 Transurban Investor Day 2017 4 May 2017 Investor Day overview Position, growth and enhancing social licence Scott Charlton Capital positioning for growth Adam Watson Panel Q&A Morning tea North America:
Transurban Group Appendix 4D Half-year ended 31 December 2017 (Previous corresponding period: Half-year ended 31 December 2016)
") Transurban Group Appendix 4D ended 31 December (Previous corresponding period: ended 31 December 2016) The Transurban Group (the Group) comprises the following entities: Results for announcement to the
Transurban Group Appendix 4D ended 31 December (Previous corresponding period: ended 31 December 2016) The Transurban Group (the Group) comprises the following entities: Results for announcement to the
TRANSURBAN 2013 INVESTOR DAY 19 APRIL 2013
 TRANSURBAN 2013 INVESTOR DAY 19 APRIL 2013 DISCLAIMER This publication is prepared by the Transurban Group comprising Transurban Holdings Limited (ACN 098 143 429), Transurban Holding Trust (ARSN 098 807
For personal use only TRANSURBAN 2012 FULL YEAR RESULTS. 7 August 2012
 TRANSURBAN 2012 FULL YEAR RESULTS 7 August 2012 DISCLAIMER This publication is prepared by the Transurban Group comprising Transurban Holdings Limited (ACN 098 143 429), Transurban Holding Trust (ARSN
Tax Transparency Report FY17
 Tax Transparency Report FY17 About Transurban We keep cities moving As cities in Australia and around the world grow, we give them room to move. By partnering with government, we provide effective toll
For personal use only
 Transurban Group Appendix 4D Half-year ended 31 December 2014 (Previous corresponding period: Half-year ended 31 December 2013) The Transurban Group comprises the following entities: Results for announcement
Tax Transparency Report FY16
 Tax Transparency Report FY16 About Transurban We manage and develop urban toll road networks in Australia and the United States of America. We aim to be the partner of choice for governments, communities
TRANSURBAN ANNOUNCES WESTCONNEX ACQUISITION WITH $4.2 BILLION EQUITY RAISING AND FY19 DISTRIBUTION GUIDANCE MAINTAINED AT 59.0 CPS
 NOT FOR DISTRIBUTION OR RELEASE IN THE UNITED STATES 31 August 2018 TRANSURBAN ANNOUNCES WESTCONNEX ACQUISITION WITH $4.2 BILLION EQUITY RAISING AND FY19 DISTRIBUTION GUIDANCE MAINTAINED AT 59.0 CPS Transurban
A25 Acquisition. Montreal, Canada
 A25 Acquisition Montreal, Canada This publication is prepared by the Transurban Group comprising Transurban Holdings Limited (ACN 098 143 429), Transurban Holding Trust (ARSN 098 807 419) and Transurban
Transurban European Debt Investor Roadshow
 asx release 10 October 2011 Transurban European Debt Investor Roadshow Attached is a presentation that Transurban is using this week on a European debt investor roadshow. The roadshow is being undertaken
For personal use only
 NOT FOR RELEASE OR DISTRIBUTION IN THE UNITED STATES 12 December 2017 TRANSURBAN ANNOUNCES CONTRACTUAL CLOSE ON THE WEST GATE TUNNEL PROJECT, $1.9 BILLION EQUITY RAISING AND FINANCIAL CLOSE OF $550 MILLION
West Gate Tunnel Project
 West Gate Tunnel Project Transurban equity raising 12 December 2017 NOT FOR RELEASE OR DISTRIBUTION IN THE UNITED STATES OF AMERICA Disclaimer This investor presentation ( Presentation ) has been prepared
Transurban Group. No change to broader trend A$11.90 AUSTRALIA. Event. Impact. Earnings and target price revision. Price catalyst
 AUSTRALIA TCL AU Price (at CLOSE#, 09 Aug 2016) Outperform A$11.90 Valuation A$ - DCF (WACC 7.0%, beta 0.8, ERP 5.0%, RFR 3.2%) 11.91 12-month target A$ 12.34 12-month TSR % +8.1 Volatility Index Low GICS
Report Transurban. FY18 Sustainability. Data Report
 FY18 Sustainability Report Transurban FY18 Sustainability Data Report FY18 Sustainability Data Report FY18 SUSTAINABILITY DATA REPORT In this Sustainability Data Report appendix we provide detailed information
13 APRIL WestConnex M4 East, New South Wales. Refer to ASX/Media Release for further information
 ANALYST AND INVESTOR PRESENTATION 1Q17 RESULTS Marcelino Fernández Verdes, Executive Chairman Adolfo Valderas, Chief Executive Officer Angel Muriel, Chief Financial Officer WestConnex M4 East, New South
For personal use only
 5 February 2013 RESULTS FOR THE SIX MONTHS ENDED 31 DECEMBER 2012 Transurban has today announced its financial results for the six months 31 December 2012, delivering another set of solid financial results
Transurban (TCL.AX / TCL AU)
") Asia Pacific/Australia Equity Research Highways & Railtracks Rating OUTPERFORM Price (16-Jan,A$) 10.37 Target Price (A$) 12.50 Target price ESG risk (%) NA Market cap (A$mn) 21,183.3 Yr avg. mthly trading
Asia Pacific/Australia Equity Research Highways & Railtracks Rating OUTPERFORM Price (16-Jan,A$) 10.37 Target Price (A$) 12.50 Target price ESG risk (%) NA Market cap (A$mn) 21,183.3 Yr avg. mthly trading
MORGANS BUSINESS BREAKFAST SCOTT CHARLTON, TRANSURBAN CEO 19 FEBRUARY 2014
 MORGANS BUSINESS BREAKFAST SCOTT CHARLTON, TRANSURBAN CEO 19 FEBRUARY 2014 DISCLAIMER & BASIS OF PREPARATION This publication is prepared by the Transurban Group comprising Transurban Holdings Limited
For personal use only
 24 April 2014 TRANSURBAN ANNOUNCES ACQUISITION OF QUEENSLAND MOTORWAYS AND EQUITY RAISING Transurban-led consortium to acquire Queensland Motorways for $6.673 billion, plus stamp duty and transaction costs
SOUTHERN CROSS AUSTEREO
 SOUTHERN CROSS AUSTEREO H1 FY15 INVESTOR PRESENTATION 25 FEBRUARY 2015 DISCLAIMER Summary information The material in this presentation has been prepared by Southern Cross Media Group Limited ABN 91 116
Lendlease Presentation at CLSA Investors Forum
 13 September 2018 Lendlease Presentation at CLSA Investors Forum Attached is the presentation to be given by Lendlease Group Chief Executive Officer and Managing Director, Steve McCann at today s CLSA
For personal use only
 SUMMARY OF 1H19 GROUP OUTCOMES Strong first half performance UNDERLYING PROFIT BEFORE TAX (UPBT) 1H19 $112.3m up $30.4m on 1H18 Highest 1H underlying result in 11 years Delivered despite $88.2m fuel and
For personal use only
 FY15 FULL YEAR RESULTS REVIEW Progressing to plan Agenda GROUP RESULTS OVERVIEW BUSINESS UNIT REVIEW OUTLOOK 150 Collins Street, Westpac Building. Mechanical work was completed by Allstaff Airconditioning
2017 FULL YEAR RESULTS
 2017 FULL YEAR RESULTS ESTABLISHING LEADING POSITIONS IN NEW GROWTH SECTORS Malcolm Bundey Managing Director and CEO Richard Betts Chief Financial Officer 16 August 2017 Pact Group Holdings Ltd ABN: 55
The Everton Park Hotel, Brisbane
 The Everton Park Hotel, Brisbane Annual Results Briefing 30 June 2017 Important Notice This presentation has been prepared by Hotel Property Investments Limited as Responsible Entity of the Hotel Property
2017 CLSA Investors Forum
 2017 CLSA Investors Forum Steve McCann Chief Executive Officer and Managing Director Lendlease 14 September 2017 2 Vision: to create the best places Strategic framework Business model Competitive advantage
2017 Half-Year Results
 2017 Half-Year Results Martin Earp, CEO Josée Lemoine, CFO 16 August 2017 Financials Pillars of Growth Summary of Performance H1 2017 Sales Revenue $218.2m 1.7% Demographics Deaths 1 2.8% Australia $44.1m
1H18 RESULTS 6 MONTHS ENDED 31 DECEMBER 2017
 1H18 RESULTS 6 MONTHS ENDED 31 DECEMBER 2017 GROUP RESULTS 2 GROWTH IN PROFIT AND FCF Group Underlying 1 Reported 2 1H 2018 1H 2017 1H 2018 1H 2017 Revenue 856.5 808.7 856.5 808.7 EBIT 81.3 81.9 61.6 61.1
FY17 RESULTS. Tuesday 20 February 2018
 FY17 RESULTS Tuesday 20 February 2018 Agenda 2017 Highlights Results 2018 Observations Out-of-Home industry APN Outdoor Contract renewals Focus and objectives Trading update 2 2017 Highlights 3 2017 highlights
Bell Potter Emerging Leaders Conference
 Bell Potter Emerging Leaders Conference Sydney, 24 October 2017 Leon Allen, Managing Director and CEO Disclaimer This presentation has been prepared by QANTM Intellectual Property Limited ACN 612 441 326
FY2017 Result Presentation. 21 August 2017
 FY2017 Result Presentation 21 August 2017 The Hansen journey growing and diversifying by geography, industry, propriety products and customer Early 1990 s Today Revenue by geography Industry verticals
Macquarie Atlas Roads. Management Information Report 31 December 2017
 Macquarie Atlas Roads Management Information Report 31 December 2017 Management Information Report for the year ended 31 December 2017 Page 2 of 27 Disclaimer Macquarie Atlas Roads ( MQA or the Group )
Business Update. USPP Conference Miami. Luis Damasceno Group CFO Michael Williams Group Finance Director & Treasurer January 2019
 Business Update USPP Conference Miami Luis Damasceno Group CFO Michael Williams Group Finance Director & Treasurer 23-25 January 2019 www.alsglobal.com IMPORTANT NOTICE AND DISCLAIMER This presentation
Interim FY 2015 results 6 months ended 31 December February 2015
 Interim FY 2015 results 31 December 2014 18 February 2015 Highlights Solid trading result for 1H FY2015; change in accounting policy for acquisition of healthcare practices First half result highlights
16.1c c c
 1 2016 Interim Result Highlights Successful delivery, ahead of PDS 2 Exceeded revised earnings guidance Six months to 31 Dec 15 Solid capital management 7.97c 7.65c $2.15 28.3% Earnings per unit Distribution
SKYCITY Entertainment Group Limited
 SKYCITY Entertainment Group Limited 1H18 Results Investor Presentation 9 February 2018 Disclaimer All information included in this presentation is provided as at 9 February 2018 This presentation includes
Macquarie Atlas Roads Macquarie Australia Conference. May 2014
 Macquarie Atlas Roads Macquarie Australia Conference May 2014 Important t notice and disclaimer i Disclaimer Macquarie Atlas Roads (MQA) comprises Macquarie Atlas Roads Limited (ACN 141 075 201) (MARL)
Financial Results Half year ended 31 December February 2012
 Financial Results Half year ended 31 December 2011 22 February 2012 Result overview and strategic highlights Mick McCormack Managing Director and CEO 1H 2012 Results Presentation 2 Delivering on strategy
AUSTRALIAN SECURITIES AND INVESTMENTS COMMISSION REGULATORY GUIDE 231: Infrastructure entities: Improving disclosure for retail investors
 BENCHMARKS Benchmark 1: Corporate structure and management The infrastructure entity s corporate governance policies and practices conform with the principles and recommendations in GN 9A. Benchmark 2:
HALF YEAR RESULTS PRESENTATION
 ASX Announcement 16 February 2016 HALF YEAR RESULTS PRESENTATION Attached is the presentation regarding the financial results of The Star Entertainment Group Limited (The Star Entertainment Group) for
7 February Canberra Light Rail Stage One PPP, Australian Capital Territory, Pacific Partnerships, CPB Contractors and UGL.
 ANALYST AND INVESTOR PRESENTATION FULL YEAR RESULTS 2017 Marcelino Fernández Verdes, Executive Chairman Michael Wright, Chief Executive Officer Stefan Camphausen, Chief Financial Officer Canberra Light
FINANCIAL & OPERATIONAL RESULTS
 FINANCIAL & OPERATIONAL RESULTS HALF YEAR ENDED 31 DECEMBER 2016 24 February 2017 DISCLAIMER This presentation contains forward-looking statements. Forward-looking statements often include words such as
FAQ s on Free-Flow Tolling on SEQ Roads
 FAQ s on Free-Flow Tolling on SEQ Roads A free-flow tolling system was introduced in south-east Queensland (SEQ) in July 2009, with the removal of cash lanes and toll booths from the Gateway and Logan
For personal use only
 AGENDA 10-20 Bond Street: Chillers with variable speed drives BSA RESULTS AND OVERVIEW FINANCIAL REVIEW BUSINESS UNIT REVIEW SUMMARY 2 BSA RESULTS Fiona Stanley Hospital: Central Energy Services Plant
Directors Report and Financial Statements for the year ended 30 June 2016
 Directors Report and Financial Statements for the year ended 30 June Sydney Motorway Corporation Pty Limited ABN 47 601 507 591 and its Controlled Entities Directors Report and Financial Statements 3
Qube delivers revenue and earnings growth while completing strategic acquisitions for the future
 23 August 2017 ASX Announcement Qube delivers revenue and earnings growth while completing strategic acquisitions for the future Both operating divisions up and Moorebank on track with Target Australia
For personal use only
 10 February 2016 133 Castlereagh Street Sydney NSW 2000 www.stockland.com T 02 9035 2000 F 02 8988 2552 For media enquiries Greg Spears Senior Manager Media Relations Stockland T +61 (0)2 9035 3263 M +61
Financial Year 1H19 Results
 Financial Year 1H19 Results Investor presentation 20 November 2018 1 Agenda 1. 1H19 Summary 2. 1H19 Financial results 3. FY19 Outlook 4. Q&A 5. Appendix 2 1H19 Summary Skander Malcolm Chief Executive Officer
AUSTRALIAN SECURITIES AND INVESTMENTS COMMISSION REGULATORY GUIDE 231: Infrastructure entities: Improving disclosure for retail investors
 BENCHMARKS Benchmark 1: Corporate structure and management The infrastructure entity s corporate governance policies and practices conform with the principles and recommendations in GN 9A. Benchmark 2:
For personal use only
 23 August 2013 Full Year Results June 2013 We attach an Investor Presentation for the FY13 Full Year Results. As previously announced, a results briefing for analysts will be held at 10:30am Sydney time
AIRBUS H1 Results 2018
 AIRBUS H1 Results 2018 26 July 2018 Tom Enders Chief Executive Officer Harald Wilhelm Chief Financial Officer SAFE HARBOUR STATEMENT 2 DISCLAIMER This presentation includes forward-looking statements.
For personal use only
 Financial Results Half Year FY18 Ivan Slavich Chief Executive Officer Energy Action Limited Michael Fahey Chief Operating Officer & Chief Financial Officer Energy Action Limited Half Year FY18 Results
RESULTS FOR ANNOUNCEMENT TO THE MARKET
 Friday, 21 August 2015 RESULTS FOR ANNOUNCEMENT TO THE MARKET In accordance with the listing rules, please find attached the following documents relating to ERM Power s results for the 12 months ended
PRODUCT DISCLOSURE STATEMENT
 PRODUCT DISCLOSURE STATEMENT AIRPORT LINK PROJECT THE ISSUER BrisConnections Management Company Limited (ABN 67 128 614 291 AFSL 322 275) For the Offer of approximately 408.67 million Stapled Units in
FY19 half year results
 FY19 half year results For the six months ended 31 December 2018 14 February 2019 Gordon Ballantyne Managing Director & Chief Executive Officer Michael Sammells Chief Financial Officer 1 1HFY19 returned
For personal use only
 FY18 Half Year Results For the six months ended 31 December 2017 21 February 2018 Disclaimer Forward looking statements This presentation contains certain forward-looking statements, including with respect
Cover-More Group. UBS Australasia Conference. November 2015
 Cover-More Group UBS Australasia Conference November 2015 Executive summary: FY15 overview Cover-More delivered another year of double digit earnings growth, with offshore business growing substantially.
Q Supplemental Information Quarter ended September 30
 Q3 2015 Supplemental Information Quarter ended NYSE: BIP TSX: BIP.UN CAUTIONARY STATEMENT REGARDING FORWARD-LOOKING STATEMENTS 1 This Supplemental Information contains forward-looking information within
For personal use only
 Thursday, 25 August 2016 FY 2016 FULL YEAR RESULTS ANNOUNCEMENT AND PRESENTATION Please find attached the following documents relating to ERM Power s results for the 12 months ended 30 June 2016: 1. ASX
SKYCITY Entertainment Group Limited. FY16 Full-Year Result Presentation 10 August SKYCITY Entertainment Group Limited
 SKYCITY Entertainment Group Limited FY16 Full-Year Result Presentation 10 August 2016 SKYCITY Entertainment Group Limited Disclaimer All information included in this presentation is provided as at 10 August
The attached Revised FY2018 Results Presentation corrects this error.
 29 November 2018 Company Announcements Office Australian Securities Exchange Limited Exchange Centre 20 Bridge Street Sydney NSW 2000 Aristocrat Leisure Limited Formatting Error Revised FY2018 Results
17 April Genex Power s Kidston Solar Farm, Queensland, UGL. Refer to ASX/Media Release for further information
 ANALYST AND INVESTOR PRESENTATION 1Q RESULTS 2018 Marcelino Fernández Verdes, Executive Chairman Michael Wright, Chief Executive Officer Stefan Camphausen, Chief Financial Officer Genex Power s Kidston
For personal use only
 G8 Education Full Year Results Presentation Year Ended 31 December 2016 G8 Education Limited (ASX:GEM) 20 February 2017 Key Messages 2016 Revenue up 10.2% from prior year driven by fee increases and acquisitions
2016 FINANCIAL YEAR RESULTS PRESENTATION
 2016 FINANCIAL YEAR RESULTS PRESENTATION 22 August 2016 www.industriareit.com.au ASX CODE: IDR Agenda 01 Highlights and Investment Proposition 02 Financial results 03 Portfolio performance 04 Capital management
BROOKFIELD INFRASTRUCTURE PARTNERS L.P. Q Supplemental Information
 BROOKFIELD INFRASTRUCTURE PARTNERS L.P. Q1 2017 Supplemental Information First Quarter, March 31, 2017 Cautionary Statement Regarding Forward-Looking Statements This Supplemental Information contains forward-looking
Full year results 2017.
 CORPORATE TRAVEL MANAGEMENT Full year results 2017. Presented by: Jamie Pherous, Founder & Managing Director Date: 22 nd August 2017 PAGE 2 Disclaimer. The information in this presentation does not constitute
Australian Education Trust
 Australian Education Trust ASX ANNOUNCEMENT 18 February 2014 AET Results for the Half-Year Ended 31 December 2013 Folkestone Investment Management Limited (FIML) as the Responsible Entity of the Australian
AUSTRALIAN PHARMACEUTICAL INDUSTRIES LIMITED HALF YEAR FY14 RESULTS PRESENTATION WEDNESDAY 30 APRIL 2014
 AUSTRALIAN PHARMACEUTICAL INDUSTRIES LIMITED HALF YEAR FY14 RESULTS PRESENTATION WEDNESDAY 30 APRIL 2014 Important Notice The material in this presentation is of general information about API s activities
1H18 Results Presentation Sid Takla Interim Chief Executive Officer Lyndal York Chief Financial Officer
 1H18 Results Presentation Sid Takla Interim Chief Executive Officer Lyndal York Chief Financial Officer 21 August 2018 Important Notice and Disclaimer This presentation has been prepared by Asaleo Care
1H 19 Investor Presentation February 2019
 1H 19 Investor Presentation February 2019 1 About Raiz Raiz (formerly Acorns) is a mobile first micro-investing platform via mobile phone or web app, which allows customers to invest in a portfolio of
Suncorp Group Limited ABN
 Suncorp Group Limited ABN 66 145 290 124 Financial results for the full year ended 30 June 2013 Basis of preparation Suncorp Group ( Group, the Group or Suncorp ) is represented by Suncorp Group Limited
For personal use only
 asx release 4 September Annual Report Please find attached the Annual Report. The report will be mailed to those security holders who have elected to receive a hard copy. The report is also available online
H1 16 interim results. 22 September 2015
 H1 16 interim results 22 September 2015 Important notice 2 This presentation may include certain forward-looking statements, beliefs or opinions, including statements with respect to the Company s business,
2019 Half Year Investor Presentation Andrew Burnes CEO Michael Burnett CFO
 2019 Half Year Investor Presentation Andrew Burnes CEO Michael Burnett CFO Disclaimer The information contained in these materials or discussed at the presentation is not intended to be an offer for subscription,
For personal use only
 HY14 Results 15 May 2014 Disclaimer This presentation includes both information that is historical in character and information that consists of forward looking statements. Forward looking statements are
Qube Holdings Limited
 Qube Holdings Limited Investor Presentation FY 18 Interim Results 1 Disclaimer Important Notice ABN 141 497 230 53 The information contained in this Presentation or subsequently provided to the recipient
A S X A N N O U N C E M E N T
 A S X A N N O U N C E M E N T DATE: 24 February 2016 Attached is the Presentation regarding Pact s Half year Financial Results for the half year ended 31 December 2015. The Presentation will occur at 10am
Photo by James Ball - Coffey International Limited FY2013 Half Year Results Presentation. 11 February 2013
 Photo by James Ball - www.dlscape.com Coffey International Limited FY2013 Half Year Results Presentation 11 February 2013 Agenda Financial Performance Business Performance Outlook Presenters John Douglas
ASX Release MONDAY 18 FEBRUARY 2019 WESTPAC 1Q19 UPDATE AND PILLAR 3 REPORT
 ASX Release MONDAY 18 FEBRUARY 2019 WESTPAC 1Q19 UPDATE AND PILLAR 3 REPORT Westpac Banking Corporation has today released its Pillar 3 report for December 2018, along with slides providing further detail
SCA PROPERTY GROUP ANNOUNCES FIRST HALF FY19 RESULTS
 MEDIA ANNOUNCEMENT 4 February 2019 SCA PROPERTY GROUP ANNOUNCES FIRST HALF FY19 RESULTS SCA Property Group (ASX: SCP) ( SCP or the Group ) is pleased to announce its results for the six months ended 31
Qube Holdings Limited Investor Presentation FY 16 Interim Results
 Qube Holdings Limited Investor Presentation FY 16 Interim Results 1 Disclaimer Important Notice ABN 141 497 230 53 The information contained in this Presentation or subsequently provided to the recipient
BROOKFIELD INFRASTRUCTURE PARTNERS L.P. Q Supplemental Information
 BROOKFIELD INFRASTRUCTURE PARTNERS L.P. Q2 2018 Supplemental Information Second Quarter,, 2018 Cautionary Statement Regarding Forward-Looking Statements This Supplemental Information contains forward-looking
Transpacific FY15 Half Year Results Presentation
 Transpacific FY15 Half Year Results Presentation Robert Boucher CEO Brendan Gill CFO 20 February 2015 - Disclaimer Forward looking statements - This presentation contains certain forward-looking statements,
Sonic Healthcare Limited ABN
 ABN 24 004 196 909 PRELIMINARY FINAL REPORT FOR THE YEAR ENDED 30 JUNE Lodged with the ASX under Listing Rule 4.3A Page 1 of 21 RESULTS FOR ANNOUNCEMENT TO THE MARKET For the year ended Financial Results
INFIGEN ENERGY FY16 FULL YEAR RESULTS
 29 August 2016 INFIGEN ENERGY FY16 FULL YEAR RESULTS Infigen Energy (ASX: IFN) today announced its financial and operational results for the year ended 30 June 2016 (FY16). Infigen reported a statutory
PMP LIMITED INVESTOR PRESENTATION. Results for the 12 months ended 30 June August Peter George, CEO Geoff Stephenson, CFO
 PMP LIMITED ABN 39 050 148 644 Results for the 12 months ended 30 June 2017 28 August 2017 Peter George, CEO Geoff Stephenson, CFO INVESTOR PRESENTATION 2017 FULL YEAR RESULTS Contents Pages Delivering
FULL YEAR RESULTS 2016
 FULL YEAR RESULTS 2016 Disclaimer The material in this presentation is a summary of the results of nib holdings limited (nib) for the 12 months ended 30 June 2016 and an update on nib s activities and
For personal use only
 Click to edit Master text styles IDP Education FY16 Results Presentation Twelve months to 30 June 2016 11 February 2016 Important notice and disclaimer Click Disclaimer to edit Master text styles The material
FY18 1 ST HALF RESULTS
 26 FEBRUARY 2018 FY18 1 ST HALF RESULTS Chief Executive Officer : Chief Financial Officer : John Croll James Orlando isentia.com AGENDA Overview of H1 FY18 Results Strategic Focus H1 FY18 Financial Performance
Please find attached Presenters Notes for the Presentation of Results for the financial half-year ended 31 December 2017.
 21 February 2018 Company Announcements Office Australian Securities Exchange Limited Level 6, 20 Bridge Street Sydney NSW 2000 By electronic lodgment Total Pages: 12 (including covering letter) Dear Sir
BROOKFIELD INFRASTRUCTURE PARTNERS L.P. Q Supplemental Information
 BROOKFIELD INFRASTRUCTURE PARTNERS L.P. Q3 2018 Supplemental Information Third Quarter,, 2018 Cautionary Statement Regarding Forward-Looking Statements This Supplemental Information contains forward-looking