COLBÚN S PRESENTATION BICE INVERSIONES CORREDORA DE BOLSA S.A. SEPTEMBER 2015
|
|
|
- Toby Hutchinson
- 5 years ago
- Views:
Transcription


1 COLBÚN S PRESENTATION BICE INVERSIONES CORREDORA DE BOLSA S.A. SEPTEMBER 215 1
2 2 AGENDA SIC COLBUN PROJECTS
3 Spot Market Price USD/MWh Annual Power Generation SIC TWh 3 GENERATION AND PRICE EVOLUTION IN CHILE S CENTRAL GRID Development based on hydro + competitive natural gas Power purchase agreements signed under fixed prices (set by regulator for distribution clients) LNG re-gasification terminal since 29 Coal- fired power plants PPA tenders with price indexation Others Diesel-Fuel LNG Coal Gas Hydro Average Spot Market Price USD/MWh Jan Feb Mar Apr May Jun Jul Aug Sep Oct Nov Dec
4 jan-14 feb-14 mar-14 apr-14 may-14 jun-14 jul-14 aug-14 sep-14 oct-14 nov-14 dec-14 jan-15 feb-15 mar-15 apr-15 may-15 jun-15 jul-15 aug-15 4 SIC OVERVIEW 1 2 Others 7% Diesel 7% Natural Gas 2% Coal 29% Generation Matrix Hydro 37% Natural Gas 22% Others Diesel 9% 4% Coal 27% Hydro 38% Marginal Cost Monthly Average (USD/MWh) Acc Aug Acc Aug Aug14 Aug15 3 SIC Reservoir water level as % of 4 total capacity 4% 2% % aug14-aug15 aug13-aug14 7% 6% 5% 4% 3% 2% 1% % Electricity Demand Growth (YoY) 2.3% Graphs Sources: 1), 2), 3), 4) CNE and CDEC-SIC.
 214 215 144 29 Armerillo (mm) 214 215 1,647 1,497 2 4 Melting Forecast at Maule (m3/s) Abanico (mm) 214 215 1,665 1,487 3 2 1 215 214")
5 5 HYDROLOGICAL CONDITIONS 1 Colbún Hydro Generation (GWh) Acc. Rainfalls Aug14/Aug Acc. Aug14: 3,915 Acc. Aug15: 3, Aug15 LTM Los Quilos (mm) Armerillo (mm) ,647 1, Melting Forecast at Maule (m3/s) Abanico (mm) ,665 1, Canutillar (mm) ,599 2,478 Oct Nov Dec Jan Feb Mar Source: Colbún.
6 6 END OF HIGH COMMODITY PRICES 1 12 WTI (US$/Barrel) 2 6, HENRY HUB (US$/MMBTU) 11 5,5 1 5, 9 4, , 3,5 3, 6 2,5 5 2, 4 1,5
7 7 POWER DEMAND FORECAST FOR CHILE IS DECREASING % 5.9% % % 4.6% % CNE Apr 15 CNE Apr 14 CNE Oct 13 IEA 212 IEA 29
8 8 ELECTRIC POWER GROWTH POTENTIAL 1 MWh/ person Annual Electricity per Capita Consumption Graphs Sources:)Wolrd Bank. 8
9 9 AGENDA SIC COLBUN PROJECTS
 Reservoir: 1,57 Run-of-the-river: 532 CCGT/Peaking: 1,347 Coal: 342 Wind Farm: 46* Biomass: 26* *Through PPAs Main Figures As")

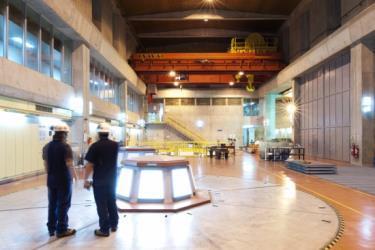
10 1 OVERVIEW Installed capacity of 3,278 MW ~ 21% Market Share / 25% by Generation Dec214 Gx. Asset Diversification (MW) Reservoir: 1,57 Run-of-the-river: 532 CCGT/Peaking: 1,347 Coal: 342 Wind Farm: 46* Biomass: 26* *Through PPAs Main Figures As of Jun15 (US$ million) Assets: 6,4 Equity: 3,4 Mkt Cap: 4,9 EBITDA LTM: 55 Net Debt: 965 Ownership 24% 17% Matte Group Pension Funds 1% 49% Tx. Assets ~9 Km 27 Substations Angelini Group Others Intern. Ratings Fitch: BBB S&P: BBB- Local Ratings Fitch: A+ Humphreys: AA- Committed Controlling Group High Standards of Corporate Governance 2 out of 9 female directors 1


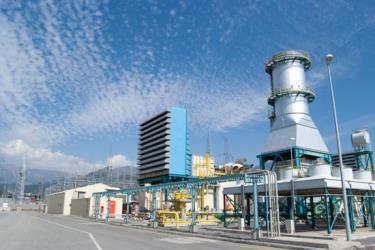
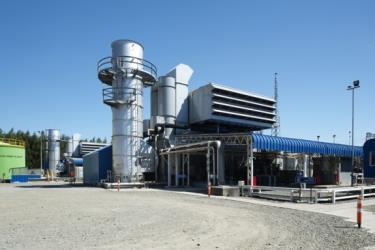
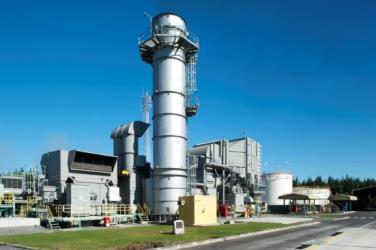
11 11 COLBUN IS THE SECOND LARGEST GENERATOR IN THE SIC With over 3.2 TW of World Class Facilities 48% Hydro 1,589 MW 532 MW Run-of-the-river 33% 1,57 MW Reservoir 67% 3,278 MW 52% Thermal 1,689 MW 766 MW CCGT 45% 342 MW Coal 2% 581 MW Diesel 35% 11
12 12 COMMERCIAL STRATEGY 1 MW Capacity (MW) & *Estimated Generation (TWh/year) Breakdown 3.5 3,278 MW 19.5 TWh 12. TWh , (*) Under medium hydrological conditions. Capacity (MW) Generation (TWh/year) Contracted Sales Hydro Coal CCGT Diesel/Gas Peaking Diesel/Gas This graph is shown for illustrative purposes and represents estimated and potential output of our power plants and approximate level of contractual commitments. Real output from our power plants and variable production costs are dependent on many factors, such as hydrology, plant availability, access to fuels (coal and LNG) and commodity prices, among others. 12
13 13 COMMERCIAL POSITION GWh ,24 2,242 9,85 2,893 Contractual Sales vs. Generation (GWh) ,655 1, , ,11 3,74 3,234 4,431 3,794 4,47 2,623 2,69 4% 35% 3% 25% ,853 2,616 6,912 7,224 6,655 7,24 6,38 7,47 5,233 4,857 2% 15% 1% 5% Q15 LTM Hydro Coal LNG Diesel % Regulated Sales Unregulated Sales EBITDA Mg Graph Source: Colbun. Unregulated Sales 213 & 214 excludes sales to Codelco at Marginal Cost 13

14 14 LEVERAGING OUR COMBINED CYCLES 1 Contracted Gas Generation: Metrogas and ENAP (GWh) Regasification Capacity (GWh) , 2,5 2,5 2, 2, 2,5 1.5 Optional Long- term flexible gas price, providing flexibility to our LNG production Good complement to hydro and coal 14
15 15 HIGH QUALITY CLIENTS 1 2 Sales by Type of Costumer (%) Sales Volume by Customer (%) Unregulated Regulated 61% 39% Codelco (A/A+) 29% Chilectra (BBB+/BBB+ )* 21% CGED (Local A+) 19% Others 5% AngloAmeric an (BBB/BBB+) 9% Saesa (Local AA) 17% Historic Sales by Type of Costumer (GWh) Q15 LTM Regulated customers Unregulated customers Average Monomic Price (US$/MWh) Regulated Costumers Unregulated Costumers Graphs Sources: 1), 2), 3), 4) Colbun as of June15 LTM. 4) Average monomic prices are calculated by dividing the total amount of sales in US$, by physical energy sales in MWh.
16 1Q11 2Q11 3Q11 4Q11 1Q12 2Q12 3Q12 4Q12 1Q13 2Q13 3Q13 4Q13 1Q14 2Q14 3Q14 4Q14 1Q15 2Q15 16 MAIN FIGURES AND METRICS 1 2 Operating Revenues (US$ million) 2. 1, ,49 1,53 1, EBITDA (US$ million) & EBITDA Mg (%) % 37% 287 2% 21% 5% 4% 3% 2% 1% Q15 LTM Q15 LTM % Quarterly EBITDA (US$ million) Source: Colbún s Financial Statements Net Income (US$ million) Tax Reform HidroAysén Q15 LTM HidroAysén
 Calculated as Liabilities/Equity 6 5 4 3 2 1 Cash Flow (US$ million) Capex EBITDA 212 213 214 2Q15 LTM")
17 17 MAIN FIGURES AND METRICS Debt & Net Debt (US$ million) Debt Net Debt Q Net Debt / EBITDA Q15 LTM 3 4 Leverage Ratio* (%) Q15 Source: Colbún s Financial Statements. (*) Calculated as Liabilities/Equity Cash Flow (US$ million) Capex EBITDA Q15 LTM
 BANKS 22% Debt Profile Type Currency Interest Rate BONDS 78% UF 9% USD 91% FIXED 1% 2 8 Amortization Structure (US$ million) 3")
18 18 DEBT AND LIQUIDITY 1 Total Debt: MMUS$ 1,877 Avrg. Maturity: 6. years Avrg. USD Interest Rate: 4.9% Cash: MMUS$ 913 Net Debt: MMUS$ 965 Dividend Policy 3% (As of Jun15) BANKS 22% Debt Profile Type Currency Interest Rate BONDS 78% UF 9% USD 91% FIXED 1% 2 8 Amortization Structure (US$ million) 3 Banks Bonds Avg. MMUS$ 5 for the next 3 years Avg. Maturity: 6. years Source: Colbún s Financial Statements
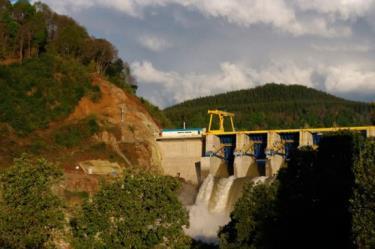
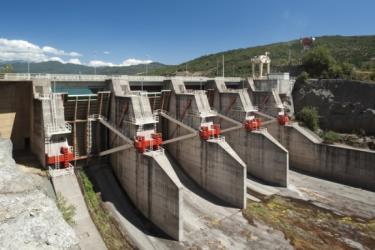
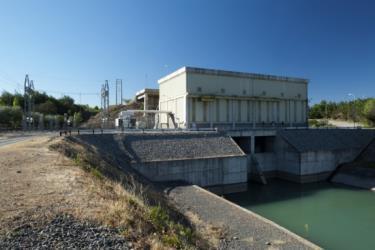
19 19 ~9 MW OF NEW CAPACITY WITH OVER 2 BILLION INVESTED 1 MW 3.5 Colbún Installed Capacity Angostura 316 MW 3, ,37 Quilleco 71 MW Chiburgo 19 MW Hornitos 55 MW Santa María I 35 MW San Clemente Los Pinos 5 MW 1 MW Total a Total a Dic. 26 Dic % Hydro 1,589 MW 52% Thermo 1,689 MW
20 2 RELEVANT ASSETS FOR THE POWER SYSTEM 1 2 Angostura s Figures Capacity : 316 MW Expected Annual Gx.: 1,5 GWh 214 Availability: 97% CAPEX (Including Tx. Lines):~ MMUS$76 Start up: Abr14 46 families reallocated Angostura Generation (GWh) Q 2Q 3Q 4Q Santa María I s Figures Capacity: 342 MW Expected Annual Gx: 2,5 GWh CAPEX (Including the Tx line):~ MMUS$ 75 Start up: Aug Santa María I Generation (GWh) 96 1,853 2,616 2,623 2, Q15 LTM
21 21 AGENDA SIC COLBUN PROJECTS


22 22 GROWTH OPPORTUNITIES IN CHILE IV V RM VI VII Hydro Coal 5 MW equivalent of water rights under study NCRE under study VIII 34 MW La Mina Run-of-the-river / NCRE IX XIV X 35 MW Santa María II Coal ~17 MW San Pedro Reservoir

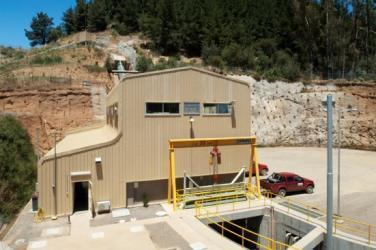
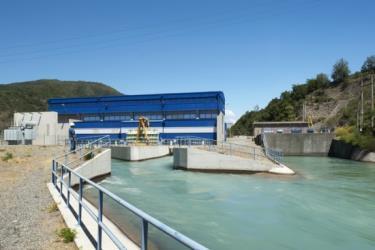
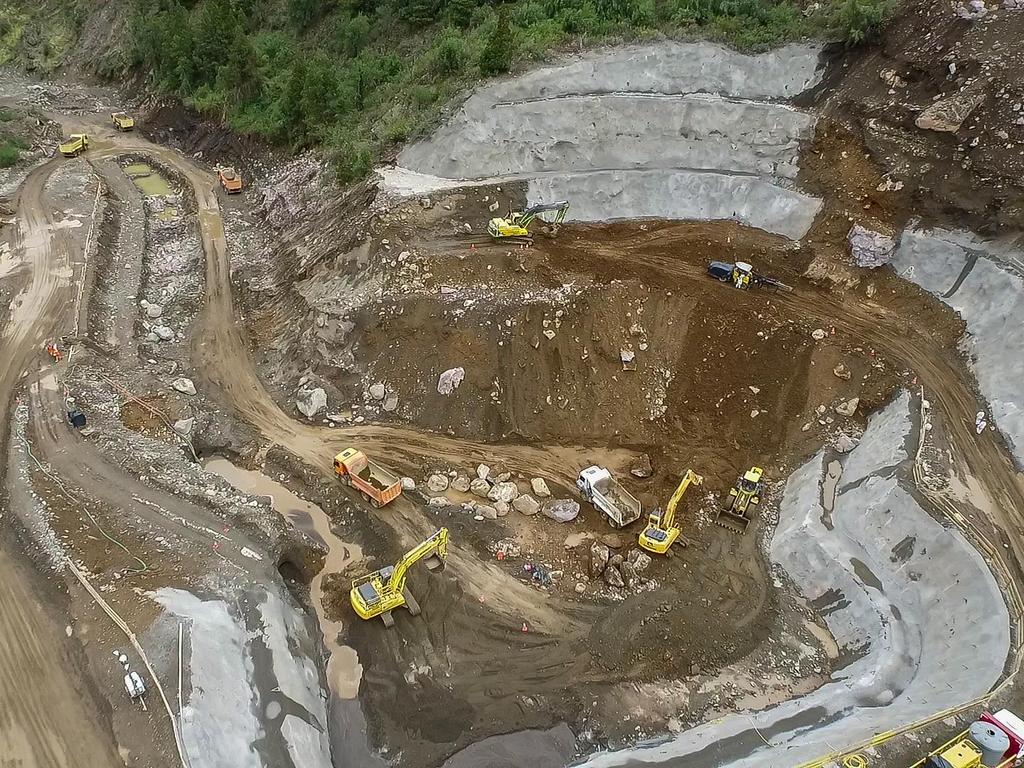
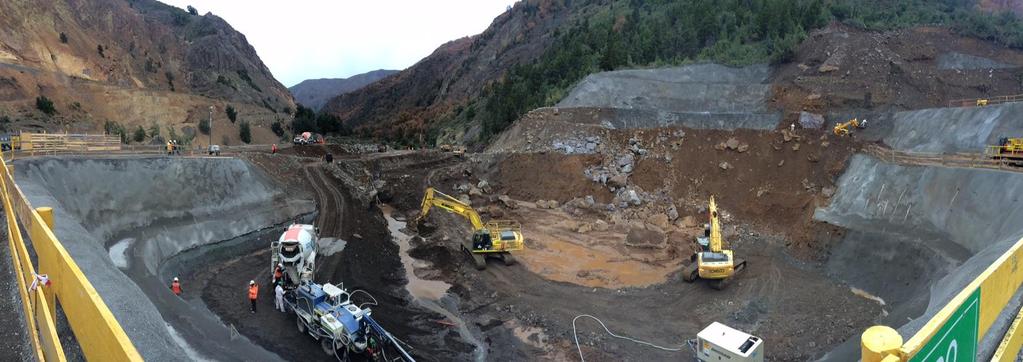
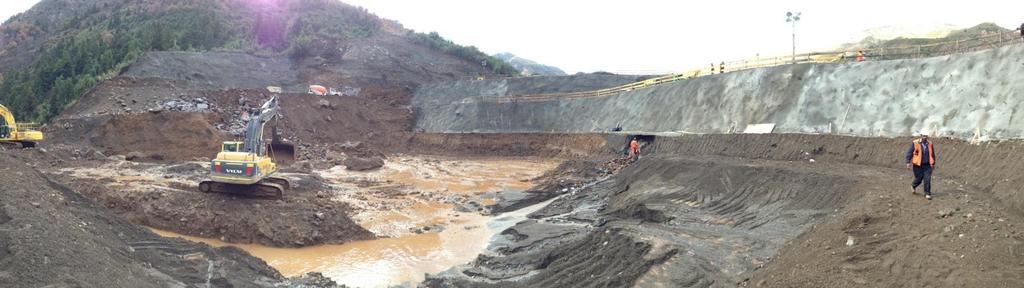
23 23 LA MINA CONSTRUCTION SITE 34 MW of Installed Capacity and 19 GWh of expected annual generation Under construction since Dec14 and to date is on schedule Expected to be commissioned in early 217
24 24
25 25

26 26 SAN PEDRO HYDROELECTRIC PROJECT Panguipulli Lake Riñihue Lake San Pedro reservoir Project ~17 MW of Installed Capacity and 95 GWh of expected annual generation The Company continues with the socialization process of the project


27 Compensation Works: Los Lagos Bus Terminal, Panguipulli Information Center, Habilitation and beach equipment in Panguipulli, Camping in Riñihue 3 4

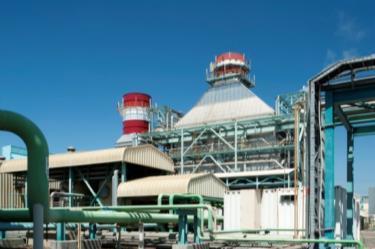
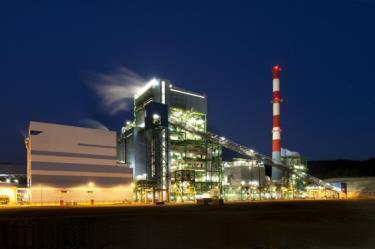
28 28 SANTA MARIA II COAL-FIRED PROJECT 35 MW of Installed Capacity and 2,5 GWh of expected annual generation Environmentally Approved Social, economic and commercial dimensions of the project are being analyzed, in order to timely define the beginning of its construction Santa María II

29 SEARCHING FOR INVESTMENT OPPORTUNITIES IN THE REGION 29 Special Focus on Colombia and Peru Growing Electricity Consumption Well established regulatory framework Diversification: Hydrological Conditions Generation Technology Fuel Access Regulatory Risks

30 3 OUR STRATEGY Be a leading and growing company of profitable and sustainable power generation in selected countries of Latin America Growth Excellence in Sustainability Excellence in Human Capital Management Operational Excellence Profitability 3

31 This document provides information about Colbún S.A. In no case this document constitutes a comprehensive analysis of the financial, production and sales situation of the company. To evaluate whether to purchase or sell securities of the company, the investor must conduct its own independent analysis. This presentation may contain forward-looking statements concerning Colbun's future performance and should be considered as good faith estimates by Colbún S.A. In compliance with the applicable rules, Colbún S.A. publishes on its Web Site ( and sends the financial statements of the Company and its corresponding notes to the Superintendencia de Valores y Seguros, those documents should be read as a complement to this presentation. INVESTOR RELATIONS TEAM CONTACT Miguel Alarcón María Elena Palma malarcon@colbun.cl mpalma@colbun.cl +(562) (562)


32 32 SECTOR SEGMENTATION 3 SUB-SECTORS 4 SEPARATE GRIDS GENERATION TRANSMISSION Regulated sectors (concessions) SING Antofagasta Tal-Tal SIC Arica 4,34 MW - 25% 17,23 GWh - 25% 15,85 MW - 75% 52,27 GWh - 74% Santiago DISTRIBUTION RELEVANT INSTITUTIONS Ministry of Energy Regulator: CNE Supervisor: SEC Coordinator: CDEC Castro SEA SAM Chaitén Cochrane Pto. Natales Pto. Williams Source: CNE, December MW - % 155 GWh - % 1 MW - % 291 GWh - %

33 33 MARKET STRUCTURE GENERATORS Main Players in the Generation Sector-SIC 36% REGULATED CUSTOMERS UNREGULATED CUSTOMERS SPOT MARKET 21% 26% DISTRIBUTION COMPANIES FREE CUSTOMERS CDEC 17% >15 players Regulated Auction Tariffs Unregulated Auction Tariffs Marginal Cost /Spot Price Endesa Colbún Gener Others Source: Colbún Dec14
COLBÚN PRESENTATION BTG Pactual IV Andean CEO Conference 2015 November 2015
 COLBÚN PRESENTATION BTG Pactual IV Andean CEO Conference 215 November 215 1 AGENDA SIC OVERVIEW COLBUN OVERVIEW OPERATIONS FINANCIALS PROJECTS CORPORATE GOVERNANCE 2 SECTOR SEGMENTATION 1 3 SUB-SECTORS
Company Presentation 1Q 2015
 Company Presentation 1Q 215 1 2 AGENDA 1. SIC OVERVIEW 2. COLBÚN OVERVIEW A. OPERATIONS B. FINANCIALS C. PROJECTS 2 3 SECTOR SEGMENTATION 3 SUB-SECTORS GENERATION TRANSMISSION DISTRIBUTION Regulated sectors
COLBÚN PRESENTATION 2016 M A Y. Southern Cone & Andean Opportunities Conference J.P. Morgan
 COLBÚN PRESENTATION 216 M A Y Southern Cone & Andean Opportunities Conference J.P. Morgan A G E N D A O VERVIEW OPERATIONS IN CHILE AND PERU FINANCIALS G R O W T H O P P O R T U N I T I E S VALUE PROPOSAL
Company Presentation 3Q 2014
 Company Presentation 3Q 214 COLBUN AT A GLANCE Arica SING ~4, MW ~17 TWh Business Size Capacity Generation Power plants Power Generation 2 nd largest generator in Chile s Central Grid (SIC), with over
8th Annual Andean Conference LarrainVial March, 2014
 8th Annual Andean Conference 214 - LarrainVial March, 214 AGENDA CHILEAN ELECTRICITY MARKET OVERVIEW COLBUN OVERVIEW INVESTMENT CONSIDERATIONS FINAL REMARKS 2 Chilean Electricity Market Overview CHILE
Scotiabank Investor Roadshow COMPANY PRESENTATION
 Scotiabank Investor Roadshow COMPANY PRESENTATION AUGUST 217 AGENDA 1. Company overview 2. Market overview 3. Operations in Chile & Peru 4. Growth opportunities 2 1. COMPANY OVERVIEW 3 Company overview
COMPANY PRESENTATION 2Q 2013
 COMPANY PRESENTATION 2Q 213 Agenda Company Overview Business Strategy Financial Profile Chilean Electricity Sector Overview 2 Colbún at a glance Company Overview Business Power Generation & Trade Market
ITAÚ BBA - BREAKFAST 2017 EARNINGS REVIEW February 2018
 ITAÚ BBA - BREAKFAST 2017 EARNINGS REVIEW February 2018 AGENDA 1. Overview 2. Commercial strategy 3. Financial review 4. Growth opportunities 2 1. OVERVIEW 3 Overview Company highlights 1 Colbún posted
COMPANY PRESENTATION. 7 th Annual Larraín Vial Andean Conference. March 19 th & 20 th, 2013
 COMPANY PRESENTATION 7 th Annual Larraín Vial Andean Conference March 19 th & 2 th, 213 Agenda Company Overview Business Strategy Financial Profile Chilean Electricity Sector Overview 2 Recent developments
COMPANY PRESENTATION. 3 era Cumbre Latinoamericana Corpbanca. November 14 th & 15 th, 2012
 COMPANY PRESENTATION 3 era Cumbre Latinoamericana Corpbanca November 14 th & 15 th, 212 Agenda Company Overview Chilean Electricity Sector Business Strategy Financial Profile 2 Colbún at a glance Company
BCI - BREAKFAST 1Q18 EARNINGS REVIEW MAY 2018
 BCI - BREAKFAST 1Q18 EARNINGS REVIEW MAY 2018 AGENDA 1. OVERVIEW 2. COMMERCIAL STRATEGY 3. FINANCIAL REVIEW 4. GROWTH OPPORTUNITIES 2 Overview 1Q18 highlights 1 2 In terms of growth activities, in March
CREDICORP Investor Conference Mercado de Capitales COMPANY PRESENTATION SEPTEMBER 2018
 CREDICORP Investor Conference Mercado de Capitales COMPANY PRESENTATION SEPTEMBER 2018 AGENDA 1. OVERVIEW 2. VALUE PROPOSAL 3. CONCLUDING REMARKS 2 Company overview Leading position in Chile & Peru THE
3Q15 Quarterly Report
 www.colbun.cl October 28 th, 2015 EBITDA in 3Q15 reached US$180.9 million, 55% and 33% higher than EBITDA in 3Q14 and 2Q15 respectively. 3Q15 showed favorable hydrological conditions and higher thermal
4Q15 Quarterly Report
 www.colbun.cl January 29 th, 2016 EBITDA in 4Q15 reached US$173.3 million, 9% higher and 4% lower than EBITDA in 4Q14 and 3Q15 respectively. The increase over 4Q14 is explained by a higher hydroelectric
2018 EARNINGS REVIEW FEBRUARY 2019
 2018 EARNINGS REVIEW FEBRUARY 2019 AGENDA 1. 2. 3. COMPANY HIGHLIGHTS FINANCIAL REVIEW GROWTH OPPORTUNITIES PALABRAS DEL PRESIDENTE 2018 COMPANY HIGHLIGHTS 2018 KEY FACTS 1 During 2018, Colbún signed medium-term
COMPANY OVERVIEW. US$812mn. Largest Energy Generator in Chile 5,063MW 531 MW 100% 11 Years. US$2.2bn. BBB-/Baa3 66.7% of installed capacity
 INVESTOR DAY 2018 COMPANY OVERVIEW 5,063MW of installed capacity 531 MW Of fully funded capacity under construction US$812mn EBITDA LTM 1Q-2018 Largest Energy Generator in Chile 100% Of efficient generation
Endesa Chile. Investor Relations Presentation. November 2007
 Endesa Chile Investor Relations Presentation November 2007 1 Agenda 1. Who we are 2. Company s Environment 3. Financial Aspects 4. Strategic Aspects and Projects 5. Social Commitment 2 Our Business and
Company Overview Market Overview and Business Strategy Financial Overview Development Key Takeaways
 1 Company Overview Market Overview and Business Strategy Financial Overview Development Key Takeaways 2 COMPANY OVERVIEW 3 About AES Gener Operations in 4 markets: SIC and SING in Chile, SIN in Colombia
CORPORATE PRESENTATION. October,
 CORPORATE PRESENTATION October, 2016 1 COMPANY OVERVIEW KEY STATISTICS Data as of June 30, 2016, unless otherwise noted 5,795 MW of installed capacity(1)(3)(4) US$2.8bn market capitalization(2) 797 MW
JUNE
 JUNE 2005 www.endesachile.cl INDEX BUSINESS RESULTS COUNTRY ANALYSIS BUSINESS OUTLOOK CONCLUSIONS BUSINESS Highlights One of the largest private power producers in Latin America, with plants in Argentina,
May One on One Conference Deutsche Bank
 May 2012 One on One Conference Deutsche Bank Agenda Company overview Financial results Projects under development 2 Company overview Mature and stable energy sector with investor friendly regulatory framework
Endesa Chile Roadshow 2006
 Endesa Chile Roadshow 2006 1 Index Introduction Where We Stand Financial Profile Operating & Financial Results Conclusions 2 Endesa Chile Strengths & Opportunities Highly Efficient Generation Assets Increasing
endesa chile 1Q 2012 results
 25 04 2012 endesa chile 1Q 2012 results Highlights in 1Q 2012 Growth of 7% in electricity demand in the region Growth of 2% in physical sales on a consolidated basis Growth of 9% in operating costs, primarily
Endesa Chile IR Presentation. As of December 2011
 Endesa Chile IR Presentation As of December 2011 Our company Multinational electricity generation company based in Chile Vast experience, with over 68 years of history Leading position in most of the countries
Enel Generación Chile Investor Relations Presentation
 Enel Generación Chile Investor Relations Presentation as of June 30, 2017 Organization structure Enel Generación Chile 61% ENEL SpA ITALY Enel Generación Chile s Shareholders 2 60% ENEL CHILE CHILE ENEL
Enel Generación Chile. Investor Relations Presentation 9M 2016
 Enel Generación Chile Investor Relations Presentation 9M 2016 Organization structure Enel Generación Chile (after Spin Off) 61% ENEL SpA ITALY Committed Shareholders 60% ENEL CHILE CHILE 3% 3% 18% Enersis
Enel Generación Chile Investor Relations Presentation
 Enel Generación Chile Investor Relations Presentation as of March 31, 2017 Organization structure Enel Generación Chile 61% ENEL SpA ITALY Committed Shareholders 2 60% ENEL CHILE CHILE 2.7% 3.3% 18.0%
This presentation may contain forward-looking opinions including the intent, belief or current expectations of the Company and its management.
 Andean Conference Legal notice This presentation may contain forward-looking opinions including the intent, belief or current expectations of the Company and its management. Investors are cautioned that
endesa chile YE 2012 results
 31 01 2013 endesa chile YE 2012 results Highlights of 2012 Lower hydro generation in Chile, mainly explained by a third consecutive year of a severe drought. 6% growth of installed capacity in Chile, related
Endesa Chile IR Presentation 1H 2016
 Endesa Chile IR Presentation 1H 2016 Organization structure Endesa Chile (before Spin-Off) ITALY Committed Shareholders 61% 60% CHILE 6% 4% 14% Enersis S.A. Chilean Pension Funds ADRs (Citibank N.A.) 16%
Presentation to Investors May, 2006
 Presentation to Investors May, 26 Business Structure Distribution (Dx) US$ 1.5 billion assets 48% of total EBITDA* > 11.3 million clients 61 % Generation (Gx) US$ 9.5 billion assets 51% of total EBITDA*
Endesa Chile IR Presentation 1Q 2016
 Endesa Chile IR Presentation 1Q 2016 Organization structure Endesa Chile (before Spin-off) ITALY Committed Shareholders 61% 60% CHILE 6% 4% 14% Enersis S.A. Chilean Pension Funds ADRs (Citibank N.A.) 16%
AES Gener S.A. Deutsche Bank Andean Conference May 2016
 AES Gener S.A. Deutsche Bank Andean Conference May 2016 AES Gener Key investment considerations Highlights Asset map 1 2 3 Leading position: Largest energy producer in Chile, and major producer in Colombia,
Company s Capital Structure. December 2015
 Company s Capital Structure December 2015 0 AES Gener Strong Credit Profile Balanced Capital Structure Balanced financial policy aligned with investment grade rating Diversified presence in attractive
Endesa Chile IR Presentation
 Endesa Chile IR Presentation As of December 31, 2014 Organization structure ITALY Committed Shareholders 61% CHILE Enersis S.A. 60% 3% 3% 15% 18% 60% Chilean Pension Funds ADRs (Citibank N.A.) Retail CHILE
Enel Chile 2016 results. March 1 st, 2017
 Enel Chile 2016 results March 1 st, 2017 Chilean highlights of the year Enel Chile EBITDA increased 14%, amounting to 1.1 billion. Net Income attributable to shareholders increased 57%, amounting to 584
Endesa Chile IR Presentation
 Endesa Chile IR Presentation As of March 31, 2014 2 Organization structure ITALY 92% Committed Shareholders SPAIN 61% ENERSIS CHILE Chilean Pension Funds 60% 6% 3%3%13% 15% 60% Institutional Shareholders
AES GENER JUNE 2017 RESULTS 2017 YEAR TO DATE HIGHLIGHTS AES GENER/ 2017
 AES GENER JUNE 2017 RESULTS AES Gener achieved its highest ever LTM EBITDA US$813 million in the twelve months ended June 30, 2017. Year-to-date EBITDA reached US$380 million, 10% higher compared to the
endesachileirpresentation AS OF SEPTEMBER 30th, 2010
 endesachileirpresentation AS OF SEPTEMBER 30th, 2010 whoisendesachile? A unique portfolio in Latam s Generation business Colombia N 1 2,914 MW inst. capacity 21% market share Brazil 987 MW inst. capacity
Capital Markets Day. Global Trading. Claudio Machetti
 Capital Markets Day Global Trading Claudio Machetti Integrated model fit for digitalized, low carbon world Global portfolio optimization Integrated margin management Diversified global portfolio evolution
AES GENER. Initiating Coverage. Investment Thesis and Recommendation. Risks
 AES GENER Target Price: CLP 32 Recommendation: Hold Risk: Medium July, 9th 212 Sector: Electricity & Energy Analyst: Sergio Zapata sergio.zapata@corpgroup.cl T: +562 66 2243 Company Information Ticker:
The best way to balance your investments in the growing electric sector in South America
 The best way to balance your investments in the growing electric sector in South America 0 AGENDA 1.- Introduction 2.- Fundamentals 3.- Financial Analysis 4.- Enersis future 1 2008: YEAR OF STOCK MARKET
Endesa Chile IR presentation As of December 2013
 Endesa Chile IR presentation As of December 2013 Ownership Structure 92% ENERSIS 61% 12% 3% 4% 6% 15% 60% Chilean Pension Funds Institutional Shareholders ADR Holders 60% Minority Shareholders Other Institutional
Endesa Chile IR presentation. As of June 2012
 Endesa Chile IR presentation As of June 2012 Our company Multinational electricity generation company based in Chile Vast experience, with over 69 years of history Efficient and diversified investment
enersis 1H 2013 results
 07 25 2013 enersis 1H 2013 results Highlights Average demand 1 growth in LatAm reaches +3.5% improving the trend vs 1Q13 The GAP of hydro generation caused by the persistence of droughts in the region
AES GENER 2014 YEAR-END RESULTS
 AES GENER 2014 YEAR-END RESULTS AES Gener recorded EBITDA of ThUS$671,215 during 2014, 8% higher than the EBITDA recorded in 2013. Net income recorded as of December 31, 2014 was ThUS$183,651 EBITDA increased
ENERSIS. A unique and sound diversified portfolio in Distribution and Generation of electricity
 ENERSIS A unique and sound diversified portfolio in Distribution and Generation of electricity Our main shareholders 60.6% Chilean pension funds 17.3% Other institutional shareholders 6.9% ADR s 10.3%
ENDESA CHILE ANNOUNCES CONSOLIDATED RESULTS FOR THE YEAR ENDED DECEMBER 31st, Highlights for the Period
 ENDESA CHILE ANNOUNCES CONSOLIDATED RESULTS FOR THE YEAR ENDED DECEMBER 31st, 2010 Highlights for the Period SUMMARY Consolidated physical sales declined by 5.4% to 56,641 GWh, mainly in Colombia, Argentina
AES GENER 2Q 2017 EARNINGS CALL. August 8 th, 2017
 AES GENER 2Q 2017 EARNINGS CALL August 8 th, 2017 Disclaimer This presentation is not an offer for sale of securities. This material has been prepared solely for informational purposes and is not to be
GDF SUEZ Energy France Business line. Henri Ducré
 GDF SUEZ Energy France Business line Henri Ducré Key business figures * Leading positions in gas and electricity in France 1 st gas supplier 2 nd producer and supplier of electricity 1 st player in the
AES GENER 3Q-2017 RESULTS 2017 YEAR TO DATE HIGHLIGHTS AES GENER/ 2017
 AES GENER 3Q-2017 RESULTS AES Gener achieved LTM EBITDA US$769 million in the twelve months ended September 30, 2017. Year-to-date EBITDA reached US$562 million, 2% lower compared to the EBITDA recorded
AES GENER Q RESULTS
 AES GENER Q1 2016 RESULTS AES Gener recorded an EBITDA of ThUS$157,603 during the first quarter of 2016, similar to the EBITDA recorded in the same period in 2015. Net income of ThUS$41,033 recorded as
AES GENER 2015 YEAR-END RESULTS
 AES GENER 2015 YEAR-END RESULTS Net income recorded as of December 31, 2015 was ThUS$264,874, representing a 44% increase compared to the previous year. AES Gener recorded EBITDA of ThUS$691,068 during
Disclaimer. o Only for information matters and reader's convenience, figures in COP were translated in this presentation into their USD
 3Q2015 Report Disclaimer o Below is a general information presentation about Empresas Públicas de Medellín ESP and its Subsidiaries, as on the date of presentation. The materials herein contained have
ECL. Equity Research. New contract triggers start of coal project, interconnection. Chile Electric & Other Utilities Company Note 15 December 2014
 Equity Research ECL New contract triggers start of coal project, interconnection E.CL won a block for 5,4GWh at US$19.5/MWh E.CL was awarded a 15-yr 5,4GWh annual contract in Block 3 for the supply of
Endesa 9M 2017 Results 07/11/2017
 Endesa 9M 2017 Results 07/11/2017 1. Highlights and key financial figures 2. Endesa s performance in 9M 2017 market context 3. Financial results 4. Final remarks 2 1. Highlights and key financial figures
Enel Américas FY 2017 results
 Enel Américas FY 2017 results Highlights of the period EBITDA of 2,947 musd, an increase of 21% vs 2016 13% increase in Gx and 25% increase in Dx Net Income of 1,127 musd, an increase of 33% vs 2016 1
endesa 1H 2012 results
 27 07 2012 endesa 1H 2012 results Market context 1H 2012 Demand consolidated results 1H 2012 Spain: adjusted demand decrease due to industry Spain (1) Endesa distribution area +0.8% Industry -1.8% Services
LatAm Utilities. Weak Hydrology, Tax Hike Likely in Chile, and ECL Upgrade on Valuation
 Industry Comment Thursday, September 5, 213, Pre-Market 1 LatAm Utilities Weak Hydrology, Tax Hike Likely in Chile, and ECL Upgrade on Valuation Ezequiel Fernández López - +562 2692 6251 (Scotia Corredores
Enel Américas 1H 2018 results
 Enel Américas 1H 2018 results Highlights of the period EBITDA of 1,652 musd, an increase of 19% vs 1H 2017 despite a negative fx scenario in Argentina and Brazil Generation EBITDA increased by 14% due
ENEL CHILE GROUP CONSOLIDATED FINANCIAL STATEMENTS AS OF MARCH 31, 2017 (Amounts expressed in millions of Chilean Pesos)
") ENEL CHILE GROUP CONSOLIDATED FINANCIAL STATEMENTS AS OF (Amounts expressed in millions of Chilean Pesos) Revenues of Enel Chile reached Ch$ 594,438 representing a 166% increase when compared with March
ENEL CHILE GROUP CONSOLIDATED FINANCIAL STATEMENTS AS OF (Amounts expressed in millions of Chilean Pesos) Revenues of Enel Chile reached Ch$ 594,438 representing a 166% increase when compared with March
Endesa Chile 1H15 Results. July 28th,2015
 Endesa Chile 1H15 Results July 28th,2015 Highlights Consolidated generation rose by 8% Consolidated EBITDA increased by 9% Significant improvement in Chile Bocamina II restarted its operations El Quimbo
Agenda. Introduction. Relevant facts. Energy market. Main projects. Financial results. UNE operational results. Subsequent events
 4Q2015 Report Disclaimer o Below is a general information presentation about Empresas Públicas de Medellín ESP and its Subsidiaries, as on the date of presentation. The materials herein contained have
Conference Call Second Quarter 2013 Financial Results. Presentation3
 Conference Call Second Quarter 2013 Financial Results Presentation3 August 2, 2013 Agenda 1 Agenda 1 2 Opening Remarks 2Q13 Highlights 3 Operating and Financial Review 4 Closing Remarks 5 Q&A 2 1 Alicorp
2010 Results. March, 2011
 2010 Results March, 2011 2010 Highlights Operational Energy generation 25% higher than physical guarantee Beginning of modernization program at Nova Avanhandava (347 MW), Ibitinga (132 MW) and Caconde
+0.6GW additions of wind and solar capacity Efficiency savings of 141m (26% above 2017 target for OPEX IV Programme)
") 0 EBITDA +6% at 3.99bn, benefiting from the gain on Naturgas disposal (+ 0.5bn one-offs) Recurring EBITDA -5% to 3.52bn, penalised by severe drought in Iberian peninsula (- 0.3bn) +0.6GW additions of wind
0 EBITDA +6% at 3.99bn, benefiting from the gain on Naturgas disposal (+ 0.5bn one-offs) Recurring EBITDA -5% to 3.52bn, penalised by severe drought in Iberian peninsula (- 0.3bn) +0.6GW additions of wind
4Q-2017 Earnings Call
 4Q-2017 Earnings Call AES Gener February 27th, 2018 Disclaimer This presentation is not an offer for sale of securities. This material has been prepared solely for informational purposes and is not to
Enel Américas Enel Américas 2018 Analyst Update Meeting
 Enel Américas Enel Américas 2018 Analyst Update Meeting Paolo Pallotti CFO Enel Américas Enel Américas Overview Enel Américas overview 1 Enel Américas is Latin America s largest private power company Colombia
Endesa Chile IR presentation As of September 2013
 Endesa Chile IR presentation As of September 2013 Ownership Structure 92% ENERSIS 61% 12% 3% 4% 6% 15% 60% Chilean Pension Funds Institutional Shareholders ADR Holders 60% Minority Shareholders Other Institutional
ENERSIS PRESS RELEASE CONSOLIDATED FINANCIAL STATEMENTS
 ENERSIS ANNOUNCES CONSOLIDATED RESULTS FOR THE PERIOD ENDED ON SEPTEMBER 30, 2015 Enersis EBITDA as of September 2015 amounted to Ch$ 1,636,989 million, 7.6% higher than last year during the same period,
Celsia Energy in action
 Celsia Energy in action 2014 The story of a transformation 2 The transformation process at a glance 1919 2001 Coltabaco 2001 2002 2006 Coltabaco 2007 2012 Tobacco Business Tobacco Business Electric Utility
Agenda. Relevant facts. El Niño phenomenon. Energy market. Main projects. Financial results. Subsequent events
 1Q2016 Report Disclaimer o Below is a general information presentation about Empresas Públicas de Medellín ESP and its, as on the date of presentation. The materials herein contained have been summarized
Junta Anual de Inversionistas Activa 2016 SCL ENERGÍA ACTIVA S.A.
 Junta Anual de Inversionistas Activa 2016 SCL ENERGÍA ACTIVA S.A. RATIONALITY INVESTMENT FOCUS TARGET MARKETS INVESTMENT STRATEGY Energy opportunities in the Pacific Coast of South America and some countries
ENGIE ENERGÍA CHILE S.A. Presentation to investors. 3Q 2017 Results
 ENGIE ENERGÍA CHILE S.A. Presentation to investors 3Q 2017 Results AGENDA Snapshots Key messages Looking forward Financial update Addenda 2 ENGIE IN A NUTSHELL ENGIE: A GLOBAL ENERGY PLAYER 153,090 employees
AES CORPORATION. City or location Month XX, 20XX. AES Gener Business Review. Felipe Ceron Chief Executive Officer, AES Gener S.A.
 AES CORPORATION AES CORPORATION AES Gener Business Review Felipe Ceron Chief Executive Officer, AES Gener S.A. City or location Month XX, 20XX March 22, 2006 AES Gener Strategic Overview Contains Forward
ENERSIS ANNOUNCES CONSOLIDATED RESULTS FOR FIRST QUARTER ENDED MARCH 31 st, 2009
 ENERSIS ANNOUNCES CONSOLIDATED RESULTS FOR FIRST QUARTER ENDED MARCH 31 st, 2009 These Financial Statements have been prepared, for the first time, under IFRS. It implies several changes in the accounting
Conference Call First Quarter 2014 Financial Results. Presentation3
 Conference Call First Quarter 204 Financial Results Presentation3 May 2, 204 Agenda 2 Presentation3 Agenda 2 3 4 5 6 Opening Remarks Global Alimentos Acquisition Q4 Highlights Operating and Financial Review
2Q08. Earnings Release
 2Q08 Earnings Release Disclaimer The information contained herein has been prepared by Tractebel Energia S.A. ( Tractebel Energia or the Company ) solely for meetings held with investors and/or potential
ENDESA CHILE ANNOUNCES CONSOLIDATED RESULTS FOR THE PERIOD ENDED SEPTEMBER 30, 2006
 FOR IMMEDIATE RELEASE For further information contact: Jaime Montero Investor Relations Director Endesa Chile (56-2) 634-2329 jfmv@endesa.cl Tomás González tgonzalez@endesa.cl Irene Aguiló iaguilo@endesa.cl
Public Power Corporation SA. Financial Results Athens, March 30, 2010
 Public Power Corporation SA Financial Results 2009 Athens, March 30, 2010 1 Agenda Financial Results George Angelopoulos, CFO Business Update & 2010 Outlook Arthouros Zervos, Chairman and CEO 2 Financial
ENERSIS ANNOUNCES CONSOLIDATED RESULTS FOR THE PERIOD ENDED ON SEPTEMBER 30, Highlights for the Period SUMMARY
 ENERSIS ANNOUNCES CONSOLIDATED RESULTS FOR THE PERIOD ENDED ON SEPTEMBER 30, 2011 Highlights for the Period SUMMARY The first nine months of the year confirmed the strong growth in demand for electricity
endesa FY 2012 results
 27 02 2013 endesa FY 2012 results consolidated results FY 2012 Business context in 2012 Demand Spain: demand decrease due to lower industrial activity Spain (1) Endesa distribution area (2) -0.5% -1.3%
Southern Copper Corporation Highlights
 Southern Copper Corporation Highlights ht Southern Copper Corporation Highlights March 2009 January 2009 0 Safe Harbor Statement This presentation contains forward-looking statements, as defined by federal
EDP Brasil BM&FBovespa: ENBR3. 3Q17 Results Presentation (Teleconference on November 01 st, 2017)
") EDP Brasil BM&FBovespa: ENBR3 3Q17 Results Presentation (Teleconference on November 01 st, 2017) Disclaimer This presentation may include forward-looking statements of future events or results according
EDP Brasil BM&FBovespa: ENBR3 3Q17 Results Presentation (Teleconference on November 01 st, 2017) Disclaimer This presentation may include forward-looking statements of future events or results according
1Q 2015 Results. May 8, 2015
 1Q 2015 Results May 8, 2015 Highlights of the period Good operating results: recurring EBITDA +4% Latam: confirmed positive trends, EBITDA +33% yoy and reorganization kicked -off Renewables: +0.2 GW capacity
ENDESA CHILE ANNOUNCES CONSOLIDATED RESULTS FOR THE PERIOD ENDED MARCH 31, 2005
 FOR IMMEDIATE RELEASE For further information contact: Jaime Montero Investor Relations Director Endesa Chile (56-2) 634-2329 jfmv@endesa.cl Tomás González tgonzalez@endesa.cl Irene Aguiló iaguilo@endesa.cl
ENERSIS ANNOUNCES CONSOLIDATED RESULTS FOR THE PERIOD ENDED ON SEPTEMBER 30, Highlights for the Period
 ENERSIS ANNOUNCES CONSOLIDATED RESULTS FOR THE PERIOD ENDED ON SEPTEMBER 30, 2014 Highlights for the Period The company s total EBITDA in the first nine months of the year amounted to Ch$ 1,521,114 million,
Endesa FY 2017 Results 28/02/2018
 Endesa FY 2017 Results 28/02/2018 1. Highlights and key financial figures 2. Endesa s performance in 2017 market context 3. Financial results 4. Final remarks 2 1. Highlights and key financial figures
ORMAT TECHNOLOGIES (NYSE:ORA) BY: Kelvin Li
 BY: Kelvin Li") ORMAT TECHNOLOGIES (NYSE:ORA) BY: Kelvin Li Company Overview Revenue Segmentation Details of Operations Product 42% Electricity 58% Other Foreign Countries 6% Kenya 20% United States 74% Ormat Technologies
ORMAT TECHNOLOGIES (NYSE:ORA) BY: Kelvin Li Company Overview Revenue Segmentation Details of Operations Product 42% Electricity 58% Other Foreign Countries 6% Kenya 20% United States 74% Ormat Technologies
AGUAS ANDINAS Corporate Presentation. January 2016
 AGUAS ANDINAS Corporate Presentation January 2016 01 OUR COMPANY AGUAS ANDINAS Chile s Largest Sanitation Company 100% coverage in potable water and sewage treatment 50.5% of potable water billed in the
Endesa 1Q 2018 Results 08/05/2018
 Endesa 1Q 2018 Results 08/05/2018 1. Highlights and key financial figures 2. Endesa s performance in 1Q 2018 market context 3. Financial results 4. Final remarks 2 Highlights Outstanding performance of
Nordic Market Report
 Nordic Market Report Status as of May 8 th, 17 1. SUMMARY The average spot price in April was 29.2 /MWh, down 1.2 /MWh from March and up 7.1 /MWh year-onyear. The average price in April in the period 1993
FINANCIAL RESULTS Q CFO Irene Egset 4 th May 2017
 FINANCIAL RESULTS Q1 2017 CFO Irene Egset 4 th May 2017 Health, safety and environment TRI-rate 1 10 8 6 4 2 0 2014 2015 2016 2017 Health and safety - Quarterly injuries rate is down in Q1 - Continuously
Neoenergia s Overview Regulatory Environment Networks (Distribution and Transmission) Contracted Generation Financial Results and Debt Profile
 Contracted Generation Financial Results and Debt Profile") 1 Disclaimer The following presentation was developed by Neoenergia S.A. (NEOENERGIA) assigning the general situation and the NEOENERGIA business development. Despite all the care and diligence used in
1 Disclaimer The following presentation was developed by Neoenergia S.A. (NEOENERGIA) assigning the general situation and the NEOENERGIA business development. Despite all the care and diligence used in
Southern Copper Corporation November, 2016
 Southern Copper Corporation November, 2016 0 I. Introduction 1 Management Presenter Presenters Raul Jacob Title Vice President, Finance & CFO 2 Safe Harbor Statement This presentation contains certain
Large Commercial Rate Simplification
 Large Commercial Rate Simplification Presented to: Key Account Luncheon Red Lion Hotel Presented by: Mark Haddad Assistant Director/CFO October 19, 2017 Most Important Information First There is no rate
endesa 1H 2013 results
 31 07 2013 endesa 1H 2013 results consolidated results 1H 2013 Spain: demand decrease in all categories of clients, particularly in the services segment Spain (1) -2.6% -2.4% -3.8% Not adjusted (1) Mainland.
AGENDA HIGHLIGHTS INDUSTRY AND COMPANY PROJECTS FINANCIAL RESULTS
 2015 RESULTS AGENDA HIGHLIGHTS INDUSTRY AND COMPANY PROJECTS FINANCIAL RESULTS 2 HIGHLIGHTS Financial performance in 2015 EBITDA reached US$313 million, a 2% increase compared to 2014, due to generally
AGUAS ANDINAS CORPORATE PRESENTATION. November 2015
 AGUAS ANDINAS CORPORATE PRESENTATION November 2015 01 OUR COMPANY AGUAS ANDINAS Chile s Largest Sanitation Company 100% de coverage in potable water and sewage treatment 50.4% of potable water billed in
ELECTRICITY GENERATION
 ELECTRICITY GENERATION World s Largest Producers 2010 TW/h Total 21.325,0 (100%) USA 4.325,9 (20,3%) China 4.206,5 (19,7%) Japan Russian 1.145,3 1.036,8 (5,4%) (4,9%) India Canada 922,3 629,9 (4,3%) (3,0%)