JOHNSON ELECTRIC HOLDINGS LIMITED. FY Interim Results
|
|
|
- Sharlene Parrish
- 5 years ago
- Views:
Transcription
1 JOHNSON ELECTRIC HOLDINGS LIMITED FY Interim Results November 2010 Page 1


2 Group Overview Key Financial Highlights Operational Results Outlook Appendix Page 2
3 JOHNSON ELECTRIC GROUP OVERVIEW Johnson Electric Group Automotive Products Group (APG) Industry Products Group (IPG) Other Manufacturing Businesses Motors Motion Systems Motors Motion Systems Controls Parlex Tonglin Johnson Electric (JE) is one of the world's largest providers of motion solutions for the automotive, industrial, consumer & medical markets. JE has shipped billions of motion products for hundreds of different applications to more than thirty countries. The Group has an annual production capacity of over one billion motors and motion subsystems JE has about forty one thousand employees and subcontract workers in twenty three countries, with the majority of the workforce engaged in production activities in China. Engineering centers are located in Hong Kong, Germany, Switzerland, UK, Italy, Japan, China, Israel and in the USA Page 3

4 JOHNSON ELECTRIC GROUP OVERVIEW Actuators, motors, switches Capacity of 3 million motors & actuators / day 15 million switches / month Vertically integrated manufacturing 41,000 employees and subcontract workers in 23 countries Page 4
5 OUR BRAND PROMISE To be the world s definitive provider of innovative and reliable motion systems The Safe Choice Total quality assurance and reliability Commitment to customer success at all levels in the organization Assurance of supply & on time delivery worldwide 24/7 global logistics support Financial strength and long standing supplier relationships Technology Leadership Differentiation with innovative motion products Technology roadmaps for multiple technologies Collaborative design and productizing process Product life cycle support from creation to end of life Quality & reliability / designed in Page 5
6 Group Overview Key Financial Highlights Operational Results Outlook Appendix Page 6
7 FINANCIAL HIGHLIGHTS Six months ended US$ million 30th Sep th Sep 2009 Sales 1, Operating profit Profit attributable to shareholders EBITDA Free cash flow from operations* US$ million 30th Sep st Mar 2010 Cash Debt (Total borrowings) (404.3) (408.7) Total equity 1, ,166.6 Financial ratios (LTM basis) Debt to EBITDA Interest coverage Free cash flow from operations to debt 45% 53% Debt to capital (Total equity + debt) 24% 26% *Net cash generated from operations plus interest received, less CAPEX net of proceeds from sale of assets Page 7
8 FINANCIAL PERFORMANCE Sales Profit Attributable to Shareholders 1, US$ millions 1, , , , , US$ millions H FY H FY H FY H FY H FY H FY H FY H FY H FY H FY EBITDA Free cash flow US$ millions US$ millions H FY H FY H FY H FY H FY H FY H FY H FY H FY H FY Page 8
9 HALF YEAR RESULTS HIGHLIGHTS Sales of US$1,030.6 million Gross margin increased from 26.6% to 28.7% Operating profit increased 2.8 times, from US$33.0 million to US$124.0 million Profit attributable to shareholders increased from US$14.6 million to US$92.9 million EPS: from 0.4 US cents per share to 2.54 US cents per share Interim dividend of 3 HK Cents per share (0.39 US Cents per share) Page 9
10 Group Overview Key Financial Highlights Operational Results Outlook Appendix Page 10
11 PROFIT & LOSS 1H FY vs. 1H FY Increase/ Six months ended (Decrease) US$ million 30th Sep th Sep 2009 in profit Sales 1, Gross profit Gross margin % 28.7% 26.6% 2.1% Other income & gains/(losses) (1.2) 1.2 Selling and administrative expenses ("S&A") (171.9) (167.7) (4.2) S&A % 16.7% 20.7% (4.0%) Operating profit before restructuring Restructuring provision & asset impairments (14.0) 14.0 Operating profit Operating margin % 12.0% 4.1% 7.9% Finance costs, net (3.9) (3.1) (0.8) Share of profits/(losses) of associated companies (0.2) 0.2 Profit before income tax Tax expenses (22.0) (10.4) (11.6) Effective tax rate % 18% 35% (17%) Profit for the period Non controlling interests (5.2) (4.7) (0.5) Profit attributable to shareholders Page 11
12 GROUP SALES BY GEOGRAPHY US$ million 1, % % % % % % % 41% % 1H FY H FY H FY Europe Asia Americas Page 12
13 GROUP SALES BY LINE OF BUSINESS US$ million 1, % % % % % % % % % 1H FY H FY H FY Automotive Industry Other Mfg & Trading Page 13
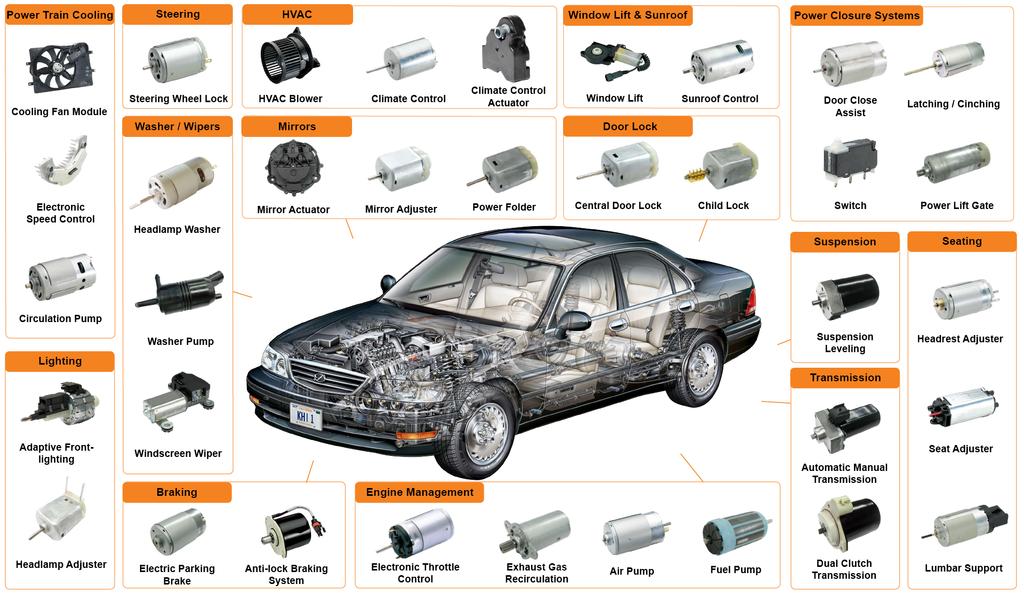
14 APG APPLICATIONS Page 14


15 IPG APPLICATIONS Building Automation & Security Power Equipment Business Machines Personal Care Camera and Optical Medical Food and Beverages Home Entertainment & Gaming Home Technologies Industrial Automation Page 15
16 HALF YEAR RESULTS OVERVIEW APG SALES Expansion in demand by OEMs in fast growing emerging markets Market share gained from new product launches Increasing demand of power closure systems, power seat adjustments and climate control motion systems in all types of vehicles Increased preference for fuel efficient vehicles driving demand for engine air, fuel management and transmission application products Growth in demand for safety focused products (e.g. for anti lock braking systems, electronic stability control and electric parking brakes applications) Page 16
17 HALF YEAR RESULTS OVERVIEW IPG SALES Rebound across all products and significant inventory restocking activities Increased demand for consumer products for food preparation, floor care, personal care applications, gaming and household appliances Launch of higher power density motors and new products in the lawn and garden products segment Penetrated new markets for electrical and gas metering systems Continued to focus on energy efficient products as well as products with higher density to reduce size and weight Page 17
18 HALF YEAR RESULTS OVERVIEW OTHER MANUFACTURING SALES Controls Increased market share in the infrastructure automation segment aided by recovery in demand for industrial machine applications Tonglin Precision Parts Sales growth due to the merger of China AutoParts with Tianxi Auto Parts in July 2009 Parlex Sales were flat compared to the same period last year Page 18
19 CHANGES IN PROFIT ATTRIBUTABLE TO SHAREHOLDERS US$ million (29.5) 4.8 (13.0) (7.8) 6 months ended 30th Sep 2009 Currency effects Volume, price and direct costs Operating costs Claims and bad debts Restructuring costs Finance costs, tax and non-controlling interests 6 months ended 30th Sep 2010 Page 19
20 FREE CASH FLOW FROM OPERATIONS Six months ended US$ million 30th Sep th Sep 2009 Operating profit Depreciation, amortisation and associates EBITDA Other non cash items in profit before tax Working capital change (33.9) 64.6 Cash flows from operating activities Tax paid (9.6) (5.9) Interest paid (4.9) (3.5) Net cash generated from operating activities Interest received Capital expenditure (38.9) (14.8) Proceeds from disposal of fixed assets Free cash flow from operations Page 20
21 WORKING CAPITAL Trade Receivables Inventory Trade Payables US$millions Sep Mar Sep Days of sales outstanding US$millions Sep Mar Sep Days of inventory US$millions Sep Mar Sep Days of purchases outstanding Receivables Days of sales outstanding Inventory Days of inventory Payables Days of purchases outstanding Days sales outstanding increased from 58 to 61 days Inventory days increased from 47 to 57 days Days purchases outstanding increased from 81 to 99 days Page 21
22 CAPITAL EXPENDITURE US$ millions H 2H 1H 2H 1H 2H 1H 2H 1H FY2007 FY2008 FY2009 FY2010 FY2011 1H CAPEX 2H CAPEX Depreciation Page 22
23 DIVIDEND In consideration of the improved operating environment and profitability of the Company, the Directors have determined that a resumption of interim dividend payments is appropriate and have today declared an interim dividend of 3 HK Cents, equivalent to 0.39 US Cents per share payable on 6th January 2011 to shareholders registered on 5th January Chairman s Statement 29 th November, 2010 Page 23
24 Group Overview Key Financial Highlights Operational Results Outlook Appendix Page 24
25 MARKET OUTLOOK In most developed economies, households are reluctant to spend while unemployment remains high and property values are depressed Businesses benefiting from higher export sales to developing markets are still apparently hesitant to invest Part of the recovery in demand has been driven by restocking, at some point we should expect a softening in sales volumes The imposition of government directed austerity measures in several European countries will likely also have a negative impact on consumer sentiment for some time to come Page 25
26 OUTLOOK FOR JOHNSON ELECTRIC The prevailing global macro economic picture is mixed and difficult to predict and to the seasonality of some of our businesses We are cautious regarding the near term financial outlook and we project Second half sales to be slightly lower Labour costs in China and commodity prices are increasing We are now fitter and well placed to continue to win a substantial share of business in the global motion systems industry Page 26
27 Group Overview Key Financial Highlights Operational Results Outlook Appendix Page 27

28 GLOBAL SALES & SUPPORT OFFICES Austria Belgium Brazil Canada China France Germany Hong Kong India Italy Israel Japan Korea Netherlands Singapore Switzerland UK USA Page 28
29 GLOBAL ENGINEERING CENTERS China Germany Hong Kong Italy Israel Japan Switzerland UK USA Page 29
30 WORLDWIDE MANUFACTURING Argentina Brazil China France Germany Hungary India Italy Israel Poland Switzerland UK USA Page 30
31 APPENDIX NEW PRODUCTS Page 31


32 APG ABS MOTORS APG CFM + MOTORS Page 32


33 APG SEAT MOTORS APG WINDOW LIFT Page 33


34 APG ACTUATORS APG DOOR LOCKS Page 34


35 APG WASHER PUMPS APG STEERING WHEEL LOCKS Page 35

36 APG LUMBAR SUPPORT Page 36


37 ECO MOTION IPG BLENDING Page 37


38 IPG HEATING SYSTEMS IPG WASHING MACHINES Page 38


39 IPG HAIRDRYERS IPG LEAF BLOWERS Page 39
40 DISCLAIMER This presentation contains certain forward looking statements with respect to the financial condition, results of operations and business of Johnson Electric and certain plans and objectives of the management of Johnson Electric. Words such as outlook, expects, anticipates, intends, plans, believes, estimates, projects, variations of such words and similar expressions are intended to identify such forward looking statements. Such forward looking statements involve known and unknown risk, uncertainties and other factors which may cause the actual results or performance of Johnson Electric to be materially different from any future results or performance expressed or implied by such forward looking statements. Such forward looking statements are based on numerous assumptions regarding Johnson Electric s present and future business strategies and the political and economic environment in which Johnson Electric will operate in the future. Page 40
JOHNSON ELECTRIC HOLDINGS LIMITED FY2011/12 Interim Results
 JOHNSON ELECTRIC HOLDINGS LIMITED FY2011/12 Interim Results Jan 2012 Page 1 Group Overview Key Financial Highlights Operational Results Outlook Appendix Page 2 JOHNSON ELECTRIC GROUP OVERVIEW Johnson Electric
ManpowerGroup Employment Outlook Survey Global
 ManpowerGroup Employment Outlook Survey Global 1 19 ManpowerGroup interviewed over 6, employers across 44 countries and territories to forecast labor market activity* in January-March 19. All participants
ManpowerGroup Employment Outlook Survey Netherlands
 ManpowerGroup Employment Outlook Survey Netherlands 1 218 The ManpowerGroup Employment Outlook Survey for the first quarter 218 was conducted by interviewing a representative sample of 754 employers in
ManpowerGroup Employment Outlook Survey Singapore
 ManpowerGroup Employment Outlook Survey Singapore 1 218 ManpowerGroup interviewed nearly 59, employers across 43 countries and territories to forecast labor market activity* in 1Q 218. All participants
ManpowerGroup Employment Outlook Survey UK
 ManpowerGroup Employment Outlook Survey UK 218 United Kingdom Employment Outlook The ManpowerGroup Employment Outlook Survey for the fourth quarter 218 was conducted by interviewing a representative sample
ManpowerGroup Employment Outlook Survey Global
 ManpowerGroup Employment Outlook Survey Global 1 218 ManpowerGroup interviewed nearly 59, employers across 43 countries and territories to forecast labor market activity in Quarter 1 218. All participants
2010 Results. Paris - March 2, 2011
 2010 Results Paris - March 2, 2011 > Highlights of 2010 > Financial results > Strategy and outlook 2010 Results 2 2010: A Year of Acceleration Highlights of 2010 Revenue of 3,892m, up 19.1% Operating profit
ManpowerGroup Employment Outlook Survey New Zealand
 ManpowerGroup Employment Outlook Survey New Zealand 1 218 New Zealand Employment Outlook The ManpowerGroup Employment Outlook Survey for the first quarter 218 was conducted by interviewing a representative
Gross profit margins slightly increased to 29.6% from 29.5% in the prior year
 Hong Kong Exchanges and Clearing Limited and The Stock Exchange of Hong Kong Limited take no responsibility for the contents of this announcement, make no representation as to its accuracy or completeness
Hewitt Associates, Inc Robert W. Baird Business Solutions Conference
 February 26, 2009 Hewitt Associates, Inc. 2009 Robert W. Baird Business Solutions Conference Forward-Looking Statements and Non-GAAP Financial Measures This presentation contains forward-looking statements
ManpowerGroup Employment Outlook Survey Netherlands
 ManpowerGroup Employment Outlook Survey Netherlands 4 218 The ManpowerGroup Employment Outlook Survey for the fourth quarter 218 was conducted by interviewing a representative sample of 75 employers in
Manpower Employment Outlook Survey Global
 Manpower Employment Outlook Survey Global 3 216 Global Employment Outlook ManpowerGroup interviewed nearly 59, employers across 43 countries and territories to forecast labor market activity in Quarter
ManpowerGroup Employment Outlook Survey Finland
 ManpowerGroup Employment Outlook Survey Finland 4 217 The ManpowerGroup Employment Outlook Survey for the fourth quarter 217 was conducted by interviewing a representative sample of 625 employers in Finland.
ManpowerGroup Employment Outlook Survey Hong Kong
 ManpowerGroup Employment Outlook Survey Hong Kong 4 18 Hong Kong Employment Outlook The ManpowerGroup Employment Outlook Survey for the fourth quarter 18 was conducted by interviewing a representative
STAR Conference. 6 th October 2016, London
 STAR Conference 6 th October 2016, London Elica Corporation N#1 PLAYER WORLDWIDE IN HOODS 13% MARKET SHARE 2015 TURNOVER 421.6 M 8 INDUSTRIAL PLANTS WORLDWIDE 2 19 Mln Hoods + Motors Cooking Net Sales:
2014 Consumer Electronics
 2014 Consumer Electronics 2015.09. Catalog 1. China Consumer Electronics Industry Export Trend Analysis... 4 1.1. China Air Conditioner Export Trend Analysis, from Jan. to Dec. 2014...4 1.1.1. China Air
Investor Presentation Q Results. 9 May 2018
 Investor Presentation Q1 2018 Results 9 May 2018 Forward-looking statements This presentation contains forward-looking statements, including, but not limited to, the statements and expectations contained
Group sales US$1,080 million up 4% compared to the first half of the prior financial year
 Hong Kong Exchanges and Clearing Limited and The Stock Exchange of Hong Kong Limited take no responsibility for the contents of this announcement, make no representation as to its accuracy or completeness
ManpowerGroup Employment Outlook Survey Finland
 ManpowerGroup Employment Outlook Survey Finland 4 18 The ManpowerGroup Employment Outlook Survey for the fourth quarter 18 was conducted by interviewing a representative sample of 625 employers in Finland.
ManpowerGroup Employment Outlook Survey Hong Kong
 ManpowerGroup Employment Outlook Survey Hong Kong 1 219 The ManpowerGroup Employment Outlook Survey for the first quarter 219 was conducted by interviewing a representative sample of 652 employers in Hong
ManpowerGroup Employment Outlook Survey Australia
 ManpowerGroup Employment Outlook Survey Australia 4 218 The ManpowerGroup Employment Outlook Survey for the fourth quarter 218 was conducted by interviewing a representative sample of 1,515 employers in
Investor Presentation Q Results. 21 May 2015
 Investor Presentation 2015 Results 21 May 2015 1 Forward-looking statements This presentation contains forward-looking statements, including, but not limited to, the statements and expectations contained
ManpowerGroup Employment Outlook Survey New Zealand
 ManpowerGroup Employment Outlook Survey New Zealand 3 18 New Zealand Employment Outlook The ManpowerGroup Employment Outlook Survey for the third quarter 18 was conducted by interviewing a representative
Manpower Employment Outlook Survey New Zealand
 Manpower Employment Outlook Survey New Zealand 3 216 New Zealand Employment Outlook The Manpower Employment Outlook Survey for the third quarter 216 was conducted by interviewing a representative sample
September 2018 MINERALS TECHNOLOGIES INC. MTI OVERVIEW INNOVATION LEADERSHIP EXCELLENCE
 MINERALS TECHNOLOGIES INC. September 2018 MTI OVERVIEW INNOVATION LEADERSHIP EXCELLENCE SAFE HARBOR STATEMENT This presentation may contain forward-looking statements within the meaning of the Private
Interim results. for the half-year ended 30 September 2010
 Interim results for the half-year ended 30 September 2010 Agenda Results Highlights Strategic Review and Future Prospects 2 1. Results Highlights (million ) Net sales Operating profit Net profit 1 400
AEGIS GROUP PLC 2008 ANNUAL RESULTS. 19 March 2009
 AEGIS GROUP PLC 2008 ANNUAL RESULTS 19 March 2009 AGENDA OVERVIEW OF RESULTS John Napier FINANCIAL REVIEW Alicja Lesniak OUTLOOK John Napier Q&A Aegis Group plc Page 2 OVERVIEW OF RESULTS John Napier,
Investor Presentation Q Results. 8 November 2017
 Investor Presentation Q3 2017 Results 8 November 2017 Forward-looking statements This presentation contains forward-looking statements, including, but not limited to, the statements and expectations contained
Samsonite International S.A Avenue de la Liberte, L-1931, Luxembourg RCS Luxembourg: B (Incorporated under the laws of Luxembourg with
 Samsonite International S.A. 13 15 Avenue de la Liberte, L-1931, Luxembourg RCS Luxembourg: B159469 (Incorporated under the laws of Luxembourg with limited liability) Consolidated financial statements
2013 Interim Results. 14 August 2013
 2013 Interim Results 14 August 2013 1 This presentation contains statements that are, or may be, forward-looking regarding the group's financial position and results, business strategy, plans and objectives.
F U T U R E O F W O R K
 H E A L T H W E A L T H C A R E E R F U T U R E O F W O R K Milan Taylor Partner, Mercer G E O P O L I T I C A L V O L AT I L I T Y G L O B A L T R E N D N O T J U S T U S What is on our employees minds?
Manpower Employment Outlook Survey
 Manpower Employment Outlook Survey Global 4 215 Global Employment Outlook Nearly 59, employers across 42 countries and territories have been interviewed to measure anticipated labor market activity between
Johnson Electric Holdings Limited (Incorporated in Bermuda with limited liability) (Stock Code : 179)
 (Stock Code : 179)") Hong Kong Exchanges and Clearing Limited and The Stock Exchange of Hong Kong Limited take no responsibility for the contents of this announcement, make no representation as to its accuracy or completeness
Hong Kong Exchanges and Clearing Limited and The Stock Exchange of Hong Kong Limited take no responsibility for the contents of this announcement, make no representation as to its accuracy or completeness
ManpowerGroup Employment Outlook Survey Sweden
 ManpowerGroup Employment Outlook Survey Sweden 4 218 Sweden Employment Outlook The ManpowerGroup Employment Outlook Survey for the fourth quarter 218 was conducted by interviewing a representative sample
AUTOMOTIVE COMPONENTS PRODUCT / MARKET MATRIX. AIEC P O Box Arcadia 0007 Tel: Fax: Website:
 AIEC P O Box 0 Arcadia 000 Tel: + 0 00 Fax: + 0 0 Website: www.aiecco.za AUTOMOTIVE COMPONENTS PRODUCT/MARKET MATRIX A diverse range of original components and aftermarket are manufactured in South Africa.
Johnson Electric Holdings Limited. Interim Report (Stock Code: 179)
") Interim Report 2014 (Stock Code: 179) INTERIM REPORT FOR THE SIX MONTHS ENDED 30 SEPTEMBER 2014 CONTENTS HIGHLIGHTS AND LETTER TO SHAREHOLDERS 2 GLOSSARY OF TERMS 6 MANAGEMENT S DISCUSSION AND ANALYSIS
Interim Report 2014 (Stock Code: 179) INTERIM REPORT FOR THE SIX MONTHS ENDED 30 SEPTEMBER 2014 CONTENTS HIGHLIGHTS AND LETTER TO SHAREHOLDERS 2 GLOSSARY OF TERMS 6 MANAGEMENT S DISCUSSION AND ANALYSIS
1st Half 2010 Results. July 29, 2010
 Results July 29, 2010 1 Disclaimer This presentation contains forward-looking statements. The use of the words "aim(s)," "expect(s)," "feel(s)," "will," "may," "believe(s)," "anticipate(s)" and similar
Manpower Employment Outlook Survey South Africa
 Manpower Employment Outlook Survey South Africa 3 216 South Africa Employment Outlook The Manpower Employment Outlook Survey for the third quarter 216 was conducted by interviewing a representative sample
HSBC Holdings plc Annual Results
 HSBC Holdings plc Forward-looking statements This presentation and subsequent discussion may contain certain forward-looking statements with respect to the financial condition, results of operations and
First ever quarter with over 200m Gross Profit
 11 July 2018 and H1 2018 Trading Update Steve Ingham Kelvin Stagg Chief Executive Officer Chief Financial Officer First ever quarter with over 200m Gross Profit LSE: PAGE.L Website: http://www.page.com/investors
FY2012 Results Presentation FRENCKEN GROUP LIMITED INCORPORATED IN SINGAPORE
 INCORPORATED IN SINGAPORE 1 Agenda Financial Review Key Figures for FY2012 Corporate Overview Mechatronics Division Business Review Outlook EMS Division Business Review Outlook 2 Financial Review FY2012
ITW Conference Call Fourth Quarter 2012
 ITW Conference Call Fourth Quarter 2012 January 29, 2013 SOLID GROWTH. STRONG RETURNS. BEST-IN-CLASS OPERATOR. 100 YEARS STRONG Safe Harbor Statement Forward-Looking Statements This conference call contains
FINAL RESULTS ANNOUNCEMENT FOR THE YEAR ENDED 31 MARCH 2010 FINANCIAL HIGHLIGHTS. Own stores number reached 764, increased by 11.
 Hong Kong Exchanges and Clearing Limited and The Stock Exchange of Hong Kong Limited take no responsibility for the contents of this announcement, make no representation as to its accuracy or completeness
Credit Suisse 2007 Asia Investors Conference. March 28-29, 2007
 Credit Suisse 2007 Asia Investors Conference March 28-29, 2007 1 Safe Harbor Statement All numbers are consolidated. Except for statements in respect of historical matters, the statements contained in
BANK OF AMERICA MERRILL LYNCH CONSUMER & RETAIL CONFERENCE. March 4, 2015
 2015 BANK OF AMERICA MERRILL LYNCH CONSUMER & RETAIL CONFERENCE March 4, 2015 Whirlpool Corporation Additional Information This document contains forward-looking statements about Whirlpool Corporation
HUGO BOSS First Nine Months Results 2011
 HUGO BOSS First Nine Months Results 2011 Mark Langer (CFO) November 2, 2011 Conference Call, First Nine Months Results 2011 HUGO BOSS November 2, 2011 2 / 30 AGENDA OPERATIONAL HIGHLIGHTS FIRST NINE MONTHS
CLSA Asia Investors Forum Las Vegas, February 2009
 Online Magazines Trade shows Research (NASDAQ-GS: GSOL) CLSA Asia Investors Forum Las Vegas, February 2009 Merle A. Hinrichs Chairman & CEO Safe Harbor This presentation contains forward-looking statements
4 th quarter and annual results 2013
 4 th quarter and annual results 2013 a gradual recovery Ben Noteboom, CEO Robert Jan van de Kraats, CFO Jacques van den Broek Randstad Holding nv disclaimer & definitions Certain statements in this document
Brambles reports results for the half-year ended 31 December 2017
 Brambles Limited ABN 89 118 896 021 Level 10, 123 Pitt Street Sydney NSW 2000 Australia GPO Box 4173 Sydney NSW 2001 Tel +61 2 9256 5222 Fax +61 2 9256 5299 www.brambles.com 19 February 2018 The Manager
Compagnie Financière Tradition
 Compagnie Financière Tradition H1 2016 results presentation Zurich 1 September 2016 First semester activity in a stabilising market environment Results overview H1 2016 Performance Differentiation in revenue
Report on Finnish Technology Industry Exports
 Report on Finnish Technology Industry Exports Last observation October 2018, 2.1.2019 Goods Export of Technology Industry from Finland Goods Export of Technology Industry from Finland by Branches Source:
Local knowledge. Global expertise. abilities 2016
 Local knowledge. Global expertise. abilities 2016 See opportunity where others don t. Maximize the opportunity every transaction offers. Drive revenue, acquire new customers, and improve customer loyalty
Presentation 22 August 2018
 Presentation 22 August 2018 Exceeded 3YP targets in 2017, but 2018 is challenging due to continued destocking, store closures and bankruptcies Profit attributable to shareholders (like-for-like) down 19%
Table Lamp & Reading Light Produced by IAR Team Focus Technology Co., Ltd
 Table Lamp & Reading Light 2012.12 Produced by IAR Team Focus Technology Co., Ltd Contents 1. Chinese Table Lamps & Reading Lights Industry Export from Jan. to Nov. in 2012... 3 1.1. Export Quantity &
Third Quarter 2017 Results Jan Jenisch, CEO Ron Wirahadiraksa, CFO. October 27, 2017 LafargeHolcim Ltd 2015
 Third Quarter 2017 Results Jan Jenisch, CEO Ron Wirahadiraksa, CFO October 27, 2017 LafargeHolcim Ltd 2015 01 Initial views Q3 2017 and Outlook Jan Jenisch, Chief Executive Officer 2017 LafargeHolcim 2
3 rd Quarter Revenue. October 20, 2011
 3 rd Quarter Revenue October 20, 2011 DISCLAIMER This presentation contains forward-looking statements. The use of the words "aim(s)," "expect(s)," "feel(s)," "will," "may," "believe(s)," "anticipate(s)"
Overview of Transfer Pricing Regulations. CA Akshay Kenkre
 Overview of Transfer Pricing Regulations CA Akshay Kenkre 1 What is Transfer Pricing What is Transfer Price? A Price at which one person transfers physical goods, services, tangible or/ and intangibles
IPG Photonics Corporation. Third Quarter 2009 Conference Call Prepared Remarks
 IPG Photonics Corporation Third Quarter 2009 Conference Call Prepared Remarks Operator: Good morning, and welcome to IPG Photonics third-quarter 2009 conference call. Today's call is being recorded and
1st Quarter Revenue. April 22, 2010
 1st Quarter Revenue April 22, 2010 Disclaimer This presentation contains forward looking statements. The use of the words "aim(s)," "expect(s)," "feel(s)," "will," "may," "believe(s)," "anticipate(s)"
Conference Call on Q November 6, 2018
 Conference Call on Q3 2018 November 6, 2018 Q3 2018 Headlines Top line growth of +0.5% to EUR 405.8 million, organically up by +5.3% EBIT pre PPA at EUR 23.8 million, EBIT margin pre PPA at 5.9% Solid
HALF-YEARLY REPORT 2003 Stockholm, July 17, 2003
 HALF-YEARLY REPORT Stockholm, July 17, Higher income for Consumer Durables in Europe, in a difficult environment Continued good sales growth and higher income in USD for Consumer Durables, North America
Interim Results. For the six months ended June 30, 2011
 Interim Results For the six months ended June 30, 2011 Agenda Business and Financial Highlights Business Overview Financial Overview Concluding Remarks 2 Business Highlights in 1H 2011 Significant sales
ManpowerGroup Employment Outlook Survey Australia
 ManpowerGroup Employment Outlook Survey Australia 1 19 The ManpowerGroup Employment Outlook Survey for the first quarter 19 was conducted by interviewing a representative sample of 1,5 employers in Australia.
FY 2016 Results March 2nd, 2017
 FY 2016 Results March 2nd, 2017 Definitions & assumptions In this presentation: ForEx stands for Foreign Exchange Rates; Organic stands for effect net of ForEx and hedging derivatives; Q4 stands for fourth
Earnings Conference Call and Webcast 3 rd Quarter 2017 Financial Results
 1 st Earnings Conference Call and Webcast 3 rd Quarter 2017 Financial Results 1 Safe Harbor Statement* This presentation contains statements that are not historical facts but rather forward-looking statements
2018 Full Year Results 20 November 2018
 2018 Full Year Results 20 November 2018 Disclaimer Certain information included in the following presentation is forward looking and involves risks, assumptions and uncertainties that could cause actual
Quarterly Investment Update First Quarter 2017
 Quarterly Investment Update First Quarter 2017 Market Update: A Quarter in Review March 31, 2017 CANADIAN STOCKS INTERNATIONAL STOCKS Large Cap Small Cap Growth Value Large Cap Small Cap Growth Value Emerging
INVESTMENT MARKET UPDATE UBC FACULTY PENSION PLAN
 INVESTMENT MARKET UPDATE UBC FACULTY PENSION PLAN MIKE LESLIE, FACULTY PENSION PLAN NEIL WATSON, LEITH WHEELER FEBRUARY 12, 2014 Presenters Mike Leslie Executive Director, Investments Faculty Pension Plan
ManpowerGroup Employment Outlook Survey Czech Republic
 ManpowerGroup Employment Outlook Survey Czech Republic 3 217 Czech Republic Employment Outlook The ManpowerGroup Employment Outlook Survey for the third quarter 217 was conducted by interviewing a representative
Second Quarter 2018 Earnings Teleconference. July 31, 2018
 Second Quarter 2018 Earnings Teleconference July 31, 2018 CONTENTS Q2 2018 Summary 2018 Guidance Q2 2018 Supplemental Information Appendix 2 Disclosure Regarding Forward-Looking Statements Information
ManpowerGroup Employment Outlook Survey Sweden
 ManpowerGroup Employment Outlook Survey Sweden 1 219 Sweden Employment Outlook The ManpowerGroup Employment Outlook Survey for the first quarter 219 was conducted by interviewing a representative sample
Star Conference 2014 London
 Star Conference 2014 London 2 AGENDA 1. Company Overview 2. Market Development & Strategic Direction 3. Financial 3 Elica Group Founded in 1970 Today N#1 Player Worldwide in Hoods Market Leader 2013 Turnover
Another quarter of double digit growth
 11 April 2018 2018 Trading Update Steve Ingham Kelvin Stagg Chief Executive Officer Chief Financial Officer Another quarter of double digit growth LSE: PAGE.L Website: http://www.page.com/investors Headline
Electrocomponents 2017 half-year financial results. 18 November 2016
 Electrocomponents 2017 half-year financial results 18 November 2016 Agenda Overview of results Lindsley Ruth Financial results and performance update David Egan Performance Improvement Plan Lindsley Ruth
First Quarter Interim Management Statement. 11 April 2011
 First Quarter Interim Management Statement 11 April 211 Michael Page International First Quarter Interim Management Statement 2 Group Gross profit +29% with growth in every geography Growth Rates Group
THIRD QUARTER OCTOBER 2018
 THIRD QUARTER 2018 18 OCTOBER 2018 DISCLAIMER Certain information contained in this document, other than historical information, may constitute forward-looking statements or unaudited financial forecasts.
COMPANY PRESENTATION NOVEMBER
 COMPANY PRESENTATION NOVEMBER 2018 DISCLAIMER This presentation includes or may include representations or estimations concerning the future about intentions, expectations or forecasts of VIDRALA or its
Capital Access Index 2006 Gauging Entrepreneurial Access to Capital
 Capital Access Index 2006 Gauging Entrepreneurial Access to Capital Max = 10 9.0 Hong Kong 8.5 8.0 7.5 7.0 6.5 6.0 5.5 5.0 4.5 40 Source: Milken Institute United Kingdom U.S. India China Brazil Russia
QUARTERLY REPORT For the six months ended September 30, 2017
 QUARTERLY REPORT For the six months ended September 30, 2017 QUALITATIVE INFORMATION (1) Qualitative Information Relating to Consolidated Quarterly Operating Results During the six-month period under review,
Earnings Conference Call and Webcast 1 st Quarter 2018 Financial Results
 1 st Earnings Conference Call and Webcast 1 st Quarter 2018 Financial Results 1 Safe Harbor Statement* This presentation contains statements that are not historical facts but rather forward-looking statements
TELECONFERENCE Q FINANCIAL RESULTS
 TELECONFERENCE FINANCIAL RESULTS 10:00 CET, 13 May 2014 1 AGENDA AGENDA Business highlights: Key developments in Market development and sales-out Performance of newly launched products Guidance 2014 Financial
1 st quarter 2015 results
 1 st quarter 2015 results continued improvement Jacques van den Broek, CEO Robert Jan van de Kraats, CFO Randstad Holding nv disclaimer & definitions Certain statements in this document concern prognoses
February 2019 MINERALS TECHNOLOGIES INC. MTI OVERVIEW INNOVATION LEADERSHIP EXCELLENCE
 MINERALS TECHNOLOGIES INC. February 2019 MTI OVERVIEW INNOVATION LEADERSHIP EXCELLENCE SAFE HARBOR STATEMENT This presentation may contain forward-looking statements within the meaning of the Private Securities
Presentation of results for the six months ended 30 th September st November 2017
 Presentation of results for the six months ended 30 th September 2017 21 st November 2017 Cautionary statement This presentation contains forward looking statements that are subject to risk factors associated
Michigan s Economic Future and MEDC Initiatives
 Michigan s Economic Future and MEDC Initiatives Doug Smith, Senior Vice President, Governmental Affairs & Strategic Partnerships Michigan Economic Development Corporation Apartment Association of Michigan
RECENT EVOLUTION AND OUTLOOK OF THE MEXICAN ECONOMY BANCO DE MÉXICO OCTOBER 2003
 OCTOBER 23 RECENT EVOLUTION AND OUTLOOK OF THE MEXICAN ECONOMY BANCO DE MÉXICO 2 RECENT DEVELOPMENTS OUTLOOK MEDIUM-TERM CHALLENGES 3 RECENT DEVELOPMENTS In tandem with the global economic cycle, the Mexican
Q Preliminary Earnings Results Summary. February 1, 2018
 Q4 2017 Preliminary Earnings Results Summary February 1, 2018 SAFE HARBOR STATEMENT This presentation may contain projections or other forward-looking statements within the meaning Section 27A of the Private
TELECONFERENCE Q FINANCIAL RESULTS
 TELECONFERENCE FINANCIAL RESULTS 10:00 CET, 11 November 2014 1 12 AUGUST 2014 AGENDA AGENDA Business highlights: Key developments in Market development and sales-out Performance of newly launched products
Overview of Hungary s economy
 Overview of Hungary s economy Dr. Petra Ponevács-Pana Deputy State Secretary for Investment Promotion Ministry of Foreign Affairs and Trade of Hungary Helsinki, Finland 26th November 2018 Hungary s economic
TI Fluid Systems plc Half Year Results Presentation for TI Fluid Systems plc. 8 August 2018
 2018 Half Year Results Presentation for 8 August 2018 Disclaimer This presentation contains certain forward-looking statements with respect to the financial condition, results of operations and business
TELECONFERENCE FY 2014 FINANCIAL RESULTS
 TELECONFERENCE FY 2014 FINANCIAL RESULTS 10:00 CET, 17 February 2015 1 DISCLAIMER Certain statements in this presentation constitute forward-looking statements. Forward-looking statements are statements
Global Business Barometer April 2008
 Global Business Barometer April 2008 The Global Business Barometer is a quarterly business-confidence index, conducted for The Economist by the Economist Intelligence Unit What are your expectations of
ABB Q results Joe Hogan, CEO Michel Demaré, CFO
 April 25, 2012 ABB Group Q3 2008 investor presentation April 26, 2012 ABB Q1 2012 results Joe Hogan, CEO Michel Demaré, CFO ABB Group April 26, 2012 Chart 1 Safe-harbor statement This presentation includes
Copyright 2014 HomeAway Inc.
 Copyright 2014 HomeAway Inc. Safe harbor statement This presentation contains "forward-looking" statements, subject to the safe harbor provisions of the Private Securities Litigation Reform Act of 1995,
Half-year 2014 results. May 16 th, 2014
 Half-year 2014 results May 16 th, 2014 Winter 2014 2 Pragelato-Vialattea, Italia Differences between the final figures and estimated data* *Published on April 28 th, 2014 (in m) S1 12 S1 13 S1 14 estimated
Investor Presentation. December 2015
 Investor Presentation December 2015 Disclaimer This presentation contains forward-looking statements that are based on current expectations, forecasts and projections, including (but not limited to) expected
Investor Presentation
 Investor Presentation May 2013 48,000 employees 200 offices 70 countries 1 global platform Table of Contents I. Company Description II. Global Growth Strategy III. Financial Overview IV. Appendix 2 Company
VEDP QUARTERLY ECONOMIC UPDATE
 VEDP QUARTERLY ECONOMIC UPDATE September 2016 VIRGINIA ECONOMIC DEVELOPMENT PARTNERSHIP YESVIRGINIA.ORG 1 US ECONOMIC OUTLOOK 1 8% - Source: Consensus Forecasts, September 2016 2 US WEEKLY INDICATORS 5%
Media Presentation. 11th February 2009
 Fourth quarter and annual results 2008 Media Presentation 11th February 2009 Disclaimer Forward-Looking Statements This document may contain forward-looking information and statements about ArcelorMittal
2013Q3 Wind Instrument Produced by IAR Team Focus Technology Co., Ltd.
 2013Q3 Wind Instrument 2014.07 Produced by IAR Team Focus Technology Co., Ltd. Contents 1. China Wind Instrument Exports from Jan. to October in 2013... 3 1.1. China Wind Instrument Export Volume and Value