AGENDA EBMUD EMPLOYEES RETIREMENT SYSTEM March 19, 2015 Training Resource Center (TRC1) 8:30 a.m.
|
|
|
- Daniel Moody
- 6 years ago
- Views:
Transcription

1
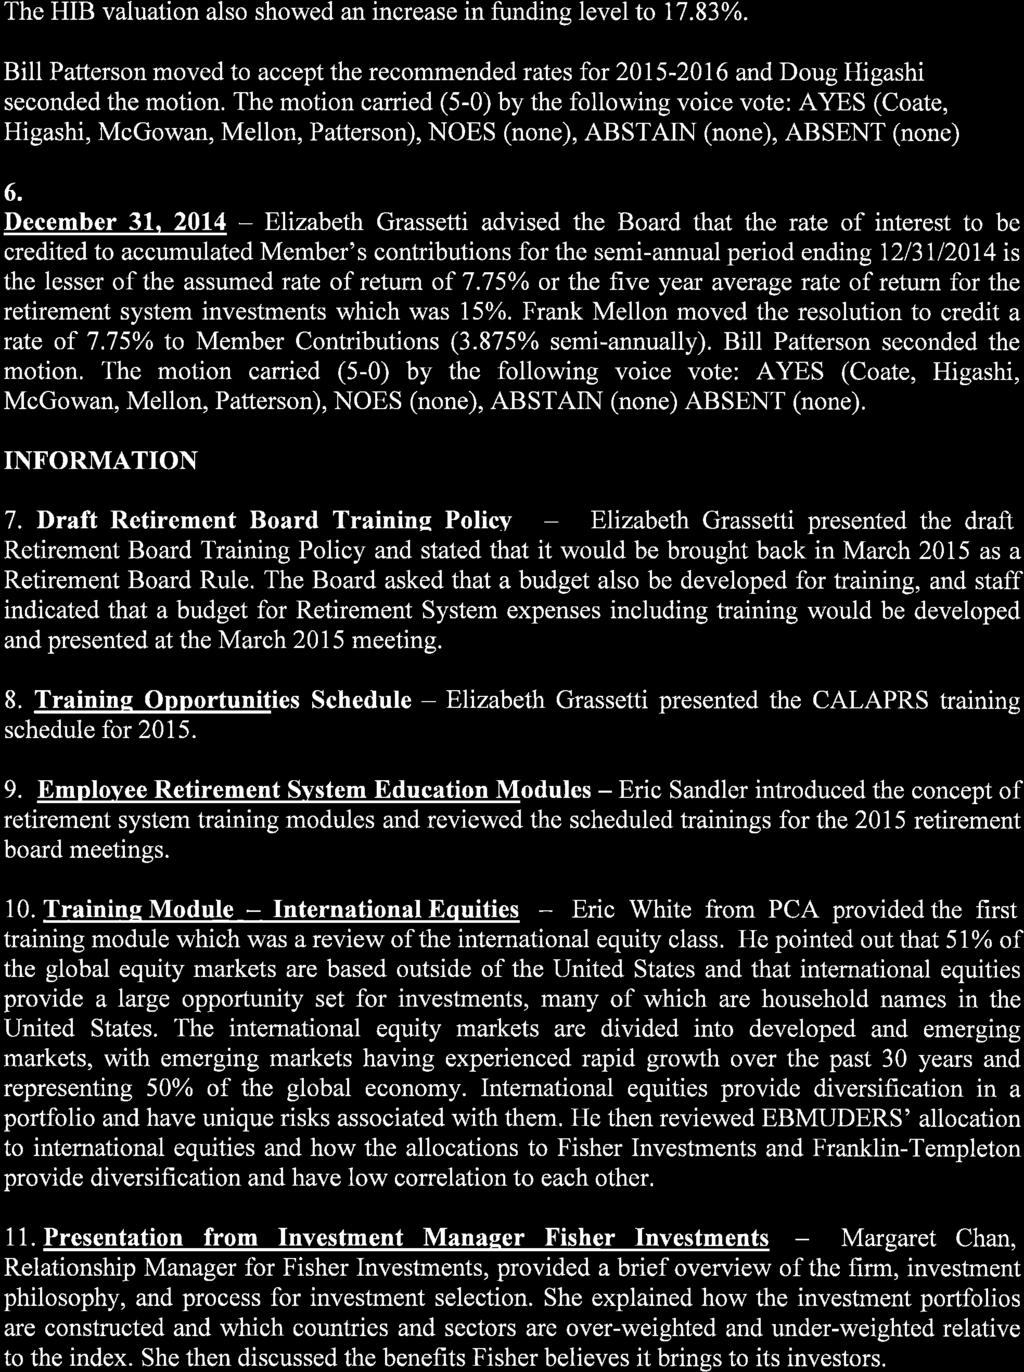
2 AGENDA EBMUD EMPLOYEES RETIREMENT SYSTEM March 19, 2015 Training Resource Center (TRC1) 8:30 a.m. ROLL CALL: PUBLIC COMMENT: The Retirement Board is limited by State Law to providing a brief response, asking questions for clarification, or referring a matter to staff when responding to items that are not listed on the agenda. CONSENT CALENDAR: 1. Approval of Minutes Regular meeting of January 15, Ratifying and Approving Investment Transactions by Counselors for December 2014 and January 2015 (R.B. Resolution No. 6816) 3. Ratifying and Approving Short-Term Investment Transactions by Treasurer for December 2014 and January 2015 (R.B. Resolution No. 6817) 4. Treasurer s Statement of Receipts and Disbursements for December 2014 and January 2015 ACTION: 5. Determination of the annual retiree Cost Of Living Adjustment (COLA) to be effective July 1, 2015 (R.B. Resolution No. 6818) E. Grassetti 6. Adopt Retirement Board Rule C-23 Retirement Board Training Policy (R.B. Resolution No. 6819) E. Grassetti INFORMATION: 7. Retirement System Training E. Grassetti 8. 4 th Quarter Performance Review as of December 31, 2014 E. Sandler 9. Actuarial Funding Policy Update E. Sandler 10. Review of Proposed Board of Directors Vesting Change L. Matthew / E. Grassetti 11. Training Module Domestic Equities E. Sandler 12. Investment Manager Presentation E. Sandler
3 13. Review of HIB and COLA E. Grassetti 14. Retirement Board Member Election Schedule E. Grassetti REPORTS FROM THE RETIREMENT BOARD: 15. Brief report on any course, workshop, or conference attended since the last Retirement Board meeting. ITEMS TO BE CALENDARED: MEETING ADJOURNMENT: The next regular meeting of the Retirement Board will be held at 8:30 a.m. on Thursday, May 21, Retirement Board Meetings May 21, 2015 July 16, 2015 September 17, 2015 November 19, 2015

4
5

6

7


8
9
10

11
12
13

14
15


16
17
18

19
20

21

22

23

24

25
26

27


28 4Q 2014 EAST BAY MUNICIPAL UTILITY DISTRICT QUARTERLY REPORT This report is solely for the use of client personnel. No part of it may be circulated, quoted, or reproduced for distribution outside the client organization without prior written approval from Pension Consulting Alliance, Inc. Nothing herein is intended to serve as investment advice, a recommendation of any particular investment or type of investment, a suggestion of the merits of purchasing or selling securities, or an invitation or inducement to engage in investment activity.
29 EBMUD Quarterly Report 4Q 2014 page 2 TABLE OF CONTENTS 1 INTRODUCTION 2 INVESTMENT MARKET RISK METRICS 3 ECONOMIC OVERVIEW 4 EBMUD PORTFOLIO REVIEW Risk Return Analysis Total Plan Performance Asset Allocation Manager Performance Performance Monitoring Peer Universe APPENDIX Glossary of Terms EBMUD Policy Benchmark Composition Definition of Benchmarks Risk Metric Description
30 EBMUD Quarterly Report 4Q 2014 page 3 INTRODUCTION The EBMUD Total Portfolio had an aggregate value of $1.4 billion as of December 31, During the latest quarter, the Total Portfolio increased in value by $29.3 million, and over the latest year the Total Portfolio increased by $102.5 million. Outside of international equities and commodities, the majority of global markets finished the year strong with positive returns during the fourth quarter of U.S. equities as a whole were up approximately 5% for the quarter, as small cap stocks rebounded from a very poor third quarter to produce returns of 9-10%. Developed international and emerging market equities produced negative returns for the second straight quarter as a strengthening U.S. dollar acted as a headwind to U.S. investors. The broad commodity market produced its second quarter in a row of double digit losses as the price of oil dropped to near $50 a barrel at quarter end, its lowest price since The Federal Reserve concluded their bond buying program in the quarter and stated that they remain on course but will remain cautious when deciding to raise rates in mid During 2015, U.S. and European central bank actions, commodity prices, currency fluctuations, and economic growth will remain dominant influences in the investment markets. Asset Allocation Trends With respect to policy targets, the Total Portfolio ended the latest quarter overweight Domestic Equity and Cash, underweight International Equity and Total Fixed Income, and relatively near target in all other asset classes (variance < 0.5%). The asset allocation targets (see table on page 22) reflect those elected by the Board in September Recent Investment Performance The Total Portfolio outperformed the policy benchmark over each time period measured ending December 31, Relative outperformance for the recent quarter was due to strong results posted in Public Equities and Real Estate. Trailing 10-year results underperformed EBMUD s 7.75% actuarial rate, but 20-year results exceeded it. The Total Portfolio outperformed the Median Public Fund return over each time period reported which can be attributed to overall asset allocation differences, most notably the Total Portfolio s larger allocation to domestic equity investments (including covered calls). Recent Investment Performance, Gross of Fees Quarter 1 Year 3 Year 5 Year 10 Year 20 Year Total Portfolio Policy Benchmark Excess Return Quarter 1 Year 3 Year 5 Year 10 Year 20 Year Total Portfolio Median Public Fund Excess Return Policy Benchmark consists of 40% Russell 3000 (blend), 15% MSCI ACWIxU.S. (blend), 20% CBOE BXM, 10% BC Aggregate, 5% BC US 1-3 Year Government/Credit, 2.5% BC 1-5 Year U.S. High Yield Cash Pay, 2.5% S&P/LSTA Performing Loans, 2.5% NCREIF (lagged), and 2.5% FTSE NAREIT All Equity REITs index 4/1/14-present; see Appendix for historical Policy Benchmark composition. 2 Mellon Total Fund Public Universe.
31 EBMUD Quarterly Report 4Q 2014 page 4 INVESTMENT MARKET RISK METRICS 3 U.S. equity valuation metrics hit new post-financial-crisis highs and remain within top decile valuation levels. Commodity prices remain in freefall (oil <$50), hitting lowest inflation-adjusted levels since index inception. Oil prices declined almost 30% in one month. Breakeven inflation continued to drop, declining to a reading of below 1.7% for the first time since the Euro crisis and bailouts of The yield on the 10-year Treasury declined below 2% after month end. The yield curve slope flattened (bearish), as long-term rates declined. The PCA Market Sentiment Indicator PMSI remained neutral in December, after turning neutral in November. The trend is down. This change was driven by year-over-year credit spread widening While, year-over-year equity returns remain comfortably positive Conflicting signals result in a grey (inconclusive / neutral) sentiment reading Commodity price declines, low inflation expectations, and falling interest rates point to global growth concerns, particularly outside of the United States. U.S. stock markets rose. Stock markets outside the U.S. broadly declined. Private equity valuations remain at top decile levels. U.S. equity volatility (VIX) rose, but only to 19, near long-term average levels. 3 See Appendix for the rationale for selection and calculation methodology used for the risk metrics.
32 EBMUD Quarterly Report 4Q 2014 page 5 Top Decile Valuation Metrics versus Historical Range A Measure of Risk Unfavorable Pricing Average Neutral Bottom Decile Favorable Pricing US Equity (Ex. 1) Dev ex US Equity (Ex. 2) EM Equity Relative to DM Equity (Ex. 3) Private Equity (Ex. 4, 5) Private Real Estate Cap Rate (Ex. 6) Private Real Estate Spread (Ex. 7) US IG Corp Debt Spread (Ex. 9) US High Yield Debt Spread (Ex. 10) Other Important Metrics within their Historical Ranges Pay Attention to Extreme Readings Top Decile Attention! Average Neutral Bottom Decile Attention! Equity Volatility (Ex. 11) Yield Curve Slope (Ex. 12) Breakeven Inflation (Ex. 13, 14) Interest Rate Risk (Ex. 15, 16)
33 EBMUD Quarterly Report 4Q 2014 page 6 PCA Market Sentiment Indicator (1995-Present) Positive Positive Neutral Neutral Negative Negative Avoid Growth Risk Growth Risk Neutral Embrace Growth Risk PCA Sentiment Indicator PCA Market Sentiment Indicator - Most Recent 3-Year Period Positive Positive Neutral Neutral Negative Negative Avoid Growth Risk Growth Risk Neutral Embrace Growth Risk PCA Sentiment Indicator Information Behind Current Sentiment Reading Bond Spread Momentum Trailing-Twelve Months Negative Equity Return Momentum Trailing-Twelve Months Positive Neutral Agreement Between Bond and Equity Momentum Measures? Disagree Growth Risk Visibility (Current Overall Sentiment)
34 P/E Ratio P/E Ratio EBMUD Quarterly Report 4Q 2014 page 7 Developed Public Equity Markets Exhibit U.S. Equity Market P/E Ratio 1 versus Long-Term Historical Average US Markets Current P/E as of 12/2014 =26.6x US Markets Long-term Average (since 1880) P/E = 16.5x 1 P/E ratio is a Shiller P/E-10 based on 10 year real S&P 500 earnings over S&P 500 index level. (Please note different time scales) Exhibit Developed ex-u.s. Equity Market P/E Ratio 1 versus Long-Term Historical Average 2 Average /2014 EAFE Only P/E = 24.1x Long-term Average Historical 2 P/E = 17.0x Intl Developed Markets Current P/E as of 12/2014 = 14.5x 1 P/E ratio is a Shiller P/E-10 based on 10 year real MSCI EAFE earnings over EAFE index level. 2 To calculate the LT historical average, from 1881 to 1982 U.S. data is used as developed market proxy. From 1982 to present, actual developed ex-us market data (MSCI EAFE) is used.
35 EBMUD Quarterly Report 4Q 2014 page 8 Emerging Markets Public Equity Markets Exhibit 3 275% Emerging Markets PE / Developed Markets PE (100% = Parity between PE Ratios) 250% 225% 200% Russian crisis, LTCM implosion, currency devaluations EM/DM relative PE ratio is marginally below average 175% 150% Mexican Peso crisis Technology and telecom crash World financial crisis 125% 100% 75% 50% 25% Asian crisis Commodityprice run-up 0% Source: Bloomberg, MSCIWorld, MSCI EMF EM/DM PE Average EM/DM PE Parity
36 Billions ($) EBMUD Quarterly Report 4Q 2014 page 9 U.S. Private Equity Markets Exhibit Price to EBITDA Multiples Paid in LBOs Multiples have risen above the pre-crisis highs. 5.0 Source: S&P LCD study (Please note different time scales) Exhibit Disclosed U.S. Quarterly Deal Volume* Deal volume remains in an upward trend. Source: Thomson Reuters Buyouts * quarterly total deal size (both equity and debt)
37 Cap Rate Spread Cap Rates EBMUD Quarterly Report 4Q 2014 page 10 Exhibit 6 Source: NCRIEF Exhibit % 16.0% 14.0% 12.0% 10.0% 8.0% 6.0% 4.0% 2.0% 0.0% 5.0% 4.0% Core Cap Rate 30 Year Average Cap Rate 10 Year Treasury Rate A cap rate is the current annual income of the property divided by an estimate of the current value of the property. It is the current yield of the property. dlow cap rates indicate high valuations. Private Real Estate Markets Current Value Cap Rates 1 Quarterly Data, Updated to Dec. 31st Core real estate cap rates remain low by historical standards (expensive). Core Cap Rate Spread over 10-Year Treasury Interest Rate Spread to the 10-year Treasury widened due to recent compression of U.S. interest rates. 3.0% 2.0% 1.0% Core Cap Rate Spread to Treasuries LT Average Spread 0.0% Exhibit % Transactions as a % of Market Value Trailing-Four Quarters 15.0% Activity continues trending up. 10.0% 5.0% 0.0% Source: NCREIF, PCA calculation
38 Spread Over Treasuries (basis points) Spread Over Treasuries (basis points) EBMUD Quarterly Report 4Q 2014 page 11 Credit Markets U.S. Fixed Income Exhibit Investment Grade Corporate Bond Spreads Investment grade spreads ticked above 100 bps in December, but remain below the long-term average level. Investment Grade Bond Spreads Average spread since 1994 (IG Bonds) Source: LehmanLive: Barclays Capital US Corporate Investment Grade Index Intermediate Component. Exhibit High Yield Corporate Bond Spreads High yield spreads widened again in December, but remain below the long-term average level. High Yield Bond Spreads Average spread since 1994 (HY Bonds) Source: LehmanLive: Barclays Capital U.S. Corporate High Yield Index.
39 EBMUD Quarterly Report 4Q 2014 page 12 Other Market Metrics Exhibit VIX - a measure of equity market fear / uncertainty Equity market volatility (VIX) rose during December, and finished the month at roughly 19; just below the long-term average level ( 20). Source: (Please note different time scales) Exhibit Yield Curve Slope The average 10-year Treasury interest rate ticked down during December. The average short-term rate (the one-year Treasury) rose from 13 bps to 21 bps. The change in slope over the month was down, but the yield curve remains very steeply upward sloping. Yield curve slopes that are negative (inverted) portend a recession. Source: (10-year treasury yield minus 1-year treasury yield) Recession Dating: NBER
40 EBMUD Quarterly Report 4Q 2014 page 13 Measures of Inflation Expectations Exhibit % 10-Year Breakeven Inflation (10-year nominal Treasury yield minus 10-year TIPS yield) 2.50% 2.00% 1.50% 1.00% 0.50% Breakeven inflation ended December at 1.68%, declining from the end of November. The 10-year TIPS real-yield increased to 0.49%, while the nominal 10-year Treasury yield ticked down to 2.17%. 0.00% Source: Daily Yield Curve Rates (10-year nominal treasury yield minus 10-year TIPs yield) (Please note different time scales) Exhibit Inflation Adjusted Bloomberg Commodity Price Index (1991 = 100) Broad commodity prices declined in December, hitting the lowest level (inflation adjusted) since the dataset began in Source: Bloomberg Commodity Index, St. Louis Fed for US CPI all urban consumers.
41 EBMUD Quarterly Report 4Q 2014 page 14 Exhibit 15 Expected Real Yield of 10 Year Treasury Measures of U.S. Treasury Interest Rate Risk Estimate of 10 Year Treasury Forward Looking Real Yield Sources: 10 year constant maturity rates *Federal Reserve Bank of Philadelphia survey of professional forecasts for inflation estimates The forward looking annual real yield on 10 year Treasuries is estimated at approximately 0.01% real, assuming 10 year annualized inflation of 2.20%* per year. Note: this decline in real yield estimates is driven by the decline in market yields versus slower moving survey based inflation estimates. Exhibit Year Treasury Bond Duration Higher Risk Lower Risk 10 Year Treasury Duration (Change in Treasury price with a change in interest rates) Interest rate risk is off the 30 year high, but not by much. If the 10 year Treasury yield rises by 100 basis points from today's levels, the capital loss from the change in price is expected to be 8.9%. Source: for 10 year constant maturity rates, calculation of duration
42 EBMUD Quarterly Report 4Q 2014 page 15 ECONOMIC OVERVIEW US Equities recovered from sharp selloffs in October and December to reach all time highs near the end of International equities faced economic growth concerns and deflationary pressures, causing international equities to post their second consecutive negative quarter and pushing them into negative territory for the year. US GDP (advanced estimate) continued to grow in the fourth quarter but decelerated from the third quarter, primarily due to an upturn in imports, a downturn in federal government spending, and declines in nonresidential fixed investment and in exports. The unemployment rate continued its gradual decline hitting 5.6% at the end of the quarter. Inflation also declined during the quarter and finished <1% for the year. In October, the Fed followed through and ended its bond-buying program in addition to assuring investors that they are taking a cautious approach to raising short-term interest rates in The US dollar continued to rally against the Euro, acting as a headwind for non-dollar denominated international and emerging market financial assets, as it appreciated another 4.2% during the quarter ending at +12.0% versus other currencies for the year. Commodities suffered a double digit decline for the second straight quarter as oil prices ended the quarter near $50 a barrel, a level not seen since Economic Growth Real GDP increased at an annualized rate of 2.5 percent in the fourth quarter of 2014 after increasing at an annualized rate of 5.0 percent in the third quarter of GDP growth deceleration was accounted for by an upturn in imports, a downturn in federal government spending, and declines in nonresidential fixed investment and in exports. Private inventory investment and an acceleration in personal consumption expenditures were two of the main contributors to GDP growth during the quarter. 4.5% 2013 Q3 3.5% 2013 Q4 Annualized Quarterly GDP Growth -2.1% 2014 Q1 4.6% 2014 Q2 5.0% 2014 Q3 2.6% 2014 Q4 Est. 6.0% 3.0% 0.0% -3.0% -6.0% Inflation The Consumer Price Index for All Urban Consumers (CPI-U) decreased by 2.5 percent in the quarter on an annualized basis, after seasonal adjustment, due mainly to declines of energy prices. Quarterly percent changes may be adjusted between data publications due to periodic updates in seasonal factors. Core CPI-U increased by 1.1 percent for the quarter on an annualized basis. 1.5% 2013 Q3 CPI-U After Seasonal Adjustment 1.5% 1.8% 3.5% -0.1% 2013 Q Q Q Q3-2.50% 2014 Q4 6.0% 4.0% 2.0% 0.0% -2.0% -4.0% -6.0% Over the last 12 months, CPI-U increased 1.6 percent after seasonal adjustment. Unemployment Unemployment Rate The US economy gained approximately 866,000 jobs in the quarter. 10.0% The official unemployment rate dropped to 5.6% at quarter end. The majority of jobs gained occurred in professional and business services, education and health services, and leisure and hospitality. 7.2% 2013 Q3 6.7% 2013 Q4 6.7% 2014 Q1 6.1% 2014 Q2 5.9% 2014 Q3 5.6% 2014 Q4 8.0% 6.0% 4.0%

43 -1.0% 1.8% 1.9% 1.8% 1.8% 2.5% 4.9% 6.0% 6.1% 7.5% EBMUD Quarterly Report 4Q 2014 page 16 Interest Rates & US Dollar Treasury Yield Curve Changes US Treasury yields fell on average over the quarter. The Federal Reserve has maintained the federal funds rate between 0.00% and 0.25% since December % 4.0% 09/30/14 12/31/14 The US dollar appreciated against the Euro, Yen and Sterling by 4.2%, 9.2%, and 3.9%, respectively. 2.0% 0.0% Fixed Income Source: US Treasury Department US bond markets delivered positive returns during the quarter excluding high yield. Investment grade credit led positive bond market returns in all sectors over the trailing 1-year period. Fixed Income Returns 10.0% 8.0% 6.0% 4.0% 2.0% 0.0% -2.0% -4.0% QTR 1-Year BC Agg BC Govt BC Credit BC Mortgage BC High Yield US Fixed Income Sector Performance (BC Aggregate Index) Sector Weight QTR 1 Year Governments* 40.3% 1.9% 4.9% Agencies 5.0% 0.7% 3.6% Inv. Grade Credit 23.3% 1.8% 7.5% MBS 28.8% 1.8% 6.1% ABS 0.6% 0.5% 1.9% CMBS 2.0% 1.4% 3.9% *US Treasuries and Government Related

44 -5.7% -3.8% -3.5% -4.3% -4.4% -4.5% -2.1% -3.4% -2.5% -1.8% 5.2% 5.2% 5.3% 4.9% 4.8% 5.0% 4.9% 5.6% 4.2% 9.7% 10.1% 9.4% 12.6% 12.4% 12.7% 13.2% 13.0% 13.5% EBMUD Quarterly Report 4Q 2014 page 17 US Equities Large cap US equities were outpaced by small cap stocks during the quarter but remained ahead during the longer 1-year period. During the quarter and 1-year periods, value outperformed growth in large cap stocks, while growth outperformed value in small cap stocks % US Equity Sector Performance U.S. Equity Returns (Russell 3000 Index) 20% 15% 10% 5% 0% QTR 1-Year R3000 (Broad Core) R3000G (Broad Gr) R3000V (Broad Val) R1000 (Lg Core) R1000G (Lg Gr) R1000V (Lg Val) R2000 (Sm Core) R2000G (Sm Gr) R2000V (Sm Val) International Equities Sector Weight QTR 1 Year Information Tech. 19.0% 5.4% 17.8% Financials 18.0% 7.8% 14.4% Health Care 14.0% 8.6% 25.1% Consumer Disc. 12.8% 8.9% 9.2% Industrials 11.4% 7.0% 8.0% Consumer Staples 8.5% 8.4% 15.9% Energy 7.5% -13.1% -10.0% Materials 3.6% -0.8% 5.7% Utilities 3.2% 13.0% 26.9% Telecomm. Serv. 2.0% -3.9% 2.5% International markets performed poorly during the quarter partially due to the strengthening US dollar. One year returns were also poor as most markets finished in negative territory, owing significantly to relation currency depreciation abroad. International Equity Returns (in USD) 0% -2% -4% -6% -8% -10% QTR 1-Year MSCI ACW Ex U.S. MSCI EAFE MSCI Europe MSCI Pacific MSCI EM International Equity Region Performance (in USD) (MSCI ACW Index ex US) Sector Weight QTR 1 Year Europe Ex. UK 31.8% -4.3% -5.8% Emerging Markets 21.7% -4.4% -1.8% United Kingdom 15.0% -4.2% -5.4% Japan 15.1% -2.4% -3.7% Pacific Ex. Japan 8.8% -1.5% -0.3% Canada 7.6% -4.6% 2.2%
45 EBMUD Quarterly Report 4Q 2014 page 18 Market Summary Long-term Performance* Indexes 1 Year 3 Year 5 Year 10 Year 20 Year Global Equity MSCI All Country World 4.7% 14.7% 9.7% 6.6% 7.4% Domestic Equity S&P % 20.4% 15.5% 7.7% 9.9% Russell % 20.5% 15.6% 7.9% 10.0% Russell 3000 Growth 12.4% 20.3% 15.9% 8.5% 8.9% Russell 3000 Value 12.7% 20.7% 15.3% 7.3% 10.5% Russell % 20.6% 15.6% 8.0% 10.0% Russell 1000 Growth 13.0% 20.3% 15.8% 8.5% 9.0% Russell 1000 Value 13.5% 20.9% 15.4% 7.3% 10.5% Russell % 19.2% 15.5% 7.8% 9.6% Russell 2000 Growth 5.6% 20.1% 16.8% 8.5% 7.8% Russell 2000 Value 4.2% 18.3% 14.3% 6.9% 11.0% CBOE BXM 5.6% 8.0% 7.1% 4.8% 8.0% International Equity MSCI All Country World ex US -3.4% 9.5% 4.9% 5.6% 5.8% MSCI EAFE -4.5% 11.6% 5.8% 4.9% 5.4% MSCI Pacific -2.5% 9.8% 5.8% 4.4% 2.0% MSCI Europe -5.7% 12.5% 5.9% 5.2% 8.0% MSCI EM (Emerging Markets) -1.8% 4.4% 2.1% 8.8% 6.0% Fixed Income BC Universal Bond 5.6% 3.2% 4.8% 4.9% 6.4% BC Global Agg Hedged 7.6% 4.3% 4.6% 4.7% 6.3% BC Aggregate Bond 6.0% 2.7% 4.4% 4.7% 6.2% BC Government 4.9% 1.4% 3.7% 4.3% 5.9% BC Credit Bond 7.5% 4.8% 6.3% 5.5% 6.9% BC Mortgage Backed Securities 6.1% 2.4% 3.7% 4.7% 6.1% BC High Yield Corporate Bond 2.5% 8.4% 9.0% 7.7% 7.9% BC WGILB - Hedged 9.0% 2.9% 5.0% 4.9% NA BC Emerging Markets 4.8% 5.8% 7.4% 7.8% 10.7% Real Estate NCREIF (Private RE) 11.8% 11.1% 12.1% 8.4% 9.6% NAREIT (Public RE) 27.2% 16.4% 16.6% 7.5% 11.1% Commodity Index Bloomberg Commodity (formerly DJUBS) -17.0% -9.4% -5.5% -1.9% 3.2% * Performance is annualized for periods greater than one year.
46 Annualized Return EBMUD Quarterly Report 4Q 2014 page 19 EBMUD PORTFOLIO REVIEW EAST BAY RISK/RETURN ANALYSIS Period ending December 31, % Five-Year Annualized Risk/Return 15.0% 10.0% Median Public Fund East Bay Total Policy Benchmark 5.0% Risk Free Rate 0.0% 0.0% 2.0% 4.0% 6.0% 8.0% 10.0% 12.0% 14.0% 16.0% Standard Deviation *Median Fund is the Mellon Total Fund Public Universe.

47 EBMUD Quarterly Report 4Q 2014 page 20 EBMUD PORTFOLIO PERFORMANCE This section includes an overview of the performance of the EBMUD investment portfolio and a detailed analysis of asset classes and specific mandates. Portfolio Performance Overview The EBMUD Total Portfolio s results exceeded both its policy target benchmark 4 and the Median Public Fund 5 over each time period measured ending December 31, Strong results posted in Public Equities and Real Estate contributed to the Total Portfolio s outperformance versus the benchmark for the quarter. Outperformance versus the Median Public Fund can be attributed to overall asset allocation differences, most notably, EBMUD s larger allocation to domestic equity investments (including covered calls). Periods Ending December 31, 2014 (annualized) 20.0% 15.0% 10.0% 8.0% 7.2% 6.5% 14.6% 13.3% 11.6% 11.6% 10.6% 9.9% 5.0% 2.9% 1.9% 1.5% 0.0% Quarter 1 Year 3 Year 5 Year EBMUD Benchmark Median Public Fund PT4 Policy Benchmark consists of 40% Russell 3000 (blend), 15% MSCI ACWIxU.S. (blend), 20% CBOE BXM, 10% BC Aggregate, 5% BC US 1-3 Year Government/Credit, 2.5% BC 1-5 Year U.S. High Yield Cash Pay, 2.5% S&P/LSTA Performing Loans, 2.5% NCREIF (lagged), and 2.5% FTSE NAREIT All Equity REITs index 4/1/14-present; see Appendix for historical Policy Benchmark composition. 5 TP PT Mellon Total Fund Public Universe.

48 EBMUD Quarterly Report 4Q 2014 page 21 Trailing 12-month absolute results have been positive over each of the last five discrete 12-month periods and the EBMUD Total Portfolio outperformed the policy target benchmark over each of these periods. 12-month Performance Periods Ending December % 20.0% 15.0% 14.0% 13.3% 14.2% 14.0% 22.0% 19.2% 10.0% 5.0% 0.0% 8.0% 0.7% 0.5% % EBMUD Benchmark Portfolio Valuation The EBMUD Total Portfolio had an aggregate value of $1.4 billion as of December 31, During the latest quarter the Total Portfolio increased in value by $29.3 million, and over the latest year the Total Portfolio increased by $102.5 million. Portfolio Valuation as of December 31, 2014 (in millions $) Dec. 31, Sept. 30, Quarterly Percentage Dec. 31, Annual Percentage Change Change* 2013 Change Change* EBMUD $1,370.5 $1,341.2 $ % $1,268.0 $ % *Percentage change in value due to both investment results and cash flows.


 each, while the allocation to Domestic Equity increased by 1.2%. Allocations to the Plan s other asset classes were relatively unchanged (variance < 0.5%).")
49 EBMUD Quarterly Report 4Q 2014 page 22 ASSET ALLOCATION Actual vs. Target Allocations With respect to policy targets, the Total Portfolio ended the latest quarter overweight Domestic Equity and Cash, underweight International Equity and Total Fixed Income, and relatively near target in all other asset classes (variance < 0.5%). Target allocations represent those elected by the Board in September 2013 which took effect in March 2014 upon the funding of the new Covered Calls asset class and Non-Core Bonds allocation within Total Fixed Income. As of December 31, 2014 Segment Actual Asset Allocation Comparison During the latest quarter, the actual allocation to International Equity and Cash decreased by (0.7%) each, while the allocation to Domestic Equity increased by 1.2%. Allocations to the Plan s other asset classes were relatively unchanged (variance < 0.5%). December 31, 2014 September 30, 2014 RE 5.4% Cash 1.0% Actual $(000) Actual % Target %* Variance Total Portfolio 1,370, % 100% --- Domestic Equity 566, % 40.0% 1.3% International Equity 178, % 15.0% -2.0% Covered Calls 279, % 20.0% 0.4% Total Fixed Income 257, % 20.0% -1.2% Real Estate** 74, % 5.0% 0.4% Cash 14, % 0.0% 1.0% **RREEF performance results and allocation are lagged one-quarter. RE 5.0% Cash 1.7% FI 18.8% Dom Eq 41.3% FI 19.2% Dom Eq 40.1% Covered Calls 20.4% Intl Eq 13.0% Covered Calls 20.4% Intl Eq 13.7%
50 EBMUD Quarterly Report 4Q 2014 page 23 Asset Class Performance (Gross of Fees) The Domestic Equity asset class modestly outperformed the Russell 3000 (blend) Index over the recent quarter by 10 basis points, but underperformed the benchmark by (70) basis points over the 1-year period. Over the trailing 3-, 5-, and 10-year periods the portfolio tracked the benchmark return. The International Equity portfolio exceeded the MSCI ACWI x U.S. (blend) Index by 1.5% over the quarter as one of the Plan s international equity managers outperformed the benchmark for the period. The portfolio trailed the benchmark by (1.7%) during the 1-year period, however, outperformed during the extended time periods measured. The Total Fixed Income asset class trailed the Custom Fixed Income (blend) benchmark over the quarter and 1-year period by (50) and (40) basis points, respectively, but outperformed over the longer time periods measured. The Fixed Income asset class was restructured into two sub-portfolios, Core and Non-Core Fixed Income, in March 2014 (see page 28). Periods ending December 31, 2014 Asset Class Quarter 1 Year 3 Year 5 Year 10 Year 20 Year Total Portfolio Policy Benchmark^ Domestic Equity Russell 3000 (blend)* International Equity MSCI ACWI x U.S.(blend)** Covered Calls CBOE BXM Total Fixed Income Fixed Income benchmark (blend)*** Real Estate /50 NCREIF/FTSE NAREIT All Equity**** Cash Citigroup T-bills ^ Policy Benchmark consists of 40% Russell 3000 (blend), 15% MSCI ACWIxU.S. (blend), 20% CBOE BXM, 10% BC Aggregate, 5% BC US 1-3 Year Government/Credit, 2.5% BC 1-5 Year U.S. High Yield Cash Pay, 2.5% S&P/LSTA Performing Loans, 2.5% NCREIF (lagged), and 2.5% FTSE NAREIT All Equity REITs index 4/1/14-present; see Appendix for historical Policy Benchmark composition. *Russell 3000 as of 10/1/05. Prior: 30% S&P500, 10% S&P400, 10% Russell 2000 (4/1/05-9/30/05); 33% S&P500, 10% S&P400, 10% Russell 2000 (9/1/98-3/31/05); 30% S&P500, 15% Wilshire 5000 (4/1/96-8/31/98) **MSCI ACWIxU.S. as of 1/1/07; MSCI EAFE ND thru 12/31/06 ***50% BC Aggregate, 25% BC US 1-3 Year Government/Credit, 12.5% BC 1-5 Year U.S. High Yield Cash Pay, and 12.5% S&P/LSTA Performing Loans index 4/1/14-present; 75% BC Aggregate, 12.5% BC 1-5 Year U.S. High Yield Cash Pay, and 12.5% S&P/LSTA Performing Loans index 3/1/14-3/31/14; BC Universal 1/1/08-2/28/14; BC Aggregate thru 12/31/07 ****50% NCREIF (lagged), 50% FTSE NAREIT All Equity REITs Index as of 11/1/11; NCREIF (lagged) thru 10/31/11
51 EBMUD Quarterly Report 4Q 2014 page 24 MANAGER PERFORMANCE (Gross of Fees) Domestic Equity Periods ending December 31, 2014 Manager Mkt Value ($000) Asset Class Management Style Quarter 1 YR 3 YR 5 YR Estimated Annual Fee (bps) 6 Current Monitoring Status Northern Trust Co. 228,965 Large Cap Core Passive Russell 1000 Index Intech 65,660 Large Cap Growth Active bps % on excess returns T. Rowe Price 62,539 Large Cap Growth Active Russell 1000 Growth Index Barrow Hanley 154,555 Large Cap Value Active Watch Russell 1000 Value Index Northern Trust Co. 24,313 Small Cap Growth Passive Russell 2000 Growth Index Opus 29,993 Small Cap Value Active bps + 25% on excess returns Russell 2000 Value Index Watch Watch During the latest three-month period ending December 31, 2014, three of EBMUD s six Domestic Equity managers matched or outperformed their respective benchmarks. Northern Trust, EBMUD s passive large cap manager, performed in-line with its Russell 1000 Index target over all time periods measured and was within tracking error expectations. Intech, one of EBMUD s two large cap growth managers, outperformed the Russell 1000 Growth Index return by 2.9% over the quarter. The portfolio s overweight to smaller cap stocks, favorable sector positioning, and positive selection effect benefitted performance for the quarter. The portfolio exceeded the benchmark during the 1-, 3-, and 5-year periods by 0.3%, 0.9%, and 1.1%, respectively. The portfolio s outperformance is a demonstration of positive trending, which, according to Intech, occurs when the proportion of the overweighted stocks with a positive relative return is above that of the underweights. Intech was placed on Watch status as of December 2014, as the portfolio s performance fell below EBMUD s performance thresholds. 6 Reviewed annually. Last reviewed June 30, 2014.
52 EBMUD Quarterly Report 4Q 2014 page 25 T. Rowe Price, EBMUD s other large cap growth manager, trailed the Russell 1000 Growth Index by (0.3%) over the quarter and (3.5%) over the 1-year period. Overall stock selection detracted from results for the 1-year period, most notably within Consumer Discretionary, Information Technology, and Energy. The portfolio outperformed the benchmark over the 3- and 5-year periods by 2.1% and 0.8% per annum, respectively. Stock selection in Information Technology and Healthcare benefitted relative 3-year results. Barrow Hanley, EBMUD s large cap value manager, underperformed the Russell 1000 Value Index over the recent quarter, 1-, 3-, and 5- year periods by (1.1%), (1.0%), (1.3%), and (1.1%), respectively. Overall security selection was a drag on results over each period; specifically, selection in Healthcare and Energy for the quarter, Financials and Energy for the 1-year period, Consumer Discretionary for the 3-year period, and Information Technology and Consumer Discretionary for the 5-year period. Barrow Hanley was placed on Watch status as of June 2013, as the portfolio s performance fell below EBMUD s performance thresholds. Northern Trust, the portfolio s passive small cap growth manager, tracked or slightly outperformed the Russell 2000 Growth Index over each time period measured. Opus, EBMUD s active small cap value manager, trailed the Russell 2000 Value Index by (0.6%) during the quarter, but outperformed the benchmark by 1.6% over the 1-year period. Relative 1-year results were driven by positive stock selection in Energy, Healthcare, Producer Durables, and Financials. The portfolio underperformed the benchmark by (3.0%) and (0.3%) per annum over the 3- and 5-year periods, respectively. Relative underperformance during the 3-year period was primarily attributable to the portfolio s underweight and stock selection in Consumer Discretionary. The persistent low-quality investment environment has also served as a headwind to the portfolio s high-quality bias for the 3-year period. Opus was placed on Watch status as of December 2012, as the portfolio s performance fell below EBMUD s performance thresholds.
53 EBMUD Quarterly Report 4Q 2014 page 26 International Equity Periods ending December 31, 2014 Manager Mkt Value ($000) Asset Class Management Style Quarter 1 YR 3 YR 5 YR Estimated Annual Fee (bps) 7 Current Monitoring Status Franklin Templeton 8 87,157 ACWI x U.S. Active Fisher Investments 91,380 ACWI x U.S. Active MSCI ACWI x U.S. (blend)* *As of January 1, 2007, the benchmark changed from MSCI EAFE to MSCI ACWI x U.S. During the latest three-month period ending December 31, 2014, one of EBMUD s two International Equity managers trailed the MSCI ACWI x U.S. (blend) Index. The Franklin Templeton account trailed the MSCI ACWI x U.S. (blend) Index by (1.4%) over the quarter and (4.8%) over the 1-year period, while outperforming the benchmark by 1.7% over the 3-year period and 0.5% over the 5-year period. From a country perspective, an overweight and poor stock selection in Europe was a drag on performance during the shorter time periods, while conversely, the larger allocation and selection in Europe drove relative 3-year outperformance. Fisher outperformed the MSCI ACWI x U.S. (blend) Index by 4.3% over the latest quarter, 1.5% over the 1-year period, 0.9% over the 3-year period, and 2.0% over the 5-year period. Security selection in Financials was the largest contributor to relative outperformance for the quarter and 1-year period. Relative 5-year outperformance was driven by an overweight to and selection within Information Technology. Additionally, an underweight to and selection in Energy benefitted performance over each of these time periods. 7 Reviewed annually. Last reviewed June 30, Franklin Templeton s historical returns are reported net of fees (inception 6/30/2011). The Franklin Templeton institutional mutual fund account was liquidated in June 2011 and moved to a transition account which later funded the Franklin Templeton new separate account in the same month. The Q return is an aggregate of the institutional mutual fund account, Franklin transition account, and new separate account.
54 EBMUD Quarterly Report 4Q 2014 page 27 Covered Calls Periods ending December 31, 2014 Manager Mkt Value ($000) Asset Class Management Style Quarter 1 YR 3 YR 5 YR Estimated Annual Fee (bps) 9 Current Monitoring Status Parametric BXM 91,894 Covered Calls Replication Parametric Delta Shift 95,535 Covered Calls Semi-Active Van Hulzen 91,989 Covered Calls Fully Active CBOE BXM Over the latest quarter ending December 31, 2014, all three Covered Calls mandates exceeded the CBOE BXM Index. The Parametric BXM strategy and Parametric Delta Shift strategy outperformed the CBOE BXM Index during the quarter by 2.7% and 5.3%, respectively. EBMUD s other Covered Calls manager, Van Hulzen, exceeded the CBOE BXM Index over the quarter by 1.3%. 9 Estimated annual fee based on a $75 million mandate.
55 EBMUD Quarterly Report 4Q 2014 page 28 Total Fixed Income Periods ending December 31, 2014 Manager CORE FIXED INCOME Mkt Value ($000) Asset Class Management Style Quarter 1 YR 3 YR 5 YR Estimated Annual Fee (bps) 10 Current Monitoring Status CS McKee 131,576 Core Active BC Aggregate NON-CORE FIXED INCOME WAMCO Short Duration 64,558 Non-Core Active BC U.S. 1-3 Yr Govt/Credit WAMCO Short-Term HY 30,341 Non-Core Active BC 1-5 Yr U.S. HY Cash Pay WAMCO Bank Loans 31,462 Non-Core Active S&P/LSTA Performing Loans Over the latest three-month period ending December 31, 2014, all four of EBMUD s Fixed Income mandates trailed their respective benchmarks. East Bay s core fixed income manager, CS McKee, underperformed the BC Aggregate Index during the quarter and 1-year period by (20) and (40) basis points respectively, but outperformed the benchmark by 30 basis points per annum during the 3-year period. Within the non-core fixed income aggregate, the WAMCO Short Duration portfolio tracked its benchmark, the BC U.S. 1-3 Year Government/Credit Index during the quarter. The WAMCO Short-Term High Yield portfolio trailed the BC 1-5 Year U.S. High Yield Cash Pay Index by (2.9%) for the quarter; the worst five performers in the portfolio were Energy holdings. The WAMCO Bank Loans portfolio trailed the S&P/LSTA Performing Loans benchmark over the quarter by (60) basis points. 10 Reviewed annually. Last reviewed June 30, Assumes $65 million in other WAMCO assets.
56 EBMUD Quarterly Report 4Q 2014 page 29 Real Estate Periods ending December 31, 2014 Manager Mkt Value ($000) Asset Class Quarter 1 YR 3 YR 5 YR Estimated Annual Fee (bps) 12 Current Monitoring Status RREEF II* 26,415 Real Estate NCREIF* CenterSquare (formerly Urdang) 48,056 Real Estate bps + 15% on excess returns FTSE NAREIT All Equity REITs *Results are lagged one quarter. --- East Bay s Real Estate manager, RREEF II, outperformed its benchmark, the NCREIF Property Index, during the quarter, 1-, 3-, and 5-year periods by 1.5%, 1.1%, 2.4%, and 2.4%, respectively. During the lagged quarter, RREEF America REIT II operations generated an income return of 1.3% before fees, holding steady from the previous quarter. Same store net operating income for the 1-year period ending September 30, 2014, increased 5% from the prior year. Occupancy at the end of the quarter increased to 93 percent overall. CenterSquare, East Bay s REIT manager, exceeded the FTSE NAREIT All Equity REITs Index return over the quarter by 3.1%, 1-year period by 5.5%, and 3-year period by 0.9%. 12 Reviewed annually. Last reviewed June 30, Fees paid from July 1, 2013 June 30, 2014, included an incentive fee accrual credit received in 3Q2013.
57 EBMUD Quarterly Report 4Q 2014 page 30 PERFORMANCE MONITORING CURRENT STATUS Portfolio Violation Type (Window)* Date of Initial Violation Corrective Action(s) Current Status Est. Beg. Date of Current Status Months Since Est. Beg. Date Performance Since Est. Beg. Date** Intech Long-Term 9/30/2014 Placed on Watch (Nov-14) Watch 12/01/ Russell 1000 Growth Barrow Hanley Short-Term 03/31/2013 Placed on Watch (May-13), (Nov-14) Watch 06/01/ Russell 1000 Value Opus Short-Term 09/30/2012 Placed on Watch (Nov-12), (Mar-14) Watch 12/01/ Russell 2000 Value *Defined as: Short-Term (12 months), Medium-Term (36 months), Long-Term (60 months) **Annualized for periods greater than 12 months The Board placed Intech on Watch as of December 2014 due to performance concerns. Since its Watch period began, Intech produced a minus (0.2%) 1-month return, which underperformed the benchmark by (1.2%). The Board placed Barrow Hanley on Watch as of June 2013 due to performance concerns. Since its Watch period began, Barrow Hanley produced a 16.4% 19-month return, which trailed the benchmark by (80) basis points. The Board placed Opus on Watch as of December 2012 due to performance concerns. Since its Watch period began, Opus produced an 18.3% 25-month return, which was (1.7%) below its benchmark.
58 EBMUD Quarterly Report 4Q 2014 page 31 Investment Performance Criteria by Asset Class Asset Class Short-term (rolling 12-month periods) Medium-term (rolling 36-month periods) Long-term (60+ months) Domestic Equity - Active Fd return < bench return - 3.5% Fd annlzd return < bench annlzd return -1.75% for 6 consecutive months Domestic Equity - Passive Tracking error > 0.30% Tracking error > 0.25% for 6 consecutive months VRR < 0.97 for 6 consecutive months Fd annlzd return < bench annlzd return -0.40% for 6 consecutive months International Equity - Active Fd return < bench return - 4.5% Fd annlzd return < bench annlzd return -2.0% for 6 consecutive months VRR < 0.97 for 6 consecutive months Covered Calls - Active Fd return < bench return - 3.5% Fd annlzd return < bench annlzd return -1.75% for 6 consecutive months VRR < 0.97 for 6 consecutive months Covered Calls - Replication Tracking error > 0.30% Tracking error > 0.25% for 6 consecutive months Fd annlzd return < bench annlzd return % for 6 consecutive months Fixed Income - Core Active Fd return < bench return - 1.5% Fd annlzd return < bench annlzd return -1.0% for 6 consecutive months VRR < 0.98 for 6 consecutive months Fixed Income - Core Passive Tracking error > 0.25% Tracking error > 0.20% for 6 consecutive months Fd annlzd return < bench annlzd return % for 6 consecutive months Fixed Income - Non-Core Fd return < bench return - 4.5% Fd annlzd return < bench annlzd return - 2.0% for 6 consecutive months All criteria are on an annualized basis. VRR Value Relative Ratio is calculated as: manager cumulative return / benchmark cumulative return. VRR < 0.97 for 6 consecutive months
59 EBMUD Quarterly Report 4Q 2014 page 32 EBMUD Total Fund Universe Rankings as of December 31, 2014 Mellon Total Funds Public Universe Quarter 1-Year 3-Year 5-Year 10-Year Maximum Percentile Median Percentile Minimum # of Portfolios EBMUD Total Return Quartile Rank 1 st 1 st 1 st 1 st 1 st Notes: Sources: Universe Information; Mellon Total Public Funds All performance is shown gross of fees.
60 Total Annualized Return, % Excess Annualized Return, % EBMUD Large Cap Manager Comparisons as of December 31, 2014 page 33 5-Ye a r Tota l Risk/Re turn 5-Ye a r Ex ce ss Risk/Re turn 20 N o rth e rn R R u sse l l Total Annualized StdDev, % Excess Annualized StdDev, % Annualized Return, % Annualized StdDev, % Sharpe Ratio Northern R Russell Large Cap Universe Median Annualized Excess Return, % Annualized Excess StDev, % Sharpe Ratio, Excess Northern R Russell NA Large Cap Universe Median
61 Total Annualized Return, % Total Annualized Return, % EBMUD Large Cap Manager Comparisons as of December 31, 2014 page Annualize d Univ e rse Re turns Qtr 1 Year 3 Years 5 Years 12 M onth Pe rformance 5th to 25th Percentile 25th to Median Median to 75th Percentile 75th to 95th Percentile Northern R1000 Russell
62 Total Annualized Return, % Excess Annualized Return, % EBMUD Large Cap Growth Manager Comparisons as of December 31, 2014 page 35 5-Ye a r Tota l Risk/Re turn 5-Ye a r Ex ce ss Risk/Re turn 20 I n t e c h T R o we P ric e R u s s e ll G ro wt h Total Annualized StdDev, % Excess Annualized StdDev, % Annualized Return, % Annualized StdDev, % Sharpe Ratio Intech T Rowe Price Russell 1000 Growth Large Growth Manager Universe Median Annualized Excess Return, % Annualized Excess StDev, % Sharpe Ratio, Excess Intech T Rowe Price Russell 1000 Growth NA Large Growth Manager Universe Median
63 Total Annualized Return, % Total Annualized Return, % EBMUD Large Cap Growth Manager Comparisons as of December 31, 2014 page Annualize d Univ e rse Re turns Qtr 1-Year 3-Year 5-Year 12 M onth Pe rformance 5th to 25th Percentile 25th to Median Median to 75th Percentile 75th to 95th Percentile Intech T Rowe Price Russell 1000 Growth
64 Total Annualized Return, % Excess Annualized Return, % EBMUD Large Cap Value Manager Comparisons as of December 31, 2014 page 37 5-Ye a r Tota l Risk/Re turn 5-Ye a r Ex ce ss Risk/Re turn 20 B a rro w R u sse l l V a l u e Total Annualized StdDev, % Excess Annualized StdDev, % Annualized Return, % Annualized StdDev, % Sharpe Ratio Barrow Russell 1000 Value Large Cap Value Universe Median Annualized Excess Return, % Annualized Excess StDev, % Sharpe Ratio, Excess Barrow Russell 1000 Value NA Large Cap Value Universe Median
65 Total Annualized Return, % Total Annualized Return, % EBMUD Large Cap Value Manager Comparisons as of December 31, 2014 page Annualize d Univ e rse Re turns Qtr 1 Year 3 Years 5 Years 12 M onth Pe rformance 5th to 25th Percentile 25th to Median Median to 75th Percentile 75th to 95th Percentile Barrow Russell 1000 Value
66 Total Annualized Return, % Excess Annualized Return, % EBMUD Small Cap Growth Manager Comparisons as of December 31, 2014 page 39 5-Ye a r Tota l Risk/Re turn 5-Ye a r Ex ce ss Risk/Re turn N o rt h e rn R R u s s e ll G ro wt h Total Annualized StdDev, % Excess Annualized StdDev, % Annualized Return, % Annualized StdDev, % Sharpe Ratio Northern R Russell 2000 Growth Small Cap Growth Manager Universe Median Annualized Excess Return, % Annualized Excess StDev, % Sharpe Ratio, Excess Northern R Russell 2000 Growth NA Small Cap Growth Manager Universe Median
67 Total Annualized Return, % Total Annualized Return, % EBMUD Small Cap Growth Manager Comparisons as of December 31, 2014 page Annualize d Univ e rse Re turns Qtr 1 Year 3 Years 5 Years 12 M onth Pe rformance 5th to 25th Percentile 25th to Median Median to 75th Percentile 75th to 95th Percentile Northern R2000 Russell 2000 Growth
68 Total Annualized Return, % Excess Annualized Return, % EBMUD Small Cap Value Manager Comparisons as of December 31, 2014 page Ye a r Tota l Risk/Re turn 10 5-Ye a r Ex ce ss Risk/Re turn 22 O p u s R u sse l l V a l u e Total Annualized StdDev, % Excess Annualized StdDev, % Annualized Return, % Annualized StdDev, % Sharpe Ratio Opus Russell 2000 Value Small Cap Value Universe Median Annualized Excess Return, % Annualized Excess StDev, % Sharpe Ratio, Excess Opus Russell 2000 Value NA Small Cap Value Universe Median
69 Total Annualized Return, % Total Annualized Return, % EBMUD Small Cap Value Manager Comparisons as of December 31, 2014 page Annualize d Univ e rse Re turns Qtr 1 Year 3 Years 5 Years 12 M onth Pe rformance 5th to 25th Percentile 25th to Median Median to 75th Percentile 75th to 95th Percentile Opus Russell 2000 Value
70 Total Annualized Return, % Excess Annualized Return, % EBMUD International Equity Manager Comparisons as of December 31, 2014 page 43 5-Ye a r Tota l Risk/Re turn 5-Ye a r Ex ce ss Risk/Re turn F ranklin Aggregate F is h e r E B M U D M S C I A C W I e x U S B le n d Total Annualized StdDev, % Excess Annualized StdDev, % Annualized Return, % Annualized StdDev, % Sharpe Ratio Franklin Aggregate Fisher MSCI ACWI xus Blend International Equity Manager Universe Median Annualized Excess Return, % Annualized Excess StDev, % Sharpe Ratio, Excess Franklin Aggregate Fisher ACWI xus Blend NA International Equity Manager Universe Median
71 Total Annualized Return, % Total Annualized Return, % EBMUD International Equity Manager Comparisons as of December 31, 2014 page Annualize d Univ e rse Re turns Qtr 1 Year 3 Years 5 Years 12 M onth Pe rformance 5th to 25th Percentile 25th to Median Median to 75th Percentile 75th to 95th Percentile Franklin Aggregate Fisher EBMUD MSCI ACWI ex US Blend
72 Total Annualized Return, % Excess Annualized Return, % EBMUD Fixed Income Manager Comparisons as of December 31, 2014 page 45 3-Ye a r Tota l Risk/Re turn 3-Ye a r Ex ce ss Risk/Re turn C S M c K E E B C A g g re g a t e B o n d Total Annualized StdDev, % Excess Annualized StdDev, % Annualized Return, % Annualized StdDev, % Sharpe Ratio CS McKEE BC Aggregate Bond US Fixed Income Univ Median Annualized Excess Return, % Annualized Excess StDev, % Sharpe Ratio, Excess CS McKEE BC Aggregate Bond NA US Fixed Income Univ Median
73 Total Annualized Return, % Total Annualized Return, % EBMUD Fixed Income Manager Comparisons as of December 31, 2014 page Annualize d Univ e rse Re turns Qtr 1 Year 3 Years 12 M onth Pe rformance 5th to 25th Percentile 25th to Median Median to 75th Percentile 75th to 95th Percentile CS McKEE BC Aggregate Bond
74 EBMUD Quarterly Report 4Q 2014 page 47 APPENDIX GLOSSARY OF TERMS Alpha: The premium an investment earns above a set standard. This is usually measured in terms of a common index (i.e., how the stock performs independent of the market). An Alpha is usually generated by regressing a security s excess return on the S&P 500 excess return. Annualized Performance: The annual rate of return that when compounded t times generates the same t-period holding return as actually occurred from period 1 to period t. Batting Average: Percentage of periods a portfolio outperforms a given index. Beta: The measure of an asset s risk in relation to the Market (for example, the S&P 500) or to an alternative benchmark or factors. Roughly speaking, a security with a Beta of 1.5 will have moved, on average, 1.5 times the market return. Bottom-up: A management style that de-emphasizes the significance of economic and market cycles, focusing instead on the analysis of individual stocks. Dividend Discount Model: A method to value the common stock of a company that is based on the present value of the expected future dividends. Growth Stocks: Common stock of a company that has an opportunity to invest money and earn more than the opportunity cost of capital. Information Ratio: The ratio of annualized expected residual return to residual risk. A central measurement for active management, value added is proportional to the square of the information ratio. R-Squared: Square of the correlation coefficient. The proportion of the variability in one series that can be explained by the variability of one or more other series a regression model. A measure of the quality of fit. 100% R-square means perfect predictability. Standard Deviation: The square root of the variance. A measure of dispersion of a set of data from its mean. Sharpe Ratio: A measure of a portfolio s excess return relative to the total variability of the portfolio. Style Analysis: A returns-based analysis using a multi-factor attribution model. The model calculates a product s average exposure to particular investment styles over time (i.e., the product s normal style benchmark). Top-down: Investment style that begins with an assessment of the overall economic environment and makes a general asset allocation decision regarding various sectors of the financial markets and various industries. Tracking Error: The standard deviation of the difference between the performance of a portfolio and an appropriate benchmark. Turnover: For mutual funds, a measure of trading activity during the previous year, expressed as a percentage of the average total assets of the fund. A turnover rate of 25% means that the value of trades represented one-fourth of the assets of the fund. Value Stocks: Stocks with low price/book ratios or price/earnings ratios. Historically, value stocks have enjoyed higher average returns than growth stocks (stocks with high price/book or P/E ratios) in a variety of countries.
75 EBMUD Quarterly Report 4Q 2014 page 48 EBMUD POLICY BENCHMARK COMPOSITION Time Period EBMUD Total Fund Policy Benchmark 4/1/2005 9/30/ % S&P 500, 10% S&P Midcap, 10% Russell 2000, 20% MSCI EAFE ND, 25% BC Aggregate, 5% NCREIF (lagged) 10/1/ /31/ % Russell 3000, 20% MSCI EAFE ND, 25% BC Aggregate, 5% NCREIF (lagged) 1/1/ /31/ % Russell 3000, 20% MSCI ACWI x U.S. GD, 25% BC Aggregate, 5% NCREIF (lagged) 1/1/ /31/ % Russell 3000, 20% MSCI ACWI x U.S. GD, 25% BC Universal, 5% NCREIF (lagged) 11/1/2011 2/28/ % Russell 3000, 20% MSCI ACWI x U.S. GD, 25% BC Universal, 2.5% NCREIF (lagged), and 2.5% FTSE NAREIT All Equity REITs 3/1/2014 3/31/ % Russell 3000, 20% CBOE BXM, 15% MSCI ACWI x U.S. GD, 15% BC Aggregate, 2.5% BC 1-5 Year U.S. High Yield Cash Pay, 2.5% S&P/LSTA Performing Loans, 2.5% NCREIF (lagged), 2.5% FTSE NAREIT All Equity REITs 4/1/2014 present 40% Russell 3000, 20% CBOE BXM, 15% MSCI ACWI x U.S. GD, 10% BC Aggregate, 5% BC US 1-3 Year Government/Credit, 2.5% BC 1-5 Year U.S. High Yield Cash Pay, 2.5% S&P/LSTA Performing Loans, 2.5% NCREIF (lagged), 2.5% FTSE NAREIT All Equity REITs
76 EBMUD Quarterly Report 4Q 2014 page 49 DEFINITION OF BENCHMARKS BC Aggregate: an index comprised of approximately 6,000 publicly traded investment-grade bonds including U.S. Government, mortgage-backed, corporate, and yankee bonds with an approximate average maturity of 10 years. BC High Yield: covers the universe of fixed rate, non-investment grade debt. Eurobonds and debt issues from countries designated as emerging markets (e.g., Argentina, Brazil, Venezuela, etc.) are excluded, but Canadian and global bonds (SEC registered) of issuers in non-emg countries are included. Original issue zeroes, step-up coupon structures, 144-As and pay-in-kind bonds (PIKs, as of October 1, 2009) are also included. Must be rated high-yield (Ba1/BB+ or lower) by at least two of the following ratings agencies: Moody's, S&P, Fitch. If only two of the three agencies rate the security, the lower rating is used to determine index eligibility. All issues must have at least one year to final maturity regardless of call features and have at least $150 million par amount outstanding. BC Multiverse Non-US Hedged: provides a broad-based measure of the international fixed-income bond market. The index represents the union of the BC Global Aggregate Index and the BC Global High Yield Index. In this sense, the term Multiverse refers to the concept of multiple universes in a single macro index. BC US Credit: includes publicly issued U.S. corporate and foreign debentures and secured notes that which are rated investment grade or higher by Moody s Investor Services, Standard and Poor s Corporation, or Fitch Investor s Service, with all issues having at least one year to maturity and an outstanding par value of at least $250 million. Issues must be publicly issued, dollar-denominated and nonconvertible. BC US Government: includes treasuries (i.e., public obligations of the U.S. Treasury that have remaining maturities of more than one year) and agencies (i.e., publicly issued debt of U.S. Government agencies, quasi-federal corporations, and corporate or foreign debt guaranteed by the U.S. Government). BC Universal: includes market coverage by the Aggregate Bond Index fixed rate debt issues, which are rated investment grade or higher by Moody s Investor Services, Standard and Poor s Corporation, or Fitch Investor s Service, with all issues having at least one year to maturity and an outstanding par value of at least $100 million) and includes exposures to high yield CMBS securities. All returns are market value weighted inclusive of accrued interest. Citigroup 3-Month Treasury Bills (T-bills): tracks the performance of U.S. Treasury bills with 3-month maturity. MSCI ACWI x US ND: comprises both developed and emerging markets less the United States. As of August 2008, the index consisted of 23 counties classified as developed markets and 25 classified as emerging markets. This series approximates the minimum possible dividend reinvestment. The dividend is reinvested after deduction of withholding tax, applying the rate to non-resident individuals who do not benefit from double taxation treaties. MSCI Barra uses withholding tax rates applicable to Luxembourg holding companies, as Luxembourg applies the highest rates. MSCI EAFE Free (Europe, Australasia, Far East) ND: is a free float-adjusted market capitalization index that is designed to measure developed market equity performance, excluding the US & Canada. This series approximates the minimum possible dividend reinvestment. The dividend is reinvested after deduction of withholding tax, applying the rate to non-resident individuals who do not benefit from double taxation treaties. MSCI Barra uses withholding tax rates applicable to Luxembourg holding companies, as Luxembourg applies the highest rates.
77 EBMUD Quarterly Report 4Q 2014 page 50 MSCI EM (Emerging Markets) GD: is a free float-adjusted market capitalization index that is designed to measure equity market performance in the global emerging markets. This series approximates the maximum possible dividend reinvestment. The amount reinvested is the entire dividend distributed to individuals resident in the country of the company, but does not include tax credits. MSCI Europe is a free float-adjusted market capitalization weighted index that is designed to measure the equity market performance of the developed markets in Europe. As of June 2007, this index consisted of the following 16 developed market country indices: Austria, Belgium, Denmark, Finland, France, Germany, Greece, Ireland, Italy, the Netherlands, Norway, Portugal, Spain, Sweden, Switzerland, and the United Kingdom. MSCI Pacific is a free float-adjusted market capitalization weighted index that is designed to measure the equity market performance of the developed markets in the Pacific region. As of June 2007, this index consisted of the following 5 Developed Market countries: Australia, Hong Kong, Japan, New Zealand, and Singapore. NAREIT Index: consists of all tax-qualified REITs listed on the New York Stock Exchange, American Stock Exchange, and the NASDAQ National Market System. The data is market weighted. NCREIF Property Index: the NPI contains investment-grade, non-agricultural, income-producing properties which may be financed in excess of 5% gross market value; were acquired on behalf of tax exempt institutions; and are held in a fiduciary environment. Returns are gross of fees; including income, realized gains/losses, and appreciation/depreciation; and are market value weighted. Index is lagged one quarter. Russell 1000: measures the performance of the 1,000 largest securities in the Russell 3000 Index. Russell 1000 is highly correlated with the S&P 500 Index and capitalization-weighted. Russell 1000 Growth: measures the performance of those Russell 1000 securities with a greater-than-average growth orientation. Securities in this index tend to exhibit higher price-to-book and price-earnings ratios, lower dividend yields and higher forecasted growth values than the Value universe. Russell 1000 Value: measures the performance of those Russell 1000 securities with a less-than-average growth orientation. Securities in this index tend to exhibit lower price-to-book and price-earnings ratios, higher dividend yields and lower forecasted growth values than the Growth universe. Russell 2000: measures the performance of the 2,000 smallest companies in the Russell 3000 Index, which represents approximately 8% of the total market capitalization of the Russell 3000 Index. Russell 2000 Growth: measures the performance of those Russell 2000 securities with a greater-than-average growth orientation. Securities in this index tend to exhibit higher price-to-book and price-to-earnings ratios. Russell 2000 Value: measures the performance of those Russell 2000 securities with a less-than-average growth orientation. Securities in this index tend to exhibit lower price-to-book and price-to-earnings ratios. Russell 3000: represents the largest 3,000 US companies based on total market capitalization, representing approximately 98% of the investable US equity market.
78 EBMUD Quarterly Report 4Q 2014 page 51 RISK METRIC DESCRIPTION Rationale for selection and calculation methodology US Equity Markets Metric: P/E ratio = Price / Normalized earnings for the S&P 500 Index To represent the price of US equity markets, we have chosen the S&P 500 index. This index has the longest published history of price, is well known, and also has reliable, long-term, published quarterly earnings. The price=p of the P/E ratio is the current price of the market index (the average daily price of the most recent full month for the S&P 500 index). Equity markets are very volatile. Prices fluctuate significantly during normal times and extremely during periods of market stress or euphoria. Therefore, developing a measure of earnings power (E) which is stable is vitally important, if the measure is to provide insight. While equity prices can and do double, or get cut in half, real earnings power does not change nearly as much. Therefore, we have selected a well known measure of real, stable earnings power developed by Yale Professor Robert Shiller known as the Shiller E-10. The calculation of E-10 is simply the average real annual earnings over the past 10 years. Over 10 years, the earnings shenanigans and boom and bust levels of earnings tend to even out (and often times get restated). Therefore, this earnings statistic gives a reasonably stable, slow-to-change estimate of average real earnings power for the index. Professor Shiller s data and calculation of the E-10 are available on his website at We have used his data as the base for our calculations. Details of the theoretical justification behind the measure can be found in his book Irrational Exuberance [Princeton University Press 2000, Broadway Books 2001, 2nd ed., 2005]. Developed Equity Markets Excluding the US Metric: P/E ratio = Price / Normalized earnings for the MSCI EAFE Index To represent the price of non-us developed equity markets, we have chosen the MSCI EAFE index. This index has the longest published history of price for non-us developed equities. The price=p of the P/E ratio is the current price of the market index (the average daily price of the most recent full month for the MSCI EAFE index). The price level of this index is available starting in December Again, for the reasons described above, we elected to use the Shiller E-10 as our measure of earnings (E). Since 12/1972, a monthly price earnings ratio is available from MSCI. Using this quoted ratio, we have backed out the implied trailing-twelve month earnings of the EAFE index for each month from 12/1972 to the present. These annualized earnings are then inflation adjusted using CPI-U to represent real earnings in US dollar terms for each time period. The Shiller E-10 for the EAFE index (10 year average real earnings) is calculated in the same manner as detailed above. However, we do not believe that the pricing and earnings history of the EAFE markets are long enough to be a reliable representation of pricing history for developed market equities outside of the US. Therefore, in constructing the Long-Term Average Historical P/E for developed ex-us equities for comparison purposes, we have elected to use the US equity market as a developed market proxy, from 1881 to This lowers the Long-Term Average Historical P/E considerably. We believe this methodology provides a more realistic historical comparison for a market with a relatively short history.
79 EBMUD Quarterly Report 4Q 2014 page 52 Emerging Market Equity Markets Metric: Ratio of Emerging Market P/E Ratio to Developed Market P/E Ratio To represent the Emerging Markets P/E Ratio, we have chosen the MSCI Emerging Market Free Index, which has P/E data back to January 1995 on Bloomberg. To represent the Developed Markets PE Ratio, we have chosen the MSCI World Index, which also has data back to January 1995 on Bloomberg. Although there are issues with published, single time period P/E ratios, in which the denominator effect can cause large movements, we feel that the information contained in such movements will alert investors to market activity that they will want to interpret. US Private Equity Markets Metrics: S&P LCD Average EBITDA Multiples Paid in LBOs and US Quarterly Deal Volume The Average Purchase Price to EBITDA multiples paid in LBOs is published quarterly by S&P in their LCD study. This is the total price paid (both equity and debt) over the trailing-twelve month EBITDA (earnings before interest, taxes, depreciation and amortization) as calculated by S&P LCD. This is the relevant, high-level pricing metric that private equity managers use in assessing deals. Data is published monthly. US quarterly deal volume for private equity is the total deal volume in $ billions (both equity and debt) reported in the quarter by Thomson Reuters Buyouts. This metric gives a measure of the level of activity in the market. Data is published quarterly. US Private Real Estate Markets Metrics: US Cap Rates, Cap Rate Spreads, and Transactions as a % of Market Value Real estate cap rates are a measure of the price paid in the market to acquire properties versus their annualized income generation before financing costs (NOI=net operating income). The data, published by NCREIF, describes completed and leased properties (core) on an unleveraged basis. We chose to use current value cap rates. These are capitalization rates from properties that were revalued during the quarter. This data relies on estimates of value and therefore tends to be lagging (estimated prices are slower to rise and slower to fall than transaction prices). The data is published quarterly. Spreads between the cap rate (described above) and the 10-year nominal Treasury yield, indicate a measure of the cost of properties versus a current measure of the cost of financing. Transactions as a % of Market Value Trailing-Four Quarters is a measure of property turnover activity in the NCREIF Universe. This quarterly metric is a measure of activity in the market.
80 EBMUD Quarterly Report 4Q 2014 page 53 Credit Markets Fixed Income Metric: Spreads The absolute level of spreads over treasuries and spread trends (widening / narrowing) are good indicators of credit risk in the fixed income markets. Spreads incorporate estimates of future default, but can also be driven by technical dislocations in the fixed income markets. Abnormally narrow spreads (relative to historical levels) indicate higher levels of valuation risk, wide spreads indicate lower levels of valuation risk and / or elevated default fears. Investment grade bond spreads are represented by the Barclays Capital US Corporate Investment Grade Index Intermediate Component. The high yield corporate bond spreads are represented by the Barclays Capital US Corporate High Yield Index. Measure of Equity Market Fear / Uncertainty Metric: VIX Measure of implied option volatility for US equity markets The VIX is a key measure of near-term volatility conveyed by implied volatility of S&P 500 index option prices. VIX increases with uncertainty and fear. Stocks and the VIX are negatively correlated. Volatility tends to spike when equity markets fall. Measure of Monetary Policy Metric: Yield Curve Slope We calculate the yield curve slope as the 10 year treasury yield minus the 1 year treasury yield. When the yield curve slope is zero or negative, this is a signal to pay attention. A negative yield curve slope signals lower rates in the future, caused by a contraction in economic activity. Recessions are typically preceded by an inverted (negatively sloped) yield curve. A very steep yield curve (2 or greater) indicates a large difference between shorter-term interest rates (the 1 year rate) and longer-term rates (the 10 year rate). This can signal expansion in economic activity in the future, or merely higher future interest rates. Measures of US Inflation Expectations Metrics: Breakeven Inflation and Inflation Adjusted Commodity Prices Inflation is a very important indicator impacting all assets and financial instruments. Breakeven inflation is calculated as the 10 year nominal treasury yield minus the 10 year real yield on US TIPS (treasury inflation protected securities). Abnormally low long-term inflation expectations are indicative of deflationary fears. A rapid rise in breakeven inflation indicates an acceleration in inflationary expectations as market participants sell nominal treasuries and buy TIPs. If breakeven inflation continues to rise quarter over quarter, this is a signal of inflationary worries rising, which may cause Fed action and / or dollar decline. Commodity price movement (above the rate of inflation) is an indication of anticipated inflation caused by real global economic activity putting pressure on resource prices. We calculate this metric by adjusted in the Dow Jones UBS Commodity Index (formerly Dow Jones AIG Commodity Index) by US CPI-U. While rising commodity prices will not necessarily translate to higher US inflation, higher US inflation will likely show up in higher commodity prices, particularly if world economic activity is robust. These two measures of anticipated inflation can, and often are, conflicting.
81 EBMUD Quarterly Report 4Q 2014 page 54 Measures of US Treasury Bond Interest Rate Risk Metrics: 10-Year Treasury Forward-Looking Real Yield and 10-Year Treasury Duration The expected annualized real yield of the 10 year US Treasury Bond is a measure of valuation risk for US Treasuries. A low real yield means investors will accept a low rate of expected return for the certainly of receiving their nominal cash flows. PCA estimates the expected annualized real yield by subtracting an estimate of expected 10 year inflation (produced by the Survey of Professional Forecasters as collected by the Federal Reserve Bank of Philadelphia), from the 10 year Treasury constant maturity interest rate. Duration for the 10-Year Treasury Bond is calculated based on the current yield and a price of 100. This is a measure of expected percentage movements in the price of the bond based on small movements in percentage yield. We make no attempt to account for convexity. Definition of Extreme Metric Readings A metric reading is defined as extreme if the metric reading is in the top or bottom decile of its historical readings. These extreme reading should cause the reader to pay attention. These metrics have reverted toward their mean values in the past.
82 EBMUD Quarterly Report 4Q 2014 page 55 RISK METRICS DESCRIPTION PCA Market Sentiment Indicator What is the PCA Market Sentiment Indicator (PMSI)? The PMSI is a measure meant to gauge the market s sentiment regarding economic growth risk. Growth risk cuts across most financial assets, and is the largest risk exposure that most portfolios bear. The PMSI takes into account the momentum14 (trend over time, positive or negative) of the economic growth risk exposure of publicly traded stocks and bonds, as a signal of the future direction of growth risk returns; either positive (risk seeking market sentiment), or negative (risk averse market sentiment). How do I read the PCA Market Sentiment Indicator (PMSI) graph? Simply put, the PMSI is a color coded indicator that signals the market s sentiment regarding economic growth risk. It is read left to right chronologically. A green indicator on the PMSI indicates that the market s sentiment towards growth risk is positive. A gray indicator indicates that the market s sentiment towards growth risk is neutral or inconclusive. A red indicator indicates that the market s sentiment towards growth risk is negative. The black line on the graph is the level of the PMSI. The degree of the signal above or below the neutral reading is an indication the signal s current strength. How is the PCA Market Sentiment Indicator (PMSI) Constructed? The PMSI is constructed from two sub-elements representing investor sentiment in stocks and bonds: 1. Stock return momentum: Return momentum for the S&P 500 Equity Index (trailing 12-months) 2. Bond yield spread momentum: Momentum of bond yield spreads (excess of the measured bond yield over the identical duration U.S. Treasury bond yield) for corporate bonds (trailing 12-months) for both investment grade bonds (75% weight) and high yield bonds (25% weight). The scale of this measure is adjusted to match that of the stock return momentum measure. The black line reading on the graph is calculated as the average of the stock return momentum measure and the bonds spread momentum measure. The color reading on the graph is determined as follows: 1. If both stock return momentum and bond spread momentum are positive = GREEN (positive) 2. If one of the momentum indicators is positive, and the other negative = GRAY (inconclusive) 3. If both stock return momentum and bond spread momentum are negative = RED (negative) What does the PCA Market Sentiment Indicator (PMSI) mean? Why might it be useful? There is strong evidence that time series momentum is significant and persistent.15 In particular, across an extensive array of asset classes, the sign of the trailing 12-month return (positive or negative) is indicative of future returns (positive or negative) over the next 12 month period. The PMSI is constructed to measure this momentum in stocks and corporate bond spreads. A reading of green or red is agreement of both the equity and bond measures, indicating that it is likely that this trend (positive or negative) will continue over the next 12 months. When the measures disagree, the indicator turns gray. A gray reading does not necessarily mean a new trend is occurring, as the indicator may move back to green, or into the red from there. The level of the reading (black line) and the number of months at the red or green reading, gives the user additional information on which to form an opinion, and potentially take action. 14 Momentum is defined as the persistence of relative performance. There is a significant amount of academic evidence indicating that positive momentum (e.g., strong performing stocks over the recent past continue to post strong performance into the near future) exists over near-to-intermediate holding periods. See, for example, Understanding Momentum, Financial Analysts Journal, Scowcroft, Sefton, March, Time Series Momentum Moskowitz, Ooi, Pedersen, August
83 EBMUD Quarterly Report 4Q 2014 page 56 DISCLOSURES: This document is provided for informational purposes only. It does not constitute an offer of securities of any of the issuers that may be described herein. Information contained herein may have been provided by third parties, including investment firms providing information on returns and assets under management, and may not have been independently verified. The past performance information contained in this report is not necessarily indicative of future results and there is no assurance that the investment in question will achieve comparable results or that the Firm will be able to implement its investment strategy or achieve its investment objectives. The actual realized value of currently unrealized investments (if any) will depend on a variety of factors, including future operating results, the value of the assets and market conditions at the time of disposition, any related transaction costs and the timing and manner of sale, all of which may differ from the assumptions and circumstances on which any current unrealized valuations are based. Neither PCA nor PCA s officers, employees or agents, make any representation or warranty, express or implied, in relation to the accuracy or completeness of the information contained in this document or any oral information provided in connection herewith, or any data subsequently generated herefrom, and accept no responsibility, obligation or liability (whether direct or indirect, in contract, tort or otherwise) in relation to any of such information. PCA and PCA s officers, employees and agents expressly disclaim any and all liability that may be based on this document and any errors therein or omissions therefrom. Neither PCA nor any of PCA s officers, employees or agents, make any representation of warranty, express or implied, that any transaction has been or may be effected on the terms or in the manner stated in this document, or as to the achievement or reasonableness of future projections, management targets, estimates, prospects or returns, if any. Any views or terms contained herein are preliminary only, and are based on financial, economic, market and other conditions prevailing as of the date of this document and are therefore subject to change. The information contained in this report may include forward-looking statements. Forward-looking statements include a number of risks, uncertainties and other factors beyond the control of the Firm, which may result in material differences in actual results, performance or other expectations. The opinions, estimates and analyses reflect PCA s current judgment, which may change in the future. Any tables, graphs or charts relating to past performance included in this report are intended only to illustrate investment performance for the historical periods shown. Such tables, graphs and charts are not intended to predict future performance and should not be used as the basis for an investment decision. All trademarks or product names mentioned herein are the property of their respective owners. Indices are unmanaged and one cannot invest directly in an index. The index data provided is on an as is basis. In no event shall the index providers or its affiliates have any liability of any kind in connection with the index data or the portfolio described herein. Copying or redistributing the index data is strictly prohibited. The Russell indices are either registered trademarks or tradenames of Frank Russell Company in the U.S. and/or other countries. The MSCI indices are trademarks and service marks of MSCI or its subsidiaries. Standard and Poor s (S&P) is a division of The McGraw-Hill Companies, Inc. S&P indices, including the S&P 500, are a registered trademark of The McGraw-Hill Companies, Inc. CBOE, not S&P, calculates and disseminates the BXM Index. The CBOE has a business relationship with Standard & Poor's on the BXM. CBOE and Chicago Board Options Exchange are registered trademarks of the CBOE, and SPX, and CBOE S&P 500 BuyWrite Index BXM are servicemarks of the CBOE. The methodology of the CBOE S&P 500 BuyWrite Index is owned by CBOE and may be covered by one or more patents or pending patent applications. FTSE is a trademark of the London Stock Exchange Group companies and is used by FTSE under license. All rights in the FTSE indices and/or FTSE ratings vest in FTSE and/or its licensors. No further distribution of FTSE data is permitted with FTSE s express written consent. The Barclays Capital indices (formerly known as the Lehman indices) are trademarks of Barclays Capital, Inc. The Citigroup indices are trademarks of Citicorp or its affiliates. The Merrill Lynch indices are trademarks of Merrill Lynch & Co. or its affiliates.
84

85

86
87

88

89

90

91

92

93 REVIEW OF THE SMALL CAP EQUITY ASSET CLASS EBMUD Employees Retirement System March 2015
94 Agenda Items Section Tab Small Cap Equity Asset Class 1 EBMUD Small Cap Equity Allocation 2 EBMUD Review of the Small Cap Equity Asset Class 2
95 Section 1: Small Cap Equity Asset Class EBMUD Review of the Small Cap Equity Asset Class 3
96 Small Cap Equity Asset Class The Small Cap Equity asset class (small caps) is composed of stocks issued by U.S. corporations that have a market capitalization between $250 million and $3 billion Market Capitalization = Shares Outstanding X Price Per Share i.e. how valuable the company is The total US market capitalization is highly skewed towards large caps % of Total Stock Market Capitalization Number of Companies Market Cap Range Large Cap 63% 200 $22+ billion Mid Cap 28% 800 $3 - $22 billion Small Cap 9% 2019 $250 million - $3 billion EBMUD Review of the Small Cap Equity Asset Class 4

97 Small Cap Equity Asset Class EBMUD Review of the Small Cap Equity Asset Class 5
98 Small Cap Equity Asset Class Rationale for investing in Small Caps Higher Growth/Nimble Operations Small companies grow from a smaller arithmetic base. It is easier to double sales of a $10 million company than sales of a $10 billion company Small companies are often in growing industries and find it easier to change their strategy in response to market conditions Greater universe of opportunities companies versus a couple hundred for large cap The rule of investing: 80% of Wall Street research is focused on under 20% of publicly traded companies This leaves a large number of companies with limited analyst coverage EBMUD Review of the Small Cap Equity Asset Class 6
99 Small Cap Equity Asset Class Rationale for investing in Small Caps - Continued Inefficient market Many small companies have relatively few shares actively traded which creates a liquidity issue This liquidity problem creates capacity constraint limit size of small cap portfolios Reduces the number of buyers can cause undervaluation and slow price revaluation Greater chance of added value In-depth research can make a difference Active portfolio managers have had more success in adding value in small caps than in large caps More companies + less analyst research + liquidity constraints = greater opportunity Management is often more open about business conditions EBMUD Review of the Small Cap Equity Asset Class 7
100 Small Cap Equity Asset Class Risk Associated with Small Caps Small caps tend to get the majority of their earnings from within the US which leads to stronger exposure to the US economic environment Small caps, on average, are more volatile than large caps This is due to: Operationally being less diversified than large cap companies often focused around one product or service Having less access to capital markets Often having fewer suppliers and large/fewer customers Shorter operating histories or unproven business models Less liquidity for their stocks Less public information EBMUD Review of the Small Cap Equity Asset Class 8
101 Small Cap Equity Asset Class In order to make the large universe of small company stocks more manageable the investment industry has divided the universe in half based on common characteristics or Styles The two common styles are Growth and Value Growth Stocks: Above average anticipated sales and earnings growth rates Pay no or small dividends reinvests earnings Often have high return on equity Stock sells at above average prices High P/E Value Stocks: Average to below average anticipated sales and earnings growth rates Usually pays dividends Often have more stable earnings Stocks sell at below average prices Low P/E EBMUD Review of the Small Cap Equity Asset Class 9
102 Growth of $100 Small Cap Equity Asset Class The Small Cap Equity asset class role within a diversified portfolio is to provide high long-term returns C umulativ e Pe rformance Dec-78 - Jan-15 Total Russell 2000 Russell 2000 Growth Russell 2000 Value BC Aggregate Bond Consumer Price Index D ec -78 D ec -82 D ec -86 D ec -90 D ec -94 D ec -98 D ec -02 D ec -06 D ec -10 J an-15 Annualized Return through 1/30/15 3 Years 5 Years 10 Years 20 Years 30 Years Russell Russell 2000 Growth Russell 2000 Value BC Aggregate Bond Consumer Price Index EBMUD Review of the Small Cap Equity Asset Class 10
103 Section 2: EBMUD Small Cap Equity Allocation EBMUD Review of the Small Cap Equity Asset Class 11
104 EBMUD Small Cap Equity Allocation EBMUD currently gains exposure to Small Cap equities through two investment managers Active Small Cap Value Manager Opus Passive Small Cap Growth Manager Northern Trust EBMUD currently has $30 million managed by Opus and $24 million managed by Northern Trust Northern Trust replaced Mazama in 2008 Opus was hired in 2006 to replace TCW EBMUD Review of the Small Cap Equity Asset Class 12
105 EBMUD Small Cap Equity Allocation On a regular basis, it is important to review the structure and performance of the different asset classes that comprise the EBMUD portfolio. This review should focus on the three factors listed below in order to determine if the asset class under review is accomplishing its role within the greater EBMUD portfolio. 1. Market Exposure: Are the managers providing the desired capital market exposure (e.g. to small cap equities) that they were hired to provide? 2. Diversification: Are the managers complementary to the other asset classes and to one another (exhibiting low correlation)? 3. Performance: Has the asset class produced satisfactory returns and have active managers outperformed their benchmarks? EBMUD Review of the Small Cap Equity Asset Class 13
106 R e s c a le d W e ig h t, % EBMUD Small Cap Equity Allocation EBMUD s Small Cap equity managers have consistently provided the desired capital market exposure This is the most important characteristic due to the asset allocation process Through the asset liability study process the Board determined an asset allocation that is best able to meet the liabilities of the System given the Plan s unique characteristics As such, managers are hired to provide specific capital market exposure If managers do not provide the desired exposure then the asset allocation will deviate from the policy allocation A s s e t L o ad in g s - M an ag e r A s s e t L o ad in g s - Be n ch m ar k D e c D e c -1 4 S m G ro wt h S m V a lu e M id G ro wt h M id V a lu e To p G ro wt h To p V a lu e C a s h Av erage to date, D ec D ec Dec-09 Jun-10 Dec-10 Jun-11 Dec-11 Jun-12 Dec-12 Jun-13 Dec-13 Jun-14 Dec-14 0 Dec-09 Jul-10 Jan-11 Jul-11 Jan-12 Jul-12 Jan-13 Jul-13 Jan-14 Dec-14 EBMUD Review of the Small Cap Equity Asset Class 14
107 C orrelation EBMUD Small Cap Equity Allocation EBMUD s Small Cap equity asset class exhibits low correlation to other asset classes within the portfolio providing diversification 36 M onth Rolling Corre la tion 1.0 Jan-05 - Dec-14 EBMUD Small Cap Domestic Equity International Equity Total Fixed Income Real Estate Jan-05 Dec -06 Dec -08 Dec -10 Dec -12 Dec -14 EBMUD Review of the Small Cap Equity Asset Class 15
108 Excess Correlation EBMUD Small Cap Equity Allocation Opus and Northern Trust have low active correlation to one another providing enhanced diversification benefit 36 M onth Rolling Ex ce ss Corre la tion 1.0 Dec-08 - Dec-14 Opus 0.8 Northern R Dec -08 Dec -09 Dec -10 Dec -11 Dec -12 Dec -13 Dec -14 EBMUD Review of the Small Cap Equity Asset Class 16
109 G rowth of $100 EBMUD Small Cap Equity Allocation The EBMUD portfolio has generated high returns over time but active management of the portfolio has not added value - Value bias has detracted from returns over past 5 years Cum ula tive P e rform a nce 225 Dec-04 - Dec-14 Total 200 EBMUD Small Cap Russell 2000 Index Hired Opus Terminated Mazama Dec -04 Dec -06 Dec -08 Dec -10 Dec -12 Dec -14 EBMUD Review of the Small Cap Equity Asset Class 17
110 DISCLOSURES: This document is provided for informational purposes only. It does not constitute an offer of securities of any of the issuers that may be described herein. Information contained herein may have been provided by third parties, including investment firms providing information on returns and assets under management, and may not have been independently verified. The past performance information contained in this report is not necessarily indicative of future results and there is no assurance that the investment in question will achieve comparable results or that the Firm will be able to implement its investment strategy or achieve its investment objectives. The actual realized value of currently unrealized investments (if any) will depend on a variety of factors, including future operating results, the value of the assets and market conditions at the time of disposition, any related transaction costs and the timing and manner of sale, all of which may differ from the assumptions and circumstances on which any current unrealized valuations are based. Neither PCA nor PCA s officers, employees or agents, make any representation or warranty, express or implied, in relation to the accuracy or completeness of the information contained in this document or any oral information provided in connection herewith, or any data subsequently generated herefrom, and accept no responsibility, obligation or liability (whether direct or indirect, in contract, tort or otherwise) in relation to any of such information. PCA and PCA s officers, employees and agents expressly disclaim any and all liability that may be based on this document and any errors therein or omissions therefrom. Neither PCA nor any of PCA s officers, employees or agents, make any representation of warranty, express or implied, that any transaction has been or may be effected on the terms or in the manner stated in this document, or as to the achievement or reasonableness of future projections, management targets, estimates, prospects or returns, if any. Any views or terms contained herein are preliminary only, and are based on financial, economic, market and other conditions prevailing as of the date of this document and are therefore subject to change. The information contained in this report may include forward-looking statements. Forward-looking statements include a number of risks, uncertainties and other factors beyond the control of the Firm, which may result in material differences in actual results, performance or other expectations. The opinions, estimates and analyses reflect PCA s current judgment, which may change in the future. Any tables, graphs or charts relating to past performance included in this report are intended only to illustrate investment performance for the historical periods shown. Such tables, graphs and charts are not intended to predict future performance and should not be used as the basis for an investment decision. All trademarks or product names mentioned herein are the property of their respective owners. Indices are unmanaged and one cannot invest directly in an index. The index data provided is on an as is basis. In no event shall the index providers or its affiliates have any liability of any kind in connection with the index data or the portfolio described herein. Copying or redistributing the index data is strictly prohibited. The Russell indices are either registered trademarks or trade names of Frank Russell Company in the U.S. and/or other countries. The MSCI indices are trademarks and service marks of MSCI or its subsidiaries. Standard and Poor s (S&P) is a division of The McGraw-Hill Companies, Inc. S&P indices, including the S&P 500, are a registered trademark of The McGraw-Hill Companies, Inc. CBOE, not S&P, calculates and disseminates the BXM Index. The CBOE has a business relationship with Standard & Poor's on the BXM. CBOE and Chicago Board Options Exchange are registered trademarks of the CBOE, and SPX, and CBOE S&P 500 BuyWrite Index BXM are servicemarks of the CBOE. The methodology of the CBOE S&P 500 BuyWrite Index is owned by CBOE and may be covered by one or more patents or pending patent applications. The Barclays Capital indices (formerly known as the Lehman indices) are trademarks of Barclays Capital, Inc. The Citigroup indices are trademarks of Citicorp or its affiliates. The Merrill Lynch indices are trademarks of Merrill Lynch & Co. or its affiliates. EBMUD Review of the Small Cap Equity Asset Class 18


111


112


113
PCA INVESTMENT MARKET RISK METRICS. Monthly Report
 PCA INVESTMENT MARKET RISK METRICS Monthly Report June 2017 Takeaways Equity volatility measure (VIX) ended the month at extremely low levels, lowest since the global financial crisis, after a brief inter-month
Investment Market Risk Metrics August 2011
 Investment Market Risk Metrics August 2011 Takeaways Data is as of Monday August 8, 2011 Interest rate risk increased to levels not seen since Dec 2008 Equity market volatility spiked after U.S. Treasury
PCA INVESTMENT MARKET RISK METRICS
 PCA INVESTMENT MARKET RISK METRICS Monthly Report March 2018 (as of 2/28/18) Takeaways February was extremely volatile on an intramonth basis, and the final month results were the worst since early-2016
Investment Market Risk Metrics April 2013
 Investment Market Risk Metrics April 2013 Pension Consulting Alliance, Inc. Takeaways The markets are currently less concerned about equity risk than what is typical. VIX remained well below average at
PCA INVESTMENT MARKET RISK METRICS. Monthly Report
 PCA INVESTMENT MARKET RISK METRICS Monthly Report January 2017 Takeaways PCA s sentiment indicator (pg 4) became significantly more positive by year end, as risk assets rallied hard from earlier in the
PCA INVESTMENT MARKET RISK METRICS
 PCA INVESTMENT MARKET RISK METRICS Monthly Report August 2017 (as of 7/31/17) Takeaways Growth risk-based assets throughout the globe produced moderately positive returns during July, whereas U.S. interest
MAY 2018 Capital Markets Update
 MAY 2018 Market commentary U.S. ECONOMICS The U.S. added 223,000 jobs to payrolls in May, well above the consensus estimate of 180,000 and the expansion average of around 200,000. Sector job gains were
University of Illinois. Fourth Quarter 2016 Investment Update Board Report. March University of Illinois
 University of Illinois March 15, 2017 Fourth Quarter 2016 Investment Update Board Report March 2017 University of Illinois 1 (This page left blank intentionally) University of Illinois 2 Table of Contents
Capital Markets Outlook 100 LOWDER BROOK DRIVE SUITE 1100 WESTWOOD MA FAX
 M E K E T A I N V E S T M E N T G R O U P 00 LOWDER BROOK DRIVE SUITE 00 WESTWOOD MA 02090 78 47 3500 FAX 78 47 34 Investors are faced with three primary issues in the near-term: ) historically low bond
Summit Strategies Group 8182 Maryland Avenue, 6th Floor St. Louis, Missouri Monthly Economic & Capital Market Update
 Summit Strategies Group 8182 Maryland Avenue, 6th Floor St. Louis, Missouri 63105 314.727.7211 Monthly Economic & Capital Market Update November 2015 Yield to Maturity Monthly Change Nov-63 Nov-67 Nov-71
WILSHIRE MUTUAL FUNDS
 WILSHIRE MUTUAL FUNDS SEMI-ANNUAL REPORT (Unaudited) LARGE COMPANY GROWTH PORTFOLIO LARGE COMPANY VALUE PORTFOLIO SMALL COMPANY GROWTH PORTFOLIO SMALL COMPANY VALUE PORTFOLIO WILSHIRE 5000 INDEX SM FUND
Summit Strategies Group 8182 Maryland Avenue, 6th Floor St. Louis, Missouri Economic & Capital Market Review
 Summit Strategies Group 8182 Maryland Avenue, 6th Floor St. Louis, Missouri 63105 314.727.7211 Economic & ital Market Review TABLE OF CONTENTS Page Key Highlights 1 Economic Perspective 2 Assets 5 Income
Economic and Capital Market Update November 2017
 Economic and Capital Market Update November 2017 Oct-69 Oct-73 Oct-77 Oct-81 Oct-85 Oct-89 Oct-93 Oct-97 Oct-01 Oct-05 Oct-09 Oct-13 Oct-17 November 30, 2017 Economic Perspective Economy Global economic
DECEMBER 2018 Capital Markets Update
 DECEMBER 2018 Market commentary U.S. ECONOMICS Nonfarm payrolls jumped by 312,000 in December, well above expectations for a 176,000 increase. The healthcare sector (+50,000) led job creation, while restaurants
SEPTEMBER 2018 Capital Markets Update
 SEPTEMBER 2018 Market commentary U.S. ECONOMICS Non-farm payrolls added 134,000 jobs in September, missing the consensus estimate of 185,000. However, net revisions to the two months prior totaled +87,000
MARCH 2018 Capital Markets Update
 MARCH 2018 Market commentary ECONOMIC CLIMATE Hiring slowed from its fast pace last month the U.S. added 103,000 jobs to nonfarm payrolls in March, below the consensus estimate of 185,000. The U-3 unemployment
Summit Strategies Group 8182 Maryland Avenue, 6th Floor St. Louis, Missouri Monthly Economic & Capital Market Update
 Summit Strategies Group 8182 Maryland Avenue, 6th Floor St. Louis, Missouri 63105 314.727.7211 Monthly Economic & Capital Market Update July 2015 Yield to Maturity Monthly Change Jul-63 Jul-67 Jul-71 Jul-75
Capital Market Review
 Capital Market Review September 3, 215 Percent Percent MARKET/ECONOMIC OVERVIEW Risk Reprices Rapidly 2,2 1,9 1,6 1,3 S&P 5 April 29, 211 to Oct 3, 211 157 Days -19.4% May 21, 215 to Sep 3, 215 132 Days
Economic and Capital Market Update April 2018
 Economic and Capital Market Update April 2018 Apr-70 Apr-74 Apr-78 Apr-82 Apr-86 Apr-90 Apr-94 Apr-98 Apr-02 Apr-06 Apr-10 Apr-14 Apr-18 April 30, 2018 Economic Perspective The strong pace of the global
Market Commentary - 2nd Quarter 2017
 3 Months YTD 1 Year 3 Years 5 Years 1 Years As the economy picks up we will need to be gradual when adjusting our policy parameters, so as to ensure that our stimulus accompanies the recovery amid the
Summit Strategies Group 8182 Maryland Avenue, 6th Floor St. Louis, Missouri Economic & Capital Market Review
 Summit Strategies Group 8182 Maryland Avenue, 6th Floor St. Louis, Missouri 63105 314.727.7211 Economic & ital Market Review TABLE OF CONTENTS Page Key Highlights 1 Economic Perspective 2 Assets 5 Income
Fresno County Employees' Retirement Association
 Fresno County Employees' Retirement Association Investment Performance Review Period Ending: December 31, 2006 999 Third Avenue, Suite 3650 2321 Rosecrans Avenue, Suite 2250 Seattle, Washington 98104 El
Eric C. Elbell, CFA, CAIA Area Senior Vice President. Kyongdo Min, CPA, CFA Area Vice President. April 11, 2018
 Eric C. Elbell, CFA, CAIA Area Senior Vice President Kyongdo Min, CPA, CFA Area Vice President April 11, 2018 Agenda We will address three key topics: Headline events that impacted markets during the quarter
Global Market Overview
 First Quarter 219 First Quarter 219: March Madness, or Just an Incredible Rebound? Global Market Overview MSCI All Country World S&P Russell 2 MSCI EAFE MSCI Emerging Markets MSCI ACWI ex USA Small BBgBarc
Portfolio Strategist Update from The Dreyfus Corporation
 Portfolio Strategist Update from The Dreyfus Corporation Active Opportunity ETF Portfolios As of Dec. 31, 2017 Ameriprise Financial Services, Inc. (Ameriprise Financial) is the investment manager for Active
City of Fort Walton Beach, Florida Beal Memorial Cemetery Perpetual Care Fund
 City of Fort Walton Beach, Florida Beal Memorial Cemetery Perpetual Care Fund Investment Performance Review Investment Advisors Steven Alexander, CTP, CGFO, CPPT, Managing Director Khalid Yasin, CIMA,
Retirement System Pension Plan Investment Performance Review Quarter Ended June 30, 2014
 Retirement System Pension Plan Investment Performance Review Quarter Ended June 30, 2014 Investment Advisors John Spagnola, Managing Director Joseph Federico, Analyst PFM Asset Management LLC Two Logan
2014 Active Management Review March 24, 2015
 March 24, 2015 Steven J. Foresti, Managing Director Chris Tessman, Vice President Andre Minassian, CFA, Associate Wilshire Associates Incorporated 1299 Ocean Avenue, Suite 700 Santa Monica, CA 90401 Phone:
TMRS Quarterly Summary. Period Ended: December 31, 2015
 TMRS Quarterly Summary Period Ended: December 31, 2015 Capital Markets Review Fourth Quarter Economic Environment Key Economic Indicators World equity markets rallied in October following a period of heightened
Economic and Financial Markets Monthly Review & Outlook Detailed Report January 2018
 Economic and Financial Markets Monthly Review & Outlook Detailed Report January 1 NOT FDIC INSURED NO BANK GUARANTEE MAY LOSE VALUE Overview of the Economy Business and economic confidence continue to
Asset Strategy Consultants. MARKET ENVIRONMENT Second Quarter 2016
 MARKET ENVIRONMENT Second Quarter 2016 Market Environment: U.S. Economy The 2nd quarter was reasonably uneventful and markets were relatively placid until June 23rd, when British voters narrowly approved
FIXED INCOME STRATEGIES FOR LATE 2017 NAVIGATING UNCHARTERED TERRITORY, RISING RATES, AND YOUR FIXED INCOME PORTFOLIO
 FIXED INCOME STRATEGIES FOR LATE 2017 NAVIGATING UNCHARTERED TERRITORY, RISING RATES, AND YOUR FIXED INCOME PORTFOLIO 1 The information contained herein reflects the views of Galliard Capital Management,
NOVEMBER 2018 Capital Markets Update
 NOVEMBER 2018 Market commentary U.S. ECONOMICS Non-farm payrolls added 155,000 jobs in November, missing expectations of 198,000, and the unemployment rate held steady at 3.7%. The labor force participation
Performance and Manager Review First Quarter 2011
 The University of Western Ontario Pension Plan Performance and Manager Review First Quarter 2011 May 19th, 2011 Presented by: Bruce Curwood, MBA, CFA, CIMA, Acc. Dir. Director, Investment Strategy Capital
Endowment Funds Performance (Year ending June 30 th, 2014)
") Endowment Funds Performance (Year ending June 30 th, 2014) prepared for Investment Subcommittee (Note: all returns and values are expressed in Canadian Dollars- CAD s) 1 Quarterly Market Overview Equity
Endowment Funds Performance (Year ending June 30 th, 2014) prepared for Investment Subcommittee (Note: all returns and values are expressed in Canadian Dollars- CAD s) 1 Quarterly Market Overview Equity
Asset Strategy Consultants. MARKET ENVIRONMENT Third Quarter 2016
 MARKET ENVIRONMENT Third Quarter 2016 Market Environment: Economy Investor angst over the unexpected vote on Brexit was short lived with a "risk on" theme returning to the markets in July and leading to
PALM TRAN, INC./ATU LOCAL 1577 PENSION FUND INVESTMENT PERFORMANCE PERIOD ENDING MARCH 31, 2011
 PALM TRAN, INC./ATU LOCAL 1577 PENSION FUND INVESTMENT PERFORMANCE PERIOD ENDING MARCH 31, 2011 NOTE: For a free copy of Part II (mailed w/i 5 bus. days from request receipt) of Burgess Chambers and Associates,
Raymond James & Associates, Inc., member New York Stock Exchange/SIPC
 Kevin W. Byrne, CTFA, CIMA Senior Vice President, Investments Kevin.Byrne@RaymondJames.com October 20 th, 2016 BCM Q3-2016 Market and Economic Review Economic Review: GDP: Real GDP increased at an annual
2014 CAPITAL MARKET ASSUMPTIONS. January SEATTLE LOS ANGELES
 2014 CAPITAL MARKET ASSUMPTIONS January 2014 SEATTLE 206.622.3700 LOS ANGELES 310.297.1777 www.wurts.com TABLE OF CONTENTS Summary Page 3 Overview of Methodology Page 7 Inflation Page 9 Fixed Income Page
Prudential International Investments Advisers, LLC. Global Investment Strategy October 2009
 Prudential International Investments Advisers, LLC. Global Investment Strategy October 2009 By John Praveen, Chief Investment Strategist For Market Commentary Interviews Contact: Lisa Villareal, 973-367-2503/lisa.villareal@prudential.com
Capital Market Outlook Q3 2017
 Economic progress, in capitalist society, means turmoil Josef A. Schumpeter Summary Capital Market Outlook Q 207 We are not sure that the economist and long time Harvard professor envisaged the type of
ACG Market Review. Second Quarter Global Highlights: Economy Announced tariffs have so far failed to slow down economic activity
 ACG Market Review Second Quarter 2018 Global Highlights: Economy Announced tariffs have so far failed to slow down economic activity Equities U.S. equites turn positive for the year backed by strong corporate
OCTOBER 2018 Capital Markets Update
 OCTOBER 2018 Market commentary U.S. ECONOMICS U.S. real GDP grew at an annualized quarterly rate of 3.5% (3. YoY) in Q3, beating expectations of 3.4%. The economy was supported by the strongest consumer
City of Fort Walton Beach Beal Memorial Cemetery Perpetual Care Fund
 City of Fort Walton Beach Beal Memorial Cemetery Perpetual Care Fund Investment Performance Review Quarter Ended June 30, 2016 Investment Advisors Steven Alexander, CTP, CGFO, CPPT, Managing Director Khalid
The curious task of economics is to demonstrate to men how little they really know about what they imagine they can design."
 The curious task of economics is to demonstrate to men how little they really know about what they imagine they can design." -Friedrich August von Hayek 3 Months YTD 1 Year 3 Years 5 Years 10 Years S&P
TEL FAX cookstreetconsulting.com
 TEL 303.333.7770 1.800.318.7770 FAX 303.333.7771 cookstreetconsulting.com Contents 1 Market Review 2 Plan Overview 3 Investment Due Diligence Appendix Appendix 3 1 Market Review 5 Q2 2017 Economic Review
Capital Market Outlook Q4 2017
 It amazes me how people are often more willing to act based on little or no data than to use data that is a challenge to assemble. - Robert Shiller Summary Capital Market Outlook Q4 207 The Yale Nobel
Performance Review May 17, 2018
 Performance Review May 17, 2018 Cost-Efficiencies Initiative Update Goal: Obtain $100 million of incremental cost-efficiencies for the NCRS investment program, consistent with fiduciary requirements and
First Quarter 2017 Investment Review. Prepared by: Meketa Investment Group CHICAGO, IL (312)
") First Quarter 2017 Investment Review Prepared by: Meketa Investment Group CHICAGO, IL 60661 (312) 474-0900 MARKET SUMMARY - 1Q17 CAPITAL MARKETS Index MARKET SNAPSHOT MARCH 31, 2017 Qtr One Year Three
First Quarter 2017 Investment Review Prepared by: Meketa Investment Group CHICAGO, IL 60661 (312) 474-0900 MARKET SUMMARY - 1Q17 CAPITAL MARKETS Index MARKET SNAPSHOT MARCH 31, 2017 Qtr One Year Three
Fourth Quarter 2015 Market Review. March 2016
 Fourth Quarter 2015 Market Review March 2016 Agenda Market Review Investment Outlook and Portfolio Positioning 2 2015 was a Challenging Year for Investment Returns Last year was the first time since 2001
University of Washington
 University of Washington Investment Performance Report to UWINCO Fourth Quarter Fiscal Year 200 As of June 30, 200 Treasurer Board of Regents Treasury Office Published August 200 Table of Contents Treasury
Target Retirement Performance Update
 Target Retirement Update Q1 2017 CIT Strategy Highlights As of March 31, 2017 The State Street Target Retirement Collective Trust Strategies posted quarterly returns ranging from +2.44% (Income Strategy)
Economic and Financial Markets Monthly Review & Outlook Detailed Report. June 2014
 Economic and Financial Markets Monthly Review & Outlook Detailed Report June 1 Overview of the Economy In the U.S., the Federal Reserve s Beige Book report on the economy through late May indicated that
December 2017 Investment Report
 December 2017 Investment Report Highlights Total nonfarm payroll employment increased by 228,000 in November. Employment continued its upward trend in professional and business services, manufacturing
Asset Strategy Consultants. MARKET ENVIRONMENT First Quarter 2017
 MARKET ENVIRONMENT First Quarter 2017 Market Environment: Economy Economies in the U.S. and Europe continued to gain traction. Expectations for lower taxes, reduced regulation, and other pro-growth reforms
Schwab Indexed Retirement Trust Fund 2040
 Fund Facts Trustee Fund Type Charles Schwab Bank Collective Trust Fund Category Target Date 2036-2040 Benchmark 2040 Custom Index 1 Unit Class Inception Date Fund Inception Date 1/5/2009 Net Asset Value
Economic and Financial Markets Monthly Review & Outlook Detailed Report October 2017
 Economic and Financial Markets Monthly Review & Outlook Detailed Report October 17 NOT FDIC INSURED NO BANK GUARANTEE MAY LOSE VALUE Overview of the Economy Business and economic confidence indicators
ASSET ALLOCATION REPORT
 2018 ASSET ALLOCATION REPORT INTRODUCTION We invite you to review Omnia Family Wealth s 2018 report on expected asset class returns for the next 10 years. While we believe these forecasts reflect a reasonable
Marquette Associates Market Environment
 M Marquette Associates Market Environment April 2010 U.S. Economy Fixed Income Markets U.S. Equity Markets International Equity Markets Hedge Fund Markets Real Estate Markets Private Equity and Hedge Fund
Investment Committee Quarterly Activity Report 4. FIXED INCOME
 Investment Committee Quarterly Activity Report 4. FIXED INCOME FIXED INCOME MARKET RISK DASHBOARD As of 6/30/2015 Monetary Policy 3.88% U.S. Unemployment Rate 6.10% 0.25% 0% 9.75% The Fed Funds target
Fourth Quarter Market Outlook. Jason Bulinski, CFA Donald A. Powell, CFA Joseph Styrna, CFA
 Fourth Quarter 2018 Market Outlook Jason Bulinski, CFA Donald A. Powell, CFA Joseph Styrna, CFA Economic Outlook Growth: Strong 2018, But Expecting Slowdown in 2019 Growth & Jobs 2018 2017 2016 2015 2014
Skyline Asset Management, L.P. Executive Summary Skyline Small Cap Value Composite December 31, 2018
 Overview The composite generated a -20.3% return for the fourth quarter, compared to a -20.2% return for the Russell 2000 Index and a -18.7% return for the Russell 2000 Value Index. For all of 2018, the
November 2017 Investment Report
 November 2017 Investment Report Highlights The U.S. economy continued to strengthen as hiring rebounded following the hurricanes in Florida and Texas. Employers added 261,000 jobs in October, the most
Presentation Materials
 Fairfax County Public Schools Third Quarter 2017 Presentation Materials Visit the Aon Hewitt Retirement and Investment Blog (http://retirementandinvestmentblog.aon.com); sharing our best thinking. Contact
Callan Associates Inc. Investment Measurement Service Quarterly Review City of Milwaukee Employees Retirement System March 31, 2011
 Callan Associates Inc. Investment Measurement Service Quarterly Review March 31, 2011 The following report was prepared by Callan Associates Inc. ("CAI") using information from sources that include the
Period Ended: December 31, 2018
 Period Ended: December 31, 2018 Capital Markets Review Fourth Quarter Economic Environment Key Economic Indicators The fourth quarter of 2018 was characterized by a heightened level of volatility and negative
BOYNTON BEACH POLICE PENSION FUND INVESTMENT PERFORMANCE PERIOD ENDING MARCH 31, 2011
 BOYNTON BEACH POLICE PENSION FUND INVESTMENT PERFORMANCE PERIOD ENDING MARCH 31, 2011 NOTE: For a free copy of Part II (mailed w/i 5 bus. days from request receipt) of Burgess Chambers and Associates,
Performance and Manager Review First Quarter 2012
 Performance and Manager Review First Quarter 2012 The University of Western Ontario Pension Plan Presented by: Bruce Curwood, MBA, CFA, CIMA, Act. Dir. Director, Investment Strategy JUNE 7, 2012 Executive
Financial Market Outlook: Further Stock Gain on Faster GDP Rebound and Earnings Recovery. Year-end Target Raised
 For Market Commentary Interviews Contact: Lisa Villareal, 973-367-2503/lisa.villareal@prudential.com Financial Market Outlook & Strategy: FurtherStock Gains Likely, Year-end Target Raised. Bond Under Pressure
J.P. Morgan Income Funds
 Annual Report J.P. Morgan Income Funds February 28, 2017 JPMorgan Core Bond Fund JPMorgan Core Plus Bond Fund JPMorgan Government Bond Fund JPMorgan High Yield Fund JPMorgan Inflation Managed Bond Fund
Q MARKETS REVIEW
 Stock markets around the world continued their ascent during the quarter as investors took solace in continuing corporate earnings growth, fueled by strong global economic growth, and U.S. tax cuts. Overview
Portfolio Navigator funds Quarterly performance and commentary
 Navigator funds Quarterly performance and commentary June 30, 2018 291426 AA VUL (7/18) The Navigator funds Performance Quarter ending 6/30/18 3 month YTD 1 year 3 year 5 year Since Inception* (Class 2)
SUNRISE POLICE PENSION FUND PERFORMANCE REVIEW JUNE 2003
 PENSION FUND PERFORMANCE REVIEW JUNE 23 Associates, Inc. 199, 2 INVESTMENT RETURN On June 3th, the Sunrise Police Pension Fund s assets were valued at $36,325,34, which was an increase of $2,641,772 from
Quarterly Investment Performance Analysis
 Quarterly Investment Performance Analysis Municipality of Anchorage Trust Fund Period Ended: March 31, 2018 Agenda Item III..D. (Detail) Table Of Contents 1 Capital Markets Review Page 3 2 Total Portfolio
Financial Market Outlook & Strategy: Stocks Bottoming On Track to Recovery. Near-term Risks
 For Market Commentary Interviews Contact: Lisa Villareal, 973-367-2503/lisa.villareal@prudential.com Financial Market Outlook & Strategy: Stocks Bottoming On Track to Recovery. Near-term Risks John Praveen
Performance and Manager Review Third Quarter 2011
 The University of Western Ontario Pension Plan Performance and Manager Review Third Quarter 2011 December 14, 2011 Presented by: Bruce Curwood, MBA, CFA, CIMA, Acc. Dir. Director, Investment Strategy Executive
Economic Outlook. DMS Economic Outlook for next 12 months
 Economic Outlook DMS Economic Outlook for next 12 months GDP growth will be modest at approximately 2.5%, but the economy will experience periods of unstable growth. Consumer confidence will improve as
Fidelity Freedom 2055 Fund
 QUARTERLY FUND REVIEW AS OF MARCH 31, 2018 Fidelity Freedom 2055 Fund Investment Approach Fidelity Freedom Funds (the Funds) are designed so that the target date referenced in the Fund name is the approximate
Prudential International Investments Advisers, LLC. Global Investment Strategy June 2009
 Prudential International Investments Advisers, LLC. Global Investment Strategy June 2009 By John Praveen, Chief Investment Strategist For Market Commentary Interviews Contact: Lisa Villareal, 973-367-2503/lisa.villareal@prudential.com
BOYNTON BEACH POLICE PENSION FUND INVESTMENT PERFORMANCE PERIOD ENDING MARCH 31, 2013
 BOYNTON BEACH POLICE PENSION FUND INVESTMENT PERFORMANCE PERIOD ENDING MARCH 31, 2013 NOTE: For a free copy of Part II (mailed w/i 5 bus. days from request receipt) of Burgess Chambers and Associates,
ASSET ALLOCATION VIEWPOINTS
 T. Rowe Price ASSET ALLOCATION VIEWPOINTS Q2 2017 Stocks vs. Bonds We increased our underweight to stocks relative to bonds as equity valuations appear extended against a backdrop of continued modest economic
Fresno County Employees Retirement Association
 MARCH 2017 Verus 2017 Capital Mark Assumptions Fresno County Employees Retirement Association Asset allocation forecast In January of each year, Verus prepares forward looking 10 year return assumptions
January Market Review Groundhog Day
 Larry Adam, CFA, CIMA CIO Americas & Chief Investment Strategist January Market Review Groundhog Day January 2016 Highlights of the Month: U.S. 4Q15 GDP Slows to Lowest YoY Growth Since 1Q14; ISM Manufacturing
UWINCO Investment Performance Quarterly Report Quarter Ended December 31, 2017
 STANDING COMMITTEES F 11 Finance and Asset Management Committee UWINCO Investment Performance Quarterly Report Quarter Ended December 31, 2017 INFORMATION This item is for information only. Attachment
LUTHER KING CAPITAL MANAGEMENT LKCM SMID CAP EQUITY COMPOSITE First Quarter, 2016 Update
 LUTHER KING CAPITAL MANAGEMENT LKCM SMID CAP EQUITY COMPOSITE First Quarter, 2016 Update Performance ** 1 st QTR 2016 3 Years Annualized 5 Years Annualized Since Inception Annualized * LKCM SMID Cap Equity
Fixed income market update
 March 2, 215 Fixed income market update Taplin, Canida & Habacht, LLC BMO Global Asset Management 11 Brickell Bay Drive Suite 21 Miami, Florida 33131 p 35-379-21 f 35-379-4452 tchinc.com Fixed income market
State Street Global Advisors SPDR ETFs Chart Pack
 State Street Global Advisors SPDR ETFs Chart Pack April 2018 Edition For Public Use Please see Appendix C for more information on investment terms used in this Chart Pack. Chart Pack Table of Contents
September 2017 Investment Report
 September 2017 Investment Report Highlights The Federal Reserve (Fed) left interest rates unchanged in September but confirmed that it will begin to slowly and predictably reduce its holdings of U.S. Treasury
Market Overview As of 1/31/2019
 Asset Class Leadership Periodic Table Worst Best 78.51 58.21 41.45 37.21 34.47 27.45 26.46 20.58 19.69 29.09 27.58 2 18.88 16.71 15.51 15.12 15.06 11.15 7.84 7.28 4.98 2.64 2.11 0.39-2.91-5.50-13.71 20.14
Market Overview As of 4/30/2018
 Asset Class Leadership Periodic Table Worst Best 5.24-26.16-28.92-36.85-37.00-37.34-38.44-38.54-45.53 78.51 58.21 41.45 37.21 34.47 27.45 26.46 20.58 19.69 29.09 27.58 24.50 18.88 16.71 15.51 15.12 15.06
Market Overview As of 11/30/2018
 Asset Class Leadership Periodic Table Worst Best 5.24-26.16-28.92-36.85-37.00-37.34-38.44-38.54-45.53 78.51 58.21 41.45 37.21 34.47 27.45 26.46 20.58 19.69 29.09 27.58 24.50 18.88 16.71 15.51 15.12 15.06
1000G 1000G HY
 Asset Class Leadership Periodic Table Worst Best 5.24-26.16-28.92-36.85-37.00-37.34-38.44-38.54-45.53 78.51 58.21 41.45 37.21 34.47 27.45 26.46 20.58 19.69 29.09 27.58 24.50 18.88 16.71 15.51 15.12 15.06
Financial Market Outlook: Stocks Rebounding from July Correction, Further Gains Likely. Bond Yields Range Bound
 For Market Commentary Interviews Contact: Lisa Villareal, 973-367-2503/lisa.villareal@prudential.com Financial Market Outlook & Strategy: Stocks Rebounding from July Correction, Further Gains Likely. Bond
INVESTMENT PERFORMANCE ANALYSIS
 SACRAMENTO COUNTY EMPLOYEES RETIREMENT SYSTEM INVESTMENT PERFORMANCE ANALYSIS MARCH 31, 2011 333 Bush Street, Suite 2000 San Francisco, CA 94104 (415) 362 3484 Periods Ending March 31, 2011 Actual Historical
4 th Quarter 2017 Webcast. Diversified Large Cap Value Equity. Presented by. Joseph Kirby Portfolio Manager
 4 th Quarter 2017 Webcast Diversified Large Cap Value Equity Presented by Joseph Kirby Portfolio Manager 2018 Brandywine Global Investment Management, LLC. All rights reserved. The views expressed herein
University of Puerto Rico Retirement System
 December 31, 2016 University of Puerto Rico Retirement System Investment Measurement Service Quarterly Review The following report was prepared by Callan Associates Inc. ("CAI") using information from
Market Overview As of 8/31/2017
 Asset Class Leadership Periodic Table Worst Best 39.42 16.65 11.81 7.05 6.97 5.49 1.87-0.17-9.78 5.24-26.16-28.92-36.85-37.00-37.34-38.44-38.54-45.53 78.51 58.21 41.45 37.21 34.47 27.45 26.46 20.58 19.69
Market Overview As of 10/31/2017
 Asset Class Leadership Periodic Table Worst Best 39.42 16.65 11.81 7.05 6.97 5.49 1.87-0.17-9.78 5.24-26.16-28.92-36.85-37.00-37.34-38.44-38.54-45.53 78.51 58.21 41.45 37.21 34.47 27.45 26.46 20.58 19.69
UWINCO Board Update and Investment Performance Quarterly Report Quarter Ended September 30, 2017
 STANDING COMMITTEES F 9 Finance and Asset Management Committee UWINCO Board Update and Investment Performance Quarterly Report Quarter Ended September 30, 2017 INFORMATION This item is being presented
Prudential International Investments Advisers, LLC. Global Investment Strategy May 2008
 Prudential International Investments Advisers, LLC. Global Investment Strategy May 2008 By John Praveen, Chief Investment Strategist For Market Commentary Interviews Contact: Lisa Villareal, 973-367-2503/lisa.villareal@prudential.com