SAFE HARBOR STATEMENT
|
|
|
- Abraham Doyle
- 6 years ago
- Views:
Transcription

1
2 SAFE HARBOR STATEMENT This presentation may contain projections or other forward-looking statements within the meaning of Section 27A of the Securities Act of 1933, as amended, and Section 21E of the Securities Exchange Act of 1934, as amended. Forward-looking statements in this presentation include, but are not limited to, our planned 2018 priorities, expectations regarding our business outlook for the calendar year These statements involve risks and uncertainties, and actual events or results may differ materially. Among the important factors that could cause actual results to differ materially from those in the forward-looking statements are the risk that our reduction in operating expenses may impact our ability to meet our business objectives and achieve our revenue targets and may not result in the expected improvement in our profitability; the fact that our future growth depends in part on further penetrating our addressable market and growing internationally, and we may not be successful in doing so; any inability to successfully manage frequent product introductions (including our 2018 roadmap for new hardware and software products and major new software features) and transitions, including managing our sales channel and inventory and accurately forecasting future sales; our reliance on third party suppliers, some of which are sole source suppliers, to provide components for our products; our dependence on sales of our cameras, mounts and accessories for substantially all of our revenue; the effect of a decrease in the sales or change in sales mix of these products; the effect of a decrease in sales during the holiday season; the fact that an economic downturn or economic uncertainty in our key U.S. and international markets may adversely affect consumer discretionary spending and demand for our products; any inability to anticipate consumer preferences and successfully develop and market desirable products; the effects of the highly competitive market in which we operate; the fact that we may not be able to achieve revenue growth or profitability in the future; risks related to inventory, purchase commitments and long-lived assets; the importance of maintaining the value and reputation of our brand; and other factors detailed in the Risk Factors section of our Annual Report on Form 10-K for the year ended December 31, 2016, which is on file with the Securities and Exchange Commission and as supplemented by Item 1A Risk Factors in our Quarterly Report on Form 10-Q for the quarter ended September 30, Additional information will also be set forth in our Annual Report on Form 10-K for the year ended December 31, 2017, which will be filed with the Securities and Exchange Commission (the SEC ) and may be obtained for free by visiting EDGAR on the SEC web site at These forward-looking statements speak only as of the date hereof or as of the date otherwise stated herein. GoPro disclaims any obligation to update these forwardlooking statements. In addition to U.S. GAAP financials, this presentation includes certain non-gaap financial measures, including non-gaap gross margin, operating expenses, operating income (loss), net income (loss), earnings (loss) per share and adjusted EBITDA. These non-gaap measures are in addition to, not a substitute for or superior to, measures of financial performance prepared in accordance with U.S. GAAP. The non-gaap financial measures used by GoPro may differ from the non-gaap financial measures used by other companies. A reconciliation of these measures to the most directly comparable U.S. GAAP measure is included in the Appendix to these slides. The trademarks included herein are the property of the owners thereof and are used for reference purposes only. Such use should not be construed as an endorsement of the products or services of GoPro.


3 GOPRO AT A GLANCE ESTABLISHED IN 2004 HQ IN SAN MATEO ~29M CAMERAS 1 IPO IN JUNE Revenue: $1.2 Billion Sales in >100 Countries; >30,000 Retail Locations 2 PLUS Subscription Service Had 130,000 Paying Subscribers Worldwide as of Jan Expanded Subscription Benefits of PLUS At the Same $4.99 Monthly Price in Jan Fusion, a Waterproof, Mountable 5.2K Spherical Camera, Shipped in Nov Released the Fusion Mobile OverCapture TM Editing Experience for ios devices in Jan Launched HERO6 Black, the Most Powerful and Convenient GoPro, in Sep HERO6 Black is Powered by GoPro s Custom-Designed GP1 Processor Launched QuikStories, a New GoPro App Feature that Automatically Pulls Footage from a HERO5 or HERO6 Camera and Creates a QuikStory on Your Smartphone, in Jul #1 Consumer Electronics Brand on Instagram 3 Best-Selling Camera in the U.S. for 16 Straight Quarters 4 1 Cumulative HERO cameras shipped from 2009 through Q As of 12/31/17 3 As ranked by Instagram followers, as of January Among Digital Image Cameras on a unit basis through Q4 2017, according to NPD

4 WE HELP THE WORLD SHARE ITSELF IN IMMERSIVE AND EXCITING WAYS 4


5 GOPRO ECOSYSTEM CAPTURE EDIT + SHARE CLOUD + ACCESS Versatile capture solutions. Tell your story in one tap. Auto cloud backup and access anytime, anywhere. 38M QUIK INSTALLS ~29M CAMERAS SOLD 130K PAYING SUBSCRIBERS SINCE LAUNCH


6 GOPRO MODEL: A VIRTUOUS CYCLE SHARED EXPERIENCES VIRAL AWARENESS + ADOPTION


7 ABOUT US what we WHAT makewe MAKE Versatile Storytelling Solutions WHAT what WE we DOdo Enable Immersive Sharing

8 THRIVING GLOBAL BRAND AND COMMUNITY GROWING FOLLOWERS HIGHLY ENGAGED FOLLOWERS 1 LIKES 1 SUBSCRIBERS 1 ~15MM ~11MM ~1MM ~8MM ~6MM ~9MM ~1MM ~4MM ~6MM MM Views of GoPro content on social media in % 35MM Increase in median organic viewership per video in 2017 ~80% CAGR ~25% YoY Growth ~15% CAGR ~5% YoY Growth ~40% CAGR ~30% YoY Growth 1 Social media numbers are as of Q4 of each respective year 2 Content published by GoPro
9 2018 PRIORITIES 1 Strengthen our analytics and understanding of customer behavior to enable better business planning Increase our investment in marketing to grow our brand and attract new customers globally Launch products that broaden GoPro s appeal at all price points, with greater emphasis on new customers Focus on our ecosystem of camera, app and cloud experiences Expand the value proposition of our subscription offerings to attract new customers and engage our global user base Attract, engage and retain top talent

10

11 INDUSTRY LEADING HARDWARE MSRP: $ MSRP: $ MSRP: $399.99


12 INDUSTRY LEADING HARDWARE HERO6 Bundle 1 : $ MSRP 1,2 : $ MSRP: $ AERIAL. HANDHELD. MOUNTABLE. MORE THAN A DRONE. 360-DEGREE SPHERICAL CAPTURE. 1 US MSRP 2 Camera sold separately


13 TECHNOLOGY INNOVATOR ROBOTICS + NEW CAMERA TYPES SPHERICAL + OVERCAPTURE APPS SEAMLESS ECOSYSTEM Enabling New Use Cases, Appealing To New Customers Next Gen Capture Leads To Next Gen Storytelling Mobile & Cloud Automated Storytelling TECHNOLOGY FOUNDATION Improved Capture & Storytelling GP1 CUSTOM PROCESSOR ADVANCED IMAGE SCIENCE COMPUTER VISION MACHINE LEARNING AERIAL SPHERICAL VIDEO MOBILE DEVELOPMENT ROBOTICS AUTOMATED STORYTELLING


14 PLUS SUBSCRIPTION SERVICE Launched Enhanced Experience At Same $4.99 Monthly Price in Jan Camera Replacement Auto Cloud Backup Share on the Go Unlimited Photo Storage 35 Hours of Video 20% Off Accessories VIP Support 14

15


16 MARKETING SOCIAL PRINT ADS GLOBAL RESORTS CHANNEL MARKETING GLOBAL TRADESHOWS OUTDOOR ATHLETES & SOCIAL INFLUENCERS TOP TIER EVENTS
17 STRONG GLOBAL NETWORK OF RETAIL DISTRIBUTION GLOBAL FOOTPRINT >30,000 RETAIL LOCATIONS; >100 COUNTRIES 1 BIG BOX RETAIL MID MARKET RETAIL SPECIALTY RETAIL ONLINE In Europe, GoPro held 69% and 44% of the Action Camera category by dollar and unit volume, respectively, in unit sales were up 28% YoY in China unit sales were up 96% YoY in Japan 2 GoPro sell-through in Japan has doubled every year since As of 12/31/17 2 According to GfK


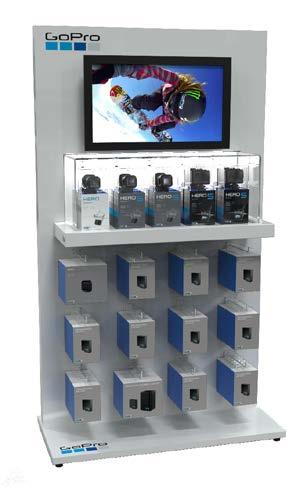

18 GLOBAL POINT OF PURCHASE POINT OF PURCHASE DISPLAYS GLOBALLY ~29K As of 12/31/17

19

20 REVENUE & UNITS SHIPPED REVENUE CAMERA UNITS SHIPPED $ in millions Units in millions Annual Quarterly Annual Quarterly $1, $1,394 $1,185 $1, $ $ Q16 4Q Q16 4Q17
21 QUARTERLY TRENDS QUARTERLY REVENUE QUARTERLY NON-GAAP GROSS MARGIN* $ in millions $541 42% 41% 40% 40% $437 30% 33% 32% 36% $297 $330 $335 25% $184 $221 $241 $219 4Q15 1Q16 2Q16 3Q16 4Q16 1Q17 2Q17 3Q17 4Q17 4Q15 1Q16 2Q16 3Q16 4Q16 1Q17 2Q17 3Q17 4Q17 * See reconciliation in Appendix.
22 QUARTERLY NON-GAAP INCOME STATEMENT SUMMARY ($ in millions, except per share data) Q Q Q Q Q Q Q Q Q Revenue $ $ $ $ $ $ $ $ $ Camera units shipped (in thousands) 1,361 1,144 1, ,284 1, ,002 Gross margin* 24.8% 40.1% 36.2% 32.3% 39.5% 40.6% 42.4% 33.0% 29.6% Operating expenses* $ $ $ $ $ $ $ $ $ Operating income (loss)* $ (37.4) $ 24.0 $ (9.3) $ (60.3) $ 31.6 $ (88.6) $ (89.3) $ (96.8) $ (21.6) Net income (loss)* $ (41.3) $ 21.1 $ (12.9) $ (62.8) $ 42.4 $ (84.3) $ (72.6) $ (86.7) $ (11.4) Diluted earnings (loss) per share* $ (0.30) $ 0.15 $ (0.09) $ (0.44) $ 0.29 $ (0.60) $ (0.52) $ (0.63) $ (0.08) Adjusted EBITDA* $ (26.5) $ 35.7 $ 5.1 $ (45.7) $ 44.3 $ (73.6) $ (76.8) $ (86.8) $ (9.3) Headcount 1,273 1,254 1,247 1,327 1,552 1,722 1,621 1,483 1,539 * Non-GAAP metric. See reconciliations in Appendix.
23 QUARTERLY REVENUE METRICS ($ in millions) Q Q Q Q Q Revenue by Channel: $ % of Rev $ % of Rev $ % of Rev $ % of Rev $ % of Rev Direct $ % $ % $ % $ % $ % Distribution Total Revenue $ % $ % $ % $ % $ % Revenue by Geography: $ % of Rev $ % of Rev $ % of Rev $ % of Rev $ % of Rev Americas $ % $ % $ % $ % $ % Europe Asia and Pacific Total Revenue $ % $ % $ % $ % $ %
24 SELECTED BALANCE SHEET METRICS ($ in millions) Q Q Q Q Q Q Q Q Q Cash, cash equivalents and marketable securities $ $ $ $ 74.9 $ $ $ $ $ Days sales outstanding Inventory $ $ $ $ $ $ $ 89.9 $ $ Annualized inventory turns 6.1x 5.2x 4.5x 3.2x 8.4x 4.9x 4.4x 3.0x 5.1x Inventory days

25
26 APPENDIX: GAAP TO NON-GAAP RECONCILIATIONS To supplement our unaudited selected financial data presented on a basis consistent with GAAP, we disclose certain non-gaap financial measures, including non-gaap gross margin, operating expenses, operating income (loss), net income (loss), diluted net income (loss) per share and adjusted EBITDA. We use these non-gaap financial measures to help us understand and evaluate our core operating performance and trends, to prepare and approve our annual budget, and to develop short-term and long-term operational plans. We believe that these measures provide useful information to investors and others in understanding and evaluating our operating results in the same manner as our management and board of directors. These non-gaap financial measures should not be considered in isolation from, or as an alternative to, the measures prepared in accordance with GAAP, and are not based on any comprehensive set of accounting rules or principles. We believe that these non-gaap measures, when read in conjunction with our GAAP financials, provide useful information to investors by facilitating: the comparability of our on-going operating results over the periods presented; the ability to identify trends in our underlying business; and the comparison of our operating results against analyst financial models and operating results of other public companies that supplement their GAAP results with non-gaap financial measures. These non-gaap financial measures have limitations in that they do not reflect all of the amounts associated with our results of operations as determined in accordance with GAAP. Some of these limitations are: adjusted EBITDA does not reflect tax payments that reduce cash available to us; adjusted EBITDA excludes depreciation and amortization and, although these are non-cash charges, the property and equipment being depreciated and amortized often will have to be replaced in the future, and adjusted EBITDA does not reflect any cash capital expenditure requirements for such replacements;
27 APPENDIX: GAAP TO NON-GAAP RECONCILIATIONS adjusted EBITDA excludes the amortization of POP display assets because it is a non-cash charge, and is treated similarly to depreciation of property and equipment and amortization of acquired intangible assets; adjusted EBITDA and non-gaap net income (loss) exclude the impairment of intangible assets because it is a non-cash charge that is inconsistent in amount and frequency; adjusted EBITDA and non-gaap net income (loss) exclude restructuring costs which primarily include severance-related costs, stock-based compensation expenses and facilities consolidation charges recorded in connection with restructuring actions announced in the first and fourth quarters of 2016 and the first quarter of These expenses do not reflect expected future operating expenses and do not contribute to a meaningful evaluation of current operating performance or comparisons to the operating performance in other periods; adjusted EBITDA and non-gaap net income (loss) exclude stock-based compensation expense related to equity awards granted primarily to our workforce. We exclude stock-based compensation expense because we believe that the non-gaap financial measures excluding this item provide meaningful supplemental information regarding operational performance. In particular, we note that companies calculate stock-based compensation expense for the variety of award types that they employ using different valuation methodologies and subjective assumptions. These non-cash charges are not factored into our internal evaluation of net income (loss) as we believe their inclusion would hinder our ability to assess core operational performance; non-gaap net income (loss) exclude acquisition-related costs including the amortization of acquired intangible assets (primarily consisting of acquired technology), the impairment of acquired intangible assets (if applicable), as well as third-party transaction costs incurred for legal and other professional services. These costs are not factored into our evaluation of potential acquisitions, or of our performance after completion of the acquisitions, because these costs are not related to our core operating performance or reflective of ongoing operating results in the period, and the frequency and amount of such costs are inconsistent and vary significantly based on the timing and magnitude of our acquisition transactions and the maturities of the businesses being acquired;
28 APPENDIX: GAAP TO NON-GAAP RECONCILIATIONS non-gaap net income (loss) exclude non-cash interest expense. In connection with issuance of the Convertible Senior Notes in April 2017, we are required to recognize non-cash interest expense in accordance with the authoritative accounting guidance for convertible debt that may be settled in cash; non-gaap net income (loss) include income tax adjustments. Beginning in the first quarter of 2017, we implemented a cash-based non-gaap tax expense approach (based upon expected annual cash payments for income taxes) for evaluating operating performance as well as for planning and forecasting purposes. This non-gaap tax approach eliminates the effects of period specific items, which can vary in size and frequency and does not necessarily reflect our long-term operations. Historically, we computed a non-gaap tax rate based on non-gaap pre-tax income on a quarterly basis, which considered the income tax effects of the adjustments above; and other companies may calculate these non-gaap financial measures differently than we do, limiting their usefulness as comparative measures.
29 APPENDIX: GAAP TO NON-GAAP RECONCILIATIONS ($ in thousands, except per share data) Q Q Q Q Q Q Q Q Q GAAP net income (loss) $ (55,848) $ 14,661 $ (30,536) $ (111,150) $ (115,709) $ (104,068) $ (91,767) $ (107,459) $ (34,451) Stock-based compensation: Cost of revenue Operating expenses 14,440 11,430 10,820 12,630 17,505 18,040 16,992 15,374 17,671 Total stock-based compensation 15,020 11,875 11,235 13,125 17,926 18,466 17,404 15,731 18,120 Acquisition-related costs: Cost of revenue 2,360 1,195 1,195 1,235 1, Operating expenses ,113 2,607 8,351 2,453 2,176 1,323 Total acquisition-related costs 2,360 2,141 2,142 2,348 3,700 8,573 2,675 2,398 1,545 Restructuring costs: Cost of revenue Operating expenses 3,328 1,937 2,331 12,062 36,448 6,144 Total restructuring costs 3,504 1,977 2,356 12,455 36,581 6,508 Non-cash interest expense 1,979 1,836 1,530 Income tax adjustments (8,334) (11,341) ,439 99,869 (7,250) (907) (3,918) 3,390 Non-GAAP net income (loss) $ (41,319) $ 21,149 $ (12,914) $ (62,783) $ 42,367 $ (84,279) $ (72,595) $ (86,740) $ (11,396) Weighted-average dilutive shares* 136, , , , , , , , ,086 Non-GAAP diluted net income (loss) per share $ (0.30) $ 0.15 $ (0.09) $ (0.44) $ 0.29 $ (0.60) $ (0.52) $ (0.63) $ (0.08) * For all periods presented, weighted-average dilutive shares utilized for computing non-gaap net income (loss) per share was equal to GAAP with the exception of Q Shares of million in Q included 5.2 million potentially dilutive common shares that would have been anti-dilutive for computing GAAP net loss per share.
30 APPENDIX: GAAP TO NON-GAAP RECONCILIATIONS ($ in thousands) Q Q Q Q Q Q Q Q Q GAAP gross margin 23.8% 39.6% 35.6% 31.4% 39.2% 40.3% 42.1% 32.5% 29.4% Stock-based compensation Acquisition-related costs Restructuring costs Non-GAAP gross margin 24.8% 40.1% 36.2% 32.3% 39.5% 40.6% 42.4% 33.0% 29.6% GAAP operating expenses $ 138,097 $ 122,497 $ 130,615 $ 156,781 $ 238,703 $ 212,658 $ 202,379 $ 181,149 $ 169,805 Stock-based compensation (14,440) (11,430) (10,820) (12,630) (17,505) (18,040) (16,992) (15,374) (17,671) Acquisition-related costs (946) (947) (1,113) (2,607) (8,351) (2,453) (2,176) (1,323) Restructuring costs (3,328) (1,937) (2,331) (12,062) (36,448) (6,144) Non-GAAP operating expenses $ 120,329 $ 108,184 $ 116,517 $ 130,976 $ 182,143 $ 186,267 $ 182,934 $ 157,455 $ 150,811 GAAP operating income (loss) $ (58,311) $ 8,049 $ (24,983) $ (88,215) $ (26,568) $ (115,589) $ (109,377) $ (121,435) $ (41,294) Stock-based compensation 15,020 11,875 11,235 13,125 17,926 18,466 17,404 15,731 18,120 Acquisition-related costs 2,360 2,141 2,142 2,348 3,700 8,573 2,675 2,398 1,545 Restructuring costs 3,504 1,977 2,356 12,455 36,581 6,508 Non-GAAP operating income (loss) $ (37,427) $ 24,042 $ (9,250) $ (60,287) $ 31,639 $ (88,550) $ (89,298) $ (96,798) $ (21,629)
31 APPENDIX: GAAP TO NON-GAAP RECONCILIATIONS ($ in thousands) Q Q Q Q Q Q Q Q Q GAAP net income (loss) $ (55,848) $ 14,661 $ (30,536) $ (111,150) $ (115,709) $ (104,068) $ (91,767) $ (107,459) $ (34,451) Income tax expense (benefit) (6,943) (10,844) 1,991 22,282 87,391 (12,329) (16,950) (14,283) (6,521) Interest (income) expense, net 4,163 4,228 3, , (334) (126) Depreciation and amortization 9,218 9,100 11,467 11,693 11,100 12,734 9,482 8,323 9,596 POP display amortization 4,342 4,728 4,955 5,165 4,944 4,979 4,957 4,743 4,114 Stock-based compensation 15,020 11,875 11,235 13,125 17,926 18,466 17,404 15,731 18,120 Impairment of intangible assets 1,088 6,000 Restructuring costs 3,504 1,977 2,356 12,455 36,581 6,508 Adjusted EBITDA $ (26,544) $ 35,725 $ 5,120 $ (45,669) $ 44,343 $ (73,622) $ (76,757) $ (86,771) $ (9,268)

32
SAFE HARBOR STATEMENT
 SAFE HARBOR STATEMENT This presentation may contain projections or other forward-looking statements within the meaning of Section 27A of the Securities Act of 1933, as amended, and Section 21E of the Securities
ESTABLISHED IN 2004 HQ IN SAN MATEO 26M+ CAMERAS 1 IPO IN JUNE 2014
 This presentation may contain projections or other forward-looking statements within the meaning of Section 27A of the Securities Act of 1933, as amended, and Section 21E of the Securities Exchange Act
SAFE HARBOR STATEMENT
 SAFE HARBOR STATEMENT This presentation may contain projections or other forward-looking statements within the meaning of Section 27A of the Securities Act of 1933, as amended, and Section 21E of the Securities
Q Preliminary Earnings Results Summary. February 1, 2018
 Q4 2017 Preliminary Earnings Results Summary February 1, 2018 SAFE HARBOR STATEMENT This presentation may contain projections or other forward-looking statements within the meaning Section 27A of the Private
Q Preliminary Earnings Results Summary May 3, 2018
 Q1 2018 Preliminary Earnings Results Summary May 3, 2018 SAFE HARBOR STATEMENT This presentation may contain projections or other forward-looking statements within the meaning Section 27A of the Private
Q Preliminary Earnings Results Summary. November 1, 2018
 Q3 2018 Preliminary Earnings Results Summary November 1, 2018 SAFE HARBOR STATEMENT This presentation may contain projections or other forward-looking statements within the meaning Section 27A of the Private
GoPro Announces Third Quarter 2017 Results
 NEWS RELEASE GoPro Announces Third Quarter Results 11/1/ Revenue Up 37% YoY; 40% Gross Margin GAAP & Non-GAAP Profitable in Q3 Launches HERO6 -- Available On-Shelf Globally Fusion Spherical Camera Shipping
GOPRO BY THE NUMBERS IPO IN JUNE ESTABLISHED IN HQ IN EMPLOYEES. >14mm capture devices sold; #1 camera/camcorder by $ share in U.S.
 These slides and the accompanying oral presentation contain projections or other forward-looking statements. All statements other than statements of historical fact contained in this presentation, including
GoPro Announces Third Quarter 2018 Results
 NEWS RELEASE GoPro Announces Third Quarter 2018 Results 11/1/2018 Revenue of $286 Million HERO7 Black Achieves Strongest Month-One Unit Sell-Through in Company History GoPro Plus Subscribers Grow 16% Sequentially
GoPro Announces Fourth Quarter and Full Year 2016 Results
 NEWS RELEASE GoPro Announces Fourth Quarter and Full Year Results 2/2/2017 SAN MATEO, Calif., Feb. 2, 2017 /PRNewswire/ -- Second Highest Revenue Quarter in Company History Record Quarterly Revenue for
GOPRO, INC. (Exact name of registrant as specified in its charter)
") UNITED STATES SECURITIES AND EXCHANGE COMMISSION Washington, D.C. 20549 FORM 8-K CURRENT REPORT PURSUANT TO SECTION 13 OR 15(D) OF THE SECURITIES EXCHANGE ACT OF 1934 Date of Report (Date of earliest event
UNITED STATES SECURITIES AND EXCHANGE COMMISSION Washington, D.C. 20549 FORM 8-K CURRENT REPORT PURSUANT TO SECTION 13 OR 15(D) OF THE SECURITIES EXCHANGE ACT OF 1934 Date of Report (Date of earliest event
UNITED STATES SECURITIES AND EXCHANGE COMMISSION Washington, D.C FORM 8-K
 UNITED STATES SECURITIES AND EXCHANGE COMMISSION Washington, D.C. 20549 FORM 8-K CURRENT REPORT PURSUANT TO SECTION 13 OR 15(D) OF THE SECURITIES EXCHANGE ACT OF 1934 Date of Report (Date of earliest event
Safe Harbor Statement
 May 2018 Safe Harbor Statement This presentation contains forward-looking statements, within the meaning of the Private Securities Litigation Reform Act of 1995, that involve risks and uncertainties, including
Fourth Quarter 2017 Earnings Presentation
 Fourth Quarter 2017 Earnings Presentation Safe Harbor Statement This document may contain certain forward-looking statements within the meaning of the Private Securities Litigation Reform Act of 1995.
WESTERN DIGITAL ANNOUNCES FINANCIAL RESULTS FOR FIRST QUARTER FISCAL YEAR 2019
 FOR IMMEDIATE RELEASE: WESTERN DIGITAL ANNOUNCES FINANCIAL RESULTS FOR FIRST QUARTER FISCAL YEAR 2019 SAN JOSE, Calif. OCT. 25, 2018 Western Digital Corp. (NASDAQ: WDC) today reported revenue of $5.0 billion
Q Earnings Conference Call
 Q3 2016 Earnings Conference Call October 26, 2016 Christopher North, President and CEO Mike Pope, CFO Safe Harbor Disclaimer This presentation contains "forward- looking" statements within the meaning
Fiscal Q Earnings
 Fiscal Q1-2019 Earnings October 25, 2018 2018 Western Digital Corporation or its affiliates. All rights reserved. Forward-Looking Statements Safe Harbor Disclaimers This presentation contains forward-looking
Q Earnings Conference Call
 Q4 2013 Earnings Conference Call FEBRUARY 5, 2014 Jeff Housenbold, CEO Brian Regan, CFO Safe Harbor Disclaimer This presentation contains "forward-looking" statements within the meaning of Section 27A
UNITED STATES SECURITIES AND EXCHANGE COMMISSION Washington, D.C
 UNITED STATES SECURITIES AND EXCHANGE COMMISSION Washington, D.C. 20549 FORM 8-K CURRENT REPORT PURSUANT TO SECTION 13 or 15(d) OF THE SECURITIES EXCHANGE ACT OF 1934 Date of report (Date of earliest event
Fitbit Reports $299M in Revenue, Sells 3M Devices in Q1 17, Reaffirms FY17 Guidance
 NEWS RELEASE Fitbit Reports $299M in Revenue, Sells 3M Devices in Q1 17, Reaffirms FY17 Guidance 5/3/ SAN FRANCISCO--(BUSINESS WIRE)-- Fitbit, Inc. (NYSE:FIT), the leader in connected health and fitness
Fitbit Reports $574M Q416 and $2.17B FY16 Revenue, Sells 6.5M devices in Q416 and 22.3M devices in FY16
 NEWS RELEASE Fitbit Reports $574M Q416 and $2.17B FY16 Revenue, Sells 6.5M devices in Q416 and 22.3M devices in FY16 2/22/2017 SAN FRANCISCO--(BUSINESS WIRE)-- Fitbit, Inc. (NYSE:FIT), the leader in the
WESTERN DIGITAL ANNOUNCES FINANCIAL RESULTS FOR SECOND QUARTER FISCAL YEAR 2019
 FOR IMMEDIATE RELEASE: WESTERN DIGITAL ANNOUNCES FINANCIAL RESULTS FOR SECOND QUARTER FISCAL YEAR 2019 SAN JOSE, Calif. January 24, 2019 Western Digital Corp. (NASDAQ: WDC) today reported revenue of $4.2
NetApp Q4 and Fiscal Year 2013 Earnings Results
 NetApp Q4 and Fiscal Year 2013 Earnings Results Supplemental Commentary May 21, 2013 This supplemental commentary is provided concurrently with our earnings press release to allow for additional time to
NASDAQ 38th Investor Conference
 NASDAQ 38th Investor Conference Mark Long Chief Financial Officer June 12, 2018 1 Forward-Looking Statements Safe Harbor Disclaimers This presentation contains forward-looking statements that involve risks
Shutterfly Announces Fourth Quarter and Full Year 2017 Financial Results
 Shutterfly Announces Fourth Quarter and Full Year 2017 Financial Results January 30, 2018 REDWOOD CITY, Calif.--(BUSINESS WIRE)--Jan. 30, 2018-- (NASDAQ:SFLY), the leading online retailer and manufacturer
Q3 17 EARNINGS DECK November 1, 2017
 Q3 17 EARNINGS DECK November 1, 2017 Safe Harbor Statement This presentation contains forward-looking statements, within the meaning of the Private Securities Litigation Reform Act of 1995, that involve
GOPRO, INC. (Exact name of registrant as specified in its charter)
") UNITED STATES SECURITIES AND EXCHANGE COMMISSION Washington, D.C. 20549 FORM 8-K CURRENT REPORT PURSUANT TO SECTION 13 OR 15(D) OF THE SECURITIES EXCHANGE ACT OF 1934 Date of Report (Date of earliest event
UNITED STATES SECURITIES AND EXCHANGE COMMISSION Washington, D.C. 20549 FORM 8-K CURRENT REPORT PURSUANT TO SECTION 13 OR 15(D) OF THE SECURITIES EXCHANGE ACT OF 1934 Date of Report (Date of earliest event
Q1 17 EARNINGS DECK May 3, 2017
 Q1 17 EARNINGS DECK May 3, 2017 Safe Harbor Statement This presentation contains forward-looking statements, within the meaning of the Private Securities Litigation Reform Act of 1995, that involve risks
4Q 2017 Highlights and Operating Results
 4Q 2017 Highlights and Operating Results January 30, 2018 1 4Q 2017 Highlights and Operating Results Table of Contents Page(s) 1 Sales Overview 4-8 2 Financial Performance Trends 9-16 3 Leverage Metrics
Q1 16 Results. April 2016
 Q1 16 Results April 2016 Safe harbor Safe Harbor statement under the Private Securities Litigation Reform Act of 1995: This presentation and the accompanying conference call contain forward-looking statements
Investor Overview Q Slides updated as of February 21, 2018
 Investor Overview Q4 2017 Slides updated as of February 21, 2018 Safe Harbor and Non-GAAP Financial Measures This presentation contains forward-looking statements within the meaning of federal securities
FOR IMMEDIATE RELEASE
 FOR IMMEDIATE RELEASE For media inquiries, contact: Eric Armstrong, Citrix Systems, Inc. (954) 267-2977 or eric.armstrong@citrix.com For investor inquiries, contact: Eduardo Fleites, Citrix Systems, Inc.
Q Earnings Conference Call
 Q3 207 Earnings Conference Call October 24, 207 Christopher North, President and CEO Mike Pope, CFO Safe Harbor Disclaimer This presentation contains "forward-looking" statements within the meaning of
CARS.COM. Third Quarter 2017 Earnings November 8, 2017
 CARS.COM Third Quarter 2017 Earnings November 8, 2017 Forward Looking Statements This presentation contains forward looking statements within the meaning of the federal securities laws, including those
Q Earnings Results
 2015 Earnings Results 1 Safe Harbor Forward-Looking Statements This presentation contains forward-looking statements, within the meaning of the safe harbor provisions of the Private Securities Litigation
BLACKBERRY INVESTOR PRESENTATION
 BLACKBERRY INVESTOR PRESENTATION Q2 FY 19 BlackBerry Public investorinfo@blackberry.com SAFE HARBOR STATEMENT Forward-looking statements in this presentation are made pursuant to the "safe harbor" provisions
Bottomline Technologies Reconciliation to Non GAAP Measures Three Months Ended June 30, 2013
 Reconciliation to Measures Three Months Ended June 30, 2013 Non Cash Amortization of Equity Based Integration Restructuring Interest GAAP Intangible Assets Compensation Related Expenses Expenses Expense
Cautionary Statement Regarding Forward-Looking Statements
 January 2018 Cautionary Statement Regarding Forward-Looking Statements Forward Looking Statements: Certain statements are forward-looking statements made pursuant to the safe harbor provisions of the Private
Second Quarter of Fiscal 2019 Earnings Presentation
 Second Quarter of Fiscal 2019 Earnings Presentation January 24, 2019 2019 Western Digital Corporation or its affiliates. All rights reserved. Forward-Looking Statements Safe Harbor Disclaimers This presentation
2018 SECOND QUARTER FINANCIAL RESULTS
 2018 SECOND QUARTER FINANCIAL RESULTS July 30, 2018 0 SAFE HARBOR STATEMENT The 2018 second quarter news release, conference call webcast, and the following slides contain forward-looking statements. The
Investors Presentation
 Investors Presentation (Based on Third Quarter 2014 Results) November 5, 2014 Safe Harbor for Forward-Looking Statements Certain statements in this presentation are forward-looking statements within the
Third Quarter 2018 Earnings Presentation
 Third Quarter 2018 Earnings Presentation 1 Safe Harbor Statement This document may contain certain forward-looking statements within the meaning of the Private Securities Litigation Reform Act of 1995.
UNITED STATES SECURITIES AND EXCHANGE COMMISSION Washington, D.C FORM 8-K
 UNITED STATES SECURITIES AND EXCHANGE COMMISSION Washington, D.C. 20549 FORM 8-K CURRENT REPORT Pursuant to Section 13 or 15(d) of the Securities Exchange Act of 1934 Date of Report (Date of Earliest Event
Q Earnings Conference Call
 Q2 2015 Earnings Conference Call July 29, 2015 Jeff Housenbold, CEO Brian Regan, CFO Safe Harbor Disclaimer This presentation contains "forward-looking" statements within the meaning of Section 27A of
4Q 2018 Highlights and Operating Results. Products. Technology. Services. Delivered Globally.
 4Q 2018 Highlights and Operating Results Products. Technology. Services. Delivered Globally. Table of Contents Page 3 Safe Harbor Statement and Non-GAAP Financial Measures 4 Sales Overview 9 Overview of
Salesforce Announces Record Second Quarter Fiscal 2019 Results Raises FY19 Revenue Guidance to $ Billion to $ Billion
 John Cummings Salesforce Investor Relations 415-778-4188 jcummings@salesforce.com Gina Sheibley Salesforce Public Relations 917-297-8988 gsheibley@salesforce.com Salesforce Announces Record Second Quarter
F O U R T H Q U A R T E R R E S U L T S February 13, 2019
 F O U R T H Q U A R T E R 2 0 1 8 R E S U L T S February 13, 2019 Safe Harbor for Forward-Looking Statements Certain statements in this presentation are forward-looking statements within the meaning of
Under Armour Reports First Quarter Results
 May 1, 2018 Under Armour Reports First Quarter Results First Quarter Revenue up 6 Percent; Company Reiterates Full Year 2018 Outlook BALTIMORE, May 1, 2018 /PRNewswire/ -- Under Armour, Inc. (NYSE: UA,
Company Profile & Update June 2017
 Company Profile & Update June 2017 Safe Harbor Statement This presentation contains forward-looking statements, within the meaning of the Private Securities Litigation Reform Act of 1995, that involve
Wix Reports Strong Third Quarter 2016 Results, Exceeding Expectations Leading to Significant Increase in Full Year Outlook
 Wix Reports Strong Third Quarter 2016 Results, Exceeding Expectations Leading to Significant Increase in Full Year Outlook Exceeded High End of Guidance Range with Strong Top-Line Growth and Record Adjusted
SanDisk Corporation Preliminary Condensed Consolidated Statements of Operations (in thousands, except per share amounts, unaudited)
") Preliminary Condensed Consolidated Statements of Operations (in thousands, except per share amounts, unaudited) Revenue $ 1,332,241 $ 1,511,945 Cost of revenue 762,483 741,039 Amortization of acquisition-related
Preliminary Condensed Consolidated Statements of Operations (in thousands, except per share amounts, unaudited) Revenue $ 1,332,241 $ 1,511,945 Cost of revenue 762,483 741,039 Amortization of acquisition-related
2Q 2017 Highlights and Operating Results
 2Q 2017 Highlights and Operating Results July 25, 2017 1 2Q 2017 Highlights and Operating Results Table of Contents Page(s) 1 Sales Overview and Highlights 4-5 2 NSS Overview 6-7 3 EES Overview 8-9 4 UPS
MobileIron Announces Fiscal Second Quarter 2016 Results
 NEWS RELEASE MobileIron Announces Fiscal Second Quarter 2016 Results 7/28/2016 Surpassed 10 Million Cumulative Seats and 12,000 Cumulative Customers Who Have Purchased Our Platform Since 2009 MOUNTAIN
Q Earnings Conference Call
 Q4 2015 Earnings Conference Call February 3, 2016 Jeff Housenbold, CEO Phil Marineau, Chairman Mike Pope, CFO Safe Harbor Disclaimer This presentation contains "forward-looking" statements within the meaning
Q2 13 FINANCIAL HIGHLIGHTS
 Q2 13 FINANCIAL HIGHLIGHTS 7.16.2013 1 This presentation contains forward-looking statements concerning Yahoo! s expected financial performance and Yahoo! s strategic and operational plans. Risks and uncertainties
Financial Results for Q January 25, 2018
 Financial Results for Q4 2017 January 25, 2018 SAFE HARBOR This presentation contains forward-looking statements regarding Teradyne s future business prospects, results of operations, market conditions,
Investors Presentation. Third Quarter 2015 Results November 3, 2015
 Investors Presentation Third Quarter 2015 Results November 3, 2015 Safe Harbor for Forward-Looking Statements Certain statements in this presentation are forward-looking statements within the meaning of
Salesforce Announces Record Third Quarter Fiscal 2019 Results
 John Cummings Salesforce Investor Relations 415-778-4188 jcummings@salesforce.com Gina Sheibley Salesforce Public Relations 917-297-8988 gsheibley@salesforce.com Salesforce Announces Record Third Quarter
Q Earnings Conference Call
 Q3 2015 Earnings Conference Call October 27, 2015 Jeff Housenbold, CEO Brian Regan, CFO Safe Harbor Disclaimer This presentation contains "forward-looking" statements within the meaning of Section 27A
Driving Profitable Growth
 Driving Profitable Growth Frank Calderoni EVP and Chief Financial Officer December 7, 2012 Forward-Looking Statements This presentation contains projections and other forward-looking statements regarding
Q Financial Results
 Q1 2018 Financial Results May 3, 2018 Copyright Fortinet Inc. All rights reserved. Safe Harbor Statement Information, statements and projections contained in these presentation slides and related conference
Shutterfly Announces Second Quarter 2017 Financial Results
 July 25, 2017 Shutterfly Announces Second Quarter 2017 Financial Results REDWOOD CITY, Calif.--(BUSINESS WIRE)-- (NASDAQ:SFLY), the leading online retailer and manufacturer of high-quality personalized
Xilinx Reports Record Revenues And EPS In Fiscal Third Quarter
 Xilinx Reports Record Revenues And EPS In Fiscal Third Quarter January 23, 2019 Revenue growth of 34% year over year driven by strength across all primary end markets SAN JOSE, Calif., Jan. 23, 2019 /PRNewswire/
UNITED STATES SECURITIES AND EXCHANGE COMMISSION Washington, D.C
 UNITED STATES SECURITIES AND EXCHANGE COMMISSION Washington, D.C. 20549 FORM 8-K CURRENT REPORT PURSUANT TO SECTION 13 or 15(d) OF THE SECURITIES EXCHANGE ACT OF 1934 Date of report (Date of earliest event
Revenue $144M $134M $119M $110M $102M $89M $76M $71M $61M $55M $46M $150 $125 $100 $50 $25
 Revenue ($M) $150 $134M $144M $125 $100 $89M $102M $110M $119M $75 $50 $46M $55M $61M $71M $76M $25 $0 Q1'13 Q2'13 Q3'13 Q4'13 Q1'14 Q2'14 Q3'14 Q4'14 Q1'15 Q2'15 Q3'15 1 Adj. EBITDA ($M) Adjusted EBITDA
Salesforce delivered the following results for its fiscal fourth quarter and full fiscal year 2018:
 Exhibit 99.1 John Cummings Salesforce Investor Relations 415-778-4188 jcummings@salesforce.com Gina Sheibley Salesforce Public Relations 917-297-8988 gsheibley@salesforce.com Salesforce Announces Record
One Fix at a Time, One Client at a Time
 One Fix at a Time, One Client at a Time To illustrate the client and stylist interactions during a Fix order, we ve included an example below. 1. Rebecca ordered Fixes on-demand before becoming a Style
ORACLE CORPORATION. Q4 FISCAL 2013 FINANCIAL RESULTS CONDENSED CONSOLIDATED STATEMENTS OF OPERATIONS ($ in millions, except per share data)
") Q4 FISCAL 2013 FINANCIAL RESULTS CONDENSED CONSOLIDATED STATEMENTS OF OPERATIONS ( in millions, except per share data) REVENUES Software Revenues Hardware systems support Hardware Systems Revenues Services
Q4 FISCAL 2013 FINANCIAL RESULTS CONDENSED CONSOLIDATED STATEMENTS OF OPERATIONS ( in millions, except per share data) REVENUES Software Revenues Hardware systems support Hardware Systems Revenues Services
Netshoes Limited Reports First Quarter 2017 Results
 Netshoes Limited Reports First Quarter 2017 Results Gross Merchandise Volume increased 20.6%, or 25.2% on an FX neutral basis, to R$531.2 million, compared to 1Q-2016 Margin improvements reflect operating
Third Quarter 2018 Results November 8, 2018
 Third Quarter 2018 Results November 8, 2018 Safe Harbor Caution Regarding Forward Looking Statements This presentation any other oral or written statements made by us or on our behalf may include forward-looking
The Platform for the Connected Home and Business March 2018
 The Platform for the Connected Home and Business March 2018 1 Safe harbor statement Forward-Looking Statements This presentation contains forward-looking statements that involve risks and uncertainties.
Trimble Reports First Quarter Revenue of $289.0 Million and Non-GAAP Earnings Per Share of $0.28
 Trimble Reports First Quarter Revenue of $289.0 Million and Non-GAAP Earnings Per Share of $0.28 SUNNYVALE, Calif., April 28, 2009 /PRNewswire-FirstCall via COMTEX News Network/ -- Trimble (Nasdaq: TRMB)
ebay Inc. Reports Strong Second Quarter 2012 Results
 1 sur 16 19/07/2012 09:55 Share Print Download Reports Strong Second Quarter 2012 Results Revenue and Net Income up Double Digits Year Over Year; Marketplaces Business Delivers Strongest Growth Since 2006
CADENCE REPORTS FOURTH QUARTER AND FISCAL YEAR 2017
 CADENCE REPORTS FOURTH QUARTER AND FISCAL YEAR 2017 CADENCE DESIGN SYSTEMS, INC. CFO COMMENTARY January 31, 2018 Q4 2017 Key Takeaways Strong, consistent financial results for Q4 with key metrics meeting
FOR IMMEDIATE RELEASE
 FOR IMMEDIATE RELEASE For media inquiries, contact: Eric Armstrong, Citrix Systems, Inc. (954) 267-2977 or eric.armstrong@citrix.com For investor inquiries, contact: Eduardo Fleites, Citrix Systems, Inc.
UNITED STATES SECURITIES AND EXCHANGE COMMISSION Washington, D.C
 UNITED STATES SECURITIES AND EXCHANGE COMMISSION Washington, D.C. 20549 FORM 8-K CURRENT REPORT PURSUANT TO SECTION 13 or 15(d) OF THE SECURITIES EXCHANGE ACT OF 1934 Date of report (Date of earliest event
Q Results. May 2017
 Q1 2017 Results May 2017 Forward-Looking Statements. Our presentation today, including the slides contained herein, contains "forwardlooking statements" within the meaning of the Private Securities Litigation
Q Financial Results
 Q4 2018 Financial Results February 6, 2019 Copyright Fortinet Inc. All rights reserved. 1 Safe Harbor Statement Information, statements and projections contained in these presentation slides and related
HP Reports Second Quarter 2003 Results
 HP Reports Second Quarter 2003 Results Non-GAAP EPS $0.29, $0.02 Higher Than Analyst Consensus Estimates; GAAP EPS $0.22 Revenue of $18.0 Billion, Up 1% Sequentially Enterprise Systems Grows Sequentially,
Shutterfly Announces Third Quarter 2018 Financial Results
 Shutterfly Announces Third Quarter Financial Results October 30, REDWOOD CITY, Calif.--(BUSINESS WIRE)--Oct. 30, -- (NASDAQ:SFLY), the leading retailer and manufacturing platform dedicated to helping capture,
Salesforce Announces Record First Quarter Fiscal 2019 Results Raises FY19 Revenue Guidance to $ Billion to $ Billion
 John Cummings Salesforce Investor Relations 415-778-4188 jcummings@salesforce.com Gina Sheibley Salesforce Public Relations 917-297-8988 gsheibley@salesforce.com Salesforce Announces Record First Quarter
Progress Reports 2018 Third Quarter Results, Announces 11% Dividend Increase
 Progress Reports Third Quarter Results, Announces 11% Dividend Increase September 27, Solid Revenue and EPS Performance, Generates Strong Cash Flows BEDFORD, Mass.--(BUSINESS WIRE)--Sep. 27, -- Progress
ELECTRONIC ARTS REPORTS Q4 FY16 AND FULL YEAR FY16 FINANCIAL RESULTS
 ELECTRONIC ARTS REPORTS Q4 FY16 AND FULL YEAR FY16 FINANCIAL RESULTS Record Fiscal Year Non-GAAP Net Revenue, Digital Net Revenue, Gross Margin, Operating Margin, EPS and Operating Cash Flow Completed
PayPal Reports Second Quarter 2017 Results and Raises Financial Guidance for Full Year
 PayPal Reports Second Quarter 2017 Results and Raises Financial Guidance for Full Year Revenue increased 18% to $3.136 billion, 20% FX-neutral revenue growth GAAP EPS increased 27% to $0.34, non-gaap EPS
Q Earnings. GAAP to Non-GAAP Reconciliation
 Q1 2012 Earnings GAAP to Non-GAAP Reconciliation This presentation contains forward-looking statements relating to, among other things, our outlook for full year 2012 bookings, adjusted EBITDA, stock-based
Trimble First Quarter 2008 Revenue Up 24 Percent to $355.3 million
 Trimble First Quarter 2008 Revenue Up 24 Percent to $355.3 million GAAP Earnings Per Share $0.32; Non-GAAP Earnings Per Share $0.40 SUNNYVALE, Calif., April 24, 2008 /PRNewswire-FirstCall via COMTEX News
F O U R T H Q U A R T E R R E S U L T S February 6, 2018
 F O U R T H Q U A R T E R 2 0 1 7 R E S U L T S February 6, 2018 Safe Harbor for Forward-Looking Statements Certain statements in this presentation are forward-looking statements within the meaning of
Amkor Technology, Inc. Financial Information. February 2018
 Amkor Technology, Inc. Financial Information February 2018 1 Disclaimer Forward-Looking Statement Disclaimer All information and other statements contained in this presentation, other than statements of
Cars.com. Second Quarter 2018 Earnings. August 8, 2018
 Cars.com Second Quarter 2018 Earnings August 8, 2018 Forward-Looking Statements This presentation contains forward-looking statements within the meaning of the federal securities laws. All statements other
Q Earnings Conference Call
 Q2 207 Earnings Conference Call July 25, 207 Christopher North, President and CEO Mike Pope, CFO Safe Harbor Disclaimer This presentation contains "forward-looking" statements within the meaning of Section
ELECTRONIC ARTS REPORTS Q3 FY15 FINANCIAL RESULTS
 ELECTRONIC ARTS REPORTS Q3 FY15 FINANCIAL RESULTS Q3 Net Revenue and EPS Results Exceed Guidance Fiscal Year 2015 Net Revenue and EPS Guidance Raised Achieved Record Cash Flow for a Calendar Year Period
Media Contact: Jennifer Saxon Exhibit MINDBODY Reports First Quarter 2018 Financial Results
 Contact: Investor Relations: Nicole Gunderson IR@mindbodyonline.com 888-782-7155 Media Contact: Jennifer Saxon jennifer.saxon@mindbodyonline.com 805-419-2839 Exhibit 99.1 MINDBODY Reports First Quarter
Quality Systems, Inc. Reports Fiscal 2019 First Quarter Results
 Quality Systems, Inc. Reports Fiscal 2019 First Quarter Results July 31, 2018 IRVINE, Calif.--(BUSINESS WIRE)--Jul. 31, 2018-- Quality Systems, Inc. (QSII), known to its clients as NextGen Healthcare,
CSG SYSTEMS INTERNATIONAL, INC. DISCLOSURES FOR NON-GAAP FINANCIAL MEASURES
 CSG SYSTEMS INTERNATIONAL, INC. DISCLOSURES FOR NON-GAAP FINANCIAL MEASURES Use of Non-GAAP Financial Measures and Limitations To supplement its condensed consolidated financial statements presented in
Q4 FY18 Financial Update
 Q4 FY8 Financial Update Salesforce NYSE: CRM @Salesforce_ir Safe Harbor "Safe harbor" statement under the Private Securities Litigation Reform Act of 995: This presentation contains forward-looking statements
Intermolecular Announces Third Quarter 2017 Financial Results
 Intermolecular Announces Third Quarter 2017 Financial Results SAN JOSE, Calif., November 2, 2017 -- Intermolecular, Inc. (NASDAQ: IMI) today reported results for its Third Quarter ended September 30, 2017.
News Release. Investor Relations: Amy Glynn/Yaeni Kim, /5391 Media Relations: Anne Taylor Adams,
 News Release Investor Relations: Amy Glynn/Yaeni Kim, +1 646 654 4931/5391 Media Relations: Anne Taylor Adams, +1 646 654 5759 NIELSEN REPORTS 3 rd QUARTER 2016 RESULTS New York, USA October 25, 2016 Nielsen
THIRD QUARTER 2018 RESULTS November 6, 2018
 THIRD QUARTER 2018 RESULTS November 6, 2018 Safe Harbor for Forward-Looking Statements Certain statements in this presentation are forward-looking statements within the meaning of the Private Securities
Q Financial Results
 Q3 2018 Financial Results November 1, 2018 Copyright Fortinet Inc. All rights reserved. 1 Safe Harbor Statement Information, statements and projections contained in these presentation slides and related