Investor Overview Q Slides updated as of February 21, 2018
|
|
|
- Baldric Carr
- 6 years ago
- Views:
Transcription


1 Investor Overview Q Slides updated as of February 21, 2018
2 Safe Harbor and Non-GAAP Financial Measures This presentation contains forward-looking statements within the meaning of federal securities laws, which are based on our management s beliefs and assumptions and on information currently available to management. Forward-looking statements include all statements that are not historical facts and, in some cases, can be identified by terms such as may, will, should, might, expects, plans, anticipates, could, intends, target, projects, contemplates, believes, estimates, predicts, potential, or continue or the negative of these words or other similar terms or expressions that concern our expectations, strategy, plans or intentions. Forward-looking statements contained in this presentation include, but are not limited to, statements concerning our future financial and operational performance; the impact of the network effects of our marketplace; our business and growth strategy; and our ability to effectively manage our growth and future expenses. Forward-looking statements involve known and unknown risks, uncertainties and other factors that may cause our actual results, performance, or achievements to be materially different from any future results, performance or achievements expressed or implied by the forward-looking statements. You should not rely upon forward-looking statements as predictions of future events. The known risks and uncertainties are discussed under the caption Risk Factors and elsewhere in our most recent Annual Report on Form 10-K, our subsequent Quarterly Reports on Form 10-Q, and will be discussed in other filings that we make with the SEC from time to time. We operate in a very competitive and rapidly changing environment. New risks and uncertainties emerge from time to time, and it is not possible for us to predict all risks and uncertainties that could have an impact on the forward-looking statements contained in this presentation. Forward-looking statements represent our management s beliefs and assumptions only as of the date of this presentation. Except as required by law we assume no obligation to update these forward-looking statements publicly, or to update the reasons why actual results could differ materially from those anticipated in the forward-looking statements, even if new information becomes available in the future. You should read the documents that we have filed and may file from time to time with the SEC for more complete information about MINDBODY. You may get these documents for free by visiting EDGAR on the SEC website at or by visiting the SEC Filings section of the Investor Relations page of our website at investors.mindbodyonline.com. This presentation includes certain non-gaap financial measures as defined by the SEC rules. These non-gaap financial measures are in addition to, and not as a substitute for or superior to measures of financial performance prepared in accordance with U.S. GAAP. There are a number of limitations related to the use of these non-gaap financial measures versus their nearest GAAP equivalents. For example, other companies may calculate non-gaap financial measures differently or may use other measures to evaluate their performance, all of which could reduce the usefulness of our non-gaap financial measures as tools for comparison. As required by Regulation G, we have provided a reconciliation of those measures to the most directly comparable GAAP measures, which is available in the appendix. Note: All fourth quarter 2017 figures on the accompanying slides are unaudited. 2

3 Helping People Lead Healthier, Happier Lives by Connecting the World to Wellness
4 MINDBODY Highlights Leading SaaS Platform for Large and Growing Global Wellness Services Industry Loyal Customer Base Delivers Strong Unit Economics and Predictable Revenue Growth Powerful Consumer Marketplace Drives Customer Success Multi-billion Dollar Integrated Payments Platform Powerful Network Effects Create Sustainable Competitive Advantage Strong Management Team and Exceptional Company Culture 4
5 Our Strategy A company and brand people love Rapidly growing transaction-enabled marketplace Essential for businesses and consumers Ecosystem of choice for partners and competitors 5

6 We are a Platform For Consumers 8.3MM Registered App Users* For Businesses 59,000 Businesses 373,000 Practitioners 41MM Consumers 600MM Class and Appointment Bookings** in 2017 For Partners 750+ Registered API Integrations * Registered app users refer to the total number of registered consumer users of the MINDBODY app and branded apps as of December 31, ** Bookings refers to the action of reserving a spot in a class or an appointment time with a business. All data is presented as rounded numbers and is as of December 31,


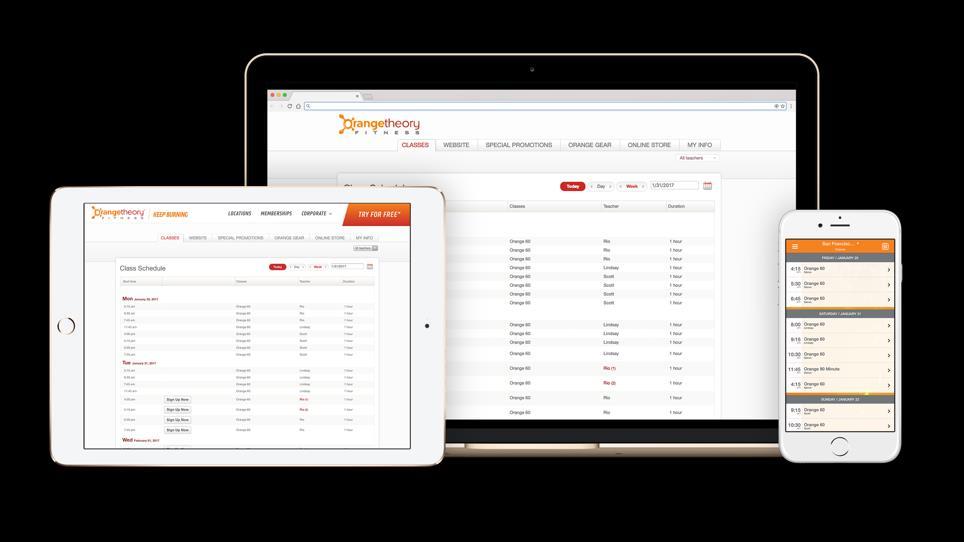


7 Our Foundation: Integrated Cloud Software & Payments Platform Online Booking Staff Management CRM Point of Sale Payments Marketing Tools Scheduling Analytics 7

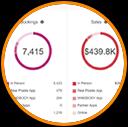
8 Integrated Payments Key to Value Proposition Point of Sale Purchases Recurring Memberships Web and Mobile Sales MINDBODY App Promotional Sales Network Partner Sales $7.9Bn Integrated Payments Volume 23% YoY Growth Note: Payments volume data for last twelve months ended December 31, 2017.
9 Tiered Software Packages Fuel Customer Success Essential Accelerate Ultimate Get the features you need to manage schedules, sell products and services, and streamline tasks. Expand your reach and increase engagement with advanced retention and marketing tools. Elevate your brand with custom mobile apps, extensive analytics and enterprise-grade features. $125/mo* $195/mo* $395/mo* *U.S. Prices 9


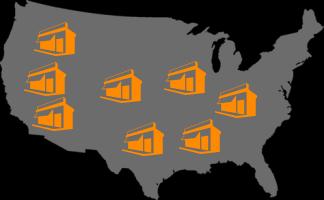
10 Scalable from Local Businesses to Large Enterprises Large Enterprises National Chains Local Businesses 10


11 Leveraging Neighborhood Network Effects Boutique Fitness Integrative Health Salon & Spa Union & Polk Streets San Francisco 11


12 MINDBODY Network Growing marketing platform promotes wellness businesses to consumers 4.9MM class and appointment sessions available each day* more than half go unsold *Average available inventory per day in Q


13 The MINDBODY App Featuring Intro Offers and Dynamic Pricing Intro Offers Dynamic Pricing Expanding our Consumer Reach & Driving Engagement 13


14 Flourishing Platform Partner Ecosystem 750+ REGISTERED API INTEGRATIONS bowtie.ai Former Platform Partners Acquired: February 2018 March 2017 September 2016 February


15 Performance tracking solutions drive consumer engagement and member retention 15


16 Transaction-enabled Marketplace Provides Multiple Growth Opportunities Promote Customer Inventory Grow High Value Customer base Broaden Payments Platform Deepen Customer Relationships Increase Consumer Adoption Refer to Form 10-K for customer and consumer definitions. 16


17 Our Clients Share Our Values Committed & Purpose Driven Humble & Helpful Caring & Happy Seeking Wellness: Mind, Body & Spirit v Environmentally Conscious Practicing Five C Leadership Continuously Evolving 17
18 Financial Highlights Strong Revenue Growth and Margin Expansion Recurring Subscription, Services and Payments Revenue Model Compelling Unit Economics Strong Dollar-Based Net Expansion Rates 18
19 High Visibility Revenue Model % of Q4 17 Revenue Multiple Pricing Packages (Monthly Subscription) Subscription & Services Branded Mobile Apps Platform Partners (Monthly Subscription) (Revenue Share / Transaction Fees) 60% Promoted Offers (Transaction-Based) Payments Recognized Net of Processing Fees Reflects Business to Consumer Engagement Recurring Relationships Drive Predictability 38% 19
20 Q4 17 Financial Highlights Total Revenue Payments Volume ARPS 1 Dollar-based Net Expansion 2 30% growth 23% growth 31% growth $38.2 MM $49.7 MM $1.7Bn $2.1Bn $212 $ % 107% Q vs Q ARPS (average monthly revenue per subscriber) is calculated by dividing the subscription and services and payments revenue generated in a given month by the number of subscribers at the end of the previous month. For periods greater than one month, ARPS is the sum of the average monthly revenue per subscriber for each month in the referenced time period, divided by the number of months in the period. 2 Dollar-based net expansion rate is measured at the end of the period. Dollar-based net expansion nets the effects of subscriber churn against the increasing value of subscribers retained, indicating the tendency of subscriber cohorts to gain value over time. 20
21 Consistently Strong Revenue Growth Annual ($MM) Quarterly ($MM) 30% YoY $49 $70 $101 $139 $183 $20 $18 $16 $17 $22 $25 $26 $28 $35 $34 $32 $38 $42 $44 $47 $50 $ YoY Growth 52% 44% 45% 37% 31% 21
22 Significant Payments Volume Expansion Annual ($Bn) Quarterly ($Bn) 23% YoY $7.9 $6.5 $2.1 $3.1 $4.1 $5.1 $1.0 $1.0 $1.0 $1.1 $1.2 $25 $2.1 $2.0 $1.9 $1.9 $1.7 $1.6 $1.6 $1.5 $1.3 $ YoY Growth 47% 33% 23% 28% 23% 22
23 Increasing Average Monthly Revenue Per Subscriber $278 $259 $244 $230 $201 $202 $204 $212 $154 $151 $152 $163 $174 $185 $182 $185 Q1'14 Q2'14 Q3'14 Q4'14 Q1'15 Q2'15 Q3'15 Q4'15 Q1'16 Q2'16 Q3'16 Q4'16 Q1'17 Q2'17 Q3'17 Q4'17 23
24 Strong Practitioner and Inventory Growth Number of Practitioners 1 (end of period in thousands) Q4'12 Q4'13 Q4'14 Q4'15 Q4'16 Q4'17 Available Inventory 2 per day (average of quarter in millions) 1 Practitioners are defined as the number of staff members/instructors/trainers/stylists with one or more bookings on the MINDBODY platform in the last month of the period. 2 Inventory is defined as the class and appointment spots available for booking within the MINDBODY platform (via online booking website or app, or in person with the business) in the period. 24
25 Subscriber Mix Shift Delivers Increasing Platform Value High Value Subscribers (in thousands) 600 Solo (Single Practitioners) (in thousands) 485 Total Bookings (in millions) Number of Subscribers on-board at period end (in thousands) 25
26 Innovative Mobile Apps Driving Strong Consumer Adoption Q1 '16 Q1 '16 Q1 '16 Q1 '16 Q1 '16 Q1 '16 Q1 '16 Q1 '16 Q1 '16 Q1 '16 Q1 '16 Q1 '16 Q1'16 Q2'16 Q3'16 Q4'16 Q1'17 Q2'17 Q1 '16 Q1 '16 Q3 17 Q1 '16 Q4 17 Consumer app bookings (in millions) MB App Branded Mobile Apps 26
27 Long-Term Financial Model Non-GAAP FY'14 FY 15 Q1'16 Q2'16 Q3'16 Q4 16 Q1 17 Q2'17 Q3'17 Q4 17 Long-Term Model Gross Margin 58% 64% 70% 69% 70% 71% 73% 73% 73% 74% 80% - 85% S&M as % of Revenue 44% 42% 40% 40% 40% 38% 37% 38% 38% 38% 30% - 35% R&D as % of Revenue 23% 22% 22% 21% 21% 18% 19% 18% 17% 16% 12% - 15% G&A as % of Revenue 25% 26% 22% 19% 18% 18% 18% 18% 17% 16% 8% - 10% Adjusted EBITDA Margin (27%) (20%) (7%) (6%) (3%) 2% 3% 4% 5% 7% ~30% Note: A reconciliation of non-gaap measures to GAAP measures is contained in the Appendix. For future periods, we are unable to provide a reconciliation of non-gaap financial measures without unreasonable effort as a result of the uncertainty regarding, and the potential variability of, stock-based compensation, and certain other infrequently occurring items, such as acquisition related costs, that may be incurred in the future. 27
28 Appendix 28
29 Reconciliation of Non-GAAP Figures Year Ended Three Months Ended Dec. 31, March 31, June 30, Sept. 30, Dec. 31, (in thousands) Total Revenue $70,010 $101,369 $139,021 $182,626 $32,006 $42,214 $33,561 $44,107 $35,262 $46,612 $38,191 $49,693 Gross profit, as reported $40,006 $64,179 $95,941 $130,756 $22,034 $30,195 $22,848 $31,369 $24,290 $33,489 $26,768 $35,703 Gross Margin, GAAP 57% 63% 69% 72% 69% 72% 68% 71% 69% 72% 70% 72% Plus: Amortization of acquired intangible assets , Plus: Stock-based compensation , Gross Profit, non-gaap $40,565 $65,167 $97,277 $133,491 $22,325 $30,630 $23,144 $32,142 $24,630 $34,186 $27,177 $36,533 Gross Margin, non-gaap 58% 64% 70% 73% 70% 73% 69% 73% 70% 73% 71% 74% Sales and marketing, as reported $30,922 $46,345 $56,460 $71,825 $13,229 $16,334 $13,706 $17,362 $14,599 $18,514 $14,926 $19,615 As percentage of revenue, GAAP 44% 46% 41% 39% 41% 39% 41% 39% 41% 40% 39% 39% Less: Stock-based compensation 196 3,533 2,059 2, Sales and marketing, non-gaap $30,726 $42,812 $54,401 $68,953 $12,646 $15,828 $13,266 $16,691 $13,986 $17,678 $14,503 $18,756 As percentage of revenue, non-gaap 44% 42% 39% 38% 40% 37% 40% 38% 40% 38% 38% 38% Research and development, as reported $16,167 $23,057 $30,316 $35,810 $7,417 $8,648 $7,594 $8,802 $7,747 $8,976 $7,558 $9,384 As percentage of revenue, GAAP 23% 23% 22% 20% 23% 20% 23% 20% 22% 19% 20% 19% Less: Stock-based compensation ,971 3, , ,190 Research and development, non-gaap $15,869 $22,155 $28,345 $31,946 $6,922 $8,121 $7,124 $7,822 $7,257 $7,809 $7,043 $8,194 As percentage of revenue, non-gaap 23% 22% 20% 17% 22% 19% 21% 18% 21% 17% 18% 16% General and administrative, as reported $18,422 $29,530 $30,497 $37,471 $7,523 $8,686 $7,681 $9,358 $7,346 $9,763 $7,947 $9,664 As percentage of revenue, GAAP 26% 29% 22% 21% 24% 21% 23% 21% 21% 21% 21% 19% Less: Stock-based compensation 1,023 3,289 3,823 6, ,203 1,253 1, , ,707 General and administrative, non-gaap $17,399 $26,241 $26,674 $31,440 $6,903 $7,483 $6,428 $7,862 $6,371 $8,138 $6,972 $7,957 As percentage of revenue, non-gaap 25% 26% 19% 17% 22% 18% 19% 18% 18% 17% 18% 16% 29
30 Reconciliation of Adjusted EBITDA Year Ended Three Months Ended Dec. 31, March 31, June 30, Sept. 30, Dec. 31, (in thousands) Net loss ($24,606) ($36,088) ($22,979) ($14,792) ($6,594) ($3,909) ($6,550) ($4,375) ($5,895) ($3,630) ($3,940) ($2,878) Year over year favorable/(unfavorable) % change (51)% (47)% 36% 36% 16% 41% 26% 33% 39% 38% 60% 27% Stock-based compensation expense $1,737 $8,375 $8,763 $14,101 $1,913 $2,497 $2,383 $3,513 $2,309 $3,915 $2,157 $4,176 Depreciation and amortization $4,574 $6,516 $7,755 $9,150 $1,848 $2,090 $1,810 $2,309 $2,013 $2,337 $2,084 $2,414 Change in fair value of contingent consideration ($1,434) ($11) Change in fair value of preferred stock warrant $283 $25 Impairment charges $426 Provision for income taxes $116 $246 $321 $167 $73 $142 $64 $118 $142 $83 $42 ($176) Other (income) expense, net $136 $1,075 $1,326 $275 $386 $294 $353 $104 $351 ($217) $235 $94 Adjusted EBITDA (unaudited) ($18,768) ($19,862) ($4,814) $ 8,901 ($2,374) $1,114 ($1,940) $1,669 ($1,080) $2,488 $578 $3,630 Adjusted EBITDA Margin (27)% (20)% (4)% 5% (7)% 3% (6)% 4% (3)% 5% 2% 7% Year over year favorable/(unfavorable) % change (63)% (6)% 76% 285% 55% 147% 62% 186% 79% 330% 113% 528% 30
Q3 FY 18 Financial Results
 Q3 FY 18 Financial Results February 6, 2018. Forward-Looking Statements and Non-GAAP Financial Measures This presentation contains forward-looking statements, as that term is defined under the federal
Media Contact: Jennifer Saxon Exhibit MINDBODY Reports First Quarter 2018 Financial Results
 Contact: Investor Relations: Nicole Gunderson IR@mindbodyonline.com 888-782-7155 Media Contact: Jennifer Saxon jennifer.saxon@mindbodyonline.com 805-419-2839 Exhibit 99.1 MINDBODY Reports First Quarter
SunTrust 2018 Internet & Digital Media Conference. May 8, 2018
 SunTrust 2018 Internet & Digital Media Conference May 8, 2018 SAFE HARBOR STATEMENT This presentation is for informational purposes only and is not an offer to sell securities or a solicitation of an offer
MINDBODY Reports Third Quarter 2015 Financial Results. Company Delivers Revenue Growth of 48% Year over Year. Adds Record Number of Subscribers
 Contact: Investor Relations: The Blueshirt Group Nicole Gunderson IR@mindbodyonline.com 888-782-7155 Media Contact: Georgia Suter georgia.suter@mindbodyonline.com 805-419-2856 MINDBODY Reports Third Quarter
Q1 FY17 Financial Results
 Q1 FY17 Financial Results August 2, 2016 1 Forward-Looking Statements and Non-GAAP Financial Measures This presentation contains forward-looking statements, as that term is defined under the federal securities
Three months ended Dec. 31,
 Wix.com Reports Fourth Quarter and Full Year 2015 Results -- Exceeded Prior Q4 and Full Year 2015 Guidance for Collections on a Constant Currency Basis, Revenue and Adjusted EBITDA -- -- Provides Strong
Q1 FY2015 Earnings Presentation May 5, 2015
 Q1 FY2015 Earnings Presentation May 5, 2015 FORWARD LOOKING STATEMENTS AND OTHER IMPORTANT CAUTIONS Statements in this presentation which are not statements of historical fact, including but not limited
Helping Clients Win with Digital
 First Quarter 2018 Earnings Supplement Helping Clients Win with Digital May 7, 2018 2017 Cognizant Forward Looking Statements and Non-GAAP Financial Measures This earnings supplement includes statements
Wix Reports Strong Third Quarter 2016 Results, Exceeding Expectations Leading to Significant Increase in Full Year Outlook
 Wix Reports Strong Third Quarter 2016 Results, Exceeding Expectations Leading to Significant Increase in Full Year Outlook Exceeded High End of Guidance Range with Strong Top-Line Growth and Record Adjusted
Q2 FY19 Supplemental Earnings Slides. October 29, 2018
 Q2 FY19 Supplemental Earnings Slides October 29, 2018 Safe Harbor Statement Some of the matters discussed in this presentation contain forward-looking statements regarding the Company s future business
Revenue $144M $134M $119M $110M $102M $89M $76M $71M $61M $55M $46M $150 $125 $100 $50 $25
 Revenue ($M) $150 $134M $144M $125 $100 $89M $102M $110M $119M $75 $50 $46M $55M $61M $71M $76M $25 $0 Q1'13 Q2'13 Q3'13 Q4'13 Q1'14 Q2'14 Q3'14 Q4'14 Q1'15 Q2'15 Q3'15 1 Adj. EBITDA ($M) Adjusted EBITDA
Q Earnings Results
 2015 Earnings Results 1 Safe Harbor Forward-Looking Statements This presentation contains forward-looking statements, within the meaning of the safe harbor provisions of the Private Securities Litigation
Investor Presentation. Third Quarter 2018
 Investor Presentation Third Quarter 2018 Safe Harbor and Other Information This presentation contains forward looking statements that are based on our management s beliefs and assumptions and on information
Wix.com Reports First Quarter 2016 Results
 Wix.com Reports First Quarter 2016 Results Exceeded High End of Q1 Guidance for Collections, Revenue and Adjusted EBITDA Results Highlighted by a Unique Combination of Record Registered User Growth and
Castlight Health. Q Financial & Business Update November 6, 2018 Q3 FY
 Castlight Health Q3 2018 Financial & Business Update November 6, 2018 Q3 FY 2018 1 Safe Harbor Statement This presentation contains forward-looking statements regarding our trends, our strategies and the
4Q 2017 FINANCIAL RESULTS F e b r u a r y 8,
 4Q 2017 FINANCIAL RESULTS F e b r u a r y 8, 2 0 1 8 Welcome to Web.com s Quarterly Earnings Call Please note there are two options for listening to this call: 1. To listen via your computer and view the
Web.com Reports Fourth Quarter and Full Year 2017 Financial Results
 Web.com Reports Fourth Quarter and Full Year 2017 Financial Results Strong financial and operating performance in the fourth quarter Significant progress on strategic priorities for the year Generated
Fourth Quarter & Full Year 2018 Results. February 26, 2018 (U.S. Eastern Time) February 27, 2018 (Singapore / Hong Kong Time)
 February 27, 2018 (Singapore / Hong Kong Time)") Fourth Quarter & Full Year Results February 26, (U.S. Eastern Time) February 27, (Singapore / Hong Kong Time) Disclaimer This presentation by Sea Limited ( Sea ) contains forward-looking statements. These
Fourth Quarter & Full Year Results February 26, (U.S. Eastern Time) February 27, (Singapore / Hong Kong Time) Disclaimer This presentation by Sea Limited ( Sea ) contains forward-looking statements. These
The Platform for the Connected Home and Business March 2018
 The Platform for the Connected Home and Business March 2018 1 Safe harbor statement Forward-Looking Statements This presentation contains forward-looking statements that involve risks and uncertainties.
1Q 2018 FINANCIAL RESULTS M a y 3,
 1Q 2018 FINANCIAL RESULTS M a y 3, 2 0 1 8 Welcome to Web.com s Quarterly Earnings Call Please note there are two options for listening to this call: 1. To listen via your computer and view the slides,
SAFE HARBOR STATEMENT
 SAFE HARBOR STATEMENT This presentation may contain projections or other forward-looking statements within the meaning of Section 27A of the Securities Act of 1933, as amended, and Section 21E of the Securities
Cloud Contact Center Software. Five9 (NASDAQ: FIVN) Q Investor Presentation
 Q Investor Presentation") Cloud Contact Center Software Five9 (NASDAQ: FIVN) Q2 2018 Investor Presentation Safe Harbor This presentation is proprietary and is intended solely for the information of the persons to whom it is presented.
Cloud Contact Center Software Five9 (NASDAQ: FIVN) Q2 2018 Investor Presentation Safe Harbor This presentation is proprietary and is intended solely for the information of the persons to whom it is presented.
FORWARDING LOOKING STATEMENTS & NON-GAAP MEASURES
 FORWARDING LOOKING STATEMENTS & NON-GAAP MEASURES This presentation and the accompanying oral commentary contain forward-looking statements, within the meaning of the safe harbor provisions of the U.S.
Accelerating the Shift to Digital
 Fourth Quarter 2017 Earnings Supplement Accelerating the Shift to Digital February 7, 2018 2017 Cognizant Forward Looking Statements and Non-GAAP Financial Measures This earnings supplement includes statements
FORWARDING LOOKING STATEMENTS & NON-GAAP MEASURES
 FORWARDING LOOKING STATEMENTS & NON-GAAP MEASURES This presentation and the accompanying oral commentary contain forward-looking statements, within the meaning of the safe harbor provisions of the U.S.
Q2 FY 18 Financial Results
 Q2 FY 18 Financial Results November 7, 2017. Forward-Looking Statements and Non-GAAP Financial Measures This presentation contains forward-looking statements, as that term is defined under the federal
Cloud Contact Center Software. Five9 (NASDAQ: FIVN) Q Investor Presentation
 Q Investor Presentation") Cloud Contact Center Software Five9 (NASDAQ: FIVN) Q1 2017 Investor Presentation Safe Harbor This presentation is proprietary and is intended solely for the information of the persons to whom it is presented.
Cloud Contact Center Software Five9 (NASDAQ: FIVN) Q1 2017 Investor Presentation Safe Harbor This presentation is proprietary and is intended solely for the information of the persons to whom it is presented.
Q Earnings Conference Call
 Q1 2018 Earnings Conference Call May 1, 2018 Christopher North, President and CEO Mike Pope, CFO Safe Harbor Disclaimer This presentation contains "forward-looking" statements within the meaning of Section
THIRD QUARTER FISCAL 2019 EARNINGS CALL PROVIDING THE BEST SOLUTIONS MARCH 7, 2019
 PROVIDING THE BEST SOLUTIONS THIRD QUARTER FISCAL 2019 EARNINGS CALL MARCH 7, 2019 Safe Harbor Statement Forward-Looking Statements This presentation contains forward-looking statements within the meaning
Q2 Fiscal 2016 Earnings Presentation August 2, endurance.com /
 Q2 Fiscal 2016 Earnings Presentation August 2, 2016 FORWARD LOOKING STATEMENTS AND OTHER IMPORTANT CAUTIONS This presentation contains certain forward-looking statements within the meaning of the Private
Earnings Results. Third Quarter 2017
 Earnings Results Third Quarter 2017 1 Safe Harbor Non-GAAP Financial Measures To supplement its consolidated financial statements, which are prepared and presented in accordance with U.S. GAAP, Wix uses
Salesforce.com Announces Fiscal 2013 Fourth Quarter and Full Year Results
 David Havlek salesforce.com Investor Relations 415-536-2171 dhavlek@salesforce.com Jane Hynes salesforce.com Public Relations 415-901-5079 jhynes@salesforce.com Salesforce.com Announces Fiscal 2013 Fourth
Carbonite, Inc. Q4 and FY 2017 Financial Results. February 13, carbonite.com 1
 Carbonite, Inc. Q4 and FY 2017 Financial Results February 13, 2018 carbonite.com 1 Safe Harbor Statement Certain matters discussed in these slides and accompanying oral presentation have "forward-looking
Castlight Health. Investor Overview. June 2018 NYSE: CSLT
 Castlight Health Investor Overview June 2018 NYSE: CSLT 1 Safe Harbor Statement This presentation contains forward-looking statements regarding our trends, our strategies and the anticipated performance
Investor Overview Presentation. July 26, 2018
 Investor Overview Presentation July 26, 2018 FORWARD LOOKING STATEMENTS AND OTHER IMPORTANT CAUTIONS This presentation contains certain forward-looking statements within the meaning of the Private Securities
Investor Presentation
 Investor Presentation Fourth Quarter 2017 Safe Harbor and Other Information This presentation contains forward looking statements that are based on our management s beliefs and assumptions and on information
Q2 Fiscal 2018 Earnings Presentation. July 26, 2018
 Q2 Fiscal 2018 Earnings Presentation July 26, 2018 FORWARD LOOKING STATEMENTS AND OTHER IMPORTANT CAUTIONS This presentation contains certain forward-looking statements within the meaning of the Private
FORWARDING LOOKING STATEMENTS & NON-GAAP MEASURES
 FORWARDING LOOKING STATEMENTS & NON-GAAP MEASURES This presentation and the accompanying oral commentary contain forward-looking statements, within the meaning of the safe harbor provisions of the U.S.
Web.com Reports Fourth Quarter and Full Year 2009 Financial Results
 Web.com Reports Fourth Quarter and Full Year 2009 Financial Results JACKSONVILLE, Fla., Feb. 9, 2010 (GLOBE NEWSWIRE) -- Web.com Group, Inc. (Nasdaq:WWWW), a leading provider of online marketing for small
F O U R T H Q U A R T E R R E S U L T S February 6, 2018
 F O U R T H Q U A R T E R 2 0 1 7 R E S U L T S February 6, 2018 Safe Harbor for Forward-Looking Statements Certain statements in this presentation are forward-looking statements within the meaning of
Q Earnings Conference Call
 Q4 2013 Earnings Conference Call FEBRUARY 5, 2014 Jeff Housenbold, CEO Brian Regan, CFO Safe Harbor Disclaimer This presentation contains "forward-looking" statements within the meaning of Section 27A
Deutsche Bank 24 th Annual Media, Internet & Telcom Conference. March 8, 2016
 Deutsche Bank 24 th Annual Media, Internet & Telcom Conference March 8, 2016 Safe Harbor for Forward-Looking Statements Certain statements in this presentation are forward-looking statements within the
Appendix to Zendesk, Inc Analyst & Investor Day
 Appendix to Zendesk, Inc. 2017 Analyst & Investor Day Important Disclosures Regarding the Analyst and Investor Day Materials This presentation and the accompanying oral presentation include forward-looking
Cloud Contact Center Software. Five9 (NASDAQ: FIVN) Q Investor Presentation
 Q Investor Presentation") Cloud Contact Center Software Five9 (NASDAQ: FIVN) Q4 2017 Investor Presentation Safe Harbor This presentation is proprietary and is intended solely for the information of the persons to whom it is presented.
Cloud Contact Center Software Five9 (NASDAQ: FIVN) Q4 2017 Investor Presentation Safe Harbor This presentation is proprietary and is intended solely for the information of the persons to whom it is presented.
Investor Presentation
 Investor Presentation Q3 2018 Financial Results November 1 st, 2018 2018 ALL RIGHTS RESERVED Safe harbor statement Certain matters discussed in these slides and accompanying oral presentation have "forward-looking
Roper Technologies, Inc. EPG Annual Spring Conference
 Roper Technologies, Inc. EPG Annual Spring Conference May 21, 2018 Safe Harbor Statement The information provided in this presentation contains forward-looking statements within the meaning of the federal
Web.com Reports Fourth Quarter and Full Year 2016 Financial Results
 Web.com Group, Inc. 12808 Gran Bay Parkway West Jacksonville, FL 32258 T: (904) 680-6600 F: (904) 880-0350 NASDAQ: WEB Web.com Reports Fourth Quarter and Full Year 2016 Financial Results Solid progress
Company Overview. F e b r u a r y M a r c h 2018
 Company Overview F e b r u a r y M a r c h 2018 Safe Harbor Non-GAAP Financial Measures To supplement its consolidated financial statements, which are prepared and presented in accordance with U.S. GAAP,
Cloud Contact Center Software. Five9 (NASDAQ: FIVN) Q Investor Presentation
 Q Investor Presentation") Cloud Contact Center Software Five9 (NASDAQ: FIVN) Q3 2017 Investor Presentation Safe Harbor This presentation is proprietary and is intended solely for the information of the persons to whom it is presented.
Cloud Contact Center Software Five9 (NASDAQ: FIVN) Q3 2017 Investor Presentation Safe Harbor This presentation is proprietary and is intended solely for the information of the persons to whom it is presented.
SAFE HARBOR STATEMENT
 SAFE HARBOR STATEMENT This presentation may contain projections or other forward-looking statements within the meaning of Section 27A of the Securities Act of 1933, as amended, and Section 21E of the Securities
4th Quarter Supplemental Information February 14, 2018
 4th Quarter 2017 Supplemental Information February 14, 2018 Safe Harbor This presentation is intended to be disclosure through methods reasonably designed to provide broad, non-exclusionary distribution
Wix.com Reports Second Quarter 2015 Results
 August 5, 2015 Wix.com Reports Second Quarter 2015 Results Reports Strong Top Line Growth and Positive Adjusted EBITDA and Free Cash Flow, Becoming a Unique Combination of High Growth and Profitability
ITRON, INC. CONSOLIDATED STATEMENTS OF OPERATIONS
 , INC. CONSOLIDATED STATEMENTS OF OPERATIONS (Unaudited, in thousands, except per share data) Revenues $ 523,335 $ 642,477 $ 2,178,178 $ 2,434,124 Cost of revenues 359,835 449,944 1,463,031 1,687,666 Gross
MiX Investor presentation. Stefan Joselowitz, CEO March 2018
 MiX Investor presentation Stefan Joselowitz, CEO March 2018 Forward looking statements Safe Harbor Statement 2 This presentation includes forward-looking statements, within the meaning of the U.S. Securities
Shutterfly Announces Fourth Quarter and Full Year 2017 Financial Results
 Shutterfly Announces Fourth Quarter and Full Year 2017 Financial Results January 30, 2018 REDWOOD CITY, Calif.--(BUSINESS WIRE)--Jan. 30, 2018-- (NASDAQ:SFLY), the leading online retailer and manufacturer
Q1 Fiscal 2018 Earnings Presentation. May 1, 2018
 Q1 Fiscal 2018 Earnings Presentation May 1, 2018 FORWARD LOOKING STATEMENTS AND OTHER IMPORTANT CAUTIONS This presentation contains certain forward-looking statements within the meaning of the Private
Acquisition of Dealer Inspire and Launch Digital Marketing
 Acquisition of Dealer Inspire and Launch Digital Marketing Investor Presentation February 14, 2018 Forward Looking Statements This presentation contains forward looking statements within the meaning of
Second Quarter Fiscal 2018 Investor Presentation
 Second Quarter Fiscal 2018 Investor Presentation Disclaimers Non-GAAP Financial Measures The presentation presents information about the Company s non-gaap revenue, non-gaap gross margin, non-gaap operating
I N V E S T O R P R E S E N T A T I O N
 A U G U S T 2 0 1 6 S T E F A N J O S E L O W I T Z, C E O I N V E S T O R P R E S E N T A T I O N Forward looking statements 2 Safe Harbor Statement This presentation includes forward-looking statements,
Q2 18 Results and Conference Call August 1, 2018
 Q2 18 Results and Conference Call August 1, 2018 2 Safe Harbor Statement This presentation contains forward-looking statements within the meaning of Section 27A of the Securities Act of 1933, as amended,
Q2 FY2015 Earnings Presentation August 4, 2015
 Q2 FY2015 Earnings Presentation August 4, 2015 FORWARD LOOKING STATEMENTS AND OTHER IMPORTANT CAUTIONS Statements in this presentation which are not statements of historical fact, including but not limited
Castlight Health. Q Financial & Business Update May 10, 2018 Q1 FY
 Castlight Health Q1 2018 Financial & Business Update May 10, 2018 Q1 FY 2018 1 Safe Harbor Statement This presentation contains forward-looking statements regarding our trends, our strategies and the anticipated
Q Earnings Conference Call
 Q2 2018 Earnings Conference Call August 7, 2018 Christopher North, President and CEO Mike Pope, CFO Safe Harbor Disclaimer This presentation contains "forward-looking" statements within the meaning of
Q Financial Results
 Q4 2016 Financial Results February 2, 2017 Copyright Fortinet Inc. All rights reserved. Safe Harbor Statement Information, statements and projections contained in these presentation slides and related
CARBONITE (NASDAQ: CARB)
") CARBONITE (NASDAQ: CARB) FOURTH QUARTER AND FY 2016 FINANCIAL RESULTS Thursday, February 9 th 2017 JERRY SISITSKY VP, Investor Relations Phone: 781-928-0713 Email: investor.relations@carbonite.com (NASDAQ:
CARBONITE (NASDAQ: CARB) FOURTH QUARTER AND FY 2016 FINANCIAL RESULTS Thursday, February 9 th 2017 JERRY SISITSKY VP, Investor Relations Phone: 781-928-0713 Email: investor.relations@carbonite.com (NASDAQ:
FORWARDING LOOKING STATEMENTS & NON-GAAP MEASURES
 FORWARDING LOOKING STATEMENTS & NON-GAAP MEASURES This presentation and the accompanying oral commentary contain forward-looking statements, within the meaning of the safe harbor provisions of the U.S.
COMPANY OVERVIEW. February 7, 2019
 COMPANY OVERVIEW February 7, 2019 1 DISCLAIMERS This presentation contains forward-looking statements. All statements contained in this presentation other than statements of historical facts, including,
Click here to edit the name of your presentation. Fourth Quarter and Full Year Earnings Results
 Click here to edit the name of your presentation Fourth Quarter and Full Year 2016 Earnings Results 1 Safe Harbor Forward-Looking Statements This presentation contains forward-looking statements, within
Fiscal 2018 Fourth Quarter Results. July 26, 2018
 Fiscal 2018 Fourth Quarter Results July 26, 2018 Safe Harbor This presentation contains forward-looking statements within the meaning of Section 27A of the Securities Act of 1933, as amended, and Section
Q1 FY 18 Financial Results
 Q1 FY 18 Financial Results August 3, 2017. Forward-Looking Statements and Non-GAAP Financial Measures This presentation contains forward-looking statements, as that term is defined under the federal securities
Q1 18 Results and Conference Call
 Q1 18 Results and Conference Call May 2, 2018 Materials posted at: investors.fireeye.com/results.cfm 2 Safe Harbor Statement This presentation contains forward-looking statements within the meaning of
2017 WELLS FARGO HEALTHCARE CONFERENCE
 2017 WELLS FARGO HEALTHCARE CONFERENCE September 7, 2017 TRANSFORMING HEALTHCARE TOGETHER UNIQUELY POSITIONED FOR THE FUTURE 2017 1 Craig McKasson Chief Financial Officer Premier Inc. TRANSFORMING HEALTHCARE
Earnings Call Presentation Q3 2018
 Earnings Call Presentation Q3 2018 Forward Looking Statements This presentation and the accompanying oral presentation contain forward-looking statements that are based on our management s beliefs and
Company Presentation. December 2015
 Company Presentation December 2015 Forward-Looking Statements This presentation, including the accompanying oral presentation (collectively, this presentation ), does not constitute an offer to sell or
Trimble Second Quarter 2018 Results Summary
 Trimble Second Quarter 2018 Results Summary Forward-looking statements Certain statements made in this presentation and any subsequent Q&A period are forward-looking statements, within the meaning of Section
THIRD QUARTER 2018 RESULTS November 6, 2018
 THIRD QUARTER 2018 RESULTS November 6, 2018 Safe Harbor for Forward-Looking Statements Certain statements in this presentation are forward-looking statements within the meaning of the Private Securities
Click here to edit the name of your presentation. Second Quarter Earnings Results UNDER EMBARGO UNTIL 1AM ET ON MAY 10, 2017
 Click here to edit the name of your presentation Second Quarter 2017 Earnings Results UNDER EMBARGO UNTIL 1AM ET ON MAY 10, 2017 1 Safe Harbor Non-GAAP Financial Measures To supplement its consolidated
Q2 FY 18 Investor Presentation. February 26, 2018
 Q2 FY 18 Investor Presentation February 26, 2018 Safe harbor This presentation contains forward-looking statements within the meaning of Section 27A of the Securities Act and Section 21E of the Exchange
Important Information for Investors and Stockholders
 March 1, 2010 Important Information for Investors and Stockholders This presentation does not constitute an offer to sell or the solicitation of an offer to buy any securities or a solicitation of any
Q EARNINGS PRESENTATION
 Q1 2014 EARNINGS PRESENTATION May 6, 2014 FORWARD LOOKING STATEMENTS AND OTHER IMPORTANT CAUTIONS Statements in this presentation which are not statements of historical fact, including but not limited
SS&C Technologies (NASDAQ:SSNC) Investor Presentation February 2015
 Investor Presentation February 2015") SS&C Technologies (NASDAQ:SSNC) Investor Presentation February 2015 Safe Harbor Statement Safe Harbor Statement This presentation includes forward-looking statements that are based on the current expectations
SS&C Technologies (NASDAQ:SSNC) Investor Presentation February 2015 Safe Harbor Statement Safe Harbor Statement This presentation includes forward-looking statements that are based on the current expectations
Helping people share life s joy
 Raymond James Institutional Investor Conference March 4, 2019 Helping people share life s joy 1 Safe Harbor Disclaimer This presentation contains "forward-looking" statements within the meaning of Section
Raymond James 37 th Annual Institutional Investors Conference. March 8, 2016
 Raymond James 37 th Annual Institutional Investors Conference March 8, 2016 Forward-looking statements and Non-GAAP financial measures Forward-looking statements Certain statements included in this presentation,
Investor Presentation Q1 2017
 Investor Presentation Q1 2017 Safe Harbor FORWARD-LOOKING STATEMENTS These slides and the accompanying oral presentation contain forward-looking statements. All statements other than statements of historical
The Platform for the Connected Home and Business. November 2017
 The Platform for the Connected Home and Business November 2017 1 Safe harbor statement Forward-Looking Statements This presentation contains forward-looking statements that involve risks and uncertainties.
Third Fiscal Quarter FY19 Financial Results. November 28, 2018
 Third Fiscal Quarter FY19 Financial Results November 28, 2018 2 Forward-Looking Statements and Non-GAAP Financial Measures This presentation contains forward-looking statements that involve risks and uncertainties,
Safe Harbor Statement
 Q3 2016 Safe Harbor Statement This presentation contains forward-looking statements that are based on our beliefs and assumptions and on information currently available to us. Forward-looking statements
Q Earnings Report. November 7, 2017
 Q3 2017 Earnings Report November 7, 2017 Forward-Looking Statements & Non-GAAP Financial Measures This presentation contains forward-looking statements about us and our industry that involve substantial
Fourth Quarter and Full Year 2018 Financial Review and Analysis
 Fourth Quarter and Full Year 2018 Financial Review and Analysis (preliminary, unaudited) Supplemental Presentation Materials Unless otherwise indicated, comparisons are to the same periods in the prior
Safe Harbor. Non-GAAP Financial Measures. Forward-Looking Statements
 June 2018 Safe Harbor Non-GAAP Financial Measures To supplement its consolidated financial statements, which are prepared and presented in accordance with U.S. GAAP, Wix uses the following non-gaap financial
FTD Group, Inc. FTD Companies, Inc. Acquisition of Provide Commerce Supplemental Presentation
 FTD Group, Inc. FTD Companies, Inc. Acquisition of Provide Commerce Supplemental Presentation July 30, 2014 Forward-Looking Statements and Risk Factors This presentation contains certain forward-looking
AVAYA Q1 FISCAL YEAR 2017 EARNINGS
 AVAYA Q1 FISCAL YEAR 2017 EARNINGS February 8, 2017 2017 Avaya Inc. All rights reserved. FORWARD LOOKING STATEMENTS Cautionary Note Regarding the Chapter 11 Cases The Company s security holders are cautioned
ITRON, INC. CONSOLIDATED STATEMENTS OF OPERATIONS
 , INC. CONSOLIDATED STATEMENTS OF OPERATIONS (Unaudited, in thousands, except per share data) Revenues $ 489,353 $ 482,175 $ 964,148 $ 929,711 Cost of revenues 326,312 322,587 646,572 630,000 Gross profit
Safe Harbor. Non-GAAP Financial Information
 1 Safe Harbor This document contains forward-looking statements within the meaning of the Private Securities Litigation Reform Act of 1995, including financial projections subject to risks, uncertainties
ITRON, INC. CONSOLIDATED STATEMENTS OF OPERATIONS
 , INC. CONSOLIDATED STATEMENTS OF OPERATIONS (Unaudited, in thousands, except per share data) Revenues $ 474,795 $ 447,536 Cost of revenues 320,260 307,413 Gross profit 154,535 140,123 Operating expenses
ITRON, INC. CONSOLIDATED STATEMENTS OF OPERATIONS
 , INC. CONSOLIDATED STATEMENTS OF OPERATIONS (Unaudited, in thousands, except per share data) Revenues $ 571,640 $ 563,691 Cost of revenues 388,535 378,713 Gross profit 183,105 184,978 Operating expenses
Q Earnings Conference Call
 Q3 207 Earnings Conference Call October 24, 207 Christopher North, President and CEO Mike Pope, CFO Safe Harbor Disclaimer This presentation contains "forward-looking" statements within the meaning of
ITRON, INC. CONSOLIDATED STATEMENTS OF OPERATIONS
 , INC. CONSOLIDATED STATEMENTS OF OPERATIONS (Unaudited, in thousands, except per share data) Revenues $ 447,536 $ 571,640 Cost of revenues 307,413 388,535 Gross profit 140,123 183,105 Operating expenses
Zscaler Reports Third Quarter Fiscal 2018 Financial Results
 Zscaler Reports Third Quarter Fiscal 2018 Financial Results Revenue grows 49% year over year to $49.2 million Calculated billings grow 73% year over year to $54.7 million Deferred revenue grows 61% year
Fourth Quarter and Full Year February 22, 2018
 Fourth Quarter and Full Year 2017 February 22, 2018 Forward-Looking Statements This presentation contains forward-looking statements within the meaning of the Private Securities Litigation Reform Act of