Q Earnings Conference Call
|
|
|
- Conrad Summers
- 5 years ago
- Views:
Transcription
1 Q Earnings Conference Call FEBRUARY 5, 2014 Jeff Housenbold, CEO Brian Regan, CFO
2 Safe Harbor Disclaimer This presentation contains "forward-looking" statements within the meaning of Section 27A of the Securities Act of 1933, as amended, and Section 21E of the Securities Exchange Act of 1934, as amended, that involve risks and uncertainties. These forward-looking statements include statements about our plans for 2014 and beyond and our business outlook for the first quarter and full year 2014 and statements about historical results that may suggest trends for our business. You can identify these statements by the use of terminology such as guidance, believe, expect, will, should, could, estimate, anticipate or similar forward-looking terms. You should not rely on these forwardlooking statements as they involve risks and uncertainties that may cause actual results to vary materially from the forward-looking statements. Factors that might contribute to such differences include, among others, economic downturns and the general state of the economy; the loss of sales partners for our products; our ability to expand our customer base, increase sales to existing customers and meet production requirements; our ability to successfully integrate acquired businesses and assets; our ability to retain and hire necessary employees, including seasonal personnel, and appropriately staff our operations; the impact of seasonality on our business; our ability to develop innovative, new products and services on a timely and cost-effective basis; consumer acceptance of our products and services; unforeseen changes in expense levels; and competition and the pricing strategies of our competitors, which could lead to pricing pressure. For more information regarding the risks and uncertainties that could cause actual results to differ materially from those expressed or implied in these forward-looking statements, as well as risks relating to our business in general, we refer you to the Risk Factors section of tour SEC filings, including our most recent Form 10-K and 10-Q, which are available on the Securities and Exchange Commission s Web site at These forward-looking statements are based on current expectations and the company assumes no obligation to update this information. This presentation includes non-gaap financial measures, including adjusted EBITDA, non-gaap net loss and non-gaap net loss per share. We define adjusted EBITDA as earnings before interest, taxes, depreciation, amortization and stock-based compensation. We define Free Cash Flows as Adjusted EBITDA less purchases of property, plant and equipment and capitalization of software and website development costs. The method we use to produce non-gaap financial measures is not computed according to GAAP and may differ from the methods used by other companies. To supplement our consolidated financial statements presented on a GAAP basis, we believe that these non-gaap measures provide useful information about our core operating results and thus are appropriate to enhance the overall understanding of our past financial performance and our prospects for the future. These adjustments to our GAAP results are made with the intent of providing both management and investors a more complete understanding of our underlying operational results and trends and performance. Management uses these non-gaap measures to evaluate our financial results, develop budgets, manage expenditures, and determine employee compensation. The presentation of additional information is not meant to be considered in isolation or as a substitute for, or superior to, net income (loss) or net income (loss) per share determined in accordance with GAAP. Management strongly encourages review of our financial statements and publicly-filed reports in their entirety and to not rely on any single financial measure. 2

3 Conference Call Agenda Q4 results 2013 achievements 2014 plans Q4 financial performance Q1 / FY2014 outlook 3
4 Q4 Results ($ in millions, except AOV) Change (Y/Y) Net Revenue $410.8 $ % Adjusted EBITDA * $141.9 $ % Free Cash Flow $126.0 $111.4 $14.6 Customers 4,652,682 4,227,247 10% Orders 7,693,863 6,897,969 12% Average Order Value (AOV) $51.80 $ % Continued to drive profitable revenue growth and healthy customer behavior across entire family of premium lifestyle brands * Adjusted EBITDA is defined as earnings before interest, taxes, depreciation, amortization and stock-based compensation. 4
5 2013 Results ($ in millions, except AOV) Net Revenue Change (Y/Y) $783.6 $ % Adjusted EBITDA * $150.4 $ % Free Cash Flow $75.5 $67.4 $8.1 Customers 8,094,038 7,062,001 15% Orders 18,561,022 16,321,828 14% Average Order Value (AOV) $40.19 $ % * Adjusted EBITDA is defined as earnings before interest, taxes, depreciation, amortization and stock-based compensation. 5
6 5 Areas of Focus in ) Growth of our two core brands, Shutterfly and Tiny Prints, through innovative products and services 2) Investments in our early stage growth initiatives including Enterprise, Mobile, ThisLife, Treat and Wedding Paper Divas 3) Broadening and enhancing our overall awareness, utilizing our integrated marketing platform 4) Scaling our manufacturing and operations capabilities; and 5) Expanding our portfolio of premium lifestyle brands through disciplined strategic acquisitions 6


7 Continuing Innovation - Mobile Smartphone apps Photo Story ipad app M.dot enabled websites ThisLife Kindle app 7

8 Continuing Innovation Intelligent Product Creation 8

9 Continuing Innovation Enhanced Cloud Services 9


10 Continuing Innovation Products and Services Photo Books Cards & Stationery Photo Gifts / Home Decor 10


11 Improving Operational Efficiency - Manufacturing 11


12 Strategic Disciplined Acquisitions 12
13 Moving Forward into 2014 expect us to continue to leverage our market leadership and healthy balance sheet to innovate in our core businesses and early stage growth initiatives increase our overall brand awareness invest in our scale and operational infrastructure 13

14 Financial Results Review Brian Regan, CFO 14
15 Q4 Financial Results ($ in millions) Change (Y/Y) Net Revenue $410.8 $ % GAAP Net Income $43.6 $53.0 (18%) Adjusted EBITDA * $141.9 $ % Free Cash Flow $126.0 $ % * Adjusted EBITDA is defined as earnings before interest, taxes, depreciation, amortization and stock-based compensation. 15
16 Consumer Revenues Q4 Revenue Full Year Revenue $450.0 $900.0 $746.0 $400.0 $398.6 $600.0 $613.4 $350.0 $343.5 $300.0 $300.0 Q4FY12 Q4FY13 $
17 Enterprise Revenues Q4 Revenue Full Year Revenue $14.0 $12.0 $12.2 $40.0 $37.7 $10.0 $30.0 $27.2 $8.0 $8.2 $20.0 $6.0 $4.0 $10.0 $2.0 $- Q4FY12 Q4FY13 $ Enterprise Revenues represented 5% of Total 2013 Revenues 17
18 Q4 Consumer Metrics Y/Y Growth Customers 4,652,682 4,227,247 10% Orders 7,693,863 6,897,969 12% Average Order Value (AOV) $51.80 $ % Our record Average Order Value (AOV) reflects: strength of our loyal customer base new premium product offerings continued benefits of our pricing and promotional initiatives 18
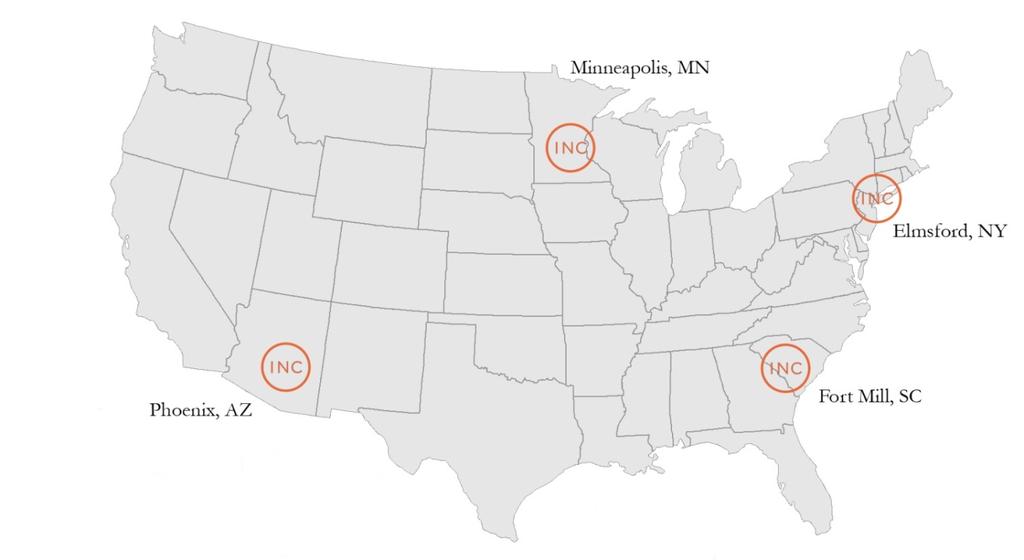
19 GAAP Gross Profit/Margin ($ in millions except per share amounts) Net Revenue $410.8 $351.8 of Total Net Revenues Gross Profit / Margins (GAAP) $246.1 $ % 61% Gross Profit / Margins (non-gaap) * $249.6 $ % 61% Q4 s lower GAAP gross margin reflects the combined effect of: acquired intangible amortization and higher depreciation equipment expenses and increased overhead labor costs related to our new Fort Mill, SC facility Q4 s Cost of Goods Sold (COGS) also reflect impact of unanticipated labor, materials accelerated shipping and customer service costs resulting from brief production issue at Tiny Prints * Non-GAAP Gross Profit/Margins excludes stock-based compensation and amortization of intangible assets. A non-gaap to GAAP reconciliation is provided at the end of this presentation. 19
20 GAAP Total Operating Expenses ($ in millions except per share amounts) Net Revenue $410.8 $351.8 of Total Net Revenues Gross Profit / Margins $246.1 $ % 61% Operating Expenses $141.5 $ % 32% Operating Expenses (excl. SBC) $126.8 $ % 29% Operating expense levels reflect increased cost structure from acquisitions and purchase accounting amortization 20
21 GAAP Technology and Dev Expense ($ in millions except per share amounts) Net Revenue $410.8 $351.8 of Total Net Revenues Gross Profit / Margins $246.1 $ % 61% Operating Expenses $141.5 $ % 32% Technology & Dev. T&D (excl. SBC, deprec., amort.) $31.0 $22.6 $24.8 $18.6 8% 6% 7% 5% The increase in Technology and Development expenses was driven by: incremental costs associated with our recent acquisitions continuing investments in engineering headcount 21
22 GAAP Sales and Marketing Expense ($ in millions except per share amounts) Net Revenue $410.8 $351.8 of Total Net Revenues Gross Profit / Margins $246.1 $ % 61% Operating Expenses $141.5 $ % 32% Technology & Dev. Sales & Marketing S&M (excl. SBC and amort.) $31.0 $80.0 $69.5 $24.8 $62.2 $55.1 8% 19% 17% 7% 18% 16% The increase in Sales and Marketing expenses as a percent of total revenues reflects: increased investments in our integrated marketing campaigns modest increase in Sales and Marketing headcount 22
23 GAAP - General and Admin Expense ($ in millions except per share amounts) Net Revenue $410.8 $351.8 of Total Net Revenues Gross Profit / Margins $246.1 $ % 61% Operating Expenses $141.5 $ % 32% Technology & Dev. Sales & Marketing General & Admin. G&A (excl. SBC and CC fees) $31.0 $80.0 $30.5 $14.7 $24.8 $62.2 $24.5 $12.3 8% 19% 7% 4% 7% 18% 7% 3% Q4 s General and Administration expense, excluding stock-based compensation and credit card fees, represented 4% of net revenues, roughly in line with Q4 of
24 non-gaap Adjusted EBITDA ($ in millions except per share amounts) Net Revenue $410.8 $351.8 of Total Net Revenues Gross Profit / Margins $246.1 $ % 61% Operating Expenses $141.5 $ % 32% Technology & Dev. Sales & Marketing General & Admin. $31.0 $80.0 $30.5 $24.8 $62.2 $24.5 8% 19% 7% 7% 18% 7% Operating Income $104.6 $ % 29% Adjusted EBITDA * $141.9 $ % 36% Q4 s solid Adjusted EBITDA performance was largely driven by healthy revenue growth and certain scale efficiencies. Adjusted EBITDA grew at a compound annual growth rate of nearly 32% since Shutterfly went public in late * Adjusted EBITDA is defined as earnings before interest, taxes, depreciation, amortization and stock-based compensation. A non- GAAP to GAAP reconciliation is provided at the end of this presentation. 24
25 GAAP and non-gaap Net Income ($ in millions except per share amounts) Net Revenue $410.8 $351.8 of Total Net Revenues Gross Profit / Margins $246.1 $ % 61% Operating Expenses $141.5 $ % 32% Operating Income $104.6 $ % 29% Adjusted EBITDA * $141.9 $ % 36% Tax Rate 56.8% 47.6% - - Net Income (GAAP) $43.6 $ % 15% Net Income (non-gaap)** $47.5 $ % 15% Net Income per Share (GAAP) $1.10 $ Net Income per Share (non-gaap)** $1.20 $1.40 * Adjusted EBITDA is defined as earnings before interest, taxes, depreciation, amortization and stock-based compensation. ** Non-GAAP Net Income normalizes for the impact our Convertible Note offering has on Net Income and earnings per share. A non-gaap to GAAP reconciliation is provided at the end of this presentation
26 Capital Expenditures ($ in millions) Annual Capital Expenditures $75.0 CapEx: $15.9 M $60.8 $3.4 $3.7 $5.7 $7.9 $35.0 $33.6 $4.3 CapEx (% of Rev) 18.7% $22.7 $17.7 $ % 9.5% 9.6% 7.2% 7.3% 7.1% Technology equipment & software Mfg and rental equipment & building improvements Capitalized software development costs 26
27 Q1 FY14 Guidance (as of February 5, 2014) ($ and shares in millions, except per share components) Net Revenues Year-over-year Growth Gross Profit Margins Operating Loss Adjusted EBITDA * Effective Tax Rate Net Loss per Share ** Weighted Average Shares Q1FY14 (GAAP) $132.0 to $ % to 15.7% 44.5% to 45.0% ($41.5) to ($43.5) % to 20.2% ($0.93) to ($0.99) 38.7 Q1FY14 (non-gaap) % to 47.9% ($14.9) to ($16.9) ($1.5) to $0.5 - ($0.86) to ($0.92) 38.7 * Adjusted EBITDA is defined as earnings before interest, taxes, depreciation, amortization and stock-based compensation. ** Non-GAAP Net Loss normalizes for the impact our Convertible Note offering has on Net Loss and earnings per share. See our Fourth Quarter 2013 Financial Results press release for a non-gaap to GAAP reconciliation. 27
28 2014 Guidance (as of February 5, 2014) ($ and shares in millions, except per share components) Net Revenues Year-over-year Growth Gross Profit Margins Operating Income/(Loss) Adjusted EBITDA ** Effective Tax Rate Net Loss per Share*** Weighted Average Shares Capital Expenditures FY 2014 (GAAP) $900.0 to $920.0* 14.8% to 17.4% 52.0% to 53.0% ($11.5) to $1.7-18% to 23% ($0.27) to ($0.55) % to 10.5% FY 2014 (non-gaap) % to 54.6% $94.5 to $109.1 $160.2 to $ ($0.02) to ($0.28) * Reflects the loss of approx. $15M of revenue from the termination of our Costco ship-to-warehouse partnership. ** Adjusted EBITDA is defined as earnings before interest, taxes, depreciation, amortization and stock-based compensation. *** Non-GAAP Net Income normalizes for the impact our Convertible Note offering has on Net Income and earnings per share. See our Fourth Quarter 2013 Financial Results press release for a non-gaap to GAAP reconciliation. 28
29 Reconciliation of Non-GAAP Gross Margin ($ in millions) Reconciliation of Non-GAAP Gross Margin GAAP gross profit $246.1 $212.8 Stock-based compensation Amortization of intangible assets Non-GAAP gross profit $249.6 $
30 Reconciliation of Non-GAAP Adjusted EBITDA ($ in millions) Reconciliation of Non-GAAP Adjusted EBITDA GAAP net income $43.6 $53.0 Interest expense / (income), net Tax provision Depreciation and amortization Stock-based compensation expense Non-GAAP Adjusted EBITDA $141.9 $127.2 Reconciliation of Cash Flows from Operations To Non-GAAP Adjusted EBITDA Net cash provided by operations $218.5 $193.6 Interest expense / (income), net Tax provision Changes in operating assets/liabilities (126.1) (111.9) Other adjustments (11.4) (2.8) Non-GAAP Adjusted EBITDA $141.9 $
31 Reconciliation of Non-GAAP Net Income Per Share ($ in millions, except per share amounts) Share amounts in thousands Reconciliation of Non-GAAP Net Income Per Share GAAP Net income $43.6 $53.0 Add back interest expense related to: Amortization of debt discount Amortization of debt issuance costs % coupon Tax effect Non-GAAP Net income $47.5 $53.0 GAAP Shares outstanding 39,713 37,764 Add: Dilutive effect of convertible notes 0 0 Non-GAAP Shares outstanding 39,713 37,764 GAAP Net income per share $1.10 $1.40 Non-GAAP Net income per share $1.20 $
32 Q&A
Q Earnings Conference Call
 Q2 2015 Earnings Conference Call July 29, 2015 Jeff Housenbold, CEO Brian Regan, CFO Safe Harbor Disclaimer This presentation contains "forward-looking" statements within the meaning of Section 27A of
Q Earnings Conference Call
 Q3 2015 Earnings Conference Call October 27, 2015 Jeff Housenbold, CEO Brian Regan, CFO Safe Harbor Disclaimer This presentation contains "forward-looking" statements within the meaning of Section 27A
Q Earnings Conference Call
 Q4 2015 Earnings Conference Call February 3, 2016 Jeff Housenbold, CEO Phil Marineau, Chairman Mike Pope, CFO Safe Harbor Disclaimer This presentation contains "forward-looking" statements within the meaning
Q Earnings Conference Call
 Q2 207 Earnings Conference Call July 25, 207 Christopher North, President and CEO Mike Pope, CFO Safe Harbor Disclaimer This presentation contains "forward-looking" statements within the meaning of Section
Q Earnings Conference Call
 Q3 207 Earnings Conference Call October 24, 207 Christopher North, President and CEO Mike Pope, CFO Safe Harbor Disclaimer This presentation contains "forward-looking" statements within the meaning of
Q Earnings Conference Call
 Q3 2016 Earnings Conference Call October 26, 2016 Christopher North, President and CEO Mike Pope, CFO Safe Harbor Disclaimer This presentation contains "forward- looking" statements within the meaning
Q Earnings Conference Call
 Q2 2018 Earnings Conference Call August 7, 2018 Christopher North, President and CEO Mike Pope, CFO Safe Harbor Disclaimer This presentation contains "forward-looking" statements within the meaning of
Q Earnings Conference Call
 Q1 2018 Earnings Conference Call May 1, 2018 Christopher North, President and CEO Mike Pope, CFO Safe Harbor Disclaimer This presentation contains "forward-looking" statements within the meaning of Section
Q Earnings Conference Call
 Q3 208 Earnings Conference Call October 30, 208 Christopher North, President and CEO Mike Pope, CFO Safe Harbor Disclaimer This presentation contains "forward-looking" statements within the meaning of
Raymond James Institutional Investors Conference March Helping people share life s joy.
 Raymond James Institutional Investors Conference March 2017 Helping people share life s joy. 1 Safe Harbor Disclaimer This presentation contains "forward- looking" statements within the meaning of Section
Shutterfly Announces Fourth Quarter and Full Year 2017 Financial Results
 Shutterfly Announces Fourth Quarter and Full Year 2017 Financial Results January 30, 2018 REDWOOD CITY, Calif.--(BUSINESS WIRE)--Jan. 30, 2018-- (NASDAQ:SFLY), the leading online retailer and manufacturer
Shutterfly Announces Second Quarter 2017 Financial Results
 July 25, 2017 Shutterfly Announces Second Quarter 2017 Financial Results REDWOOD CITY, Calif.--(BUSINESS WIRE)-- (NASDAQ:SFLY), the leading online retailer and manufacturer of high-quality personalized
Helping people share life s joy
 Raymond James Institutional Investor Conference March 4, 2019 Helping people share life s joy 1 Safe Harbor Disclaimer This presentation contains "forward-looking" statements within the meaning of Section
Shutterfly Announces Third Quarter 2018 Financial Results
 Shutterfly Announces Third Quarter Financial Results October 30, REDWOOD CITY, Calif.--(BUSINESS WIRE)--Oct. 30, -- (NASDAQ:SFLY), the leading retailer and manufacturing platform dedicated to helping capture,
UNITED STATES SECURITIES AND EXCHANGE COMMISSION Washington, D.C FORM 8-K
 UNITED STATES SECURITIES AND EXCHANGE COMMISSION Washington, D.C. 20549 FORM 8-K CURRENT REPORT Pursuant to Section 13 or 15(d) of the Securities Exchange Act of 1934 Date of Report (Date of Earliest Event
Shutterfly Announces Second Quarter 2018 Financial Results
 Shutterfly Inc Logo Shutterfly Announces Second Quarter 2018 Financial Results August 7, 2018 REDWOOD CITY, Calif.--(BUSINESS WIRE)--Aug. 7, 2018-- (NASDAQ:SFLY), the leading online retailer and manufacturer
Mar. 31, Jun. 30, 2017
 Consolidated GAAP Statements of Operations ($ in thousands, except EPS) March 31, ended Net Revenues $921,580 $1,059,429 $1,134,224 $191,972 $209,032 $195,443 $593,755 $1,190,202 $199,725 Consumer 870,959
Q Preliminary Earnings Results Summary May 3, 2018
 Q1 2018 Preliminary Earnings Results Summary May 3, 2018 SAFE HARBOR STATEMENT This presentation may contain projections or other forward-looking statements within the meaning Section 27A of the Private
Q Preliminary Earnings Results Summary. February 1, 2018
 Q4 2017 Preliminary Earnings Results Summary February 1, 2018 SAFE HARBOR STATEMENT This presentation may contain projections or other forward-looking statements within the meaning Section 27A of the Private
Q Preliminary Earnings Results Summary. November 1, 2018
 Q3 2018 Preliminary Earnings Results Summary November 1, 2018 SAFE HARBOR STATEMENT This presentation may contain projections or other forward-looking statements within the meaning Section 27A of the Private
Mar. 31, Sept. 30, 2016
 Consolidated GAAP Statements of Operations ($ in thousands, except EPS) December 31, Quarter ended Net Revenues $783,642 $921,580 $1,059,429 $181,709 $203,961 $187,328 $561,226 $1,134,224 $191,972 $209,032
Safe Harbor and Non-GAAP Measures
 Safe Harbor and Non-GAAP Measures Forward-Looking Statements This presentation contains statements about future events and expectations that constitute forward-looking statements. Forward-looking statements
Groupon Announces Fourth Quarter and Fiscal Year 2013 Results
 February 20, 2014 Groupon Announces Fourth Quarter and Fiscal Year 2013 Results Fourth quarter gross billings of $1.6 billion, $5.8 billion for the full year Fourth quarter revenue of $768.4 million, $2.6
Safe Harbor and Non-GAAP Measures
 Safe Harbor and Non-GAAP Measures Forward-Looking Statements This presentation contains statements about future events and expectations that constitute forward-looking statements. Forward-looking statements
Safe Harbor. Non-GAAP Financial Information
 1 Safe Harbor This document contains forward-looking statements within the meaning of the Private Securities Litigation Reform Act of 1995, including financial projections subject to risks, uncertainties
Wix Reports First Quarter 2018 Results
 Wix Reports First Quarter 2018 Results Strong start to the year with all key metrics once again exceeding high end of expectations o o o Q1 revenue of $137.8 million, up 49% y/y; under ASC 605, Q1 revenue
2Q17 EARNINGS AUGUST 2017
 2Q17 EARNINGS AUGUST 2017 FORWARD-LOOKING STATEMENTS The statements contained in this release that refer to plans and expectations for the next quarter, the full year or the future are forward-looking
3 RD QUARTER 2013 RESULTS CONFERENCE CALL & WEBCAST
 3 RD QUARTER 2013 RESULTS CONFERENCE CALL & WEBCAST OCTOBER 23, 2013 8:30AM ET / 2:30PM CET NYSE: NLSN SAFE HARBOR FOR FORWARD-LOOKING STATEMENTS The following discussion contains forward-looking statements,
SAFE HARBOR STATEMENT
 SAFE HARBOR STATEMENT This presentation may contain projections or other forward-looking statements within the meaning of Section 27A of the Securities Act of 1933, as amended, and Section 21E of the Securities
Earnings Presentation. October 27, 2011
 Q1 Fiscal Year 2012 Earnings Presentation & Financial Results Supplement October 27, 2011 Safe Harbor Statement This presentation contains statements about our future expectations, plans and prospects
SAFE HARBOR STATEMENT
 SAFE HARBOR STATEMENT This presentation may contain projections or other forward-looking statements within the meaning of Section 27A of the Securities Act of 1933, as amended, and Section 21E of the Securities
Wix Reports Strong Third Quarter 2017 Results Above Expectations; Record Level of Conversion Driven by Product Enhancements
 Wix Reports Strong Third Quarter 2017 Results Above Expectations; Record Level of Conversion Driven by Product Enhancements Exceeded High End of Guidance - Revenue of $111.0 million and Collections of
2018 FOURTH QUARTER EARNINGS CALL
 NORTH AMERICA S LEADING BUILDING MATERIALS DISTRIBUTOR RESIDENTIAL COMMERCIAL INTERIOR SOLAR 2018 FOURTH QUARTER EARNINGS CALL Forward Looking Statements / Non-GAAP Measures This presentation contains
Three months ended Dec. 31,
 Wix.com Reports Fourth Quarter and Full Year 2015 Results -- Exceeded Prior Q4 and Full Year 2015 Guidance for Collections on a Constant Currency Basis, Revenue and Adjusted EBITDA -- -- Provides Strong
Coupons.com Incorporated Q Financial Results
 Coupons.com Incorporated Q2 2014 Financial Results August 6, 2014 Forward-Looking Statements This presentation and the accompanying oral presentation contain forward-looking statements that are based on
Earnings Call Presentation Q3 2018
 Earnings Call Presentation Q3 2018 Forward Looking Statements This presentation and the accompanying oral presentation contain forward-looking statements that are based on our management s beliefs and
Supplementary Materials First Quarter Fiscal 2018 Earnings Call
 Supplementary Materials First Quarter Fiscal 2018 Earnings Call November 2, 2017 Safe Harbor This document contains forwardlooking statements within the meaning of the Private Securities Litigation Reform
Third Fiscal Quarter FY19 Financial Results. November 28, 2018
 Third Fiscal Quarter FY19 Financial Results November 28, 2018 2 Forward-Looking Statements and Non-GAAP Financial Measures This presentation contains forward-looking statements that involve risks and uncertainties,
Vistaprint Reports Second Quarter Fiscal Year 2013 Financial Results
 Contacts: Investor Relations: Angela White ir@vistaprint.com +1 (781) 652-6480 Media Relations: Kaitlin Ambrogio publicrelations@vistaprint.com +1 (781) 652-6444 Vistaprint Reports Second Quarter Fiscal
CARBONITE (NASDAQ: CARB)
") CARBONITE (NASDAQ: CARB) FOURTH QUARTER AND FY 2016 FINANCIAL RESULTS Thursday, February 9 th 2017 JERRY SISITSKY VP, Investor Relations Phone: 781-928-0713 Email: investor.relations@carbonite.com (NASDAQ:
CARBONITE (NASDAQ: CARB) FOURTH QUARTER AND FY 2016 FINANCIAL RESULTS Thursday, February 9 th 2017 JERRY SISITSKY VP, Investor Relations Phone: 781-928-0713 Email: investor.relations@carbonite.com (NASDAQ:
Company Profile & Update June 2017
 Company Profile & Update June 2017 Safe Harbor Statement This presentation contains forward-looking statements, within the meaning of the Private Securities Litigation Reform Act of 1995, that involve
Investor Overview Q Slides updated as of February 21, 2018
 Investor Overview Q4 2017 Slides updated as of February 21, 2018 Safe Harbor and Non-GAAP Financial Measures This presentation contains forward-looking statements within the meaning of federal securities
Click here to edit the name of your presentation. Second Quarter Earnings Results UNDER EMBARGO UNTIL 1AM ET ON MAY 10, 2017
 Click here to edit the name of your presentation Second Quarter 2017 Earnings Results UNDER EMBARGO UNTIL 1AM ET ON MAY 10, 2017 1 Safe Harbor Non-GAAP Financial Measures To supplement its consolidated
Groupon Announces First Quarter 2015 Results
 May 5, 2015 Groupon Announces First Quarter 2015 Results Gross billings of $1.6 billion Revenue of $750.4 million Adjusted EBITDA of $72.4 million GAAP loss per share of $0.02; non-gaap earnings per share
2017 FIRST QUARTER RESULTS. Ended March 31, 2017
 2017 FIRST QUARTER RESULTS Ended March 31, 2017 Forward Looking Statements Disclaimer This presentation contains statements, including statements about future plans and expectations, which constitute forwardlooking
Earnings Conference Call Q2 Fiscal Year September 4, 2018
 Earnings Conference Call Q2 Fiscal Year 2019 September 4, 2018 Forward-Looking Statements This presentation (including the accompanying oral presentation) contains forward-looking statements within the
4Q17 EARNINGS FEBRUARY 2018
 4Q17 EARNINGS FEBRUARY 218 2 FORWARD-LOOKING STATEMENTS The statements contained in this release that refer to plans and expectations for the next quarter, the full year or the future are forward-looking
Earnings Highlights. Q1 Operating. Metrics. Q1 Financial. Metrics. Strong start to the year with revenue and collections both exceeding expectations
 Q1 Operating Metrics New Registered Users Added 5.9 M Net Premium Subscriptions Added 231 K Total Registered Users 125 M (+21% y/y) Total Premium Subscriptions 3.5 M (+29% y/y) Earnings Highlights Strong
Digital Turbine Reports Fiscal 2019 Third Quarter Results
 February 5, 2019 Digital Turbine Reports Fiscal 2019 Third Quarter Results Revenue from Continuing Operations of $30.4 Million Represented 34% Annual Growth Gross Margin Expansion and Operating Leverage
Wix Reports Strong Third Quarter 2016 Results, Exceeding Expectations Leading to Significant Increase in Full Year Outlook
 Wix Reports Strong Third Quarter 2016 Results, Exceeding Expectations Leading to Significant Increase in Full Year Outlook Exceeded High End of Guidance Range with Strong Top-Line Growth and Record Adjusted
Click here to edit the name of your presentation. Fourth Quarter and Full Year Earnings Results
 Click here to edit the name of your presentation Fourth Quarter and Full Year 2016 Earnings Results 1 Safe Harbor Forward-Looking Statements This presentation contains forward-looking statements, within
Q3 Fiscal Year 2018 Investor Presentation Financial Results Conference Call
 February Sept 6, 2018 2017 Q3 Fiscal Year 2018 Investor Presentation Financial Results Conference Call Mark D. Morelli President and Chief Executive Officer Gregory P. Rustowicz Vice President Finance
MTS REPORTS FISCAL 2018 FIRST QUARTER FINANCIAL RESULTS
 MTS Systems Corporation 14000 Technology Drive Eden Prairie, MN 55344-2290 Telephone 952-937-4000 Fax 952-937-4515 News Release FOR IMMEDIATE RELEASE February 5, 2018 MTS REPORTS FISCAL 2018 FIRST QUARTER
1Q18 EARNINGS MAY 2018
 1Q18 EARNINGS MAY 2018 FORWARD-LOOKING STATEMENTS The statements contained in this release that refer to plans and expectations for the next quarter, the full year or the future are forward-looking statements
Safe Harbor Statement
 May 2018 Safe Harbor Statement This presentation contains forward-looking statements, within the meaning of the Private Securities Litigation Reform Act of 1995, that involve risks and uncertainties, including
Safe Harbor and Non-GAAP Measures
 Safe Harbor and Non-GAAP Measures Forward-Looking Statements This presentation contains statements about future events and expectations that constitute forward-looking statements. Forward-looking statements
Wix.com Reports Second Quarter 2015 Results
 August 5, 2015 Wix.com Reports Second Quarter 2015 Results Reports Strong Top Line Growth and Positive Adjusted EBITDA and Free Cash Flow, Becoming a Unique Combination of High Growth and Profitability
Q4 FY18 Financial Update
 Q4 FY8 Financial Update Salesforce NYSE: CRM @Salesforce_ir Safe Harbor "Safe harbor" statement under the Private Securities Litigation Reform Act of 995: This presentation contains forward-looking statements
NetApp Q4 and Fiscal Year 2013 Earnings Results
 NetApp Q4 and Fiscal Year 2013 Earnings Results Supplemental Commentary May 21, 2013 This supplemental commentary is provided concurrently with our earnings press release to allow for additional time to
Glu Mobile Inc. Q118 Earnings Call. May 1, 2018
 Glu Mobile Inc. Q118 Earnings Call May 1, 2018 Safe Harbor Statement This presentation contains "forward-looking" statements including those regarding our Q2 2018 and FY 2018 non-gaap guidance and statements
THIRD QUARTER FISCAL 2019 EARNINGS CALL PROVIDING THE BEST SOLUTIONS MARCH 7, 2019
 PROVIDING THE BEST SOLUTIONS THIRD QUARTER FISCAL 2019 EARNINGS CALL MARCH 7, 2019 Safe Harbor Statement Forward-Looking Statements This presentation contains forward-looking statements within the meaning
FOR IMMEDIATE RELEASE
 FOR IMMEDIATE RELEASE For media inquiries, contact: Eric Armstrong, Citrix Systems, Inc. (954) 267-2977 or eric.armstrong@citrix.com For investor inquiries, contact: Eduardo Fleites, Citrix Systems, Inc.
Trimble Reports First Quarter Revenue of $289.0 Million and Non-GAAP Earnings Per Share of $0.28
 Trimble Reports First Quarter Revenue of $289.0 Million and Non-GAAP Earnings Per Share of $0.28 SUNNYVALE, Calif., April 28, 2009 /PRNewswire-FirstCall via COMTEX News Network/ -- Trimble (Nasdaq: TRMB)
2017 SECOND QUARTER RESULTS. Ended June 30, 2017
 2017 SECOND QUARTER RESULTS Ended June 30, 2017 Forward Looking Statements Disclaimer This presentation contains statements, including statements about future plans and expectations, which constitute forwardlooking
Helping people share life s joy
 2017 Helping people share life s joy 1 Safe Harbor Disclaimer This presentation contains "forward-looking" statements within the meaning of Section 27A of the Securities Act of 1933, as amended, and Section
Q3 FY18 Financial Update
 Q3 FY18 Financial Update Salesforce NYSE: CRM @Salesforce_ir Safe Harbor Safe harbor statement under the Private Securities Litigation Reform Act of 1995: This presentation contains forward-looking statements
j2 Global Reports Fourth Quarter and Year End 2018 Results and Provides 2019 Outlook
 j2 Global Reports Fourth Quarter and Year End 2018 Results and Provides 2019 Outlook February 12, 2019 Achieves Record Revenues Provides Fiscal 2019 Financial Estimates Announces Thirtieth Consecutive
Glu Mobile Inc. Q417 Earnings Call. February 8, 2018
 Glu Mobile Inc. Q417 Earnings Call February 8, 2018 Safe Harbor Statement This presentation contains "forward-looking" statements including those regarding our Q1 2018 and FY 2018 non-gaap guidance and
Q2 Fiscal 2018 Earnings Presentation. July 26, 2018
 Q2 Fiscal 2018 Earnings Presentation July 26, 2018 FORWARD LOOKING STATEMENTS AND OTHER IMPORTANT CAUTIONS This presentation contains certain forward-looking statements within the meaning of the Private
j2 Global Reports Third Quarter 2018 Results
 j2 Global Reports Third Quarter 2018 Results November 6, 2018 Achieves Record Third Quarter Revenues (up 7.0% to $292.7 million vs. Q3 2017) Announces Twenty-Ninth Consecutive Quarterly Dividend Increase
Glu Mobile Inc. Q Earnings Call August 1, 2017
 Glu Mobile Inc. Q2 2017 Earnings Call August 1, 2017 Safe Harbor Statement 2 This presentation contains "forward-looking" statements including: that Glu s strong Q2-2017 demonstrates continued progress
Earnings Results. Third Quarter 2017
 Earnings Results Third Quarter 2017 1 Safe Harbor Non-GAAP Financial Measures To supplement its consolidated financial statements, which are prepared and presented in accordance with U.S. GAAP, Wix uses
Citrix Announces Leadership Transition to Accelerate Cloud Transformation, Enhance Profitability and Return Capital to Shareholders
 FOR IMMEDIATE RELEASE Citrix Announces Leadership Transition to Accelerate Cloud Transformation, Enhance Profitability and Return Capital to Shareholders David J. Henshall Appointed President and Chief
One Fix at a Time, One Client at a Time
 One Fix at a Time, One Client at a Time To illustrate the client and stylist interactions during a Fix order, we ve included an example below. 1. Rebecca ordered Fixes on-demand before becoming a Style
Fiscal 2019 First Quarter Results. October 30, 2018
 Fiscal 2019 First Quarter Results October 30, 2018 Safe Harbor This presentation contains forward-looking statements within the meaning of Section 27A of the Securities Act of 1933, as amended, and Section
Castlight Health. Q Financial & Business Update May 10, 2018 Q1 FY
 Castlight Health Q1 2018 Financial & Business Update May 10, 2018 Q1 FY 2018 1 Safe Harbor Statement This presentation contains forward-looking statements regarding our trends, our strategies and the anticipated
HealthEquity Reports Fourth Quarter and Fiscal Year Ended January 31, 2018 Financial Results
 HealthEquity Reports Fourth Quarter and Fiscal Year Ended January 31, 2018 Financial Results Highlights of the fiscal year include: Revenue of $229.5 million, an increase of 29% compared to FY17. Net income
Q FINANCIAL HIGHLIGHTS. January 29, 2019
 Q4 FINANCIAL HIGHLIGHTS January 29, 2019 DISCLOSURES This presentation contains non-gaap measures relating to our performance. You can find the reconciliation of these measures to the nearest comparable
1Q15 Earnings May 2015
 1Q15 Earnings May 2015 Forward-Looking Statements The statements contained in this presentation that refer to plans and expectations for the next quarter, the full year or the future are forward-looking
Company Overview. F e b r u a r y M a r c h 2018
 Company Overview F e b r u a r y M a r c h 2018 Safe Harbor Non-GAAP Financial Measures To supplement its consolidated financial statements, which are prepared and presented in accordance with U.S. GAAP,
AKAMAI REPORTS FIRST QUARTER 2014 FINANCIAL RESULTS
 FOR IMMEDIATE RELEASE Contacts: Jeff Young Tom Barth Media Relations Investor Relations Akamai Technologies Akamai Technologies 617-444-3913 617-274-7130 jyoung@akamai.com tbarth@akamai.com AKAMAI REPORTS
Earnings Conference Call Q1 Fiscal Year June 4, 2018
 Earnings Conference Call Q1 Fiscal Year 2019 June 4, 2018 Forward-Looking Statements This presentation (including the accompanying oral presentation) contains forward-looking statements within the meaning
Bottomline Technologies Reconciliation to Non GAAP Measures Three Months Ended June 30, 2013
 Reconciliation to Measures Three Months Ended June 30, 2013 Non Cash Amortization of Equity Based Integration Restructuring Interest GAAP Intangible Assets Compensation Related Expenses Expenses Expense
Q FINANCIAL HIGHLIGHTS. January 31, 2018
 Q4 FINANCIAL HIGHLIGHTS January 31, 2018 DISCLOSURES This presentation contains non-gaap measures relating to our performance. You can find the reconciliation of these measures to the nearest comparable
Fiscal Fourth Quarter Ended June 30, 2018
 Fiscal 2018 Fourth Quarter Ended June 30, 2018 Safe harbor This presentation contains certain forward-looking statements concerning Matrix Service Company s operations, economic performance and management
Castlight Health Q Financial & Business Update October 25, 2017
 Castlight Health Q3 2017 Financial & Business Update October 25, 2017 Q3 FY 2017 1 This presentation contains forward-looking statements regarding our trends, our strategies and the anticipated performance
MSCI THIRD QUARTER 2016
 MSCI THIRD QUARTER 2016 Earnings Presentation October 27, 2016 2016 MSCI Inc. All rights reserved. Please refer to the disclaimer at the end of this document. FORWARD-LOOKING STATEMENTS Forward-Looking
Q3 FY 18 Financial Results
 Q3 FY 18 Financial Results February 6, 2018. Forward-Looking Statements and Non-GAAP Financial Measures This presentation contains forward-looking statements, as that term is defined under the federal
Verisign Q Earnings Conference Call. October 25, 2012
 Verisign Q3 2012 Earnings Conference Call October 25, 2012 Safe Harbor Disclosure Statements in this announcement other than historical data and information constitute forwardlooking statements within
Wix.com Reports First Quarter 2016 Results
 Wix.com Reports First Quarter 2016 Results Exceeded High End of Q1 Guidance for Collections, Revenue and Adjusted EBITDA Results Highlighted by a Unique Combination of Record Registered User Growth and
Dean Foods. Earnings Report. February 11, 2009
 Dean Foods Fourth Quarter and Year End 2008 Earnings Report February 11, 2009 Forward Looking Statements The following statements made in this presentation are forward looking and are made pursuant to
Investor Presentation. Third Quarter 2018
 Investor Presentation Third Quarter 2018 Safe Harbor and Other Information This presentation contains forward looking statements that are based on our management s beliefs and assumptions and on information
j2 Global Reports Fourth Quarter and Year End 2016 Results and Provides 2017 Outlook
 February 9, 2017 j2 Global Reports Fourth Quarter and Year End 2016 Results and Provides 2017 Outlook Achieves Record Annual Revenues GAAP Diluted EPS Provides Fiscal 2017 Financial Estimates Announces
4 TH QUARTER AND FULL YEAR 2012 RESULTS
 4 TH QUARTER AND FULL YEAR 2012 RESULTS CONFERENCE CALL & WEBCAST FEBRUARY 11, 2013 5:00 PM ET NYSE: NLSN SAFE HARBOR FOR FORWARD-LOOKING STATEMENTS The following discussion contains forward-looking statements,
Revenue $144M $134M $119M $110M $102M $89M $76M $71M $61M $55M $46M $150 $125 $100 $50 $25
 Revenue ($M) $150 $134M $144M $125 $100 $89M $102M $110M $119M $75 $50 $46M $55M $61M $71M $76M $25 $0 Q1'13 Q2'13 Q3'13 Q4'13 Q1'14 Q2'14 Q3'14 Q4'14 Q1'15 Q2'15 Q3'15 1 Adj. EBITDA ($M) Adjusted EBITDA
Q2 Fiscal 2019 Letter to Shareholders
 Q2 Fiscal 2019 Letter to Shareholders How Data Science is Woven into the Fabric of Stitch Fix To illustrate the pervasiveness of data science and algorithms across our business, here s an example that
Verisign Q Earnings Conference Call. July 26, 2012
 Verisign Q2 2012 Earnings Conference Call July 26, 2012 Safe Harbor Disclosure Statements in this announcement other than historical data and information constitute forward-looking statements within the
Fiscal Year 2016 Q4 EARNINGS CALL PRESENTATION
 Fiscal Year 2016 Q4 EARNINGS CALL PRESENTATION Today s Agenda Introduction Curt Riggle Vice President, Investor Relations Management Overview Horacio Rozanski President and Chief Executive Officer Financial
Vistaprint Reports First Quarter Fiscal Year 2012 Financial Results
 Contacts: Investor Relations: Angela White ir@vistaprint.com +1 (781) 652-6480 Media Relations: Jason Keith publicrelations@vistaprint.com +1 (781) 652-6444 Vistaprint Reports First Quarter Fiscal Year
August 7, Fellow Calix stockholders:
 August 7, 2018 Fellow Calix stockholders: Our mission is to connect everyone and everything. Calix platforms empower our customers to build new business models, rapidly deploy new services and make the