GOPRO BY THE NUMBERS IPO IN JUNE ESTABLISHED IN HQ IN EMPLOYEES. >14mm capture devices sold; #1 camera/camcorder by $ share in U.S.
|
|
|
- Jocelin Park
- 5 years ago
- Views:
Transcription

1
2 These slides and the accompanying oral presentation contain projections or other forward-looking statements. All statements other than statements of historical fact contained in this presentation, including statements regarding future results of operations and financial position of GoPro, Inc. ( GoPro or the Company ), including financial targets, business strategy, and plans and objectives for future operations, are forward-looking statements. These statements involve risks and uncertainties, and actual events or results may differ materially. Among the important factors that could cause actual results to differ materially from those in the forward-looking statements are the effects of the highly competitive market in which we operate; our dependence on sales of our capture devices for substantially all of our revenue; our reliance on third-party suppliers, some of which are sole-source suppliers, to provide components for our products; the fact that we do not expect to continue to grow in the future at the same rate as we have in the past, and profitability in recent periods might not be indicative of future performance; difficulty in accurately predicting our future customer demand; the importance of maintaining the value and reputation of our brand; any inability to successfully manage frequent product introductions and transitions; the effects of international business uncertainties; our reliance on our Chief Executive Officer; and other factors detailed in the Risk Factors section of the final prospectus that we filed with the Securities and Exchange Commission in connection with our public offering. These forward-looking statements speak only as of the date hereof or as of the date otherwise stated herein. GoPro disclaims any obligation to update these forward-looking statements. In addition to U.S. GAAP financials, this presentation includes certain non-gaap financial measures, including adjusted EBITDA, non-gaap Gross Margin and non-gaap Operating Income. These non-gaap measures are in addition to, not a substitute for or superior to, measures of financial performance prepared in accordance with U.S. GAAP. The non-gaap financial measures used by GoPro may differ from the non-gaap financial measures used by other companies. A reconciliation of these measures to the most directly comparable U.S. GAAP measure is included in the Appendix to these slides. Certain data in this presentation was obtained from various external sources, and neither the Company nor its affiliates, advisers or representatives has verified such data with independent sources. Accordingly, neither the Company nor any of its affiliates, advisers or representatives makes any representations as to the accuracy or completeness of that data or to update such data after the date of this presentation. Such data involves risks and uncertainties and is subject to change based on various factors. The trademarks included herein are the property of the owners thereof and are used for reference purposes only. Such use should not be construed as an endorsement of the products or services of the Company or this proposed offering.


3 GOPRO BY THE NUMBERS ESTABLISHED IN HQ IN EMPLOYEES IPO IN JUNE >14mm capture devices sold; #1 camera/camcorder by $ share in U.S. 25,000+ retail outlets in 100+ countries 16mm GoPro App downloads 40,000 videos exported per day using GoPro Studio >3.9 years of content uploaded to YouTube in 2014 with GoPro in title $363mm revenue in Q1 15, up 54% YoY Sources: NPD, Google, GoPro as of 3/31/2015
4 1Q15 HIGHLIGHTS Key Financial Metrics for Q Revenue of $363mm, up 54% YoY Combined EMEA and APAC revenue up 66% YoY Gross margin of 45.2%, up 410 bps YoY Agreed to acquire Kolor, a leader in virtual reality and spherical media solutions The 5 top selling camera/camcorders in the US are GoPros Study in 9 countries showed 70% YoY increase in awareness of GoPro Submissions to GoPro's Photo/Video of the Day program increased 50% QoQ NOTE: Non-GAAP metrics, see reconciliation in Appendix; Top Selling on a Unit Basis according to NPD for Q1 15; IPOS study commissioned by GoPro measuring aided awareness


5 ABOUT US what we make World s Most Versatile Capture Devices what we do Enable Engaging Content

6 Why GoPro Matters People are spending more time online sharing personal experiences through photos and video GoPro enables them to self-capture and share their experiences in the most engaging and immersive way
7 OUR MODEL: A VIRTUOUS CYCLE CAPTURE, MANAGE, SHARE ENGAGING CONTENT VIRALLY SCALES AWARENESS + ENTHUSIASM


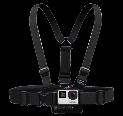
8 MARKET LEADING PRODUCT LINE

 Note: Portable navigation device market representative of mature CE market.")
9 ATTRACTIVE MARKET OPPORTUNITY ANNUAL UNIT MARKET OPPORTUNITY CONTENT DRIVEN MODEL CREATES ORGANIC MEDIA OPPORTUNITIES NEW MEDIA CAPTURE OPPORTUNITIES Software Services Advertising Linear programming Licensing OTT DIGITAL CAMERAS & CAMCORDERS 90mm+ MATURE CE PRODUCTS 30mm+ 5.7mm units (TTM) Note: Portable navigation device market representative of mature CE market. Source: IDC 2013, Technavio.


10 OUR MISSION: ELIMINATE THE PAIN POINTS OF CAPTURING, MANAGING AND SHARING ENGAGING CONTENT CAPTURE MANAGE MAXIMIZE SHARING & ENJOYMENT Cross Platform Content Management & Editing Solution


11 CONTENT MANAGEMENT TODAY As of 3/31/2015


12 GOPRO CONTENT MANAGEMENT TOMORROW Integrated content management platform


13 INVESTING IN GROWTH Agreement to Acquire France-based Kolor: A leader in virtual reality (VR) and spherical media solutions Enables the viewing of immersive, spherical content (gopro.com/spherical) Software and Entertainment: Operating expenses up over 110% YoY for 1Q15 Hiring world-class engineering talent International: Expanding throughout EMEA, APAC and Latin America NOTE: Operating expenses as noted are non-gaap metrics. See reconciliation in Appendix.


14 ENGAGING CONTENT DRIVES VIEWERSHIP CONSUMER ENGAGEMENT 3.9 YEARS of video uploaded to YouTube with GoPro in the title in 2014 TOP 10 BRAND CHANNEL on Instagram in MILLION LIKES on GoPro s Facebook page through Q MILLION VIEWS of videos on GoPro s YouTube Channel through Q >45 MILLION VIEWS of GoPro s Adventures of Life in 4k RECENT PROFESSIONALLY PRODUCED NHL GoPros used on players and referees during live broadcast of NHL all-star game Winter X-Games GoPros used on Athletes and by camera men during live broadcast of ESPN s X-Games The Adventure of Life in 4K GoPro-produced short form videos documenting life in 4K 14


15 THE BIG PICTURE Leverage hardware success to scale consumer-driven media business that in turn scales hardware business, circularly


16 STRATEGIC MARKETING AND BRANDING TV TOP TIER EVENTS SOCIAL 130+ ATHLETES Kelly Slater Shaun White MARKETING CONSUMER MARKETING LIFESTYLE MARKETING OUT-OF-HOME ADVERTISING PRINT ADS RESORTS / CAMPS GLOBAL TRADESHOWS CHANNEL MARKETING

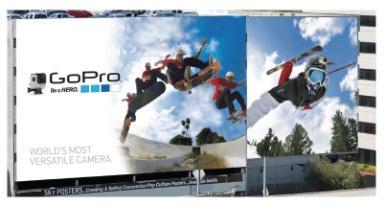
17 DISTRIBUTION POINT OF PURCHASE Custom video-enabled point-of-purchase displays distributed in over 25,000 retail locations, globally Available in 2ft, 3ft and 4ft and 12ft footprints New 12 ft POP display

18 STRONG NETWORK OF DIRECT AND DISTRIBUTOR SALES BIG BOX RETAIL MID MARKET RETAIL SPECIALTY RETAIL STRONG NETWORK OF INTERNATIONAL DISTRIBUTORS DIRECT -> 45% OF Q1 15 REVENUE GLOBAL FOOTPRINT 25,000+ Retail Locations, 100+ countries DISTRIBUTION -> 55% OF Q1 15 REVENUE

19 SIGNIFICANT BARRIERS TO ENTRY Meaningful investment in product development over 300 engineers Aspirational brand with #1 market position Unparalleled social engagement compelling and engaging content drives viewership and adoption Sophisticated and efficient global supply chain Mission to eliminate pain points of capturing, managing and sharing engaging content Extensive multifaceted marketing efforts POP displays as unique marketing tool Global distribution footprint 25,000+ retail outlets in 100+ countries


20 FINANCIAL OVERVIEW

21 RAPID REVENUE GROWTH REVENUE CAPTURE DEVICE UNITS SHIPPED $ in Millions $1,394 Units in Millions 5.2 $ $ $64 $234 $236 $ Q1 14 Q Q1 14 Q % yoy +58% yoy

22 QUARTERLY TRENDS QUARTERLY REVENUE $ in millions QUARTERLY GROSS MARGIN* $ % 41.1% 42.2% 44.5% 48.0% 45.2% 35.2% 32.3% 33.5% $361 $363 $255 $177 $192 $236 $244 $280 Q Q Q Q Q Q Q Q Q Q Q Q Q Q Q Q Q Q * Non-GAAP metrics. See reconciliation in Appendix.

23 SELECTED METRICS Q Q ADJUSTED EBITDA $134mm $293mm $29mm $57mm DAYS SALES OUTSTANDING ANNUALIZED INVENTORY TURNS CASH, CASH EQUIVALENTS & MARKETABLE SECURITIES $101mm $422mm $111mm $492mm
24 PRO FORMA LONG-TERM MODEL Q Q Long-Term Target GROSS MARGIN % 41.1% 45.1% 45.2% 42-44% OPERATING EXPENSES % 32.3% 26.5% 31.7% 24-26% OPERATING MARGIN % 8.9% 18.6% 13.5% 18-20% ADJUSTED EBITDA % 12.1% 21.0% 15.6% 21-23% NOTE: Target model is pro forma. See Appendix for calculation of pro forma financials
25 SUMMARY Aspirational brand with #1 market position Innovative HERO4 family of products Disrupting existing markets worldwide Investing in talent, technology and software to fuel content-driven model Developing an ecosystem of partners and products Strong financial results with 54% YoY growth and increasing profitability for Q NOTE: Non-GAAP metrics, see reconciliation in Appendix
26
27 To supplement our unaudited selected financial data presented on a basis consistent with GAAP, we disclose certain non-gaap financial measures, including non-gaap gross profit, operating expenses, operating income, net income, earnings per share and adjusted EBITDA. These non-gaap measures are not in accordance with, nor serve as an alternative for GAAP. We believe that these non-gaap measures have limitations in that they do not reflect all of the amounts associated with our GAAP results of operations. These non-gaap measures should only be viewed in conjunction with corresponding GAAP measures. In calculating non-gaap financial measures, we exclude certain items to facilitate a review of the comparability of our core operating performance on a period-to-period basis. The excluded items represent stock-based compensation and charges that are primarily driven by discrete events that we do not consider to be directly related to core operating performance. We use non-gaap measures to evaluate the core operating performance of our business, for comparison with forecasts and strategic plans and for calculating return on investment. In addition, management s incentive compensation is determined using non-gaap measures. Since we find these measures to be useful, we believe that investors benefit from seeing results reviewed by management in addition to seeing GAAP results. We believe that these non-gaap measures, when read in conjunction with our GAAP financials, provide useful information to investors by facilitating: the comparability of our on-going operating results over the periods presented; the ability to identify trends in our underlying business; and the comparison of our operating results against analyst financial models and operating results of other public companies that supplement their GAAP results with non-gaap financial measures.
28 The following are explanations of each type of adjustment that we incorporate into non-gaap financial measures: Stock-based compensation expense relates to equity awards granted primarily to our workforce. We exclude stock-based compensation expense because we believe that the non-gaap financial measures excluding this item provide meaningful supplemental information regarding operational performance. In particular, we note that companies calculate stock-based compensation expense for the variety of award types that they employ using different valuation methodologies and subjective assumptions. These non-cash charges are not factored into our internal evaluation of net income as we believe their inclusion would hinder our ability to assess core operational performance. We believe that excluding this expense provides greater visibility to the underlying performance of our business operations, facilitates comparison of our results with other periods, and may also facilitate comparison with the results of other companies in our industry. Acquisition-related charges include the amortization of acquired intangible assets primarily consisting of acquired technology, customer relationships, tradenames and covenants not to compete related to our acquisitions. These charges are not factored into our evaluation of potential acquisitions, or of our performance after completion of acquisitions, because they are not related to our core operating performance, and the frequency and amount of such charges vary significantly based on the timing and magnitude of our acquisition transactions and the maturities of the businesses being acquired. Adjustment for taxes relates to the tax effect of the adjustments that we incorporate into non-gaap measures in order to provide a more meaningful measure of non-gaap net income. We believe that these adjustments provide us with the ability to more clearly view trends in our core operating performance. Adjustment to shares includes the conversion of the redeemable convertible preferred stock into shares of common stock as though the conversion had occurred at the beginning of the period and the initial public offering shares issued July 2014, as if they had been outstanding since the beginning of the period.
29 Reconciliations of non-gaap financial measures are set forth below (in thousands, except per share data): Three months ended March 31, 2014 March 31, 2015 GAAP net income $ 11,049 $ 16,752 Stock-based compensation Cost of revenue Research and development 1,401 3,535 Sales and marketing 1,414 3,066 General and administrative 1,054 19,617 Total stock-based compensation 4,037 26,501 Amortization of acquisition-related intangible assets Cost of revenue Research and development Sales and marketing Total amortization of acquisition-related intangible assets Income tax adjustments (1,088) (7,976) Non-GAAP net income $ 14,282 $ 35,619 GAAP shares for diluted net income per share 100, ,573 Add: preferred shares conversion 30,523 - Add: initial public offering shares 8,900 - Non-GAAP shares for diluted net income per share 140, ,573 Non-GAAP diluted net income per share $ 0.10 $ 0.24
30 Reconciliations of non-gaap financial measures are set forth below ($ in thousands): Three months ended March 31, 2014 March 31, 2015 GAAP gross profit $ 96,514 $ 163,733 Stock-based compensation Amortization of acquisition-related intangible assets Non-GAAP gross profit $ 96,904 $ 164,238 GAAP gross profit as a % of revenue 40.9% 45.1% Stock-based compensation Amortization of acquisition-related intangible assets 0.1 Non-GAAP gross profit as a % of revenue 41.1% 45.2% GAAP operating expenses $ 79,958 $ 141,465 Stock-based compensation (3,869) (26,218) Amortization of acquisition-related intangible assets (62) (120) Non-GAAP operating expenses $ 76,027 $ 115,127 GAAP operating income $ 16,556 $ 22,268 Stock-based compensation 4,037 26,501 Amortization of acquisition-related intangible assets Non-GAAP operating income $ 20,877 $ 49,111 GAAP operating income as a % of revenue 7.0% 6.1% Stock-based compensation Amortization of acquisition-related intangible assets Non-GAAP operating income as a % of revenue 8.9% 13.5%
31 Reconciliations of non-gaap financial measures are set forth below ($ in thousands): Three months ended March 31, 2014 March 31, 2015 GAAP net income $ 11,049 $ 16,752 Income tax expense 3,882 3,272 Interest expense, net 1, Depreciation and amortization 3,811 5,369 POP display amortization 4,513 4,548 Stock-based compensation 4,037 26,501 Adjusted EBITDA $ 28,627 $ 56,507
32
SAFE HARBOR STATEMENT
 SAFE HARBOR STATEMENT This presentation may contain projections or other forward-looking statements within the meaning of Section 27A of the Securities Act of 1933, as amended, and Section 21E of the Securities
SAFE HARBOR STATEMENT
 SAFE HARBOR STATEMENT This presentation may contain projections or other forward-looking statements within the meaning of Section 27A of the Securities Act of 1933, as amended, and Section 21E of the Securities
SAFE HARBOR STATEMENT
 SAFE HARBOR STATEMENT This presentation may contain projections or other forward-looking statements within the meaning of Section 27A of the Securities Act of 1933, as amended, and Section 21E of the Securities
UNITED STATES SECURITIES AND EXCHANGE COMMISSION Washington, D.C FORM 8-K
 UNITED STATES SECURITIES AND EXCHANGE COMMISSION Washington, D.C. 20549 FORM 8-K CURRENT REPORT PURSUANT TO SECTION 13 OR 15(D) OF THE SECURITIES EXCHANGE ACT OF 1934 Date of Report (Date of earliest event
ESTABLISHED IN 2004 HQ IN SAN MATEO 26M+ CAMERAS 1 IPO IN JUNE 2014
 This presentation may contain projections or other forward-looking statements within the meaning of Section 27A of the Securities Act of 1933, as amended, and Section 21E of the Securities Exchange Act
GoPro Announces Fourth Quarter and Full Year 2016 Results
 NEWS RELEASE GoPro Announces Fourth Quarter and Full Year Results 2/2/2017 SAN MATEO, Calif., Feb. 2, 2017 /PRNewswire/ -- Second Highest Revenue Quarter in Company History Record Quarterly Revenue for
GoPro Announces Third Quarter 2017 Results
 NEWS RELEASE GoPro Announces Third Quarter Results 11/1/ Revenue Up 37% YoY; 40% Gross Margin GAAP & Non-GAAP Profitable in Q3 Launches HERO6 -- Available On-Shelf Globally Fusion Spherical Camera Shipping
Q Preliminary Earnings Results Summary May 3, 2018
 Q1 2018 Preliminary Earnings Results Summary May 3, 2018 SAFE HARBOR STATEMENT This presentation may contain projections or other forward-looking statements within the meaning Section 27A of the Private
Q Preliminary Earnings Results Summary. February 1, 2018
 Q4 2017 Preliminary Earnings Results Summary February 1, 2018 SAFE HARBOR STATEMENT This presentation may contain projections or other forward-looking statements within the meaning Section 27A of the Private
Q Preliminary Earnings Results Summary. November 1, 2018
 Q3 2018 Preliminary Earnings Results Summary November 1, 2018 SAFE HARBOR STATEMENT This presentation may contain projections or other forward-looking statements within the meaning Section 27A of the Private
GOPRO, INC. (Exact name of registrant as specified in its charter)
") UNITED STATES SECURITIES AND EXCHANGE COMMISSION Washington, D.C. 20549 FORM 8-K CURRENT REPORT PURSUANT TO SECTION 13 OR 15(D) OF THE SECURITIES EXCHANGE ACT OF 1934 Date of Report (Date of earliest event
UNITED STATES SECURITIES AND EXCHANGE COMMISSION Washington, D.C. 20549 FORM 8-K CURRENT REPORT PURSUANT TO SECTION 13 OR 15(D) OF THE SECURITIES EXCHANGE ACT OF 1934 Date of Report (Date of earliest event
GoPro Announces Third Quarter 2018 Results
 NEWS RELEASE GoPro Announces Third Quarter 2018 Results 11/1/2018 Revenue of $286 Million HERO7 Black Achieves Strongest Month-One Unit Sell-Through in Company History GoPro Plus Subscribers Grow 16% Sequentially
GOPRO, INC. (Exact name of registrant as specified in its charter)
") UNITED STATES SECURITIES AND EXCHANGE COMMISSION Washington, D.C. 20549 FORM 8-K CURRENT REPORT PURSUANT TO SECTION 13 OR 15(D) OF THE SECURITIES EXCHANGE ACT OF 1934 Date of Report (Date of earliest event
UNITED STATES SECURITIES AND EXCHANGE COMMISSION Washington, D.C. 20549 FORM 8-K CURRENT REPORT PURSUANT TO SECTION 13 OR 15(D) OF THE SECURITIES EXCHANGE ACT OF 1934 Date of Report (Date of earliest event
W W E Q 4 A N D F U L L Y E A R R E S U LT S F E B R U A R Y 8,
 W W E Q 4 A N D F U L L Y E A R 2 0 7 R E S U LT S F E B R U A R Y 8, 2 0 8 Forward-Looking Statements This presentation contains forward-looking statements pursuant to the safe harbor provisions of the
WWE INVESTOR PRESENTATION
 WWE INVESTOR PRESENTATION FORWARD-LOOKING STATEMENTS This presentation contains forward-looking statements pursuant to the safe harbor provisions of the Securities Litigation Reform Act of 1995, which
WWE INVESTOR PRESENTATION
 WWE INVESTOR PRESENTATION FORWARD-LOOKING STATEMENTS This presentation contains forward-looking statements pursuant to the safe harbor provisions of the Securities Litigation Reform Act of 1995, which
Kate Schlomann. Thomas & Friends brand leader
 Forward-Looking Statements/Regulation G FORWARD-LOOKING STATEMENTS: This presentation contains a number of forward-looking statements within the meaning of the Private Securities Litigation Reform Act
Cinedigm Announces Second Quarter Fiscal 2019 Financial Results
 Cinedigm Announces Second Quarter Fiscal 2019 Financial Results November 14, 2018 Net Loss Reduced by $4.0 million or 53%; OTT Channel Revenues Up 23%; Strategic Transition to OTT Business Model Continues
SNAP INTERACTIVE, INC. Third Quarter 2017 Earnings Call November 7, 2017
 SNAP INTERACTIVE, INC. Third Quarter 2017 Earnings Call November 7, 2017 SAFE HARBOR This presentation is for discussion purposes only. The material is based upon information that we consider reliable,
NLSN 4Q and FY 2011 Investor Presentation
 NLSN 4Q and FY 2011 Investor Presentation Forward Looking Statements The following discussion contains forward-looking statements, including those about Nielsen s outlook and prospects, in the meaning
Performance Food Group Company Reports First-Quarter Fiscal 2018 Results
 NEWS RELEASE For Immediate Release November 8, 2017 Investors: Michael D. Neese VP, Investor Relations (804) 287-8126 michael.neese@pfgc.com Media: Joe Vagi Manager, Corporate Communications (804) 484-7737
WWE INVESTOR PRESENTATION
 WWE INVESTOR PRESENTATION FORWARD-LOOKING STATEMENTS This presentation contains forward-looking statements pursuant to the safe harbor provisions of the Securities Litigation Reform Act of 1995, which
Fitbit Reports $574M Q416 and $2.17B FY16 Revenue, Sells 6.5M devices in Q416 and 22.3M devices in FY16
 NEWS RELEASE Fitbit Reports $574M Q416 and $2.17B FY16 Revenue, Sells 6.5M devices in Q416 and 22.3M devices in FY16 2/22/2017 SAN FRANCISCO--(BUSINESS WIRE)-- Fitbit, Inc. (NYSE:FIT), the leader in the
FORWARD-LOOKING STATEMENTS
 WWE INVESTOR PRESENTATION DECEMBER 2018 FORWARD-LOOKING STATEMENTS This presentation contains forward-looking statements pursuant to the safe harbor provisions of the Securities Litigation Reform Act of
Q Earnings Results
 2015 Earnings Results 1 Safe Harbor Forward-Looking Statements This presentation contains forward-looking statements, within the meaning of the safe harbor provisions of the Private Securities Litigation
Investors: Michael D. Neese VP, Investor Relations (804)
") NEWS RELEASE For Immediate Release August 17, 2016 Investors: Michael D. Neese VP, Investor Relations (804) 287-8126 michael.neese@pfgc.com Media: Joe Vagi Manager, Corporate Communications (804) 484-7737
NEWS RELEASE For Immediate Release August 17, 2016 Investors: Michael D. Neese VP, Investor Relations (804) 287-8126 michael.neese@pfgc.com Media: Joe Vagi Manager, Corporate Communications (804) 484-7737
Fourth Quarter 2017 Earnings Presentation
 Fourth Quarter 2017 Earnings Presentation Safe Harbor Statement This document may contain certain forward-looking statements within the meaning of the Private Securities Litigation Reform Act of 1995.
SunTrust 2018 Internet & Digital Media Conference. May 8, 2018
 SunTrust 2018 Internet & Digital Media Conference May 8, 2018 SAFE HARBOR STATEMENT This presentation is for informational purposes only and is not an offer to sell securities or a solicitation of an offer
CARS.COM. Third Quarter 2017 Earnings November 8, 2017
 CARS.COM Third Quarter 2017 Earnings November 8, 2017 Forward Looking Statements This presentation contains forward looking statements within the meaning of the federal securities laws, including those
Deutsche Bank 24 th Annual Media, Internet & Telcom Conference. March 8, 2016
 Deutsche Bank 24 th Annual Media, Internet & Telcom Conference March 8, 2016 Safe Harbor for Forward-Looking Statements Certain statements in this presentation are forward-looking statements within the
4Q 2017 Highlights and Operating Results
 4Q 2017 Highlights and Operating Results January 30, 2018 1 4Q 2017 Highlights and Operating Results Table of Contents Page(s) 1 Sales Overview 4-8 2 Financial Performance Trends 9-16 3 Leverage Metrics
Third Quarter 2018 Earnings Presentation
 Third Quarter 2018 Earnings Presentation 1 Safe Harbor Statement This document may contain certain forward-looking statements within the meaning of the Private Securities Litigation Reform Act of 1995.
Rent-A-Center today is
 INVESTOR PRESENTATION FIRST QUARTER 2014 Safe Harbor This presentation contains forward-looking statements that involve risks and uncertainties. Such forward-looking statements generally can be identified
Performance Food Group Company Reports Third-Quarter Fiscal 2016 Results: Provides Full-Year Fiscal 2016 Adjusted EBITDA Growth Outlook of 10% to 12%
 NEWS RELEASE For Immediate Release May 4, 2016 Investors: Michael D. Neese VP, Investor Relations (804) 287-8126 michael.neese@pfgc.com Media: Joe Vagi Manager, Corporate Communications (804) 484-7737
Investors Presentation. Second Quarter 2016 Results August 3, 2016
 Investors Presentation Second Quarter 2016 Results August 3, 2016 Safe Harbor for Forward-Looking Statements Certain statements in this presentation are forward-looking statements within the meaning of
Investor Presentation. November 2018
 Investor Presentation November 2018 Disclaimer Forward-Looking Statements: This presentation contains forward-looking statements which are made pursuant to the safe harbor provisions of Section 27A of
UNITED STATES SECURITIES AND EXCHANGE COMMISSION Washington, D.C
 UNITED STATES SECURITIES AND EXCHANGE COMMISSION Washington, D.C. 20549 FORM 8-K CURRENT REPORT PURSUANT TO SECTION 13 or 15(d) OF THE SECURITIES EXCHANGE ACT OF 1934 Date of report (Date of earliest event
ZEBRA TECHNOLOGIES FIRST QUARTER 2016 RESULTS May 10, 2016
 ZEBRA TECHNOLOGIES FIRST QUARTER 2016 RESULTS May 10, 2016 Anders Gustafsson Chief Executive Officer Mike Smiley Chief Financial Officer 2 Safe Harbor Statement Statements made in this presentation which
SEPTEMBER 17, 2018 SKY BETTING & GAMING UPDATE
 SEPTEMBER 17, 2018 SKY BETTING & GAMING UPDATE CAUTIONARY NOTE REGARDING FORWARD LOOKING STATEMENTS This presentation contains forward-looking statements and information within the meaning of the Private
Investor Presentation
 Investor Presentation (NASDAQ: TRIP) Q3 2012 Safe Harbor Statement Forward-Looking Statements. Our presentation today, including the slides contained herein, contains "forward-looking statements" within
Fitbit Reports $299M in Revenue, Sells 3M Devices in Q1 17, Reaffirms FY17 Guidance
 NEWS RELEASE Fitbit Reports $299M in Revenue, Sells 3M Devices in Q1 17, Reaffirms FY17 Guidance 5/3/ SAN FRANCISCO--(BUSINESS WIRE)-- Fitbit, Inc. (NYSE:FIT), the leader in connected health and fitness
Investors: Michael D. Neese VP, Investor Relations (804)
") NEWS RELEASE For Immediate Release February 7, 2018 Investors: Michael D. Neese VP, Investor Relations (804) 287-8126 michael.neese@pfgc.com Media: Joe Vagi Manager, Corporate Communications (804) 484-7737
NEWS RELEASE For Immediate Release February 7, 2018 Investors: Michael D. Neese VP, Investor Relations (804) 287-8126 michael.neese@pfgc.com Media: Joe Vagi Manager, Corporate Communications (804) 484-7737
Under Armour Reports First Quarter Results
 May 1, 2018 Under Armour Reports First Quarter Results First Quarter Revenue up 6 Percent; Company Reiterates Full Year 2018 Outlook BALTIMORE, May 1, 2018 /PRNewswire/ -- Under Armour, Inc. (NYSE: UA,
UNITED STATES SECURITIES AND EXCHANGE COMMISSION Washington, D.C
 UNITED STATES SECURITIES AND EXCHANGE COMMISSION Washington, D.C. 20549 FORM 8-K CURRENT REPORT PURSUANT TO SECTION 13 or 15(d) OF THE SECURITIES EXCHANGE ACT OF 1934 Date of report (Date of earliest event
4Q 2018 Highlights and Operating Results. Products. Technology. Services. Delivered Globally.
 4Q 2018 Highlights and Operating Results Products. Technology. Services. Delivered Globally. Table of Contents Page 3 Safe Harbor Statement and Non-GAAP Financial Measures 4 Sales Overview 9 Overview of
Investor Presentation
 Investor Presentation (NASDAQ: TRIP) Q4 2012 Safe Harbor Statement Forward-Looking Statements. Our presentation today, including the slides contained herein, contains "forward-looking statements" within
Investor Presentation
 Investor Presentation (NASDAQ: TRIP) Q2 2013 Safe Harbor Statement Forward-Looking Statements. Our presentation today, including the slides contained herein, contains "forward-looking statements" within
Safe Harbor Statement
 May 2018 Safe Harbor Statement This presentation contains forward-looking statements, within the meaning of the Private Securities Litigation Reform Act of 1995, that involve risks and uncertainties, including
WESTERN DIGITAL ANNOUNCES FINANCIAL RESULTS FOR FIRST QUARTER FISCAL YEAR 2019
 FOR IMMEDIATE RELEASE: WESTERN DIGITAL ANNOUNCES FINANCIAL RESULTS FOR FIRST QUARTER FISCAL YEAR 2019 SAN JOSE, Calif. OCT. 25, 2018 Western Digital Corp. (NASDAQ: WDC) today reported revenue of $5.0 billion
Investor Presentation
 Investor Presentation Presented by: Michael Burdiek Chief Executive Officer & President Kurtis Binder EVP & Chief Financial Officer November 8, 2017 Forward Looking Statements This presentation may contain
ZEBRA TECHNOLOGIES. William Blair Growth Stock Conference June 16, 2016
 ZEBRA TECHNOLOGIES William Blair Growth Stock Conference June 16, 2016 Safe Harbor Statement Statements made in this presentation which are not statements of historical fact are forward-looking statements
Investors Presentation
 Investors Presentation (Based on Third Quarter 2014 Results) November 5, 2014 Safe Harbor for Forward-Looking Statements Certain statements in this presentation are forward-looking statements within the
Third Quarter 2018 Results November 8, 2018
 Third Quarter 2018 Results November 8, 2018 Safe Harbor Caution Regarding Forward Looking Statements This presentation any other oral or written statements made by us or on our behalf may include forward-looking
Citi Credit Conference. Bill Bradley, Treasurer November 15, 2012
 NLSN @ Citi Credit Conference Bill Bradley, Treasurer November 15, 2012 Forward Looking Statements The following discussion may contain forward-looking statements, including those about Nielsen s outlook
EMC Q FINANCIAL RESULTS
 EMC Q3 2011 FINANCIAL RESULTS Tony Takazawa Vice President, Global Investor Relations October 18, 2011 1 Forward-Looking Statements This presentation contains forward-looking statements as defined under
MATTEL REPORTS THIRD QUARTER 2018 FINANCIAL RESULTS
 MATTEL REPORTS THIRD QUARTER 208 FINANCIAL RESULTS Third quarter Net Sales of $.44 billion. North America Net Sales increased by 4%; Gross Sales increased by 6%; highest sales growth in North America since
THIRD QUARTER 2018 RESULTS November 6, 2018
 THIRD QUARTER 2018 RESULTS November 6, 2018 Safe Harbor for Forward-Looking Statements Certain statements in this presentation are forward-looking statements within the meaning of the Private Securities
Vonage Holdings Corp. Reports Second Quarter 2013 Results
 Vonage Holdings Corp. Reports Second Quarter 2013 Results -- Positive Net Lines Driven by BasicTalk and Lowest Churn Since 2010 -- -- Adjusted EBITDA 1 of $27 Million -- -- Net Income of $12 Million or
Q Earnings. GAAP to Non-GAAP Reconciliation
 Q1 2012 Earnings GAAP to Non-GAAP Reconciliation This presentation contains forward-looking statements relating to, among other things, our outlook for full year 2012 bookings, adjusted EBITDA, stock-based
A Superior Cash Proposal for Sky. Tuesday, February 27
 A Superior Cash Proposal for Sky Tuesday, February 27 NOT FOR RELEASE, PUBLICATION OR DISTRIBUTION, DIRECTLY OR INDIRECTLY, IN WHOLE OR IN PART IN, INTO OR FROM ANY JURISDICTION WHERE TO DO SO WOULD CONSTITUTE
Fourth Quarter & Year- End 2012 Earnings Conference Call
 Fourth Quarter & Year- End 2012 Earnings Conference Call January 29, 2012 Patrick Harshman, President & CEO Carolyn Aver, Chief Financial Officer Forward Looking Statements During the course of this presentation,
2Q 2017 Highlights and Operating Results
 2Q 2017 Highlights and Operating Results July 25, 2017 1 2Q 2017 Highlights and Operating Results Table of Contents Page(s) 1 Sales Overview and Highlights 4-5 2 NSS Overview 6-7 3 EES Overview 8-9 4 UPS
Q1 16 Results. April 2016
 Q1 16 Results April 2016 Safe harbor Safe Harbor statement under the Private Securities Litigation Reform Act of 1995: This presentation and the accompanying conference call contain forward-looking statements
Q Results. November 2018
 Q3 2018 Results November 2018 Forward-Looking Statements. Our presentation today, including the slides contained herein, contains "forward-looking statements" within the meaning of the Private Securities
NEWS RELEASE For Immediate Release March 19, 2019
 NEWS RELEASE For Immediate Release March 19, 2019 Investor Contact: Media Contact: Michael D. Neese Trisha Meade VP, Investor Relations Communications & Engagement Manager (804) 287-8126 (804) 285-5390
SYSCO REPORTS FIRST QUARTER FISCAL 2018 RESULTS
 For more information contact: Sysco Corporation 1390 Enclave Parkway Neil Russell Camilla Zuckero Houston, TX 77077 Investor Contact Media Contact T 281-584-1308 T 281-899-1839 SYSCO REPORTS FIRST QUARTER
Alphabet Announces Fourth Quarter and Fiscal Year 2018 Results
 Alphabet Announces Fourth Quarter and Fiscal Year 2018 Results MOUNTAIN VIEW, Calif. February 4, 2019 Alphabet Inc. (NASDAQ: GOOG, GOOGL) today announced financial results for the quarter and fiscal year
Acquisition Offer of RPC Group PLC
 Always Advancing To Protect What s Important Acquisition Offer of RPC Group PLC March 2019 NYSE: BERY Safe Harbor Statements THIS PRESENTATION AND ITS CONTENTS ARE NOT FOR RELEASE, PUBLICATION OR DISTRIBUTION,
Q Results. May 2018
 Q1 2018 Results May 2018 Forward-Looking Statements. Our presentation today, including the slides contained herein, contains "forward-looking statements" within the meaning of the Private Securities Litigation
SYSCO REPORTS THIRD QUARTER EARNINGS
 SYSCO REPORTS THIRD QUARTER EARNINGS HOUSTON, May 7, 2018 - Sysco Corporation (NYSE: SYY) today announced financial results for its 13-week third fiscal quarter ended March 31, 2018. Third Quarter Fiscal
Q Earnings. GAAP to Non-GAAP
 Q4 2011 Earnings GAAP to Non-GAAP Reconciliation This presentation contains forward-looking statements relating to, among other things, our outlook for full year 2012 bookings, adjusted EBITDA, stock-based
SS&C Technologies (NASDAQ:SSNC)
") SS&C Technologies (NASDAQ:SSNC) Leading Software Provider to the Institutional, Alternative and Wealth Management Markets SS&C to Acquire DST Systems January 11, 2018 Safe Harbor Statement Safe Harbor
SS&C Technologies (NASDAQ:SSNC) Leading Software Provider to the Institutional, Alternative and Wealth Management Markets SS&C to Acquire DST Systems January 11, 2018 Safe Harbor Statement Safe Harbor
Groupon Announces First Quarter 2015 Results
 May 5, 2015 Groupon Announces First Quarter 2015 Results Gross billings of $1.6 billion Revenue of $750.4 million Adjusted EBITDA of $72.4 million GAAP loss per share of $0.02; non-gaap earnings per share
INSIGHT ENTERPRISES, INC. REPORTS RECORD THIRD QUARTER 2017 RESULTS AND CONFIRMS 2017 GUIDANCE
 FOR IMMEDIATE RELEASE NASDAQ: NSIT INSIGHT ENTERPRISES, INC. REPORTS RECORD THIRD QUARTER 2017 RESULTS AND CONFIRMS 2017 GUIDANCE TEMPE, AZ November 7, 2017 Insight Enterprises, Inc. (NASDAQ: NSIT) (the
UNITED STATES SECURITIES AND EXCHANGE COMMISSION Washington, D.C
 UNITED STATES SECURITIES AND EXCHANGE COMMISSION Washington, D.C. 20549 FORM 8-K CURRENT REPORT PURSUANT TO SECTION 13 or 15(d) OF THE SECURITIES EXCHANGE ACT OF 1934 Date of report (Date of earliest event
WD - HGST Expected Integration Savings (Originally presented on April 28, 2016)
") Amounts in millions, except per share amounts, ASP, percentages 1 TAM 156.7 139.1 135.8 135.9 133.3 140.2 142.2 138.1 138.0 147.3 140.8 125.0 111.0 118.7 115.1 99.8 HDD Share 45.3% 44.9% 43.6% 44.3% 44.9%
Amounts in millions, except per share amounts, ASP, percentages 1 TAM 156.7 139.1 135.8 135.9 133.3 140.2 142.2 138.1 138.0 147.3 140.8 125.0 111.0 118.7 115.1 99.8 HDD Share 45.3% 44.9% 43.6% 44.3% 44.9%
Party City Announces First Quarter Fiscal 2015 Financial Results
 Party City Announces First Quarter Fiscal 2015 Financial Results First quarter total revenues increased 6.7% to $462 million Brand comparable sales increased 5.2% Adjusted diluted loss per share of $0.03
INVESTOR PRESENTATION
 INVESTOR PRESENTATION June 2012 Safe Harbor ForwardLooking Statements. This presentation contains "forwardlooking statements" within the meaning of the Private Securities Litigation Reform Act of 1995.
Other 2017 Third Quarter Highlights:
 Cerner Reports Third Quarter 2017 Results KANSAS CITY, Mo., Oct. 26, 2017 (GLOBE NEWSWIRE) -- Cerner Corporation (Nasdaq:CERN) today announced results for the 2017 third quarter that ended September 30,
Investor Presentation
 Investor Presentation Cautionary Note Regarding Forward-Looking Statements This presentation contains forward-looking information, including the Company s statements regarding its future outlook. In addition,
Zebra Technologies Announces Second-Quarter Results
 Zebra Technologies Announces Second-Quarter Results Second-Quarter Financial Highlights Strong net sales of $1,012 million; year-over-year growth of 12.9% Net income of $70 million and net income per diluted
Fourth Quarter 2016 Results
 Fourth Quarter 2016 Results February 23, 2017 Eddie Edwards President and Chief Executive Officer Mark Olson Executive Vice President and Chief Financial Officer 1 Safe Harbor Caution Regarding Forward
Investor Presentation
 Investor Presentation (NASDAQ: TRIP) Q3 2013 Safe Harbor Statement Forward-Looking Statements. Our presentation today, including the slides contained herein, contains "forward-looking statements" within
F O U R T H Q U A R T E R R E S U L T S February 6, 2018
 F O U R T H Q U A R T E R 2 0 1 7 R E S U L T S February 6, 2018 Safe Harbor for Forward-Looking Statements Certain statements in this presentation are forward-looking statements within the meaning of
Investor Presentation
 Investor Presentation 2017 Disclaimer This presentation includes certain non-gaap financial measures. These non-gaap financial measures are in addition to, and not a substitute for or superior to measures
Click here to edit the name of your presentation. Fourth Quarter and Full Year Earnings Results
 Click here to edit the name of your presentation Fourth Quarter and Full Year 2016 Earnings Results 1 Safe Harbor Forward-Looking Statements This presentation contains forward-looking statements, within
Q3 17 EARNINGS DECK November 1, 2017
 Q3 17 EARNINGS DECK November 1, 2017 Safe Harbor Statement This presentation contains forward-looking statements, within the meaning of the Private Securities Litigation Reform Act of 1995, that involve
Investor Presentation First Data Corporation. All Rights Reserved.
 Investor Presentation 2015 First Data Corporation. All Rights Reserved. Disclaimer This presentation was prepared on April 29, 2016 and represents the information available to us on that date. We assume
TripAdvisor Investor Presentation. February 2019
 TripAdvisor Investor Presentation February 2019 1 Forward-Looking Statements. Our presentation today, including the slides contained herein, contains "forward-looking statements" within the meaning of
LIONSGATE REPORTS RESULTS FOR FIRST QUARTER 2018
 LIONSGATE REPORTS RESULTS FOR FIRST QUARTER 2018 First Quarter Revenue is $1.01 Billion, Net Income Attributable to Lionsgate Shareholders is $174 Million or Basic EPS of $0.84; Adjusted OIBDA is $182
Acquisition of Dealer Inspire and Launch Digital Marketing
 Acquisition of Dealer Inspire and Launch Digital Marketing Investor Presentation February 14, 2018 Forward Looking Statements This presentation contains forward looking statements within the meaning of
UNITED STATES SECURITIES AND EXCHANGE COMMISSION Washington, D.C
 UNITED STATES SECURITIES AND EXCHANGE COMMISSION Washington, D.C. 20549 FORM 8-K CURRENT REPORT PURSUANT TO SECTION 13 or 15(d) OF THE SECURITIES EXCHANGE ACT OF 1934 Date of report (Date of earliest event
Raymond James 37 th Annual Institutional Investors Conference. March 8, 2016
 Raymond James 37 th Annual Institutional Investors Conference March 8, 2016 Forward-looking statements and Non-GAAP financial measures Forward-looking statements Certain statements included in this presentation,
THE WALT DISNEY COMPANY REPORTS HIGHER RESULTS FOR THE QUARTER AND SIX MONTHS ENDED MARCH 31, 2004
 FOR IMMEDIATE RELEASE May 12, 2004 THE WALT DISNEY COMPANY REPORTS HIGHER RESULTS FOR THE QUARTER AND SIX MONTHS ENDED MARCH 31, 2004 EPS for the second fiscal quarter grew 73% versus the prior year, led
CFO Commentary. Third Quarter. Third-quarter diluted earnings per. share increased 33% year over year; non- GAAP diluted. earnings per share
 Third Quarter CFO Commentary As reflected in our earnings release, there are a number of items that impact the comparability of our results with those in the trailing quarter and prior quarter of last
2018 Liberty Investor Meeting
 2018 Liberty Investor Meeting Steve Kaufer, CEO and President November 14, 2018 Forward-Looking Statements. Our presentation today, including the slides contained herein, contains "forward-looking statements"
Alphabet Announces First Quarter 2018 Results
 Alphabet Announces First Quarter 2018 Results MOUNTAIN VIEW, Calif. April 23, 2018 Alphabet Inc. (NASDAQ: GOOG, GOOGL) today announced financial results for the quarter ended. "Our ongoing strong revenue
INVESTOR PRESENTATION
 INVESTOR PRESENTATION April 30, 2015 Safe Harbor Forward-Looking Statements. This presentation contains "forward-looking statements" within the meaning of the Private Securities Litigation Reform Act of
Hasbro Reports Financial Results for the First Quarter 2012
 For Immediate Release April 23, 2012 Contacts: Debbie Hancock (Investor Relations) 401-727-5401 Wayne Charness (News Media) 401-727-5983 Hasbro Reports Financial Results for the First Quarter 2012 Net