Monthly Market Review
|
|
|
- George Walker
- 6 years ago
- Views:
Transcription
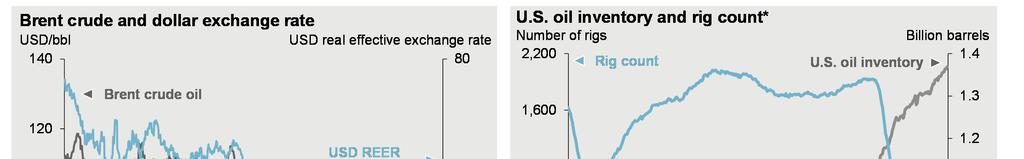
1 Monthly Market Review Global economy: The U.S. Federal Reserve kept its policy rate unchanged in April, as expected. However, it did not provide a clear direction on the timing of the next hike. While the current U.S. economic data and market conditions remain supportive to a rate hike in June, this is contingent upon market risk appetite remaining positive. (GTMA P. 29) Despite a strong Japanese yen and falling headline inflation, the Bank of Japan decided to stay put with its monetary policy in April. This disappointed investors as they were expecting more monetary stimulus to revive growth and inflation expectation. Meanwhile, the Reserve Bank of Australia opted to cut its rate by 25bps in its May meeting, the first cut since May (GTMA P. 17, 18) Equities: Global equities started April on a positive note but growth and earnings concerns weighed on performance in the last week of the month. Overall, Europe (Stoxx up 2.6%) and Asia (MSCI Asia ex-japan up 0.3%) posted modest gains while the S&P 500 lost 0.4% in the month. (GTMA P. 35) While a strong U.S. dollar and weak oil prices should be less of a headwind for U.S. equities in the medium term, weaker profit margins and mediocre revenue growth are worrying investors. In Japan, earnings forecasts are being revised lower by recent strength in the Japanese yen, which could also put medium-term pressure on structural corporate governance improvement. (GTMA P. 16, 30) Fixed income: U.S. Treasury yields experienced little change in the month, since the Federal Reserve was not expected to adjust policy in April and it did not provide clear guidance on policy outlook. European bond yield did rise modestly in April, since the European Central Bank is not expected to act in the near term after aggressive measures in its March meeting. (GTMA P. 47) In corporate credit, recovery in sentiment continues given stable growth, low default rate and policy support from multiple central banks. Investors hunt for yield is likely to continue and investment-grade corporate bonds are likely to be a preferred starting point. Investors with a higher tolerance for risk and volatility have been attracted by the high yield segment, especially in Europe and Asia. (GTMA P. 49, 50) Other assets: Asia Pacific May 2016 The U.S. dollar continues to fall on the back of delayed expectation on Federal Reserve policy normalization. Oil-related currencies, such as the Russian ruble, Canadian dollar and Norwegian krone, were amongst the best performers in the past month. The Dollar Index fell to its lowest level since early 2015, or 8% lower than the peak set in late (GTMA P. 61, 62) Brent crude remains above USD 45pb despite oil-producing countries failing to agree on supply constraints during the Doha summit on April 15. A sharp drop in oil rig counts in the U.S. is building expectation that excess supply is slowly coming under control. (GTMA P. 63, 64)


2 China: Exchange rate and foreign reserves GTM Asia 12 2


3 Global inflation GTM Asia 20 3


4 Global Purchasing Managers Index (PMI): Manufacturing GTM Asia 23 4


5 Global and Asia equity markets: Returns GTM Asia 35 5


6 Global equity markets: Valuations GTM Asia 37 6


7 Global fixed income: Yields and returns GTM Asia 45 7


8 U.S. high yield bonds GTM Asia 49 8


9 European high yield bonds GTM Asia 50 9


10 Asset class returns GTM Asia 53 10


11 Volatility and correlation GTM Asia 56 11


12 Oil: Short-term market dynamics GTM Asia 63 12
13 J.P. Morgan Asset Management: Index Definitions All indexes are unmanaged and an individual cannot invest directly in an index. Index returns do not include fees or expenses. The S&P 500 Index is widely regarded as the best single gauge of the U.S. equities market. This world-renowned index includes a representative sample of 500 leading companies in leading industries of the U.S. economy. Although the S&P 500 Index focuses on the large-cap segment of the market, with approximately 75% coverage of U.S. equities, it is also an ideal proxy for the total market. An investor cannot invest directly in an index. The Tokyo Stock Price Index ('TOPIX') is a composite index of all common stocks listed on the First Section of Tokyo Stock Exchange (TSE).The index is basically a measure of the changes in aggregate market value of TSE common stocks. The base for the index is the aggregate market value of its component stocks as of the close on January 4, The aggregate market value is calculated by multiplying the number of listed shares of each component stock by its price and totaling the products derived there from. The Bombay Exchange Sensitive Index ( SENSEX), first compiled in 1986, was calculated on a "Market Capitalization-Weighted" methodology of 30 component stocks representing large, well-established and financially sound companies across key sectors. The base year of SENSEX was taken as SENSEX today is widely reported in both domestic and international markets through print as well as electronic media. It is scientifically designed and is based on globally accepted construction and review methodology. Since September 1, 2003, SENSEX is being calculated on a free-float market capitalization methodology. The Korea Composite Stock Price Index ( KOSPI) is market capitalization based index on all common stocks listed on the Stock Market Division of the Korea Exchange (KRX) and excludes preferred stocks. The stock price index is calculated using the actual price traded on the market and not the base price used for market management such as establishment of price change limits. When no market price is available for issues that are not being traded or have halted trading, the latest closing price is used. KOSPI was a assigned a base index of 100 set to January 4, The China Shenzhen Composite Index is an actual market-cap weighted index that tracks the stock performance of all the A-share and B-share lists on Shenzhen Stock Exchange. The index was developed on April 3, 1991 with a base price of 100. The MSCI EAFE (Europe, Australia, Far East) Net Index is recognized as the pre-eminent benchmark in the United States to measure international equity performance. It comprises 21 MSCI country indexes, representing the developed markets outside of North America. The MSCI Emerging Markets Index SM is a free float-adjusted market capitalization index that is designed to measure equity market performance in the global emerging markets. As of June 2007, the MSCI Emerging Markets Index consisted of the following 25 emerging market country indices: Argentina, Brazil, Chile, China, Colombia, Czech Republic, Egypt, Hungary, India, Indonesia, Israel, Jordan, Korea, Malaysia, Mexico, Morocco, Pakistan, Peru, Philippines, Poland, Russia, South Africa, Taiwan, Thailand, and Turkey. The MSCI ACWI (All Country World Index) Index is a free float-adjusted market capitalization weighted index that is designed to measure the equity market performance of developed and emerging markets. As of June 2009 the MSCI ACWI consisted of 45 country indices comprising 23 developed and 22 emerging market country indices. The following MSCI Total Return Indices SM are calculated with gross dividends: This series approximates the maximum possible dividend reinvestment. The amount reinvested is the dividend distributed to individuals resident in the country of the company, but does not include tax credits. The MSCI Europe Index SM is a free float-adjusted market capitalization index that is designed to measure developed market equity performance in Europe. As of June 2007, the MSCI Europe Index consisted of the following 16 developed market country indices: Austria, Belgium, Denmark, Finland, France, Germany, Greece, Ireland, Italy, the Netherlands, Norway, Portugal, Spain, Sweden, Switzerland and the United Kingdom. The MSCI Pacific Index SM is a free float-adjusted market capitalization index that is designed to measure equity market performance in the Pacific region. As of June 2007, the MSCI Pacific Index consisted of the following 5 Developed Market countries: Australia, Hong Kong, Japan, New Zealand, and Singapore. The MSCI Europe ex UK Index SM is a free float-adjusted market capitalization weighted index that is designed to measure the equity market performance of the developed markets in Europe, excluding the United Kingdom. The MSCI Europe ex UK Index consists of the following 15 developed market country indices: Austria, Belgium, Denmark, Finland, France, Germany, Greece, Ireland, Italy, the Netherlands, Norway, Portugal, Spain, Sweden, and Switzerland. The MSCI Pacific ex Japan Index SM is a free float-adjusted market capitalization index that is designed to measure equity market performance in the Pacific region, excluding Japan. As of June 2007, the MSCI Pacific Index consisted of the following 4 Developed Market countries: Australia, Hong Kong, New Zealand, and Singapore. The MSCI USA Index SM is designed to measure the performance of the large and mid cap segments of the U.S. market. With 586 constituents, the index covers approximately 84% of the free float-adjusted market capitalization in the U.S.. The MSCI USA Index was launched on Dec ember 31, The MSCI China Index SM captures large and mid cap representation across China H shares, B shares, Red chips and P chips. With 148 constituents, the index covers about 84% of this China equity universe. The MSCI China Index was launched on December 31, The MSCI Indonesia Index SM is designed to measure the performance of the large and mid cap segments of the Indonesian market. With 25 constituents, the index covers about 84% of the Indonesian equity universe. The MSCI Indonesia Index was launched on December 31, The MSCI Korea Index SM is designed to measure the performance of the large and mid cap segments of the South Korean market. With 105 constituents, the index covers about 84% of the Korean equity universe. The MSCI Korea Index was launched on December 31, The MSCI India Index SM is designed to measure the performance of the large and mid cap segments of the Indian market. With 71 constituents, the index covers about 84% of the Indian equity universe. The MSCI India Index was launched on December 31, The MSCI Japan Index SM is designed to measure the performance of the large and mid cap segments of the Japan market. With 315 constituents, the index covers approximately 84% of the free float-adjusted market capitalization in Japan. The MSCI Japan Index was launched on December 31, The MSCI Hong Kong Index SM is designed to measure the performance of the large and mid cap segments of the Hong Kong market. With 42 constituents, the index covers approximately 84% of the free float-adjusted market capitalization of the Hong Kong equity universe. The MSCI Hong Kong Index was launched on December 31, The MSCI Taiwan Index SM is designed to measure the performance of the large and mid cap segments of the Taiwan market. With 113 constituents, the index covers approximately 84% of the free float-adjusted market capitalization in Taiwan. The MSCI Taiwan Index was launched on December 31, West Texas Intermediate (WTI) is the underlying commodity for the New York Mercantile Exchange's oil futures contracts. The Dow Jones-UBS Commodity Index is composed of futures contracts on physical commodities and represents nineteen separate commodities traded on U.S. exchanges, with the exception of aluminum, nickel, and zinc. The Dow Jones-UBS Commodity Subindexes represent commodity groups and sectors, as well as single commodities, that make up the Dow Jones-UBS Commodity Index. The subindexes track exchange-traded futures of physical commodities, and the commodity groups and sectors, like in the case of the broad index, are weighted to account for economic significance and market liquidity. The different subindexes are Energy, Livestock, Grains, Industrial Metals, and Precious Metals. 13
14 J.P. Morgan Asset Management: Index Definitions, Risks and Disclosures The Euro Stoxx 600 Index represents large, mid and small capitalization companies across 18 European countries. The Barclays High Yield Index covers the universe of fixed rate, non-investment grade debt. Pay-in-kind (PIK) bonds, Eurobonds, and debt issues from countries designated as emerging markets (e.g., Argentina, Brazil, Venezuela, etc.) are excluded, but Canadian and global bonds (SEC registered) of issuers in non-emg countries are included. Original issue zeroes, step-up coupon structures, and 144-As are also included. The Barclays 1-3 Month U.S. Treasury Bill Index includes all publicly issued zero-coupon U.S. Treasury Bills that have a remaining maturity of less than 3 months and more than 1 month, are rated investment grade, and have $250 million or more of outstanding face value. In addition, the securities must be denominated in U.S. dollars and must be fixed rate and non convertible. The Barclays Corporate Bond Index is the Corporate component of the U.S. Credit index. The Barclays TIPS Index consists of Inflation-Protection securities issued by the U.S. Treasury. The J.P. Morgan EMBI Global Index includes U.S. dollar denominated Brady bonds, Eurobonds, traded loans and local market debt instruments issued by sovereign and quasi-sovereign entities. The J.P. Morgan GBI-EM Global Diversified consists of regularly traded, liquid fixed-rate, domestic currency government bonds to which international investors can gain exposure. The weightings among the countries are more evenly distributed within this index. The J.P. Morgan Corporate Emerging Markets Bond Index (CEMBI): The CEMBI tracks total returns of US dollardenominated debt instruments issued by corporate entities in Emerging Markets countries, and consists of an investable universe of corporate bonds. The J.P. Morgan Domestic High Yield Index is designed to mirror the investable universe of the U.S. dollar domestic high yield corporate debt market. The VIX-CBOE Volatility Index measures market expectations of near-term volatility conveyed by S&P 500 Index (SPX) option prices. The MOVE-Merrill Lynch Option Volatility Index is a blended implied normal volatility for constant one-month atthe-money options on U.S. Treasuries. Price to forward earnings is a measure of the price-to-earnings ratio (P/E) using forecasted earnings. Price to book value compares a stock's market value to its book value. Price to cash flow is a measure of the market's expectations of a firm's future financial health. Price to dividends is the ratio of the price of a share on a stock exchange to the dividends per share paid in the previous year, used as a measure of a company's potential as an investment. Bonds are subject to interest rate risks. Bond prices generally fall when interest rates rise. The price of equity securities may rise, or fall because of changes in the broad market or changes in a company s financial condition, sometimes rapidly or unpredictably. These price movements may result from factors affecting individual companies, sectors or industries, or the securities market as a whole, such as changes in economic or political conditions. Equity securities are subject to stock market risk meaning that stock prices in general may decline over short or extended periods of time. Small-capitalization investing typically carries more risk than investing in well-established "blue-chip" companies since smaller companies generally have a higher risk of failure. Historically, smaller companies' stock has experienced a greater degree of market volatility than the average stock. Mid-capitalization investing typically carries more risk than investing in well-established "blue-chip" companies. Historically, mid-cap companies' stock has experienced a greater degree of market volatility than the average stock. Real estate investments may be subject to a higher degree of market risk because of concentration in a specific industry, sector or geographical sector. Real estate investments may be subject to risks including, but not limited to, declines in the value of real estate, risks related to general and economic conditions, changes in the value of the underlying property owned by the trust and defaults by borrower. International investing involves a greater degree of risk and increased volatility. Changes in currency exchange rates and differences in accounting and taxation policies can raise or lower returns. Also, some markets may not be as politically and economically stable as other nations. Investments in emerging markets can be more volatile. The normal risks of international investing are heightened when investing in emerging markets. In addition, the small size of securities markets and the low trading volume may lead to a lack of liquidity, which leads to increased volatility. Also, emerging markets may not provide adequate legal protection for private or foreign investment or private property. Investments in commodities may have greater volatility than investments in traditional securities, particularly if the instruments involve leverage. The value of commodity-linked derivative instruments may be affected by changes in overall market movements, commodity index volatility, changes in interest rates, or factors affecting a particular industry or commodity, such as drought, floods, weather, livestock disease, embargoes, tariffs and international economic, political and regulatory developments. Use of leveraged commodity-linked derivatives creates an opportunity for increased return but, at the same time, creates the possibility for greater loss. Derivatives may be riskier than other types of investments because they may be more sensitive to changes in economic or market conditions than other types of investments and could result in losses that significantly exceed the original investment. The use of derivatives may not be successful, resulting in investment losses, and the cost of such strategies may reduce investment returns. There is no guarantee that the use of long and short positions will succeed in limiting an investor's exposure to domestic stock market movements, capitalization, sector swings or other risk factors. Investing using long and short selling strategies may have higher portfolio turnover rates. Short selling involves certain risks, including additional costs associated with covering short positions and a possibility of unlimited loss on certain short sale positions. 14
15 Monthly Market Review Asia Pacific May 2016 Source: FactSet, U.S. Bureau of Economic Analysis, J.P. Morgan Asset Management. All returns in local currency except where stated. * Currencies return are based on foreign currencies per U.S. dollar. An appreciation of the foreign currency against the U.S. dollar would be positive and a depreciation of the foreign currency against the U.S. dollar would be negative. The Market Insights program provides comprehensive data and commentary on global markets without reference to products. It is designed to help investors understand the financial markets and support their investment decision making (or process). The program explores the implications of economic data and changing market conditions for the referenced period and should not be taken as advice or recommendation. The views contained herein are not to be taken as an advice or a recommendation to buy or sell any investment in any jurisdiction, nor is it a commitment from J.P. Morgan Asset Management or any of its subsidiaries to participate in any of the transactions mentioned herein. Any forecasts, figures, opinions or investment techniques and strategies set out are for information purposes only, based on certain assumptions and current market conditions and are subject to change without prior notice. All information presented herein is considered to be accurate at the time of production, but no warranty of accuracy is given and no liability in respect of any error or omission is accepted. This material does not contain sufficient information to support an investment decision and it should not be relied upon by you in evaluating the merits of investing in any securities or products. In addition, users should make an independent assessment of the legal, regulatory, tax, credit, and accounting implications and determine, together with their own professional advisers, if any investment mentioned herein is believed to be suitable to their personal goals. Investors should ensure that they obtain all available relevant information before making any investment. It should be noted that investment involves risks, the value of investments and the income from them may fluctuate in accordance with market conditions and taxation agreements and investors may not get back the full amount invested. Both past performance and yield may not be a reliable guide to future performance. J.P. Morgan Asset Management is the brand for the asset management business of JPMorgan Chase & Co. and its affiliates worldwide. This communication is issued by the following entities: in the United Kingdom by JPMorgan Asset Management (UK) Limited, which is authorized and regulated by the Financial Conduct Authority; in other EU jurisdictions by JPMorgan Asset Management (Europe) S.à r.l.; in Hong Kong by JF Asset Management Limited, or JPMorgan Funds (Asia) Limited, or JPMorgan Asset Management Real Assets (Asia) Limited; in India by JPMorgan Asset Management India Private Limited; in Singapore by JPMorgan Asset Management (Singapore) Limited, or JPMorgan Asset Management Real Assets (Singapore) Pte Ltd; in Taiwan by JPMorgan Asset Management (Taiwan) Limited; in Japan by JPMorgan Asset Management (Japan) Limited which is a member of the Investment Trusts Association, Japan, the Japan Investment Advisers Association, Type II Financial Instruments Firms Association and the Japan Securities Dealers Association and is regulated by the Financial Services Agency (registration number Kanto Local Finance Bureau (Financial Instruments Firm) No. 330 ); in Korea by JPMorgan Asset Management (Korea) Company Limited; in Australia to wholesale clients only as defined in section 761A and 761G of the Corporations Act 2001 (Cth) by JPMorgan Asset Management (Australia) Limited (ABN ) (AFSL ); in Brazil by Banco J.P. Morgan S.A.; in Canada for institutional clients use only by JPMorgan Asset Management (Canada) Inc., and in the United States by JPMorgan Distribution Services Inc. and J.P. Morgan Institutional Investments, Inc., both members of FINRA/SIPC.; and J.P. Morgan Investment Management Inc. In APAC, distribution is for Hong Kong, Taiwan, Japan and Singapore. For all other countries in APAC, to intended recipients only. Copyright 2016 JPMorgan Chase & Co. All rights reserved.
Monthly Market Review Asia Pacific January 2017
 Monthly Market Review Asia Pacific January 2017 Global economy: The Federal Reserve raised its policy rate by 25bps, to 0.5%-0.75%, in its December FOMC meeting, as expected. Its updated projection expects
Monthly Market Review Asia Pacific October 2017
 Monthly Market Review Asia Pacific October 2017 Global economy: The Federal Reserve (Fed), in line with market expectations, has announced that it will start to reduce its balance sheet in October. Market
Monthly Market Review Asia Pacific December 2017
 Monthly Market Review Pacific December 2017 economy: U.S. 3Q real GDP growth was revised up to 3.3% SAAR, from 3.0%, amid stronger domestic final sales, inventories and trade. One of the more noteworthy
Monthly Market Review Asia Pacific November 2017
 Monthly Market Review Pacific November 2017 economy: 3Q economic growth in the U.S., eurozone and China all beat expectations. The U.S. expanded by 3% SAAR, helped by inventory and a smaller trade deficit,
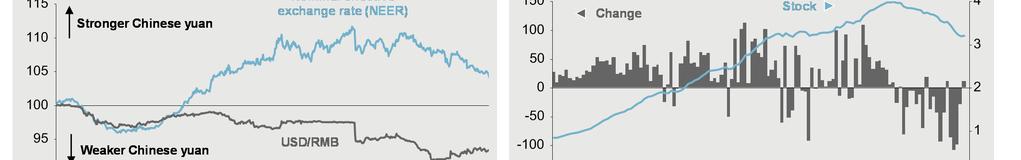
China: Exchange rate and foreign reserves
 China: Exchange rate and foreign reserves 9 Chinese yuan exchange rate: NEER vs. USD Index, rebased 2013 = 100 USD / CNY and change in FX reserves Change in monthly FX reserves (USD billions) USD / CNY
Quarterly Investment Update First Quarter 2017
 Quarterly Investment Update First Quarter 2017 Market Update: A Quarter in Review March 31, 2017 CANADIAN STOCKS INTERNATIONAL STOCKS Large Cap Small Cap Growth Value Large Cap Small Cap Growth Value Emerging
Summit Strategies Group
 As of December 3, 203 US Equity: All Cap Russell 3000 Index 2.64 0.0 33.55 33.55 6.24 8.7 6.50 7.88 7.09 Dow Jones US Total Stock Market Index 2.63 0. 33.47 33.47 6.23 8.86 6.68 8.0 6.90 US Equity: Large
San Francisco Retiree Health Care Trust Fund Education Materials on Public Equity
 M E K E T A I N V E S T M E N T G R O U P 5796 ARMADA DRIVE SUITE 110 CARLSBAD CA 92008 760 795 3450 fax 760 795 3445 www.meketagroup.com The Global Equity Opportunity Set MSCI All Country World 1 Index
Quarterly Investment Update First Quarter 2018
 Quarterly Investment Update First Quarter 2018 Dimensional Fund Advisors Canada ULC ( DFA Canada ) is not affiliated with [insert name of Advisor]. DFA Canada is a separate and distinct company. Market
Quarterly Market Review. First Quarter 2015
 Q1 Quarterly Market Review First Quarter 2015 Quarterly Market Review First Quarter 2015 This report features world capital market performance and a timeline of events for the past quarter. It begins with
Q2 Quarterly Market Review Second Quarter 2015
 Q2 Quarterly Market Review Second Quarter 2015 Quarterly Market Review Second Quarter 2015 This report features world capital market performance and a timeline of events for the past quarter. It begins
Summit Strategies Group
 April 0, 205 US Equity: All Cap Russell 000 Index 0.45 5.9 2.26 2.74 6.86 4. 8.68 8.66 Dow Jones US Total Stock Market Index 0.46 5.9 2.27 2.67 6.78 4.7 8.78 8.8 US Equity: Large Cap Russell 000 Index
Wells Fargo Target Date CITs E3
 All information is as of 12-31-17 unless otherwise indicated. Overview General fund information Fund sponsor and manager: Wells Fargo Bank, N.A. Fund advisor: Wells Capital Management Inc. Portfolio manager:
DIVERSIFICATION. Diversification
 Diversification Helps you capture what global markets offer Reduces risks that have no expected return May prevent you from missing opportunity Smooths out some of the bumps Helps take the guesswork out
Wells Fargo Target Date Funds
 All information is as of 9-30-17 unless otherwise indicated. Overview General fund information Portfolio managers: Kandarp Acharya, CFA, FRM; Christian Chan, CFA; and Petros Bocray, CFA, FRM Subadvisor:
Summit Strategies Group
 US Equity: All Cap Russell 000 Index -.69 2.40.9 6.22 0.59 4.7 2.79 9.78 Dow Jones US Total Stock Market Index -.70 2.4.4 6.2 0.55 4.2 2.76 9.8 US Equity: Large Cap Russell 000 Index -.67 2.75.62 6.70
Summit Strategies Group
 US Equity: All Cap Russell 000 Index.72 7.7 5.67 26.29 9.92.85.87 7.64 Dow Jones US Total Stock Market Index - - - - - - - - US Equity: Large Cap Russell 000 Index.87 7.95 5.96 25.5 0.9.94.9 7.69 Russell
Summit Strategies Group
 May, 208 US Equity: All Cap Russell 000 Index 2.82.4 2.55 5.06 0.72 2.85 2.6 9.2 Dow Jones US Total Stock Market Index 2.8.5 2.57 5.09 0.68 2.78 2.58 9.27 US Equity: Large Cap Russell 000 Index 2.55 0.57
Summit Strategies Group
 June 0, 208 US Equity: All Cap Russell 000 Index 0.65.89.22 4.78.58.29.0 0.2 Dow Jones US Total Stock Market Index 0.66.87.25 4.79.56.22 2.98 0.28 US Equity: Large Cap Russell 000 Index 0.65.57 2.85 4.54.64.7.2
Summit Strategies Group
 August, 208 US Equity: All Cap Russell 000 Index.5 7.65 0.9 20.25 5.86 4.25 5.50 0.89 Dow Jones US Total Stock Market Index.48 7.64 0.4 20.26 5.82 4.2 5.45 0.94 US Equity: Large Cap Russell 000 Index.45
Summit Strategies Group
 October, 208 US Equity: All Cap Russell 000 Index -7.6 -.95 2.4 6.60.27 0.8.8.5 Dow Jones US Total Stock Market Index -7.4-4.04 2.9 6.56.24 0.76.75.6 US Equity: Large Cap Russell 000 Index -7.08 -.5 2.67
Vantage Investment Partners. Quarterly Market Review
 Vantage Investment Partners Quarterly Market Review First Quarter 2016 Quarterly Market Review First Quarter 2016 This report features world capital market performance and a timeline of events for the
Solving for Fixed Income
 MARKET INSIGHTS Solving for Fixed Income Using Market Insights to achieve better outcomes Q4 2016 SINCE 2004, J.P. MORGAN HAS PRODUCED MARKET INSIGHTS TO HELP INDIVIDUAL INVESTORS UNDERSTAND AND MAKE THEIR
NORTH AMERICAN UPDATE
 NORTH AMERICAN UPDATE December 6 th, 2018 INNOVATION INSIGHT GROWTH SINCE 1968 TOUGH YEAR FOR RETURNS AROUND THE WORLD Index Year-to-date Performance MSCI World -1.2% MSCI USA 3.9% MSCI Canada -3.9% MSCI
DFA Global Equity Portfolio (Class F) Quarterly Performance Report Q2 2014
 Quarterly Performance Report Q2 2014") DFA Global Equity Portfolio (Class F) Quarterly Performance Report Q2 2014 This presentation has been prepared by Dimensional Fund Advisors Canada ULC ( DFA Canada ), manager of the Dimensional Funds.
DFA Global Equity Portfolio (Class F) Quarterly Performance Report Q2 2014 This presentation has been prepared by Dimensional Fund Advisors Canada ULC ( DFA Canada ), manager of the Dimensional Funds.
DFA Global Equity Portfolio (Class F) Performance Report Q2 2017
 Performance Report Q2 2017") DFA Global Equity Portfolio (Class F) Performance Report Q2 2017 This presentation has been prepared by Dimensional Fund Advisors Canada ULC ( DFA Canada ), manager of the Dimensional Funds. This presentation
DFA Global Equity Portfolio (Class F) Performance Report Q2 2017 This presentation has been prepared by Dimensional Fund Advisors Canada ULC ( DFA Canada ), manager of the Dimensional Funds. This presentation
DFA Global Equity Portfolio (Class F) Performance Report Q3 2018
 Performance Report Q3 2018") DFA Global Equity Portfolio (Class F) Performance Report Q3 2018 This presentation has been prepared by Dimensional Fund Advisors Canada ULC ( DFA Canada ), manager of the Dimensional Funds. This presentation
DFA Global Equity Portfolio (Class F) Performance Report Q3 2018 This presentation has been prepared by Dimensional Fund Advisors Canada ULC ( DFA Canada ), manager of the Dimensional Funds. This presentation
DFA Global Equity Portfolio (Class F) Performance Report Q4 2017
 Performance Report Q4 2017") DFA Global Equity Portfolio (Class F) Performance Report Q4 2017 This presentation has been prepared by Dimensional Fund Advisors Canada ULC ( DFA Canada ), manager of the Dimensional Funds. This presentation
DFA Global Equity Portfolio (Class F) Performance Report Q4 2017 This presentation has been prepared by Dimensional Fund Advisors Canada ULC ( DFA Canada ), manager of the Dimensional Funds. This presentation
DFA Global Equity Portfolio (Class F) Performance Report Q3 2015
 Performance Report Q3 2015") DFA Global Equity Portfolio (Class F) Performance Report Q3 2015 This presentation has been prepared by Dimensional Fund Advisors Canada ULC ( DFA Canada ), manager of the Dimensional Funds. This presentation
DFA Global Equity Portfolio (Class F) Performance Report Q3 2015 This presentation has been prepared by Dimensional Fund Advisors Canada ULC ( DFA Canada ), manager of the Dimensional Funds. This presentation
MARKET INSIGHTS. Guide to the Markets. Alternatives. 4Q 2016 As of September 30, 2016
 MARKET INSIGHTS Guide to the s Alternatives 4Q 216 As of September 3, 216 Asset class correlations 58 GTM Asia 2 1-year correlations Asia ex- Japan equity EM equity U.S. equity Asian USD bond USD EMD EM
Using Market Insights to discuss Principles of successful long-term investing
 Using Market Insights to discuss Principles of successful long-term investing Nandini Ramakrishnan Learning objectives Describe the principles of successful long-term investing Give examples of time tested
Summit Strategies Group
 October, 208 US Equity: All Cap Russell 000 Index -7.6 -.95 2.4 6.60.27 0.8.8.5 Dow Jones US Total Stock Market Index -7.4-4.04 2.9 6.56.24 0.76.75.6 US Equity: Large Cap Russell 000 Index -7.08 -.5 2.67
Freedom Quarterly Market Commentary // 2Q 2018
 ASSET MANAGEMENT SERVICES Freedom Quarterly Market Commentary // 2Q 2018 SECOND QUARTER HIGHLIGHTS U.S. economic growth and earnings lead the world The value of the dollar rises, affecting currency exchange
Portfolio Strategist Update from BlackRock Active Opportunity ETF Portfolios
 Portfolio Strategist Update from BlackRock Active Opportunity ETF Portfolios As of Sept. 30, 2017 Ameriprise Financial Services, Inc., ("Ameriprise Financial") is the investment manager for Active Opportunity
All-Country Equity Allocator February 2018
 Leila Heckman, Ph.D. lheckman@dcmadvisors.com 917-386-6261 John Mullin, Ph.D. jmullin@dcmadvisors.com 917-386-6262 Charles Waters cwaters@dcmadvisors.com 917-386-6264 All-Country Equity Allocator February
Market Briefing: Global Markets
 Market Briefing: Global Markets July 6, 218 Dr. Edward Yardeni 516-972-7683 eyardeni@ Mali Quintana 48-664-1333 aquintana@ Please visit our sites at blog. thinking outside the box Table Of Contents Table
Quarterly Investment Update
 Quarterly Investment Update Third Quarter 2017 Dimensional Fund Advisors Canada ULC ( DFA Canada ) is not affiliated with The CM Group DFA Canada is a separate and distinct company Market Update: A Quarter
Does Economic Growth in Emerging Markets Drive Equity Returns?
 Does Economic Growth in Emerging Markets Drive Equity Returns? Conrad Saldanha, CFA Portfolio Manager Emerging Market Equities August 00 Conventional wisdom suggests that a country s economic growth should
Quarterly Investment Update
 Quarterly Investment Update Second Quarter 2017 Dimensional Fund Advisors Canada ULC ( DFA Canada ) is not affiliated with The CM Group DFA Canada is a separate and distinct company Market Update: A Quarter
Ticker Fund Name CUSIP. Market Vectors MSCI Emerging Markets. Market Vectors MSCI Emerging Markets. Market Vectors MSCI International
 EDGA Exchange, Inc. & EDGX Exchange, Inc. Regulatory Information Circular Circular Number: 2014-012 Contact: Jeff Rosenstrock Date: January 23, 2014 Telephone: (201) 942-8295 Subject: Market Vectors MSCI
International Thematic (ETFs) Select UMA Managed Advisory Portfolios Solutions
 Select UMA Managed Advisory Portfolios Solutions") Managed Advisory Portfolios Solutions 2000 Westchester Avenue Purchase, New York 10577 Style: Sub-Style: Firm AUM: Firm Strategy AUM: International Equities $912.3 million $36.3 million Year Founded: GIMA
Managed Advisory Portfolios Solutions 2000 Westchester Avenue Purchase, New York 10577 Style: Sub-Style: Firm AUM: Firm Strategy AUM: International Equities $912.3 million $36.3 million Year Founded: GIMA
Global Thematic (ETFs) Select UMA Managed Advisory Portfolios Solutions
 Select UMA Managed Advisory Portfolios Solutions") Managed Advisory Portfolios Solutions 2000 Westchester Avenue Purchase, New York 10577 Style: Sub-Style: Firm AUM: Firm Strategy AUM: Global Equities $912.3 million $53.9 million Year Founded: GIMA Status:
Managed Advisory Portfolios Solutions 2000 Westchester Avenue Purchase, New York 10577 Style: Sub-Style: Firm AUM: Firm Strategy AUM: Global Equities $912.3 million $53.9 million Year Founded: GIMA Status:
This statistical appendix presents data
 STATISTICAL APPENDIX This statistical appendix presents data on financial developments in key financial centers and emerging markets. It is designed to complement the analysis in the text by providing
Annual Market Review Portfolio Management
 2016 Annual Market Review 2016 Portfolio Management 2016 Annual Market Review This report features world capital market performance for the past year. Overview: Market Summary World Asset Classes US Stocks
Chart Collection for Morning Briefing
 Chart Collection for Morning Briefing February 12, 219 Dr. Edward Yardeni 516-972-7683 eyardeni@ Mali Quintana 48-664-1333 aquintana@ Please visit our sites at blog. thinking outside the box 25 Figure
Global Select International Select International Select Hedged Emerging Market Select
 International Exchange Traded Fund (ETF) Managed Strategies ETFs provide investors a liquid, transparent, and low-cost avenue to equities around the world. Our research has shown that individual country
Market Correlations: Trade-Weighted Dollar
 Market Correlations: Trade-Weighted Dollar March 11, 218 Dr. Edward Yardeni 516-972-7683 eyardeni@ Joe Abbott 732-497-536 jabbott@ Mali Quintana 48-664-1333 aquintana@ Please visit our sites at www. blog.
2017 Annual Market Review
 2017 Annual Market Review 19 2017 Annual Market Review This report features world capital market performance for the past year. Overview: Market Summary World Asset Classes US Stocks International Developed
All-Country Equity Allocator July 2018
 Leila Heckman, Ph.D. lheckman@dcmadvisors.com 917-386-6261 John Mullin, Ph.D. jmullin@dcmadvisors.com 917-386-6262 Allison Hay ahay@dcmadvisors.com 917-386-6264 All-Country Equity Allocator July 2018 A
This statistical appendix presents data
 This statistical appendix presents data on financial developments in key financial centers and emerging markets. It is designed to complement the analysis in the text by providing additional data that
WORKING TOGETHER Design Build Protect
 WORKING TOGETHER Design Build Protect 2018 LWI Financial Inc. All rights reserved. LWI Financial Inc. ( Loring Ward ) is an investment adviser registered with the Securities and Exchange Commission. Securities
STOXX EMERGING MARKETS INDICES. UNDERSTANDA RULES-BA EMERGING MARK TRANSPARENT SIMPLE
 STOXX Limited STOXX EMERGING MARKETS INDICES. EMERGING MARK RULES-BA TRANSPARENT UNDERSTANDA SIMPLE MARKET CLASSIF INTRODUCTION. Many investors are seeking to embrace emerging market investments, because
This statistical appendix presents data
 This statistical appendix presents data on financial developments in key financial centers and emerging markets. It is designed to complement the analysis in the text by providing additional data that
The Current and Long- Term Case for Overseas Investing
 The Current and Long- Term Case for Overseas Investing Q1 2017 TP666 Bank of America Corporation ( Bank of America ) is a financial holding company that, through its subsidiaries and affiliated companies,
Market Bulletin. Earnings will set you free. October 20, In brief. The benefits of breadth
 Market Bulletin October 20, 2017 Earnings will set you free In brief Healthy gains in global equity markets this year have been driven by a rebound in earnings growth, with the breadth of profit growth
CFI Multi-Strategy Equity Fund, LLC Objective and Strategy September 30, 2015
 Objective and Strategy OBJECTIVE To offer an actively managed, multi-manager investment program that will provide broad exposure to global equity markets. The fund seeks to add value net of fees above
BlackRock Developed World Index Sub-Fund
 KEY INVESTOR INFORMATION BlackRock Developed World Index Sub-Fund A sub-fund of BlackRock Index Selection Fund Objectives and Investment Policy This document provides you with key investor information
WORKING TOGETHER Design Build Protect
 WORKING TOGETHER Design Build Protect Presenter Presenter Title, Loring Ward 2016 LWI Financial Inc. All rights reserved. LWI Financial Inc. ( Loring Ward ) is an investment adviser registered with the
Market Review and Outlook. Todd Centurino, CFA
 Market Review and Outlook Todd Centurino, CFA Q1 2017 Global Economy: On the Upswing Ranked Returns (%) Emerging Market Equities 11.40 European Equities 7.40 US Equities 6.10 Global Bonds 2.00 US Treasuries
This statistical appendix presents data on
 c h a p t e r X STATISTICAL APPENDIX This statistical appendix presents data on financial developments in key financial centers and emerging and other markets. It is designed to complement the analysis
1.1. STOXX TOTAL MARKET INDICES
 STOXX INDEX LIST A-Z 1. TOTAL MARKET INDICES 1/14 1.1. STOXX TOTAL MARKET INDICES Regional indices STOXX BRIC TMI STOXX Developed and Emerging Markets TMI STOXX Developed Markets TMI STOXX Emerging Markets
FTSE Global Equity Index Series
 FTSE Global Equity Index Series THE FTSE GLOBAL EQUITY INDEX SERIES With an unparalleled record of flexibility, transparency, consistent accuracy and the ability to meet any mandate, FTSE indices are already
Global ex US PE / VC Benchmark Commentary Quarter and Year Ending December 31, 2015
 Global ex US PE / VC Benchmark Commentary Quarter and Year Ending December 31, 2015 Overview The Cambridge Associates LLC Global ex US Developed Markets Private Equity and Venture Capital (PE/VC) Index
Rebalancing International Equities: What to Know. What to Consider.
 Success Should Not Be Cyclical Perspective Rebalancing International Equities: What to Know. What to Consider. Executive Summary Diversified investors may be frustrated by the underperformance of their
COUNTRY COST INDEX JUNE 2013
 COUNTRY COST INDEX JUNE 2013 June 2013 Kissell Research Group, LLC 1010 Northern Blvd., Suite 208 Great Neck, NY 11021 www.kissellresearch.com Kissell Research Group Country Cost Index - June 2013 2 Executive
1.1. STOXX TOTAL MARKET INDICES
 1. BROAD TOTAL MARKET INDICES/BENCHMARK INDICES, EQUAL WEIGHT INDICES 1/15 1.1. STOXX TOTAL MARKET INDICES Regional indices STOXX BRIC TMI STOXX Developed and Emerging Markets TMI STOXX Developed Markets
Market Bulletin. Chinese yuan: Walking on a tight rope. 16 August 2016 MARKET INSIGHTS. In brief
 MARKET INSIGHTS Market Bulletin 16 August 2016 Chinese yuan: Walking on a tight rope In brief Recent trends suggest the Chinese authorities are allowing the Chinese yuan to depreciate against a basket
Reporting practices for domestic and total debt securities
 Last updated: 27 November 2017 Reporting practices for domestic and total debt securities While the BIS debt securities statistics are in principle harmonised with the recommendations in the Handbook on
Market Bulletin. Chinese yuan: Walking on a tight rope. August 16, In brief
 Market Bulletin August 16, 2016 Chinese yuan: Walking on a tight rope In brief Recent trends suggest the Chinese authorities are allowing the Chinese yuan to depreciate against a basket of currencies in
IT ONLY TAKES ONE INDEX TO CAPTURE THE WORLD THE MODERN INDEX STRATEGY. msci.com
 IT ONLY TAKES ONE INDEX TO CAPTURE THE WORLD THE MODERN INDEX STRATEGY msci.com MSCI DELIVERS THE MODERN INDEX STRATEGY The MSCI ACWI Index, MSCI s flagship global equity benchmark, is designed to represent
Tracking the Growth Catalysts in Emerging Markets
 Tracking the Growth Catalysts in Emerging Markets September 14, 2016 by Nick Niziolek of Calamos Investments The following is an excerpt of remarks made on August 30, 2016. The majority of the improved
Performance Derby: MSCI Regions & Countries STRG, STEG, & LTEG
 Performance Derby: MSCI Regions & Countries STRG, STEG, & LTEG February 7, 2018 Dr. Ed Yardeni 516-972-7683 eyardeni@yardeni.com Joe Abbott 732-497-5306 jabbott@yardeni.com Please visit our sites at blog.yardeni.com
Emerging Market Debt Outlook
 Emerging Market Debt Outlook Live Webcast hosted by: Luz Padilla Portfolio Manager Emerging Markets Fixed Income Fund (DBLEX/DLENX) June 15, 2010 Fund Offerings Emerging Markets Fixed Income Fund Retail
International Statistical Release
 International Statistical Release This release and additional tables of international statistics are available on efama s website (www.efama.org). Worldwide Investment Fund Assets and Flows Trends in the
EQUITY REPORTING & WITHHOLDING. Updated May 2016
 EQUITY REPORTING & WITHHOLDING Updated May 2016 When you exercise stock options or have RSUs lapse, there may be tax implications in any country in which you worked for P&G during the period from the
FTSE Global All Cap Index
 FTSE Russell Factsheet FTSE Global All Cap Index bmktitle1 The FTSE Global All Cap Index is a market-capitalisation weighted index representing the performance of the large, mid and small cap stocks globally.
Quarterly Market Review First Quarter 2016
 Q1 Quarterly Market Review First Quarter 2016 Securities offered through LPL Financial. Member FINRA/SIPC. Investment advice offered through Wealth Advisors Group, a registered investment advisor and separate
Bank of Canada Triennial Central Bank Survey of Foreign Exchange and Over-the-Counter (OTC) Derivatives Markets
 Derivatives Markets") Bank of Canada Triennial Central Bank Survey of Foreign Exchange and Over-the-Counter (OTC) Derivatives Markets Turnover for, and Amounts Outstanding as at June 30, March, 2005 Turnover data for, Table
Bank of Canada Triennial Central Bank Survey of Foreign Exchange and Over-the-Counter (OTC) Derivatives Markets Turnover for, and Amounts Outstanding as at June 30, March, 2005 Turnover data for, Table
The Myth of Diversification: Risk Factors vs. Asset Classes
 The Myth of Diversification: Risk Factors vs. Asset Classes Sébastien Page, CFA Executive Vice President April 2011 PIMCO Canada will retain PIMCO LLC as a subadvisor. PIMCO Canada Corp., 120 Adelaide
Market Bulletin. 4Q15 earnings recap: The never-ending story of oil and the dollar. February 16, In brief. Earnings recap
 Market Bulletin February 16, 2016 4Q15 earnings recap: The never-ending story of oil and the dollar In brief The 4Q15 earnings season has been disappointing, with earnings per share (EPS) expected to decline
WISDOMTREE RULES-BASED METHODOLOGY
 WISDOMTREE RULES-BASED METHODOLOGY WISDOMTREE GLOBAL DIVIDEND INDEXES Last Updated March 2018 Page 1 of 12 WISDOMTREE RULES-BASED METHODOLOGY 1. Overview and Description of Methodology Guide for Global
Quarterly Market Review. Fourth Quarter 2015
 Q4 Quarterly Market Review Fourth Quarter 2015 Quarterly Market Review Fourth Quarter 2015 This report features world capital market performance and a timeline of events for the past quarter. It begins
Chart 2: Fixed Asset Investment (FAI) Year-over-year % change, 3MMA. Chart 1: China Real GDP Growth 12% QoQ Annualized 70% 10% Infrastructure 50%
 Year-over-year % change, 3MMA. Chart 1: China Real GDP Growth 12% QoQ Annualized 70% 10% Infrastructure 50%") Chart 1: China Real GDP Growth 12% 1 YoY QoQ Annualized 8% 6% 4% 2% 1Q11 1Q12 1Q13 1Q14 Source: NBS, FactSet J.P. Morgan Asset Management. Chart 2: Fixed Asset Investment (FAI) Year-over-year % change,
Chart 1: China Real GDP Growth 12% 1 YoY QoQ Annualized 8% 6% 4% 2% 1Q11 1Q12 1Q13 1Q14 Source: NBS, FactSet J.P. Morgan Asset Management. Chart 2: Fixed Asset Investment (FAI) Year-over-year % change,
The Disconnect Continues
 The Disconnect Continues Richard Bernstein June 3, 2011 Our strategies focus on finding disconnects between investor sentiment and the reality of improvement or deterioration in fundamentals. The current
Corrigendum. OECD Pensions Outlook 2012 DOI: ISBN (print) ISBN (PDF) OECD 2012
 ISBN (PDF) OECD 2012") OECD Pensions Outlook 2012 DOI: http://dx.doi.org/9789264169401-en ISBN 978-92-64-16939-5 (print) ISBN 978-92-64-16940-1 (PDF) OECD 2012 Corrigendum Page 21: Figure 1.1. Average annual real net investment
OECD Pensions Outlook 2012 DOI: http://dx.doi.org/9789264169401-en ISBN 978-92-64-16939-5 (print) ISBN 978-92-64-16940-1 (PDF) OECD 2012 Corrigendum Page 21: Figure 1.1. Average annual real net investment
NEUBERGER BERMAN INVESTMENT FUNDS PLC
 The Directors of the Company whose names appear in the Management and Administration section of the Prospectus accept responsibility for the information contained in this document. To the best of the knowledge
Risks and Opportunities in Global Equities Today BCI Global Investment Conference Tom Mann, CFA Senior Portfolio Manager
 Risks and Opportunities in Global Equities Today BCI Global Investment Conference Tom Mann, CFA Senior Portfolio Manager June 2017 For professional investors only. Not suitable for retail clients 05/06/2017
Merrill Lynch Short Term U.S. Govt B
 Release Date 03-0-2003 Page of 5 Overall Rating Morningstar Category Net Assets Merrill Lynch Short Term U.S. Govt B Investment Approach 22 Short Government Funds Equity Style Fixed-Income Style (2-3-2002)
CHICAGO STOCK EXCHANGE, INC. MARKET REGULATION DEPARTMENT INFORMATION CIRCULAR
 January 7, 2015 ETF-015-002 CHICAGO STOCK EXCHANGE, INC. MARKET REGULATION DEPARTMENT INFORMATION CIRCULAR RE: DIREXION DAILY ETFS TO BEGIN TRADING ON CHX Pursuant to Information Circular MR 08-16, the
Part B STATEMENT OF ADDITIONAL INFORMATION
 Part B STATEMENT OF ADDITIONAL INFORMATION SIT LARGE CAP GROWTH FUND, INC. SNIGX SIT MID CAP GROWTH FUND, INC. NBNGX SIT MUTUAL FUNDS, INC, comprised of: SIT BALANCED FUND SIBAX SIT DIVIDEND GROWTH FUND,
Guide to Treatment of Withholding Tax Rates. January 2018
 Guide to Treatment of Withholding Tax Rates Contents 1. Introduction 1 1.1. Aims of the Guide 1 1.2. Withholding Tax Definition 1 1.3. Double Taxation Treaties 1 1.4. Information Sources 1 1.5. Guide Upkeep
PIMCO Research Affiliates Equity (RAE) Fundamental
 Fundamental") PIMCO Research Affiliates Equity (RAE) Fundamental Seek to get more from your equity allocation with a systematic strategy that captures the key benefits of a passive equity approach, with the potential
PIMCO Research Affiliates Equity (RAE) Fundamental Seek to get more from your equity allocation with a systematic strategy that captures the key benefits of a passive equity approach, with the potential
Market Briefing: Correlated Markets
 Market Briefing: Correlated Markets September 25, 217 Dr. Edward Yardeni 516-972-7683 eyardeni@ Mali Quintana 48-664-1333 aquintana@ Please visit our sites at www. blog. thinking outside the box Table
INFORMATION CIRCULAR: DIREXION SHARES ETF TRUST
 INFORMATION CIRCULAR: DIREXION SHARES ETF TRUST TO: FROM: Head Traders, Technical Contacts, Compliance Officers, Heads of ETF Trading, Structured Products Traders NASDAQ / BX / PHLX Listing Qualifications
Bank of Canada Triennial Central Bank Surveys of Foreign Exchange and Over-the-Counter (OTC) Derivatives Markets Turnover for April, 2007 and Amounts
 Derivatives Markets Turnover for April, 2007 and Amounts") Bank of Canada Triennial Central Bank Surveys of Foreign Exchange and Over-the-Counter (OTC) Derivatives Markets Turnover for April, 2007 and Amounts Outstanding as at June 30, 2007 January 4, 2008 Table
Bank of Canada Triennial Central Bank Surveys of Foreign Exchange and Over-the-Counter (OTC) Derivatives Markets Turnover for April, 2007 and Amounts Outstanding as at June 30, 2007 January 4, 2008 Table
Market Correlations: S&P 500
 Market Correlations: S&P 500 September 25, 2017 Dr. Edward Yardeni 516-972-7683 eyardeni@ Debbie Johnson 480-664-1333 djohnson@ Mali Quintana 480-664-1333 aquintana@ Please visit our sites at www. blog.
FTSE Global All Cap Index
 FTSE Russell Factsheet FTSE Global All Cap Index bmktitle1 The FTSE Global All Cap Index is a market-capitalisation weighted index representing the performance of the large, mid and small cap stocks globally.
International Statistical Release
 International Statistical Release This release and additional tables of international statistics are available on efama s website (www.efama.org) Worldwide Investment Fund Assets and Flows Trends in the
M&G Emerging Markets Bond Fund Claudia Calich, Fund Manager. November 2015
 M&G Emerging Markets Bond Fund Claudia Calich, Fund Manager November 2015 Agenda Macro update & government bonds Emerging market corporate bonds Fund positioning Emerging markets risks today Risks Slowing
Invesco Indexing Investable Universe Methodology October 2017
 Invesco Indexing Investable Universe Methodology October 2017 1 Invesco Indexing Investable Universe Methodology Table of Contents Introduction 3 General Approach 3 Country Selection 4 Region Classification