Monthly Market Review Asia Pacific January 2017
|
|
|
- Lionel Fletcher
- 6 years ago
- Views:
Transcription
1 Monthly Market Review Asia Pacific January 2017 Global economy: The Federal Reserve raised its policy rate by 25bps, to 0.5%-0.75%, in its December FOMC meeting, as expected. Its updated projection expects three hikes in 2017, instead of two in September. Economic data in the U.S. continues to be solid, with consumer confidence at its highest since (GTMA P. 23, 26) Despite concerns over rising interest rates and depreciating Chinese yuan, China s economic data remains stable. Its official PMI slipped to 51.4 in December from 51.7 the prior month, but it is still sitting comfortably above the 50-threshold. The producer price index continues to rise, which would help improve manufacturers profit margins. (GTMA P. 5, 6) Equities: Developed market equities continued to benefit in December, with Europe being an outperformer. Euro Stoxx 600 was up 5% in U.S. dollar terms in the month, compared to 2.1% for the S&P 500 and 0.7% for the Nikkei 225. Investors are more upbeat about banks profit outlooks due to steeper yield curves in these markets, as well as prospects of stronger global growth. (GTMA P. 30, 31, 35, 36) Stabilization of the U.S. dollar has helped emerging markets to stabilize. Their performance in December has been more linked with domestic factors. For example, China (CSI 300 in USD terms) was down 7% due to rising onshore interest rates and fear of more currency depreciation. Meanwhile, ASEAN markets and India were higher by 1%-3%. Russia was up almost 9% in USD terms due to a stronger currency as well as pick up in oil prices. (GTMA P. 37, 38, 40) Fixed income: Having breached 2.6% briefly in mid December, the 10yr UST yield corrected modestly back to 2.44% by the end of the year. Most European government yields will experience a similar correction since the ECB remains committed to asset purchases until the end of 2017, even though the monthly purchase amount will decline to EUR60bn after March. (GTMA P. 41) Greater confidence in the U.S. economic outlook continues to benefit corporate credit. The high yield debt spread tightened by another 50bps in December. It is worth noting that credit spreads for energy companies are now on par with the broader index as fear over widespread default in the energy sector has eased. Emerging market spreads also tightened in the month. (GTMA P. 41, 45, 47) Other assets: Having broken above 100 in November, the Dollar Index went on to push above 103, with the Japanese yen and British pound facing more of the depreciation pressure. It has since consolidated, considering the U.S. dollar is one of the most expensive currencies relative to its 10-year average. Asian investors are also concerned over the pace of Chinese yuan depreciation and fresh measures by Chinese authorities to stem capital outflows. (GTMA P. 53, 54) The prospects of cuts in output have supported the price of crude oil, despite recent strength in the U.S. dollar. Brent crude ended the year at $56.8pb, the highest point in In contrast, gold softened on the back of rising yield and strong USD, ending the year at $1147/oz. (GTMA P. 55, 56)


2 China: Exchange rate and foreign reserves GTM Asia 8 Regional and local economy 2


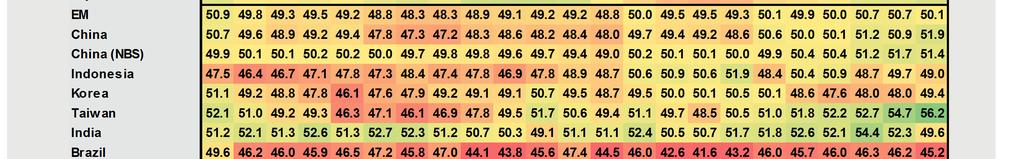
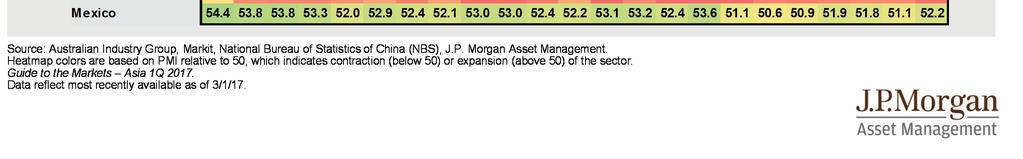
3 Global Purchasing Managers Index (PMI): Manufacturing GTM Asia 13 Global economy 3


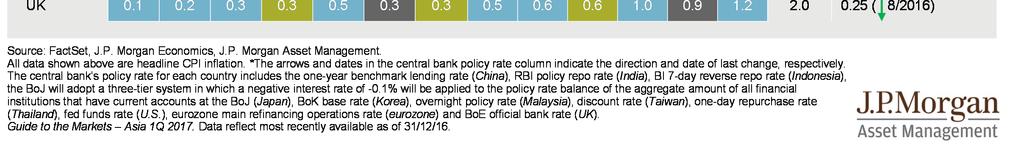
4 Inflation and policy rates GTM Asia 16 Global economy 4

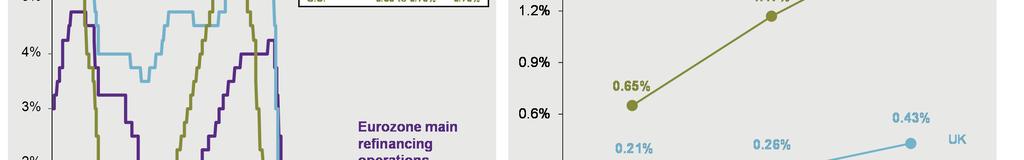
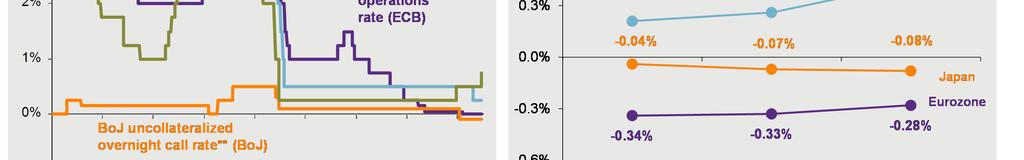
5 G4 policy rates and market expectations GTM Asia 17 Global economy 5


6 United States: Cyclical indicators GTM Asia 23 Global economy 6


7 Global and Asia equity markets: Returns GTM Asia 30 Equities 7

8 Global equity markets: Valuations GTM Asia 32 Equities 8


9 Global fixed income: Yields and returns GTM Asia 41 Fixed income 9

10 Global fixed income: Valuations GTM Asia 43 Fixed income 10


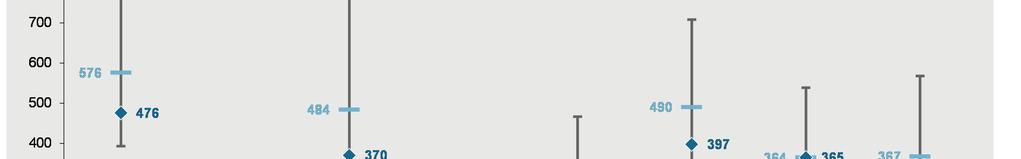
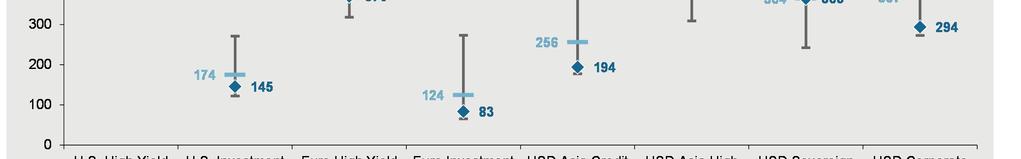
11 U.S. high yield bonds GTM Asia 45 Fixed income 11


12 Emerging markets debt: Yield comparison GTM Asia 47 Fixed income 12


13 13 Asset class returns GTM Asia 49 Other asset classes


14 Current account balance and currency valuations GTM Asia 54 Other asset classes 14


15 Oil: Short-term market dynamics GTM Asia 55 Other asset classes 15
16 J.P. Morgan Asset Management: Index Definitions All indexes are unmanaged and an individual cannot invest directly in an index. Index returns do not include fees or expenses. The S&P 500 Index is widely regarded as the best single gauge of the U.S. equities market. This world-renowned index includes a representative sample of 500 leading companies in leading industries of the U.S. economy. Although the S&P 500 Index focuses on the large-cap segment of the market, with approximately 75% coverage of U.S. equities, it is also an ideal proxy for the total market. An investor cannot invest directly in an index. The Tokyo Stock Price Index ('TOPIX') is a composite index of all common stocks listed on the First Section of Tokyo Stock Exchange (TSE).The index is basically a measure of the changes in aggregate market value of TSE common stocks. The base for the index is the aggregate market value of its component stocks as of the close on January 4, The aggregate market value is calculated by multiplying the number of listed shares of each component stock by its price and totaling the products derived there from. The Bombay Exchange Sensitive Index ( SENSEX), first compiled in 1986, was calculated on a "Market Capitalization-Weighted" methodology of 30 component stocks representing large, well-established and financially sound companies across key sectors. The base year of SENSEX was taken as SENSEX today is widely reported in both domestic and international markets through print as well as electronic media. It is scientifically designed and is based on globally accepted construction and review methodology. Since September 1, 2003, SENSEX is being calculated on a free-float market capitalization methodology. The Korea Composite Stock Price Index ( KOSPI) is market capitalization based index on all common stocks listed on the Stock Market Division of the Korea Exchange (KRX) and excludes preferred stocks. The stock price index is calculated using the actual price traded on the market and not the base price used for market management such as establishment of price change limits. When no market price is available for issues that are not being traded or have halted trading, the latest closing price is used. KOSPI was a assigned a base index of 100 set to January 4, The China Shenzhen Composite Index is an actual market-cap weighted index that tracks the stock performance of all the A-share and B-share lists on Shenzhen Stock Exchange. The index was developed on April 3, 1991 with a base price of 100. The MSCI EAFE (Europe, Australia, Far East) Net Index is recognized as the pre-eminent benchmark in the United States to measure international equity performance. It comprises 21 MSCI country indexes, representing the developed markets outside of North America. The MSCI Emerging Markets Index SM is a free float-adjusted market capitalization index that is designed to measure equity market performance in the global emerging markets. As of June 2007, the MSCI Emerging Markets Index consisted of the following 25 emerging market country indices: Argentina, Brazil, Chile, China, Colombia, Czech Republic, Egypt, Hungary, India, Indonesia, Israel, Jordan, Korea, Malaysia, Mexico, Morocco, Pakistan, Peru, Philippines, Poland, Russia, South Africa, Taiwan, Thailand, and Turkey. The MSCI ACWI (All Country World Index) Index is a free float-adjusted market capitalization weighted index that is designed to measure the equity market performance of developed and emerging markets. As of June 2009 the MSCI ACWI consisted of 45 country indices comprising 23 developed and 22 emerging market country indices. The following MSCI Total Return Indices SM are calculated with gross dividends: This series approximates the maximum possible dividend reinvestment. The amount reinvested is the dividend distributed to individuals resident in the country of the company, but does not include tax credits. The MSCI Europe Index SM is a free float-adjusted market capitalization index that is designed to measure developed market equity performance in Europe. As of June 2007, the MSCI Europe Index consisted of the following 16 developed market country indices: Austria, Belgium, Denmark, Finland, France, Germany, Greece, Ireland, Italy, the Netherlands, Norway, Portugal, Spain, Sweden, Switzerland and the United Kingdom. The MSCI Pacific Index SM is a free float-adjusted market capitalization index that is designed to measure equity market performance in the Pacific region. As of June 2007, the MSCI Pacific Index consisted of the following 5 Developed Market countries: Australia, Hong Kong, Japan, New Zealand, and Singapore. The MSCI Europe ex UK Index SM is a free float-adjusted market capitalization weighted index that is designed to measure the equity market performance of the developed markets in Europe, excluding the United Kingdom. The MSCI Europe ex UK Index consists of the following 15 developed market country indices: Austria, Belgium, Denmark, Finland, France, Germany, Greece, Ireland, Italy, the Netherlands, Norway, Portugal, Spain, Sweden, and Switzerland. The MSCI Pacific ex Japan Index SM is a free float-adjusted market capitalization index that is designed to measure equity market performance in the Pacific region, excluding Japan. As of June 2007, the MSCI Pacific Index consisted of the following 4 Developed Market countries: Australia, Hong Kong, New Zealand, and Singapore. The MSCI USA Index SM is designed to measure the performance of the large and mid cap segments of the U.S. market. With 586 constituents, the index covers approximately 84% of the free float-adjusted market capitalization in the U.S.. The MSCI USA Index was launched on Dec ember 31, The MSCI China Index SM captures large and mid cap representation across China H shares, B shares, Red chips and P chips. With 148 constituents, the index covers about 84% of this China equity universe. The MSCI China Index was launched on December 31, The MSCI Indonesia Index SM is designed to measure the performance of the large and mid cap segments of the Indonesian market. With 25 constituents, the index covers about 84% of the Indonesian equity universe. The MSCI Indonesia Index was launched on December 31, The MSCI Korea Index SM is designed to measure the performance of the large and mid cap segments of the South Korean market. With 105 constituents, the index covers about 84% of the Korean equity universe. The MSCI Korea Index was launched on December 31, The MSCI India Index SM is designed to measure the performance of the large and mid cap segments of the Indian market. With 71 constituents, the index covers about 84% of the Indian equity universe. The MSCI India Index was launched on December 31, The MSCI Japan Index SM is designed to measure the performance of the large and mid cap segments of the Japan market. With 315 constituents, the index covers approximately 84% of the free float-adjusted market capitalization in Japan. The MSCI Japan Index was launched on December 31, The MSCI Hong Kong Index SM is designed to measure the performance of the large and mid cap segments of the Hong Kong market. With 42 constituents, the index covers approximately 84% of the free float-adjusted market capitalization of the Hong Kong equity universe. The MSCI Hong Kong Index was launched on December 31, The MSCI Taiwan Index SM is designed to measure the performance of the large and mid cap segments of the Taiwan market. With 113 constituents, the index covers approximately 84% of the free float-adjusted market capitalization in Taiwan. The MSCI Taiwan Index was launched on December 31, West Texas Intermediate (WTI) is the underlying commodity for the New York Mercantile Exchange's oil futures contracts. The Bloomberg Commodity Index is calculated on an excess return basis and reflects commodity futures price movements. The index rebalances annually weighted 2/3 by trading volume and 1/3 by world production and weightcaps are applied at the commodity, sector and group level for diversification. Roll period typically occurs from 6th-10th business day based on the roll schedule. The Bloomberg Commodity Subindexes represent commodity groups and sectors, as well as single commodities, that make up the Bloomberg Commodity Index. The subindexes track exchange-traded futures of physical commodities, and the commodity groups and sectors, like in the case of the broad index, are weighted to account for economic significance and market liquidity. The various subindexes include Agriculture, Energy, Livestock, Grains, Industrial Metals, Precious Metals and Softs. 16
17 J.P. Morgan Asset Management: Index Definitions, Risks and Disclosures The Euro Stoxx 600 Index represents large, mid and small capitalization companies across 18 European countries. The Bloomberg Barclays High Yield Index covers the universe of fixed rate, non-investment grade debt. Pay-in-kind (PIK) bonds, Eurobonds, and debt issues from countries designated as emerging markets (e.g., Argentina, Brazil, Venezuela, etc.) are excluded, but Canadian and global bonds (SEC registered) of issuers in non-emg countries are included. Original issue zeroes, step-up coupon structures, and 144-As are also included. The Bloomberg Barclays 1-3 Month U.S. Treasury Bill Index includes all publicly issued zero-coupon U.S. Treasury Bills that have a remaining maturity of less than 3 months and more than 1 month, are rated investment grade, and have $250 million or more of outstanding face value. In addition, the securities must be denominated in U.S. dollars and must be fixed rate and non convertible. The Bloomberg Barclays Corporate Bond Index is the Corporate component of the U.S. Credit index. The Bloomberg Barclays TIPS Index consists of Inflation-Protection securities issued by the U.S. Treasury. The J.P. Morgan EMBI Global Index includes U.S. dollar denominated Brady bonds, Eurobonds, traded loans and local market debt instruments issued by sovereign and quasi-sovereign entities. The J.P. Morgan GBI-EM Global Diversified consists of regularly traded, liquid fixed-rate, domestic currency government bonds to which international investors can gain exposure. The weightings among the countries are more evenly distributed within this index. The J.P. Morgan Corporate Emerging Markets Bond Index (CEMBI): The CEMBI tracks total returns of US dollardenominated debt instruments issued by corporate entities in Emerging Markets countries, and consists of an investable universe of corporate bonds. The J.P. Morgan Domestic High Yield Index is designed to mirror the investable universe of the U.S. dollar domestic high yield corporate debt market. The VIX-CBOE Volatility Index measures market expectations of near-term volatility conveyed by S&P 500 Index (SPX) option prices. The MOVE-Merrill Lynch Option Volatility Index is a blended implied normal volatility for constant one-month atthe-money options on U.S. Treasuries. Price to forward earnings is a measure of the price-to-earnings ratio (P/E) using forecasted earnings. Price to book value compares a stock's market value to its book value. Price to cash flow is a measure of the market's expectations of a firm's future financial health. Price to dividends is the ratio of the price of a share on a stock exchange to the dividends per share paid in the previous year, used as a measure of a company's potential as an investment. Bonds are subject to interest rate risks. Bond prices generally fall when interest rates rise. The price of equity securities may rise, or fall because of changes in the broad market or changes in a company s financial condition, sometimes rapidly or unpredictably. These price movements may result from factors affecting individual companies, sectors or industries, or the securities market as a whole, such as changes in economic or political conditions. Equity securities are subject to stock market risk meaning that stock prices in general may decline over short or extended periods of time. Small-capitalization investing typically carries more risk than investing in well-established "blue-chip" companies since smaller companies generally have a higher risk of failure. Historically, smaller companies' stock has experienced a greater degree of market volatility than the average stock. Mid-capitalization investing typically carries more risk than investing in well-established "blue-chip" companies. Historically, mid-cap companies' stock has experienced a greater degree of market volatility than the average stock. Real estate investments may be subject to a higher degree of market risk because of concentration in a specific industry, sector or geographical sector. Real estate investments may be subject to risks including, but not limited to, declines in the value of real estate, risks related to general and economic conditions, changes in the value of the underlying property owned by the trust and defaults by borrower. International investing involves a greater degree of risk and increased volatility. Changes in currency exchange rates and differences in accounting and taxation policies can raise or lower returns. Also, some markets may not be as politically and economically stable as other nations. Investments in emerging markets can be more volatile. The normal risks of international investing are heightened when investing in emerging markets. In addition, the small size of securities markets and the low trading volume may lead to a lack of liquidity, which leads to increased volatility. Also, emerging markets may not provide adequate legal protection for private or foreign investment or private property. Investments in commodities may have greater volatility than investments in traditional securities, particularly if the instruments involve leverage. The value of commodity-linked derivative instruments may be affected by changes in overall market movements, commodity index volatility, changes in interest rates, or factors affecting a particular industry or commodity, such as drought, floods, weather, livestock disease, embargoes, tariffs and international economic, political and regulatory developments. Use of leveraged commodity-linked derivatives creates an opportunity for increased return but, at the same time, creates the possibility for greater loss. Derivatives may be riskier than other types of investments because they may be more sensitive to changes in economic or market conditions than other types of investments and could result in losses that significantly exceed the original investment. The use of derivatives may not be successful, resulting in investment losses, and the cost of such strategies may reduce investment returns. There is no guarantee that the use of long and short positions will succeed in limiting an investor's exposure to domestic stock market movements, capitalization, sector swings or other risk factors. Investing using long and short selling strategies may have higher portfolio turnover rates. Short selling involves certain risks, including additional costs associated with covering short positions and a possibility of unlimited loss on certain short sale positions. 17
18 Monthly Market Review Asia Pacific January 2017 The Market Insights program provides comprehensive data and commentary on global markets without reference to products. Designed as a tool to help clients understand the markets and support investment decision-making, the program explores the implications of current economic data and changing market conditions. The views contained herein are not to be taken as an advice or a recommendation to buy or sell any investment in any jurisdiction, nor is it a commitment from J.P. Morgan Asset Management or any of its subsidiaries to participate in any of the transactions mentioned herein. Any forecasts, figures, opinions or investment techniques and strategies set out are for information purposes only, based on certain assumptions and current market conditions and are subject to change without prior notice. All information presented herein is considered to be accurate at the time of writing. This material does not contain sufficient information to support an investment decision and it should not be relied upon by you in evaluating the merits of investing in any securities or products. In addition, users should make an independent assessment of the legal, regulatory, tax, credit, and accounting implications and determine, together with their own professional advisers, if any investment mentioned herein is believed to be suitable to their personal goals. Investors should ensure that they obtain all available relevant information before making any investment. It should be noted that investment involves risks, the value of investments and the income from them may fluctuate in accordance with market conditions and taxation agreements and investors may not get back the full amount invested. Both past performance and yield may not be a reliable guide to future performance. J.P. Morgan Asset Management is the brand for the asset management business of JPMorgan Chase & Co. and its affiliates worldwide. This communication is issued by the following entities: in the United Kingdom by JPMorgan Asset Management (UK) Limited, which is authorized and regulated by the Financial Conduct Authority; in other EEA jurisdictions by JPMorgan Asset Management (Europe) S.à r.l.; in Hong Kong by JF Asset Management Limited, or JPMorgan Funds (Asia) Limited, or JPMorgan Asset Management Real Assets (Asia) Limited; in Singapore by JPMorgan Asset Management (Singapore) Limited (Co. Reg. No K), or JPMorgan Asset Management Real Assets (Singapore) Pte Ltd (Co. Reg. No E); in Taiwan by JPMorgan Asset Management (Taiwan) Limited; in Japan by JPMorgan Asset Management (Japan) Limited which is a member of the Investment Trusts Association, Japan, the Japan Investment Advisers Association, Type II Financial Instruments Firms Association and the Japan Securities Dealers Association and is regulated by the Financial Services Agency (registration number Kanto Local Finance Bureau (Financial Instruments Firm) No. 330 ); in Korea by JPMorgan Asset Management (Korea) Company Limited; in Australia to wholesale clients only as defined in section 761A and 761G of the Corporations Act 2001 (Cth) by JPMorgan Asset Management (Australia) Limited (ABN ) (AFSL ); in Brazil by Banco J.P. Morgan S.A.; in Canada for institutional clients use only by JPMorgan Asset Management (Canada) Inc., and in the United States by JPMorgan Distribution Services Inc. and J.P. Morgan Institutional Investments, Inc., both members of FINRA/SIPC.; and J.P. Morgan Investment Management Inc. In APAC, distribution is for Hong Kong, Taiwan, Japan and Singapore. For all other countries in APAC, to intended recipients only. Copyright 2017 JPMorgan Chase & Co. All rights reserved Material ID: 0903c02a81c113ff
Monthly Market Review
 Monthly Market Review Global economy: The U.S. Federal Reserve kept its policy rate unchanged in April, as expected. However, it did not provide a clear direction on the timing of the next hike. While
Monthly Market Review Asia Pacific October 2017
 Monthly Market Review Asia Pacific October 2017 Global economy: The Federal Reserve (Fed), in line with market expectations, has announced that it will start to reduce its balance sheet in October. Market
Monthly Market Review Asia Pacific November 2017
 Monthly Market Review Pacific November 2017 economy: 3Q economic growth in the U.S., eurozone and China all beat expectations. The U.S. expanded by 3% SAAR, helped by inventory and a smaller trade deficit,
Monthly Market Review Asia Pacific December 2017
 Monthly Market Review Pacific December 2017 economy: U.S. 3Q real GDP growth was revised up to 3.3% SAAR, from 3.0%, amid stronger domestic final sales, inventories and trade. One of the more noteworthy
China: Exchange rate and foreign reserves
 China: Exchange rate and foreign reserves 9 Chinese yuan exchange rate: NEER vs. USD Index, rebased 2013 = 100 USD / CNY and change in FX reserves Change in monthly FX reserves (USD billions) USD / CNY
Quarterly Investment Update First Quarter 2017
 Quarterly Investment Update First Quarter 2017 Market Update: A Quarter in Review March 31, 2017 CANADIAN STOCKS INTERNATIONAL STOCKS Large Cap Small Cap Growth Value Large Cap Small Cap Growth Value Emerging
San Francisco Retiree Health Care Trust Fund Education Materials on Public Equity
 M E K E T A I N V E S T M E N T G R O U P 5796 ARMADA DRIVE SUITE 110 CARLSBAD CA 92008 760 795 3450 fax 760 795 3445 www.meketagroup.com The Global Equity Opportunity Set MSCI All Country World 1 Index
DIVERSIFICATION. Diversification
 Diversification Helps you capture what global markets offer Reduces risks that have no expected return May prevent you from missing opportunity Smooths out some of the bumps Helps take the guesswork out
Wells Fargo Target Date CITs E3
 All information is as of 12-31-17 unless otherwise indicated. Overview General fund information Fund sponsor and manager: Wells Fargo Bank, N.A. Fund advisor: Wells Capital Management Inc. Portfolio manager:
Vantage Investment Partners. Quarterly Market Review
 Vantage Investment Partners Quarterly Market Review First Quarter 2016 Quarterly Market Review First Quarter 2016 This report features world capital market performance and a timeline of events for the
Wells Fargo Target Date Funds
 All information is as of 9-30-17 unless otherwise indicated. Overview General fund information Portfolio managers: Kandarp Acharya, CFA, FRM; Christian Chan, CFA; and Petros Bocray, CFA, FRM Subadvisor:
Summit Strategies Group
 April 0, 205 US Equity: All Cap Russell 000 Index 0.45 5.9 2.26 2.74 6.86 4. 8.68 8.66 Dow Jones US Total Stock Market Index 0.46 5.9 2.27 2.67 6.78 4.7 8.78 8.8 US Equity: Large Cap Russell 000 Index
DFA Global Equity Portfolio (Class F) Quarterly Performance Report Q2 2014
 Quarterly Performance Report Q2 2014") DFA Global Equity Portfolio (Class F) Quarterly Performance Report Q2 2014 This presentation has been prepared by Dimensional Fund Advisors Canada ULC ( DFA Canada ), manager of the Dimensional Funds.
DFA Global Equity Portfolio (Class F) Quarterly Performance Report Q2 2014 This presentation has been prepared by Dimensional Fund Advisors Canada ULC ( DFA Canada ), manager of the Dimensional Funds.
Quarterly Investment Update First Quarter 2018
 Quarterly Investment Update First Quarter 2018 Dimensional Fund Advisors Canada ULC ( DFA Canada ) is not affiliated with [insert name of Advisor]. DFA Canada is a separate and distinct company. Market
Summit Strategies Group
 As of December 3, 203 US Equity: All Cap Russell 3000 Index 2.64 0.0 33.55 33.55 6.24 8.7 6.50 7.88 7.09 Dow Jones US Total Stock Market Index 2.63 0. 33.47 33.47 6.23 8.86 6.68 8.0 6.90 US Equity: Large
DFA Global Equity Portfolio (Class F) Performance Report Q2 2017
 Performance Report Q2 2017") DFA Global Equity Portfolio (Class F) Performance Report Q2 2017 This presentation has been prepared by Dimensional Fund Advisors Canada ULC ( DFA Canada ), manager of the Dimensional Funds. This presentation
DFA Global Equity Portfolio (Class F) Performance Report Q2 2017 This presentation has been prepared by Dimensional Fund Advisors Canada ULC ( DFA Canada ), manager of the Dimensional Funds. This presentation
DFA Global Equity Portfolio (Class F) Performance Report Q3 2018
 Performance Report Q3 2018") DFA Global Equity Portfolio (Class F) Performance Report Q3 2018 This presentation has been prepared by Dimensional Fund Advisors Canada ULC ( DFA Canada ), manager of the Dimensional Funds. This presentation
DFA Global Equity Portfolio (Class F) Performance Report Q3 2018 This presentation has been prepared by Dimensional Fund Advisors Canada ULC ( DFA Canada ), manager of the Dimensional Funds. This presentation
DFA Global Equity Portfolio (Class F) Performance Report Q4 2017
 Performance Report Q4 2017") DFA Global Equity Portfolio (Class F) Performance Report Q4 2017 This presentation has been prepared by Dimensional Fund Advisors Canada ULC ( DFA Canada ), manager of the Dimensional Funds. This presentation
DFA Global Equity Portfolio (Class F) Performance Report Q4 2017 This presentation has been prepared by Dimensional Fund Advisors Canada ULC ( DFA Canada ), manager of the Dimensional Funds. This presentation
Q2 Quarterly Market Review Second Quarter 2015
 Q2 Quarterly Market Review Second Quarter 2015 Quarterly Market Review Second Quarter 2015 This report features world capital market performance and a timeline of events for the past quarter. It begins
DFA Global Equity Portfolio (Class F) Performance Report Q3 2015
 Performance Report Q3 2015") DFA Global Equity Portfolio (Class F) Performance Report Q3 2015 This presentation has been prepared by Dimensional Fund Advisors Canada ULC ( DFA Canada ), manager of the Dimensional Funds. This presentation
DFA Global Equity Portfolio (Class F) Performance Report Q3 2015 This presentation has been prepared by Dimensional Fund Advisors Canada ULC ( DFA Canada ), manager of the Dimensional Funds. This presentation
Portfolio Strategist Update from BlackRock Active Opportunity ETF Portfolios
 Portfolio Strategist Update from BlackRock Active Opportunity ETF Portfolios As of Sept. 30, 2017 Ameriprise Financial Services, Inc., ("Ameriprise Financial") is the investment manager for Active Opportunity
Summit Strategies Group
 US Equity: All Cap Russell 000 Index -.69 2.40.9 6.22 0.59 4.7 2.79 9.78 Dow Jones US Total Stock Market Index -.70 2.4.4 6.2 0.55 4.2 2.76 9.8 US Equity: Large Cap Russell 000 Index -.67 2.75.62 6.70
Summit Strategies Group
 US Equity: All Cap Russell 000 Index.72 7.7 5.67 26.29 9.92.85.87 7.64 Dow Jones US Total Stock Market Index - - - - - - - - US Equity: Large Cap Russell 000 Index.87 7.95 5.96 25.5 0.9.94.9 7.69 Russell
NORTH AMERICAN UPDATE
 NORTH AMERICAN UPDATE December 6 th, 2018 INNOVATION INSIGHT GROWTH SINCE 1968 TOUGH YEAR FOR RETURNS AROUND THE WORLD Index Year-to-date Performance MSCI World -1.2% MSCI USA 3.9% MSCI Canada -3.9% MSCI
Quarterly Market Review. First Quarter 2015
 Q1 Quarterly Market Review First Quarter 2015 Quarterly Market Review First Quarter 2015 This report features world capital market performance and a timeline of events for the past quarter. It begins with
Summit Strategies Group
 May, 208 US Equity: All Cap Russell 000 Index 2.82.4 2.55 5.06 0.72 2.85 2.6 9.2 Dow Jones US Total Stock Market Index 2.8.5 2.57 5.09 0.68 2.78 2.58 9.27 US Equity: Large Cap Russell 000 Index 2.55 0.57
Summit Strategies Group
 June 0, 208 US Equity: All Cap Russell 000 Index 0.65.89.22 4.78.58.29.0 0.2 Dow Jones US Total Stock Market Index 0.66.87.25 4.79.56.22 2.98 0.28 US Equity: Large Cap Russell 000 Index 0.65.57 2.85 4.54.64.7.2
Summit Strategies Group
 August, 208 US Equity: All Cap Russell 000 Index.5 7.65 0.9 20.25 5.86 4.25 5.50 0.89 Dow Jones US Total Stock Market Index.48 7.64 0.4 20.26 5.82 4.2 5.45 0.94 US Equity: Large Cap Russell 000 Index.45
Summit Strategies Group
 October, 208 US Equity: All Cap Russell 000 Index -7.6 -.95 2.4 6.60.27 0.8.8.5 Dow Jones US Total Stock Market Index -7.4-4.04 2.9 6.56.24 0.76.75.6 US Equity: Large Cap Russell 000 Index -7.08 -.5 2.67
Freedom Quarterly Market Commentary // 2Q 2018
 ASSET MANAGEMENT SERVICES Freedom Quarterly Market Commentary // 2Q 2018 SECOND QUARTER HIGHLIGHTS U.S. economic growth and earnings lead the world The value of the dollar rises, affecting currency exchange
This statistical appendix presents data
 STATISTICAL APPENDIX This statistical appendix presents data on financial developments in key financial centers and emerging markets. It is designed to complement the analysis in the text by providing
Rebalancing International Equities: What to Know. What to Consider.
 Success Should Not Be Cyclical Perspective Rebalancing International Equities: What to Know. What to Consider. Executive Summary Diversified investors may be frustrated by the underperformance of their
This statistical appendix presents data
 This statistical appendix presents data on financial developments in key financial centers and emerging markets. It is designed to complement the analysis in the text by providing additional data that
This statistical appendix presents data
 This statistical appendix presents data on financial developments in key financial centers and emerging markets. It is designed to complement the analysis in the text by providing additional data that
All-Country Equity Allocator February 2018
 Leila Heckman, Ph.D. lheckman@dcmadvisors.com 917-386-6261 John Mullin, Ph.D. jmullin@dcmadvisors.com 917-386-6262 Charles Waters cwaters@dcmadvisors.com 917-386-6264 All-Country Equity Allocator February
Solving for Fixed Income
 MARKET INSIGHTS Solving for Fixed Income Using Market Insights to achieve better outcomes Q4 2016 SINCE 2004, J.P. MORGAN HAS PRODUCED MARKET INSIGHTS TO HELP INDIVIDUAL INVESTORS UNDERSTAND AND MAKE THEIR
Reporting practices for domestic and total debt securities
 Last updated: 27 November 2017 Reporting practices for domestic and total debt securities While the BIS debt securities statistics are in principle harmonised with the recommendations in the Handbook on
Summit Strategies Group
 October, 208 US Equity: All Cap Russell 000 Index -7.6 -.95 2.4 6.60.27 0.8.8.5 Dow Jones US Total Stock Market Index -7.4-4.04 2.9 6.56.24 0.76.75.6 US Equity: Large Cap Russell 000 Index -7.08 -.5 2.67
Market Briefing: Global Markets
 Market Briefing: Global Markets July 6, 218 Dr. Edward Yardeni 516-972-7683 eyardeni@ Mali Quintana 48-664-1333 aquintana@ Please visit our sites at blog. thinking outside the box Table Of Contents Table
Quarterly Investment Update
 Quarterly Investment Update Third Quarter 2017 Dimensional Fund Advisors Canada ULC ( DFA Canada ) is not affiliated with The CM Group DFA Canada is a separate and distinct company Market Update: A Quarter
STOXX EMERGING MARKETS INDICES. UNDERSTANDA RULES-BA EMERGING MARK TRANSPARENT SIMPLE
 STOXX Limited STOXX EMERGING MARKETS INDICES. EMERGING MARK RULES-BA TRANSPARENT UNDERSTANDA SIMPLE MARKET CLASSIF INTRODUCTION. Many investors are seeking to embrace emerging market investments, because
M&G Emerging Markets Bond Fund Claudia Calich, Fund Manager. November 2015
 M&G Emerging Markets Bond Fund Claudia Calich, Fund Manager November 2015 Agenda Macro update & government bonds Emerging market corporate bonds Fund positioning Emerging markets risks today Risks Slowing
Quarterly Investment Update
 Quarterly Investment Update Second Quarter 2017 Dimensional Fund Advisors Canada ULC ( DFA Canada ) is not affiliated with The CM Group DFA Canada is a separate and distinct company Market Update: A Quarter
Using Market Insights to discuss Principles of successful long-term investing
 Using Market Insights to discuss Principles of successful long-term investing Nandini Ramakrishnan Learning objectives Describe the principles of successful long-term investing Give examples of time tested
Chart Collection for Morning Briefing
 Chart Collection for Morning Briefing February 12, 219 Dr. Edward Yardeni 516-972-7683 eyardeni@ Mali Quintana 48-664-1333 aquintana@ Please visit our sites at blog. thinking outside the box 25 Figure
This statistical appendix presents data on
 c h a p t e r X STATISTICAL APPENDIX This statistical appendix presents data on financial developments in key financial centers and emerging and other markets. It is designed to complement the analysis
The Current and Long- Term Case for Overseas Investing
 The Current and Long- Term Case for Overseas Investing Q1 2017 TP666 Bank of America Corporation ( Bank of America ) is a financial holding company that, through its subsidiaries and affiliated companies,
Market Bulletin. Earnings will set you free. October 20, In brief. The benefits of breadth
 Market Bulletin October 20, 2017 Earnings will set you free In brief Healthy gains in global equity markets this year have been driven by a rebound in earnings growth, with the breadth of profit growth
Global Select International Select International Select Hedged Emerging Market Select
 International Exchange Traded Fund (ETF) Managed Strategies ETFs provide investors a liquid, transparent, and low-cost avenue to equities around the world. Our research has shown that individual country
WORKING TOGETHER Design Build Protect
 WORKING TOGETHER Design Build Protect 2018 LWI Financial Inc. All rights reserved. LWI Financial Inc. ( Loring Ward ) is an investment adviser registered with the Securities and Exchange Commission. Securities
All-Country Equity Allocator July 2018
 Leila Heckman, Ph.D. lheckman@dcmadvisors.com 917-386-6261 John Mullin, Ph.D. jmullin@dcmadvisors.com 917-386-6262 Allison Hay ahay@dcmadvisors.com 917-386-6264 All-Country Equity Allocator July 2018 A
MARKET INSIGHTS. Guide to the Markets. Alternatives. 4Q 2016 As of September 30, 2016
 MARKET INSIGHTS Guide to the s Alternatives 4Q 216 As of September 3, 216 Asset class correlations 58 GTM Asia 2 1-year correlations Asia ex- Japan equity EM equity U.S. equity Asian USD bond USD EMD EM
Tracking the Growth Catalysts in Emerging Markets
 Tracking the Growth Catalysts in Emerging Markets September 14, 2016 by Nick Niziolek of Calamos Investments The following is an excerpt of remarks made on August 30, 2016. The majority of the improved
Ticker Fund Name CUSIP. Market Vectors MSCI Emerging Markets. Market Vectors MSCI Emerging Markets. Market Vectors MSCI International
 EDGA Exchange, Inc. & EDGX Exchange, Inc. Regulatory Information Circular Circular Number: 2014-012 Contact: Jeff Rosenstrock Date: January 23, 2014 Telephone: (201) 942-8295 Subject: Market Vectors MSCI
CFI Multi-Strategy Equity Fund, LLC Objective and Strategy September 30, 2015
 Objective and Strategy OBJECTIVE To offer an actively managed, multi-manager investment program that will provide broad exposure to global equity markets. The fund seeks to add value net of fees above
Global ex US PE / VC Benchmark Commentary Quarter and Year Ending December 31, 2015
 Global ex US PE / VC Benchmark Commentary Quarter and Year Ending December 31, 2015 Overview The Cambridge Associates LLC Global ex US Developed Markets Private Equity and Venture Capital (PE/VC) Index
The Disconnect Continues
 The Disconnect Continues Richard Bernstein June 3, 2011 Our strategies focus on finding disconnects between investor sentiment and the reality of improvement or deterioration in fundamentals. The current
Does Economic Growth in Emerging Markets Drive Equity Returns?
 Does Economic Growth in Emerging Markets Drive Equity Returns? Conrad Saldanha, CFA Portfolio Manager Emerging Market Equities August 00 Conventional wisdom suggests that a country s economic growth should
International Thematic (ETFs) Select UMA Managed Advisory Portfolios Solutions
 Select UMA Managed Advisory Portfolios Solutions") Managed Advisory Portfolios Solutions 2000 Westchester Avenue Purchase, New York 10577 Style: Sub-Style: Firm AUM: Firm Strategy AUM: International Equities $912.3 million $36.3 million Year Founded: GIMA
Managed Advisory Portfolios Solutions 2000 Westchester Avenue Purchase, New York 10577 Style: Sub-Style: Firm AUM: Firm Strategy AUM: International Equities $912.3 million $36.3 million Year Founded: GIMA
WORKING TOGETHER Design Build Protect
 WORKING TOGETHER Design Build Protect Presenter Presenter Title, Loring Ward 2016 LWI Financial Inc. All rights reserved. LWI Financial Inc. ( Loring Ward ) is an investment adviser registered with the
Market Correlations: Trade-Weighted Dollar
 Market Correlations: Trade-Weighted Dollar March 11, 218 Dr. Edward Yardeni 516-972-7683 eyardeni@ Joe Abbott 732-497-536 jabbott@ Mali Quintana 48-664-1333 aquintana@ Please visit our sites at www. blog.
Emerging Market Debt Outlook
 Emerging Market Debt Outlook Live Webcast hosted by: Luz Padilla Portfolio Manager Emerging Markets Fixed Income Fund (DBLEX/DLENX) June 15, 2010 Fund Offerings Emerging Markets Fixed Income Fund Retail
A Classic Barometer. Insights April Richard Bernstein, Chief Executive and Chief Investment Officer. A classic barometer says US ok; EM not.
 , Chief Executive and Chief Investment Officer Advisors Independent investment advisor with a unique top-down, macro approach to investing with quantitative security selection. A Classic Barometer $2.9B
BlackRock Developed World Index Sub-Fund
 KEY INVESTOR INFORMATION BlackRock Developed World Index Sub-Fund A sub-fund of BlackRock Index Selection Fund Objectives and Investment Policy This document provides you with key investor information
INVESTMENT MARKET UPDATE UBC FACULTY PENSION PLAN
 INVESTMENT MARKET UPDATE UBC FACULTY PENSION PLAN MIKE LESLIE, FACULTY PENSION PLAN NEIL WATSON, LEITH WHEELER FEBRUARY 12, 2014 Presenters Mike Leslie Executive Director, Investments Faculty Pension Plan
Bank of Canada Triennial Central Bank Surveys of Foreign Exchange and Over-the-Counter (OTC) Derivatives Markets Turnover for April, 2007 and Amounts
 Derivatives Markets Turnover for April, 2007 and Amounts") Bank of Canada Triennial Central Bank Surveys of Foreign Exchange and Over-the-Counter (OTC) Derivatives Markets Turnover for April, 2007 and Amounts Outstanding as at June 30, 2007 January 4, 2008 Table
Bank of Canada Triennial Central Bank Surveys of Foreign Exchange and Over-the-Counter (OTC) Derivatives Markets Turnover for April, 2007 and Amounts Outstanding as at June 30, 2007 January 4, 2008 Table
Bank of Canada Triennial Central Bank Survey of Foreign Exchange and Over-the-Counter (OTC) Derivatives Markets
 Derivatives Markets") Bank of Canada Triennial Central Bank Survey of Foreign Exchange and Over-the-Counter (OTC) Derivatives Markets Turnover for, and Amounts Outstanding as at June 30, March, 2005 Turnover data for, Table
Bank of Canada Triennial Central Bank Survey of Foreign Exchange and Over-the-Counter (OTC) Derivatives Markets Turnover for, and Amounts Outstanding as at June 30, March, 2005 Turnover data for, Table
Annual Market Review Portfolio Management
 2016 Annual Market Review 2016 Portfolio Management 2016 Annual Market Review This report features world capital market performance for the past year. Overview: Market Summary World Asset Classes US Stocks
Quarterly Market Review First Quarter 2016
 Q1 Quarterly Market Review First Quarter 2016 Securities offered through LPL Financial. Member FINRA/SIPC. Investment advice offered through Wealth Advisors Group, a registered investment advisor and separate
Part B STATEMENT OF ADDITIONAL INFORMATION
 Part B STATEMENT OF ADDITIONAL INFORMATION SIT LARGE CAP GROWTH FUND, INC. SNIGX SIT MID CAP GROWTH FUND, INC. NBNGX SIT MUTUAL FUNDS, INC, comprised of: SIT BALANCED FUND SIBAX SIT DIVIDEND GROWTH FUND,
Invesco Indexing Investable Universe Methodology October 2017
 Invesco Indexing Investable Universe Methodology October 2017 1 Invesco Indexing Investable Universe Methodology Table of Contents Introduction 3 General Approach 3 Country Selection 4 Region Classification
1.1. STOXX TOTAL MARKET INDICES
 1. BROAD TOTAL MARKET INDICES/BENCHMARK INDICES, EQUAL WEIGHT INDICES 1/15 1.1. STOXX TOTAL MARKET INDICES Regional indices STOXX BRIC TMI STOXX Developed and Emerging Markets TMI STOXX Developed Markets
1.1. STOXX TOTAL MARKET INDICES
 STOXX INDEX LIST A-Z 1. TOTAL MARKET INDICES 1/14 1.1. STOXX TOTAL MARKET INDICES Regional indices STOXX BRIC TMI STOXX Developed and Emerging Markets TMI STOXX Developed Markets TMI STOXX Emerging Markets
Market Review and Outlook. Todd Centurino, CFA
 Market Review and Outlook Todd Centurino, CFA Q1 2017 Global Economy: On the Upswing Ranked Returns (%) Emerging Market Equities 11.40 European Equities 7.40 US Equities 6.10 Global Bonds 2.00 US Treasuries
International Statistical Release
 International Statistical Release This release and additional tables of international statistics are available on efama s website (www.efama.org) Worldwide Investment Fund Assets and Flows Trends in the
Global Thematic (ETFs) Select UMA Managed Advisory Portfolios Solutions
 Select UMA Managed Advisory Portfolios Solutions") Managed Advisory Portfolios Solutions 2000 Westchester Avenue Purchase, New York 10577 Style: Sub-Style: Firm AUM: Firm Strategy AUM: Global Equities $912.3 million $53.9 million Year Founded: GIMA Status:
Managed Advisory Portfolios Solutions 2000 Westchester Avenue Purchase, New York 10577 Style: Sub-Style: Firm AUM: Firm Strategy AUM: Global Equities $912.3 million $53.9 million Year Founded: GIMA Status:
2017 Annual Market Review
 2017 Annual Market Review 19 2017 Annual Market Review This report features world capital market performance for the past year. Overview: Market Summary World Asset Classes US Stocks International Developed
IOOF. International Equities Portfolio NZD. Quarterly update
 IOOF NZD Quarterly update For the period ended 30 September 2018 Contents Overview 2 Portfolio at glance 3 Performance 4 Asset allocation 6 Overview At IOOF, we have been helping Australians secure their
FTSE Global All Cap Index
 FTSE Russell Factsheet FTSE Global All Cap Index bmktitle1 The FTSE Global All Cap Index is a market-capitalisation weighted index representing the performance of the large, mid and small cap stocks globally.
The Myth of Diversification: Risk Factors vs. Asset Classes
 The Myth of Diversification: Risk Factors vs. Asset Classes Sébastien Page, CFA Executive Vice President April 2011 PIMCO Canada will retain PIMCO LLC as a subadvisor. PIMCO Canada Corp., 120 Adelaide
EQUITY REPORTING & WITHHOLDING. Updated May 2016
 EQUITY REPORTING & WITHHOLDING Updated May 2016 When you exercise stock options or have RSUs lapse, there may be tax implications in any country in which you worked for P&G during the period from the
WISDOMTREE RULES-BASED METHODOLOGY
 WISDOMTREE RULES-BASED METHODOLOGY WISDOMTREE GLOBAL DIVIDEND INDEXES Last Updated March 2018 Page 1 of 12 WISDOMTREE RULES-BASED METHODOLOGY 1. Overview and Description of Methodology Guide for Global
Quarterly Market Review
 Q4 Quarterly Market Review Fourth Quarter 2011 Quarterly Market Review Fourth Quarter 2011 This report features world capital market performance in the last quarter. It begins with a global overview, then
IT ONLY TAKES ONE INDEX TO CAPTURE THE WORLD THE MODERN INDEX STRATEGY. msci.com
 IT ONLY TAKES ONE INDEX TO CAPTURE THE WORLD THE MODERN INDEX STRATEGY msci.com MSCI DELIVERS THE MODERN INDEX STRATEGY The MSCI ACWI Index, MSCI s flagship global equity benchmark, is designed to represent
INFORMATION CIRCULAR: DIREXION SHARES ETF TRUST
 INFORMATION CIRCULAR: DIREXION SHARES ETF TRUST TO: FROM: Head Traders, Technical Contacts, Compliance Officers, Heads of ETF Trading, Structured Products Traders NASDAQ / BX / PHLX Listing Qualifications
NEUBERGER BERMAN INVESTMENT FUNDS PLC
 The Directors of the Company whose names appear in the Management and Administration section of the Prospectus accept responsibility for the information contained in this document. To the best of the knowledge
Information Circular: PowerShares Exchange-Traded Fund Trust II
 Information Circular: PowerShares Exchange-Traded Fund Trust II To: From: Head Traders, Technical Contacts, Compliance Officers, Heads of ETF Trading, Structured Products Traders PHLX Listing Qualifications
PIMCO Research Affiliates Equity (RAE) Fundamental
 Fundamental") PIMCO Research Affiliates Equity (RAE) Fundamental Seek to get more from your equity allocation with a systematic strategy that captures the key benefits of a passive equity approach, with the potential
PIMCO Research Affiliates Equity (RAE) Fundamental Seek to get more from your equity allocation with a systematic strategy that captures the key benefits of a passive equity approach, with the potential
Quarterly Market Review. Fourth Quarter 2015
 Q4 Quarterly Market Review Fourth Quarter 2015 Quarterly Market Review Fourth Quarter 2015 This report features world capital market performance and a timeline of events for the past quarter. It begins
International Statistical Release
 International Statistical Release This release and additional tables of international statistics are available on efama s website (www.efama.org). Worldwide Investment Fund Assets and Flows Trends in the
Guide to Treatment of Withholding Tax Rates. January 2018
 Guide to Treatment of Withholding Tax Rates Contents 1. Introduction 1 1.1. Aims of the Guide 1 1.2. Withholding Tax Definition 1 1.3. Double Taxation Treaties 1 1.4. Information Sources 1 1.5. Guide Upkeep
Address City State Zip Phone Fax. First Name Last Name Suffix. Address City State Zip Phone Fax
 Assumptions Plan Date Schedule Plan Review 6 months 1 year Other Client Marital Status Single Married Domestic Partner Long-term inflation rate Social Security increase rate Personal Data Client A Information
Investment Webinar. Bryan Jordan, Deputy Chief Economist Nationwide Economics
 1 Investment Webinar Bryan Jordan, Deputy Chief Economist Nationwide Economics Source: Charting the Markets, 3Q2015 3 3 Source: Charting the Markets, 3Q2015 4 4 Source: Charting the Markets, 3Q2015 5
COUNTRY COST INDEX JUNE 2013
 COUNTRY COST INDEX JUNE 2013 June 2013 Kissell Research Group, LLC 1010 Northern Blvd., Suite 208 Great Neck, NY 11021 www.kissellresearch.com Kissell Research Group Country Cost Index - June 2013 2 Executive
FTSE Global All Cap Index
 FTSE Russell Factsheet FTSE Global All Cap Index bmktitle1 The FTSE Global All Cap Index is a market-capitalisation weighted index representing the performance of the large, mid and small cap stocks globally.
Chart 2: Fixed Asset Investment (FAI) Year-over-year % change, 3MMA. Chart 1: China Real GDP Growth 12% QoQ Annualized 70% 10% Infrastructure 50%
 Year-over-year % change, 3MMA. Chart 1: China Real GDP Growth 12% QoQ Annualized 70% 10% Infrastructure 50%") Chart 1: China Real GDP Growth 12% 1 YoY QoQ Annualized 8% 6% 4% 2% 1Q11 1Q12 1Q13 1Q14 Source: NBS, FactSet J.P. Morgan Asset Management. Chart 2: Fixed Asset Investment (FAI) Year-over-year % change,
Chart 1: China Real GDP Growth 12% 1 YoY QoQ Annualized 8% 6% 4% 2% 1Q11 1Q12 1Q13 1Q14 Source: NBS, FactSet J.P. Morgan Asset Management. Chart 2: Fixed Asset Investment (FAI) Year-over-year % change,
FTSE Global Equity Index Series
 FTSE Global Equity Index Series THE FTSE GLOBAL EQUITY INDEX SERIES With an unparalleled record of flexibility, transparency, consistent accuracy and the ability to meet any mandate, FTSE indices are already
PRODUCT KEY FACTS. Principal Global Investors Funds Global Equity Fund April 2018
 Global Equity Fund This statement provides you with key information about - Global Equity Fund ( Sub-Fund ). This statement is a part of the offering document. You should not invest in the Sub-Fund based
Risks and Opportunities in Global Equities Today BCI Global Investment Conference Tom Mann, CFA Senior Portfolio Manager
 Risks and Opportunities in Global Equities Today BCI Global Investment Conference Tom Mann, CFA Senior Portfolio Manager June 2017 For professional investors only. Not suitable for retail clients 05/06/2017
Market Bulletin. The LIBOR spike. May 1, In brief. What is LIBOR and why does it matter?
 Market Bulletin May, 8 The LIBOR spike In brief One of the most important interest rates in global financial markets, U.S. LIBOR, has spiked causing some investors to fear that there is a fundamental problem