New Flyer Industries TSX: NFI TSX: NFI.DB.U
|
|
|
- Howard Booth
- 6 years ago
- Views:
Transcription

1 New Flyer Industries TSX: NFI TSX: NFI.DB.U North America s #1 Heavy-Duty Transit Bus Manufacturer and Parts Supplier Forward Looking Statements: Our remarks and answers to your questions today may contain forward-looking statements relating to New Flyer Industries Inc. and related companies or to the environment in which they operate, which are based on their operations, estimates, forecasts and projections. These statements are not guarantees of future performance and involve risks and uncertainties that are difficult to predict, or are beyond New Flyer s control. A number of important factors could cause actual outcomes and results to differ materially from those expressed in these forward-looking statements. These factors include those set forth in New Flyer s Annual Information Form. New Flyer assumes no obligation to update or revise any forward-looking statements to reflect new events or circumstances, except as required by applicable securities laws. All figures discussed today are in U.S. dollars unless otherwise noted.


 bus manufacturing in 2014 NFI s next generation Transit Bus with advanced styling that is")
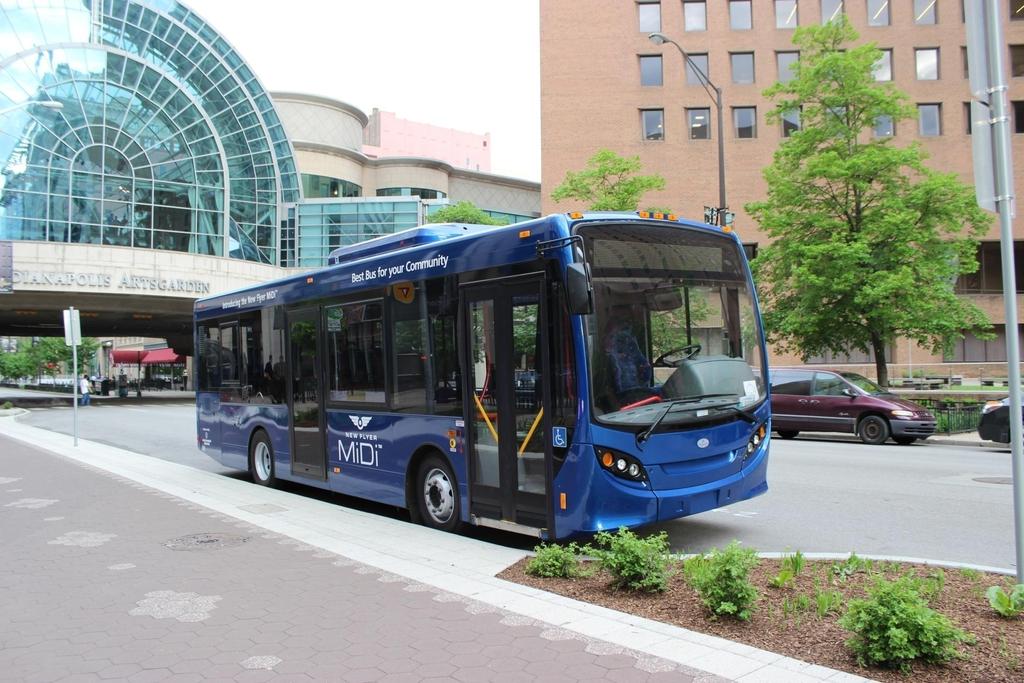
2 2 Long standing tradition as the #1 Heavy-Duty Transit Bus manufacturer in Canada & US Founded in Winnipeg in Market Leader in Technology and Innovation Bus manufacturing plants in Manitoba and Minnesota and a Part Fabrication plant in Elkhart. 2,200 employees Parts Distribution Centers in Manitoba, Ontario, Kentucky and California Service Center in Arnprior with another being established in LA New Product Development Center in Winnipeg. Over 32,500 buses delivered, with 24,000 still in operation Offer heavy-duty buses from 35, 40, to 60 articulating buses. Commence 30 and 35 medium-duty (MiDi) bus manufacturing in 2014 NFI s next generation Transit Bus with advanced styling that is lighter, quieter and more fuel efficient. First delivery was in Targeting >90% of bus production for 2103


3 3 Industry Leading Market Share in both Bus & Parts 32% Transit Bus Market Share ~25% Pro Forma Parts Market Share Other 4% 10% 18% 7% 29% 32% Neopart 3% MCI 4% Suppliers Direct 4% Truck 5% Nova 6% Muncie 6% Other 14% Locals 7% EngDealers 8% New Flyer 18% Gillig 9% Orion 7% NABI 9% April 2012 Daimler announced Orion to close by YE2012. NYCT & Seattle bus contracts assigned to NFI. March 2013 NFI announces the acquisition of Orion Parts Business from Daimler Bus Source: New Flyer Database & Management Estimates based on EUs delivered
4 4 NFI backlog provides visibility of Near-to-Medium term sales Backlog has now started to recover Backlog proved crucial in period of low Industry activity Firm Deferred Order Firm Option Deferred Order Options NFI plan maintains a Line Entry production rate of 36 EUs/Production week
5 5 NFI Financial Performance (US$) Adversely impacted by Volume & Price during economic crisis Sales Adjusted EBITDA $1,200 $120 $1,000 $ $100 $ $600 $ $60 $ $200 $ $ Q1 LTM $ Q1 LTM Parts Bus

 Bus OEM, Parts & Services Canada/US International 3.")
6 Public Private 6 New Flyer Strategy: a diversified Full-Service Bus Manufacturer 1. Focus on Core Market/Business/Operations LEAN & Quality roadmap Increase Strategic and In-Sourcing Cost reduction and competiveness 2. Seek Diversification & Growth Full scope offering: Bus, Parts & Services Increase % of aftermarket Migrate to new Xcelsior platform & launch MiDi Expand beyond HD Transit and compete in more than one market (product and/or geography) Bus OEM, Parts & Services Canada/US International 3. Investment/Acquisition Criteria Current or potential for leading market share Opportunity for cost synergy based on scale (OpEx, purchasing, and overhead) plus ability to leverage R&D, technology and platforms Vertical integration potential for key or strategic value-added operations


7 7 Committed to propulsion options & technology leadership Focused on optimizing New Flyer s next-gen Xcelsior platform NF CNG Propulsion First delivered in 1994 Natural Gas NF Hydrogen FC Fleet Delivered fleet to BC Transit Jan 2010 Fuel Cells eaccessories All-Electric NF ebus Maiden Voyage: Apr 20-12, 1:05 pm Hybrid Diesel Trolley NF eaccesory Bus Delivered to MN Metro July 2012 Gas NF etrolley Bus First delivered in 1993 NF Hybrid Bus First delivered in 2000
8 8 NFI transformed to Common Share Structure Reducing Leverage and Interest Costs $450 $400 $350 $300 $250 $200 $150 $100 $50 $0 Total Debt (US $million) Q1 IDS Debt Bachelor Bonds Senior Term Loan Revolver Convertible Debenture Total leverage ratio $65M Convertible Debenture issued in Jun- 12. Proceeds used to redeem Bach Bonds/IDS Debt in August Convert price $10/share. $90M Revolver facility used to manage working capital fluctuations ($49M outstanding) $122M Senior term rate of LIBOR plus applicable margin. Expires in Apr-14. Interest on Bach Bonds/IDS Debt = 14% vs Converts = 6.25% 49.3M shares outstanding. 6.2 M shares to be added from Treasury once full Marcopolo investment complete. NFI Board/Management currently owns 1.1M Shares (or 2.3%).

 Substantially")


9 9 Significant improvements made in Operations Focused management on both cultural and physical change CME Annual LEAN Assessment (out of 5) Substantially reduced Bus WIP (EUs)
10 % Change vs Same Last Year 10 Macro-economic Fundamentals continue to Improve Which bodes well for investment in public transit US Qtrly State Tax Revenue [YOY % Change] USA Quarterly State Tax Revenue YOY % Change Q1 Q2 Q3 Q4 Q1 Q2 Q3 Q4 Q1 Q2 Q3 Q4 Q1 Q2 Q3 Q4E Personal Income Tax Corporate Income Tax General Sales Tax Source: The Nelson A. Rockefeller Institute State Revenue Reports 2010 Average Age of Bus [Yrs] Source: Fact-Book-Appendix-A.pdf Annual Avg Crude Oil Price - [US$] Crude Oil Price - Annual Average $ $ $90.00 $80.00 $70.00 $60.00 $50.00 $40.00 $30.00 $20.00 $10.00 $ Source: Monthly Unemployment Rate US CA J F M A M J J A S O N D J F M A M J J A S O N D J F M A M J J A S O N D J F Source: US Bureau of Labor Statistics (US) ; Stats Canada (CAD) Annual Transit Ridership % Chg YOY Annual Ridership % Chg YOY 6.00% 4.00% 2.00% 0.00% -2.00% -4.00% -6.00% US Bus Total US Total All Modes CDN Total All Modes Source:
11 12-Jan Feb Mar Apr May Jun Jul Aug Sep Oct Nov Dec Jan Feb Mar Apr May Jun Jul Aug Sep Oct Nov Dec Jan Feb Mar Apr May Jun Jul Aug Sep Oct Nov Dec Jan Feb Mar Apr May Jun Jul Aug Sep Oct Nov Dec Jan Feb Mar Apr The NFI Bid Universe has shown Significant Recovery 5 year total >15,200 EUs. Active Opportunities >7,300 EUs Units forecasted to come out for Competition 20,000 18,000 16,000 14,000 12,000 10,000 8,000 6,000 4,000 2,000 - EUs for Bids Submitted EUs Bids in Progress Federal Stimulus investments contributed to surge in 2010 Reflects increased competitions in process Ongoing Bids Submitted Bids Forecast
12 12 NFI Book-to-Bill Ratio (Intake/Deliveries) has rebounded Now back to >100% of LTM deliveries 6, % 5, % 4, % 3, % 2, % 1,000 50% - 0% LTM New Orders (EUs) LTM Deliveries (EUs) LTM Order Intake / Deliveries


13 13 Launched a JV with Alexander Dennis Limited in 2012 A medium-duty (MiDi) Bus for North America North America s largest Heavy Duty Transit Bus and Parts company + UK s largest Bus & Coach builder and world leader in midi-bus Strategic Rationale 10 Year Bus targeted at both Public & Private applications Lighter and quieter than Heavy-Duty buses with materially different operating economics Enhanced styling and passenger comfort Prototypes are currently being manufactured with testing in Q2-Q Production build to commence in Dec-13

14
15 Marcopolo S.A. strategic Investment in NFI - February 2013 Launches a strategic relationship and provides growth capital to NFI North America s largest Heavy Duty Transit Bus and Parts company + The world s 2 nd largest Bus builder delivering over 35,000 buses annually Strategic Rationale Provides significant equity capital to NFI at an attractive price (Approx 26% premium to 60-day VWAP) Enhances NFI s financial flexibility to further pursue growth and diversification opportunities Strategic value of knowledgeable, sophisticated, like-minded investor Opportunity to strengthen North American market position and competitiveness through commercial agreements with a leading global bus manufacturer Access to MP products, know-how, relationships and technology sharing to enhance NFI s product offerings and profitability Opportunity to seek markets outside North America where NFI intellectual property may be exported 15


16 NFI Strategic Investment in expanding Aftermarket - March 2013 acquisition of Orion s Parts business from Daimler Bus North America s #1 Bus Aftermarket Parts Business + North Strategic Rationale America s #4 Bus Aftermarket Parts Business Strengthens NFI leadership position as the largest provider of aftermarket parts in the North American transit bus industry. Pro-forma 25% bus parts market share. Broadens exposure to large transit agencies, and further enhances NFI s relationship with various transit authorities Highly attractive revenue stream from the proprietary parts business serving over 10,000 Orion buses currently in service Immediately accretive to earnings and cash flow with added value through combined scale, footprint and overhead utilization Significant potential for incremental growth by leveraging scale and broader product offering to increase penetration into North America s installed fleet of all OEM makes and models 16
17 17 NFI Investment Thesis #1 Manufacturer of Heavy Duty Transit Bus Manufacturer in North America #1 Market Share of delivered buses and #1 Market Share of aftermarket bus part sales Market Innovation leader with the broadest green product offering High quality diversified customer base generating repeat business in replacement industry Experienced Executive team with a track record and significant OpEx and LEAN experience Conversion to Common Share Structure complete. Lower leverage & Interest Cost Predictable cash flow business model, conservative financing structure, relatively low CAPEX needs Income instrument with Yield currently at approx 6.0% (annual dividend at C$0.585/share. Distributions have been paid for 91 consecutive months (since IPO). Management believes dividend is sustainable. Prospects for Growth Transit is an essential service with an aging US fleet (avg age >7.8 yrs vs. avg target life of 12 yrs) After three years of a very difficult market, now experiencing record bid activity (Active bids >7,300 EUs, Bid Universe >15,200 EUs) with loss of one competitor (Orion). NFI backlog has returned to growth ($3.3B and 7,527 EUs) Book-to-Bill Ratio is recovering (LTM is 211% vs 31% for 2012 Q1 LTM) JV launched with Alexander Dennis to introduce MiDi bus in North America. Marcopolo 19.99% Strategic Investment in NFI with operational MOU. Parts and service offering business continues to grow through acquisition of Orion Bus Parts Distribution business.
North America s #1 Transit Bus Manufacturer and Parts Supplier
 New Flyer Industries TSX: NFI TSX: NFI.DB.U North America s #1 Transit Bus Manufacturer and Parts Supplier Forward Looking Statements: May contain forward-looking statements relating to New Flyer Industries
North America s #1 Transit Bus Manufacturer and Parts Supplier
 North America s #1 Transit Bus Manufacturer and Parts Supplier Forward Looking Statements: May contain forward-looking statements relating to New Flyer Industries Inc. and related companies or to the environment
NFI Investor Update. March 23, 2016 (TSX: NFI, TSX: NFI.DB.U) North America s leading Motor Coach Manufacturer and Parts Supplier
 North America s leading Motor Coach Manufacturer and Parts Supplier") 0 NFI Investor Update (TSX: NFI, TSX: NFI.DB.U) North America s leading Transit Bus Manufacturer and Parts Supplier North America s leading Motor Coach Manufacturer and Parts Supplier March 23, 2016 Forward
0 NFI Investor Update (TSX: NFI, TSX: NFI.DB.U) North America s leading Transit Bus Manufacturer and Parts Supplier North America s leading Motor Coach Manufacturer and Parts Supplier March 23, 2016 Forward
NFI Investor Update Q2-2016
 0 NFI Investor Update Q2-2016 North America s leading Transit Bus and Motor Coach Manufacturer and Parts Distributor August 11, 2016 Forward Looking Statements and Non-GAAP Measures are defined in APPENDIX
New Flyer Industries (NFI) acquisition of Motor Coach Industries (MCI)
 acquisition of Motor Coach Industries (MCI)") 0 New Flyer Industries (NFI) acquisition of Motor Coach Industries (MCI) + North America s leading Transit Bus Manufacturer and Parts Supplier North America s leading Motor Coach Manufacturer and Parts
0 New Flyer Industries (NFI) acquisition of Motor Coach Industries (MCI) + North America s leading Transit Bus Manufacturer and Parts Supplier North America s leading Motor Coach Manufacturer and Parts
MANAGEMENT'S DISCUSSION AND ANALYSIS OF FINANCIAL CONDITION AND RESULTS OF OPERATIONS FOR THE 13-WEEKS AND 52-WEEKS ENDED DECEMBER 30, 2012
 March 20, 2013 MANAGEMENT'S DISCUSSION AND ANALYSIS OF FINANCIAL CONDITION AND RESULTS OF OPERATIONS FOR THE 13-WEEKS AND 52-WEEKS ENDED DECEMBER 30, 2012 Information in this Management s Discussion and
MANAGEMENT'S DISCUSSION AND ANALYSIS OF FINANCIAL CONDITION AND RESULTS OF OPERATIONS FOR THE 13-WEEKS ENDED APRIL 1, 2012
 May 9, 2012 MANAGEMENT'S DISCUSSION AND ANALYSIS OF FINANCIAL CONDITION AND RESULTS OF OPERATIONS FOR THE 13-WEEKS ENDED APRIL 1, 2012 Information in this Management s Discussion and Analysis ( MD&A )
MANAGEMENT'S DISCUSSION AND ANALYSIS OF FINANCIAL CONDITION AND RESULTS OF OPERATIONS FOR THE 13-WEEKS AND 52-WEEKS ENDED DECEMBER 29, 2013
 March 19, 2014 MANAGEMENT'S DISCUSSION AND ANALYSIS OF FINANCIAL CONDITION AND RESULTS OF OPERATIONS FOR THE 13-WEEKS AND 52-WEEKS ENDED DECEMBER 29, 2013 Information in this Management s Discussion and
MANAGEMENT'S DISCUSSION AND ANALYSIS OF FINANCIAL CONDITION AND RESULTS OF OPERATIONS FOR THE 13-WEEKS AND 39-WEEKS ENDED SEPTEMBER 30, 2012
 November 12, 2012 MANAGEMENT'S DISCUSSION AND ANALYSIS OF FINANCIAL CONDITION AND RESULTS OF OPERATIONS FOR THE 13-WEEKS AND 39-WEEKS ENDED SEPTEMBER 30, 2012 Information in this Management s Discussion
MANAGEMENT'S DISCUSSION AND ANALYSIS OF FINANCIAL CONDITION AND RESULTS OF OPERATIONS FOR THE 13-WEEKS AND 52-WEEKS ENDED DECEMBER 28, 2014
 March 18, 2015 MANAGEMENT'S DISCUSSION AND ANALYSIS OF FINANCIAL CONDITION AND RESULTS OF OPERATIONS FOR THE 13-WEEKS AND 52-WEEKS ENDED DECEMBER 28, 2014 Information in this Management s Discussion and
NFI:TSX Q3-17 Investor Update. November 8, 2017
 0 NFI:TSX Q3-17 Investor Update November 8, 2017 1 NFI Group Q3-17 Highlights Forward Looking Statements and Non-GAAP Measures are defined in APPENDIX B. LTM Performance: Revenue: US $2.35B Adjusted EBITDA:
MANAGEMENT'S DISCUSSION AND ANALYSIS OF FINANCIAL CONDITION AND RESULTS OF OPERATIONS FOR THE 13-WEEKS AND 52-WEEKS ENDED JANUARY 1, 2012
 March 21, 2012 MANAGEMENT'S DISCUSSION AND ANALYSIS OF FINANCIAL CONDITION AND RESULTS OF OPERATIONS FOR THE 13-WEEKS AND 52-WEEKS ENDED JANUARY 1, 2012 Information in this Management s Discussion and
NFI Investor Update. as at May 10, North America s leading Transit Bus & Motor Coach Manufacturer and Parts Distributor
 NFI Investor Update as at May 10, 2017 0 North America s leading Transit Bus & Motor Coach Manufacturer and Parts Distributor 1 Company Highlights Fiscal 2017 Q1 LTM Performance: Revenue: US $2.3B Adj
NEW FLYER INDUSTRIES INC. Annual Information Form
 NEW FLYER INDUSTRIES INC. Annual Information Form March 23, 2015 TABLE OF CONTENTS GENERAL... 1 CORPORATE STRUCTURE... 3 The Issuer... 3 Ownership Structure... 3 GENERAL DEVELOPMENT OF THE BUSINESS...
MANAGEMENT'S DISCUSSION AND ANALYSIS OF FINANCIAL CONDITION AND RESULTS OF OPERATIONS FOR THE 13-WEEKS AND 52-WEEKS ENDED DECEMBER 31, 2017
 March 21, 2018 MANAGEMENT'S DISCUSSION AND ANALYSIS OF FINANCIAL CONDITION AND RESULTS OF OPERATIONS FOR THE 13-WEEKS AND 52-WEEKS ENDED DECEMBER 31, 2017 Information in this Management s Discussion and
NFI:TSX INVESTOR PRESENTATION August 2018
 NFI:TSX INVESTOR PRESENTATION August 2018 Leader in Transit Buses, Motor Coach & Aftermarket Target deliveries (EU)* 2,774 1,076 500 $378M** Market Founded in 1930 Market Leader in heavy duty (HD) transit
NEW FLYER INDUSTRIES INC. Annual Information Form
 NEW FLYER INDUSTRIES INC. Annual Information Form March 24, 2017 TABLE OF CONTENTS GENERAL... 1 CORPORATE STRUCTURE... 3 GENERAL DEVELOPMENT OF THE BUSINESS... 4 Recent Developments... 4 DESCRIPTION OF
NEW FLYER INDUSTRIES INC. Annual Information Form
 NEW FLYER INDUSTRIES INC. Annual Information Form March 23, 2018 TABLE OF CONTENTS GENERAL... 1 CORPORATE STRUCTURE... 2 GENERAL DEVELOPMENT OF THE BUSINESS... 3 Recent Developments... 3 DESCRIPTION OF
It s made for Sleep. It s a Sealy.
 TM It s made for Sleep. It s a Sealy. Forward-Looking Statements This document contains forward-looking statements within the meaning of the safe harbor provisions of the Securities Litigation Reform Act
TD Securities 2011 Calgary Unconventional Energy Conference July 7, Dawn Farrell Chief Operating Officer
 TD Securities 2011 Calgary Unconventional Energy Conference July 7, 2011 Dawn Farrell Chief Operating Officer 1 Forward looking statements This presentation may contain forward looking statements, including
Fiscal 2014 Q3 Results
 Stephen MacPhail, President & CEO Doug Jamieson, Executive Vice-President & CFO Derek Green, President, CI Investments Steven Donald, President, Assante Wealth Management November 6, 2014 Important Information
ADMIE (IPTO) Holding S.A. 1H 17 earnings presentation September 2017
 Holding S.A. 1H 17 earnings presentation September 2017") ADMIE (IPTO) Holding S.A. 1H 17 earnings presentation September 2017 Disclaimer This document contains forward-looking statements that involve risks and uncertainties. These statements may generally, but
ADMIE (IPTO) Holding S.A. 1H 17 earnings presentation September 2017 Disclaimer This document contains forward-looking statements that involve risks and uncertainties. These statements may generally, but
Intelsat JPM HY Conference February 27, Launch of Intelsat 37e September 29, 2017
 1 Intelsat JPM HY Conference February 27, 2018 Launch of Intelsat 37e September 29, 2017 2 Intelsat Full Year 2017: In-line Performance $2,500 2016/2017 Revenue and AEBITDA (in millions) $2,188 $2,149
Financial & Business Highlights For the Year Ended June 30, 2017
 Financial & Business Highlights For the Year Ended June, 17 17 16 15 14 13 12 Profit and Loss Account Operating Revenue 858 590 648 415 172 174 Investment gains net 5 162 909 825 322 516 Other 262 146
Availability, Reliability, Ease. 11 December 2018
 Availability, Reliability, Ease 11 December 2018 LEGAL NOTICE This presentation has been prepared to inform investors and prospective investors in the secondary markets about the Group and does not constitute
Charles Mickey Flood. Joe Quarin. Investor Presentation May Executive Vice President, BFI Canada, CEO IESI. Chief Financial Officer BFI Canada
 Charles Mickey Flood Executive Vice President, BFI Canada, CEO IESI Joe Quarin Chief Financial Officer BFI Canada Investor Presentation May 2005 Safe Harbor Statement Our remarks and answers to your questions
UBS Global Financial Services Conference May 14, Joseph Saunders, Chief Executive Officer. Byron Pollitt, Chief Financial Officer
 UBS Global Financial Services Conference May 14, 2008 Joseph Saunders, Chief Executive Officer Byron Pollitt, Chief Financial Officer Safe Harbor Reminder The following materials and management s discussion
Industry Trends Watch
 Costing Trends - Alberta Asphalt Cement (Edmonton Rack $C/t) The Edmonton rack price for asphalt cement surged to $730 per tonne in early May. The rack price index averaged $655 per tonne in April and
First Quarter Strategic Update & Financial Results MAY 10, 2018
 First Quarter 2018 Strategic Update & Financial Results MAY 10, 2018 Disclaimer Certain information in this presentation is forward-looking and related to anticipated financial performance, events and
Jerry Sheridan. October 17,
 Jerry Sheridan October 17, 2012 1 History of AmeriGas Started in 1959 165 acquisitions since 1982 Cal Gas acquisition in 1987 Petrolane acquisition in 1993 IPO as an MLP in 1995 Columbia acquisition in
Investor Presentation
 Investor Presentation November, 2016 *Rig 580, Oklahoma SCOOP 1 Forward-looking statements Certain statements contained in this presentation, including statements that contain words such as "could", "should",
2014 Fixed Income Investor Update
 2014 Fixed Income Investor Update Toronto April 23, 2014 Montreal April 24, 2014 Winnipeg April 28, 2014 Disclaimer Certain information included in this presentation or incorporated by reference herein
Industry Trends Watch
 Costing Trends - Alberta Asphalt Cement (Edmonton Rack $C/t) The Edmonton rack price for asphalt cement averaged $730 per tonne in May, compared with $655 in April. In May of last year, the rack price
Blue Bird Corporation
 Blue Bird Corporation (Nasdaq: BLBD) Stifel Industrials Conference Key Biscayne, FL February 14-15, 2017 Agenda Industry Overview Blue Bird Overview Product Focus Financials Summary Q&A This presentation
Q EARNINGS PRESENTATION. May 12, 2017
 Q1 2017 EARNINGS PRESENTATION May 12, 2017 1 Safe Harbor Statement Certain statements in the Business Update and Order Backlog sections contain forward-looking statements within the meaning of the safe
Building the Future D A.. DAVIDSON DA CONFERENCE SEPTEMBER 11, 2012
 Building the Future D A DAVIDSON CONFERENCE D.A. DAVIDSON CONFERENCE SEPTEMBER 11, 2012 SAFE HARBOR STATEMENT The matters discussed in this presentation may make projections and other forward-looking statements
Conference Call Second Quarter 2013 Financial Results. Presentation3
 Conference Call Second Quarter 2013 Financial Results Presentation3 August 2, 2013 Agenda 1 Agenda 1 2 Opening Remarks 2Q13 Highlights 3 Operating and Financial Review 4 Closing Remarks 5 Q&A 2 1 Alicorp
2017 MLPA Investor Conference. May 31, 2017
 2017 MLPA Investor Conference May 31, 2017 Jerry Peters Chief Financial Officer Green Plains Inc. NASDAQ: GPRE www.gpreinc.com Green Plains Partners LP NASDAQ: GPP www.greenplainspartners.com Forward-Looking
March 8 & 12 MORTGAGE LENDING IN MEXICO. Asociación de Bancos de México
 March 8 & 12 MORTGAGE LENDING IN MEXICO Asociación de Bancos de México Index 1.The Mexican Banking Sector 2. Mortgage Market in Mexico 3. Outlook and Conclusions 3 Introduction 1. The Mexican economy has
CIBC Annual Whistler Institutional Investor Conference January 25-28, 2017 Whistler, BC. parkland.ca
 CIBC Annual Whistler Institutional Investor Conference January 25-28, 2017 Whistler, BC parkland.ca FORWARD LOOKING STATEMENT DISCLAIMER & NOTE ON NON-GAAP MEASURES 2 Certain information included herein
2018 Q1 results. Millicom International Cellular S.A. Kicking off 2018 with accelerating momentum
 2018 Q1 results Kicking off 2018 with accelerating momentum Mauricio Ramos, CEO Tim Pennington, CFO April 25 th, 2018 Millicom International Cellular S.A. Disclaimer This presentation may contain certain
Consolidated Financial Results for the 1 st Half of FYE 2019
 Consolidated Financial Results for the 1 st Half of SUBARU CORPORATION Toshiaki Okada Corporate Executive Vice President & CFO November 5 th, 2018 1 Summary Consolidated Financial Results for the 1 st
$31,038. $8,500 June 18. June 12
 HISTORIC RETURNS* Growth of $10,000 since July 2003 $35,000 $30,000 $25,000 $31,038 Fund Performance Series C (PERCENT RETURN) SINCE 1YR 3YRS 5YRS 10YRS INCEPTION 6.78% 6.73% 6.77% 8.10% Target Asset Allocation
Sustainable Performance in Global On-Highway Markets
 Sustainable Performance in Global On-Highway Markets Tina Vujovich, VP Marketing & Environmental Policy Credit Suisse s 5 th Annual Truck Builders Conference March 1, 2007 Disclosure Regarding Forward-Looking
Gabelli Pump, Valve and Water Systems Symposium
 Advanced Flow Solutions Energy Pumping Technologies Gabelli Pump, Valve and Water Systems Symposium Scott Buckhout President & CEO 1 February 22, 2018 1 Safe Harbor This presentation contains forward-looking
Q4 Preview & Transfer of Coverage: Growth Potential and Attractive Valuation Supports Strong Buy
 23-Apr-14 14-May-14 4-Jun-14 25-Jun-14 16-Jul-14 6-Aug-14 27-Aug-14 17-Sep-14 8-Oct-14 29-Oct-14 19-Nov-14 10-Dec-14 31-Dec-14 21-Jan-15 11-Feb-15 4-Mar-15 25-Mar-15 15-Apr-15 Daily Volume ('000) Share
Results presentation. Highlights. For the year-ended 31 March A distinctive specialist banking group
 Results presentation For the year-ended 31 March 26 A distinctive specialist banking group Highlights Constant pursuit of a sustainable, distinctive growth strategy Strong results 25 Investec plc relative
Year-end results. 18 May
 Year-end results 18 May Highlights for the year Strong operational performance Good performance across all areas of activity Deepened our core franchise Sound levels of corporate client and private client
PHOENIX ENERGY MARKETING CONSULTANTS INC. HISTORICAL NATURAL GAS & CRUDE OIL PRICES UPDATED TO July, 2018
 Jan-01 $12.9112 $10.4754 $9.7870 $1.5032 $29.2595 $275.39 $43.78 $159.32 $25.33 Feb-01 $10.4670 $7.8378 $6.9397 $1.5218 $29.6447 $279.78 $44.48 $165.68 $26.34 Mar-01 $7.6303 $7.3271 $5.0903 $1.5585 $27.2714
Cash & Liquidity The chart below highlights CTA s cash position at June 2018 compared to June 2017.
 To: Chicago Transit Authority Board From: Jeremy Fine, Chief Financial Officer Re: Financial Results for June 2018 Date: August 15, 2018 I. Summary CTA s financial results are unfavorable to budget for
Forward-Looking Statements
 William Blair & Company 27 th Annual Growth Stock Conference June 20, 2007 0 Forward-Looking Statements This presentation contains forward-looking statements that are subject to a number of risks and uncertainties,
SIGNS. MICHAEL FERREIRA URBAN ANALYTICS INC. October 24, 2014
 SIGNS MICHAEL FERREIRA URBAN ANALYTICS INC. October 24, 2014 8.0 7.0 6.0 5.0 4.0 3.0 2.0 1.0 0.0-1.0 Jan-10 Mar-10 May-10 Jul-10 Sep-10 Nov-10 Jan-11 Mar-11 May-11 Jul-11 Sep-11 Nov-11 Jan-12 Mar-12 May-12
Semi-annual Return of Capital Payments. Alternative to investing in bond ETFs, mutual funds or holding the Underlying Bonds.
 January 24, 2014 DEBT LINKED DEBT SECURITIES I RBC Non-Protected Bond RoC Securities, Series 1F 3- Term Semi-annual Return of Capital Payments INVESTMENT HIGHLIGHTS Variable Return linked to a Notional
Hürriyet Investor Presentation. July 2007
 Hürriyet Investor Presentation July 2007 1 Notice This presentation does not constitute an offer or invitation to purchase or subscription for any securities and no part of it shall form the basis of or
Current State of the Leveraged Loan Market
 Current State of the Leveraged Loan Market Ted Basta, LSTA William Lemberg, Alcentra Michael Schechter, CITI Gil Tollinchi, Crescent Capital Brian Yorke, Halcyon May 3, 2016 Presentation Overview 1. Macro
Robbins & Myers, Inc. and T-3 Energy Services, Inc. Investor Presentation
 Robbins & Myers, Inc. and T-3 Energy Services, Inc. Investor Presentation October 06, 20 Pete Wallace, CEO Robbins & Myers Steve Krablin, CEO T-3 Chris Hix, CFO Robbins & Myers Saeid Rahimian, President
Earnings Call. December 19, 2017
 Earnings Call December 19, Safe Harbor This document contains forward-looking statements made pursuant to the safe harbor provisions of the Private Securities Litigation Reform Act of 1995, including forward-looking
2016 Economic Outlook for Ireland & Eurozone IFP Launch
 2016 Economic Outlook for Ireland & Eurozone IFP Launch December 3 rd 2015 Jim Power Global Background US & UK growing at reasonable pace Euro Zone growing well below potential Emerging markets in some
/// The New Wabtec. February 25, 2019
 The New Wabtec February 25, 2019 DISCLAIMER / FORWARD-LOOKING STATEMENTS Caution Concerning Forward-Looking Statements This presentation contains forward-looking statements as that term is defined in Section
Operating Budget. Third Quarter Financial Report (July 2005 March 2006)
") Third Quarter Financial Report (July 2005 March 2006) INDEX A. Executive Summary...page 2 B. Revenue and Expense Analysis...page 3 C. Budget Variance Reports...page 14 D. Ridership and Performance Measures...page
Third Quarter Financial Report (July 2005 March 2006) INDEX A. Executive Summary...page 2 B. Revenue and Expense Analysis...page 3 C. Budget Variance Reports...page 14 D. Ridership and Performance Measures...page
NYSE EURONEXT FIRST QUARTER 2013 EARNINGS PRESENTATION. April 30, 2013
 NYSE EURONEXT FIRST QUARTER 2013 EARNINGS PRESENTATION April 30, 2013 LEGAL DISCLAIMERS Non-GAAP Financial Measures To supplement NYSE Euronext s consolidated financial statements prepared in accordance
LOAN MARKET DATA AND ANALYTICS BY THOMSON REUTERS LPC
 LOAN MARKET DATA AND ANALYTICS BY THOMSON REUTERS LPC GLOBAL LOAN MARKET DATA AND ANALYTICS BY THOMSON REUTERS LPC Secondary Market Bid Levels: Europe Slide 2 European CLO New Issue Volume Monthly Slide
CST Brands, Inc. Investor Update. September 2015
 CST Brands, Inc. Investor Update September 2015 1 Safe Harbor Statements Forward-Looking Statements Statements contained in this presentation that state the Company s or management s expectations or predictions
Cash & Liquidity The chart below highlights CTA s cash position at January 2018 compared to January 2017.
 To: Chicago Transit Authority Board From: Jeremy Fine, Chief Financial Officer Re: Financial Results for January 2018 Date: March 14, 2018 I. Summary CTA s financial results are $1.7 million unfavorable
FULL YEAR REPORT, 2017 TELEPHONE/AUDIO CONFERENCE 8 FEBRUARY 2018, AT CET TOMMY ANDERSSON, PRESIDENT AND CEO HELENA WENNERSTRÖM, EVP AND CFO
 TELEPHONE/AUDIO CONFERENCE 8 FEBRUARY 2018, AT 15.30 CET TOMMY ANDERSSON, PRESIDENT AND CEO HELENA WENNERSTRÖM, EVP AND CFO DIRECT LINK AUDIOCAST: HTTPS://TV.STREAMFABRIKEN.COM/BULTEN Q4 2017 TELECONFERENCE:
Forward-Looking Statements
 March 2006 0 Forward-Looking Statements This presentation contains forward-looking statements that are subject to a number of risks and uncertainties, many of which are outside our control. These forward-looking
Dean Foods Third Quarter 2008 Earnings Report. November 4, 2008
 Dean Foods Third Quarter 2008 Earnings Report November 4, 2008 Forward Looking Statements The following statements made in this presentation are forward looking and are made pursuant to the safe harbor
Raymond James 37 th Annual Institutional Investors Conference. March 8, 2016
 Raymond James 37 th Annual Institutional Investors Conference March 8, 2016 Forward-looking statements and Non-GAAP financial measures Forward-looking statements Certain statements included in this presentation,
Snaitech Group Financial Results as of 31 March May 2018
 Snaitech Group Financial Results as of 31 March 2018 15 May 2018 1 Disclaimer This presentation includes certain forward looking statements, projections, objectives and estimates reflecting the current
REV GROUP, INC. S e p te m b e r I nv e s t o r P re s e nt a t i o n N Y S E : R E V G September 2018
 REV GROUP, INC. September Investor Presentation N Y S E : R E V G September 2018 Cautionary Statements & Non GAAP Measures Disclaimers Note Regarding Non-GAAP Measures REV Group reports its financial results
5th Annual Shipping, Logistics & Offshore Services Conference
 5th Annual Shipping, Logistics & Offshore Services Conference New York City, September 16, 2008 Disclosures Statements in this presentation which are not statements of historical fact are forward-looking
CME Group 2Q 2009 Earnings Conference Call. July 23, 2009
 CME Group 2Q 2009 Earnings Conference Call July 23, 2009 Forward-Looking Statements Statements in this press release that are not historical facts are forward-looking statements. These statements are not
GIMA Pulse Date of Report: 04/12/2017 a monthly snapshot of the UK Economy from
 GIMA Pulse Date of Report: 04/12/2017 a monthly snapshot of the UK Economy from www.barometeroftrade.com Summary Inflation has slowed after reaching a 5-year-high last month, largely due to the weak performance
Navios Partners Ownership Structure
 First Quarter 2010 Earnings Presentation April 28, 2010 Agenda Company Overview Company Developments Review of Q1 2010 Financial Results Quarterly Cash Distribution Fleet and Operations Overview Industry
Daseke, Inc. Consolidating North America s Flatbed & Specialized Logistics Market
 Daseke, Inc. Consolidating North America s Flatbed & Specialized Logistics Market Investor Presentation September 2017 Important Disclaimers Non-GAAP Financial Measures This presentation includes non-gaap
Leading Economic Indicator Nebraska
 Nebraska Monthly Economic Indicators: December 20, 2017 Prepared by the UNL College of Business Administration, Bureau of Business Research Author: Dr. Eric Thompson Leading Economic Indicator...1 Coincident
XML Publisher Balance Sheet Vision Operations (USA) Feb-02
 Feb-02") Page:1 Apr-01 May-01 Jun-01 Jul-01 ASSETS Current Assets Cash and Short Term Investments 15,862,304 51,998,607 9,198,226 Accounts Receivable - Net of Allowance 2,560,786
Page:1 Apr-01 May-01 Jun-01 Jul-01 ASSETS Current Assets Cash and Short Term Investments 15,862,304 51,998,607 9,198,226 Accounts Receivable - Net of Allowance 2,560,786
Colliers International Group Inc. Investor Presentation
 Colliers International Group Inc. Investor Presentation March 2018 Basis of Presentation All amounts in millions of US Dollars unless otherwise noted. Adjusted EBITDA ( AEBITDA ) and Adjusted EPS ( AEPS
Cash & Liquidity The chart below highlights CTA s cash position at December 2017 compared to December 2016.
 To: Chicago Transit Authority Board From: Jeremy Fine, Chief Financial Officer Re: Financial Results for December 2017 Date: February 14, 2018 I. Summary CTA s financial results are $4.7 million favorable
Cash & Liquidity The chart below highlights CTA s cash position at March 2017 compared to March 2016.
 To: Chicago Transit Authority Board From: Jeremy Fine, Chief Financial Officer Re: Financial Results for March 2017 Date: May 10, 2017 I. Summary CTA s financial results are $0.6 million favorable to budget
Business Cycle Index July 2010
 Business Cycle Index July 2010 Bureau of Trade and Economic Indices, Ministry of Commerce, Tel. 0 2507 5805, Fax. 0 2507 5806, www.price.moc.go.th Thailand economic still expansion. Medium-run Leading
Financial Markets Fall 2008 Economic Update
 Financial Markets Fall 28 Economic Update October 7, 28 Jeff Rubin Chief Economist, Chief Strategist Avery Shenfeld Managing Director, Senior Economist Crash in Commodity Prices Exaggerates Growth Slowdown
Corral Q May 2017
 Corral Q1 2017 May 2017 Disclaimer This presentation has been prepared by Corral Petroleum Holdings AB (publ) and/or its subsidiaries and affiliates ( Corral ). The information contained in this presentation
Cash & Liquidity The chart below highlights CTA s cash position at August 2018 compared to August 2017.
 To: Chicago Transit Authority Board From: Jeremy Fine, Chief Financial Officer Re: Financial Results for August 2018 Date: October 10, 2018 I. Summary CTA s financial results are favorable to budget for
FBM 4Q17 Earnings Presentation
 FBM 4Q7 Earnings Presentation February 27, 208 DISCLOSURES Forward-Looking Statements This presentation contains forward-looking statements as that term is defined in the Private Securities Litigation
Financial Report - FY 2017 Year to Date May 31, 2017
 Financial Report - FY 2017 Year to Date July 19, 2017 1 Major Highlights Revenue Sales tax remittances received through YTD April 2017 are 4.2% higher than YTD April 2016 Plaza Saltillo lease income budgeted
Financial Industry Solutions. Second Quarter Financial Results AUGUST 9, 2018
 Financial Industry Solutions Second Quarter Financial Results AUGUST 9, Disclaimer Certain information in this presentation is forward-looking and related to anticipated financial performance, events and
Amsterdam - May 17 th, Philippe Camus CEO - Rainer Hertrich CEO
 AGENDA Acceptance and approval of the Report of the Board of Directors Adoption of the accounts for the financial year 2001 Approval of the result allocation, distribution and payment date of dividends
Q Transformation Update & Financial Results May 26, 2016
 Q1 2016 Transformation Update & Financial Results May 26, 2016 a Cautionary Statement Regarding Forward-Looking Information This presentation contains forward-looking statements, including statements about
Cash & Liquidity The chart below highlights CTA s cash position at September 2017 compared to September 2016.
 To: Chicago Transit Authority Board From: Jeremy Fine, Chief Financial Officer Re: Financial Results for September 2017 Date: November 15, 2017 I. Summary CTA s financial results are $7.7 million favorable
BANK OF AMERICA MERRILL LYNCH 2017 LEVERAGED FINANCE CONFERENCE
 THE NEW NAVISTAR November 29, 2017 BANK OF AMERICA MERRILL LYNCH 2017 LEVERAGED FINANCE CONFERENCE International is a registered trademark of, Inc. NYSE: NAV1 Safe Harbor Statement and Other Cautionary
Results 2Q18. August 2, 2018
 Results August 2, 2018 Highlights Indicators Var. x 2Q17 Operating Income (R$ MM) 42.8 +92.7% Operating Margin 1.8% +0.8 p.p. Net operating revenues: R$2.4 billion (+9.0% vs. 2Q17) ASK (BN) 10.7 +2.2%
Third Quarter 2008 Earnings Teleconference. October 31, 2008
 Third Quarter 2008 Earnings Teleconference October 31, 2008 Participants Tim Solso Chairman and Chief Executive Officer Joe Loughrey Vice Chairman Pat Ward Chief Financial Officer Tom Linebarger President
Loop Capital Metals & Mining Conference. March 2017
 Loop Capital Metals & Mining Conference March 2017 1 IMPORTANT INFORMATION ABOUT RYERSON HOLDING CORPORATION These materials do not constitute an offer or solicitation to purchase or sell securities of
Fourth Quarter 2016 Performance Summary
 Fourth Quarter 2016 Performance Summary Operational and Financial Highlights - 2016 Net profit rises by +2.5% to Euros 545.5 million Recurring sales (excluding Raw Materials and Others) rise by +4.5% (+4.6%
June Woongjin Coway
 June 2006 Woongjin Coway 0 Disclaimer This presentation contains historical information of the Company which should not be regarded as an indication of future performance or results. This presentation
SCHMOLZ + BICKENBACH Q Results Investors & Analysts Conference Call Lucerne, August 11, 2017
 SCHMOLZ + BICKENBACH Q2 2017 Results Investors & Analysts Conference Call Lucerne, August 11, 2017 Disclaimer Forward-looking statements This presentation contains forward-looking statements about developments,
Budget Process Overview and Cost Allocation Methodology
 Budget Process Overview and Cost Allocation Methodology 1 Cost Allocation Agreement Guiding Principles Operate a consolidated regional public transportation system within and between the Participating
Fuji Heavy Industries Ltd.
 President & CEO, Yasuyuki Yoshinaga Fuji Heavy Industries Ltd. May 9, 2014 0 Business Results for the FYE2014 ( 100M) Consolidated automobile sales FYE2013 FYE2014 YoY 724,000 825,000 High +13.9 % Net
Looking to the medium term
 Looking to the medium term Issued: 4 September 2013 Legal notice This presentation has been prepared to inform investors and prospective investors in the secondary markets about the Group and does not