Heijmans Business Update. September 2015, based on H interim results
|
|
|
- Brett Hoover
- 6 years ago
- Views:
Transcription

1 Heijmans Business Update September 2015, based on H interim results


2 Asset Management Schiphol Airport 2
3 Contents Company profile Strategy H Interim results and outlook Developments per sector Appendices Financial figures: P&L, Balance Sheet, Land Bank positions, Financial Covenants Procedures: Property development, Risk management Organisation: Organisational chart, resumes Executive Board 3

4 Company profile Founded in 1923 by Jan Heijmans Highway Tilburg - Den Bosch (anno 1928) 4


5 Company profile Heijmans History Since 1923 active in road building Strong growth following second world war During the sixties, diversification towards residential building During the eighties, diversification towards property development Listing at the Amsterdam Stock Exchange in 1993 Strong revenue growth by acquisitions 2008: Reset strategy 2009: Financial restructuring 2010: Strategy focusing on profitability, sustainability and quality 2012: Strategic review with BCG 2014: Improve and Innovate new criteria and ambitions formulated 5


6 Company profile Residential Non-residential Infrastructure Property development Building Road building Residential building Technical Services Civils Engineering Eemskwartier Groningen Lounge 2 Schiphol Airport N23 Westfriciaweg, Province of North Holland 6 Meysters s Buiten, Utrecht Music Center Vredenburg, Utrecht A9 Gaasperdammerweg PPP, Amsterdam 6
7 Company profile Heijmans at a glance With around 6,800 employees and approx. 2 billion in annual revenues, Heijmans combines activities in the fields of property development, residential building, non-residential and infrastructure; Focus on selective markets, active in the Netherlands, Belgium and Germany; Create added value by offering the client an integrated approach with focus on quality; Ambition to achieve leading position on quality, sustainability and profitability, resulting in: The best choice for clients; Innovation and focus on sustainability; Above-average long-term yield for shareholders; Being attractive and inspiring to employees. Building the spatial contours of tomorrow, where development and realization take into account people and the environment, both in projects for clients and in the company's own ecological footprint. 7
 2.300 2.100 1.900 1.700 1.")
8 Company profile Sustained recovery Dutch housing market is visible: 800 Number of homes sold by quarter Q1 Q2 Q3 Q4 Order book offers perspective: Development order book ( mln.) Development order book 8
9 Strategy Restructuring provides potential Since 2009, Heijmans has implemented a transformational strategic restructuring: Focus on core activities in the Netherlands and Belgium Disposal of non-core foreign operations Reduction in strategic land bank positions Margin over volume ~ added value Streamline organisation with centralisation of activities Improve contract-, risk- and project management through Improve the core program Jul mio rights issue Nov-2009 disposal Heitkamp Rail and NSE 2010 disposal of several non-core Belgium activities 2011 restructuring Oevermann Dec-2011 terminate 40 mio stake in Meerstad Apr-2012 disposal of telecom activities Burgers Ergon Dec FTE reduction Residential Aug-2013 Dec 2012 Sub-10 Start Integral share issue Working Capital management Fit for Cash Dec FTE reductions Non-res., Oevermann, Civil. Oct-2009 reverse 10-1 stock split Dec FTE reduction Dec-2010 disposal of Leadbitter UK Dec-2011 restructuring Prefab 2012 restructuring Nonresidential Jun-2012 disposal of prefab activities Dec-2012 terminate 20 mio stake Waalsprong Jun-2013 PPP partnership 3i (equity investment) Dec-2013 Acquisition Brinck Group May-2015 Sub-10 share Issue to repurchase CumPrefs 9


10 A12 Motorway PPP Veenendaal Ede Grijsoord 10
11 Strategy Ambition Strategy To be the best construction company in the Netherlands 2012 Boston Consultancy Group review: Heijmans can become the best Dutch construction company Overall midterm EBIT goal of 3-4% is realistic Strategic direction based on Improvement & Renewal/Innovation Improve the core program will improve operational excellence: Procurement Tender management Project management (continuous improvement of quality & process) Commerce Innovation as driver for competitive advantage, resulting in our Renewal ambition : In 2020 our products will generate energy, instead of using energy In 2020 our buildings, engineering structures and roads will be recyclable to the maximum extent In 2020 our properties and solutions will contribute to improved spatial quality 11

")


12 National Military Museum (PPP) Soesterberg 12
13 Strategy Competitive strengths Residential Development of urban and rural areas in both small and large-scale projects Combining creativity and customer focus with strength on realization Increasing focus on renovations and transformations Improving processes including procurement, 3D BIM (widely applied within Heijmans), standardization of concepts (industrialized proces) and innovative solutions (e.g. Heijmans One). Non-Residential Niche position with focus on healthcare, higher education, high-tech clean, datacenters, government Combining building with technical solutions/services in integrated projects during the whole lifecycle of buildings Centralised business model Infrastructure Top player in our market with proposition including asset management, traffic management and technical services Strong capabilities and track record in larger and integrated projects Added value driven (clear view on lean asset base and asphalt production) Heijmans multidisciplinary integrated approach is a major differentiator in the market 13


14 14
15 Strategy Innovation Invest in smart technological concepts / sustainable solutions: Create competitive advantage towards clients Improve future margin potential because of increased added value Appointment of Chief Technology Officer Cooperation with Spark (network for creativity and knowledge) Examples of innovations already applied / ready for market launch The Heijmans One portable house; Hydrofit kousrelining with DSM; Energy generating noise barrier ( Solar noise barrier ); Smart living concept : standardised home control in all family homes Examples of innovations in pilot phase Greenway LE & self healing asphalt concept 3D printed canalhouse and steel bridge Smart Highway 15


16 Smart Energy: Bright house Smart Materials: 3D print Smart Highway 16 Smart Space: Heijmans One portable house
17 H Interim results Heijmans benefits from recovering housing market, negative result due to pressure on infra Improvement of operating results remains top priority Key figures (amounts in million ) Heijmans benefits from recovering housing market: Higher revenues, and improvement of operating margins; Total homes sold in H1: 746 (2014: 482) Negative result in first half year due to poor performance Dutch Infra; Performance in Germany and Belgium in line with expectations with positive operating results; Increased revenues, mainly in Residential, also in Non-residential; Order book stable compared to last year; Sub 10 equity issue, proceeds used to repurchase Cumulative Preference Shares ( 21 mln); Solid solvency rate of 29%; Net debt slightly higher than H (108 mln vs. 99 mln); H1 Actual 2015 Actual 2014 FY Actual 2014 Revenues Underlying Operating Result Net result Net debt Order book Number of homes sold


18 Living Lab Solar Noise Barriers s-hertogenbosch 18
19 H Interim results To improve and renew: Safety improved due to internal GO! (No Accidents) programme: Decrease in # accidents and in IF-rate (injuries with non-attendance 1 day per mln working hours). From 6.1 in 2013 to 5.6 in 2014 to 4.8 mid year 2015 Good progress of restructurings and improvement measures announced in 2014: Implementation of new ERP platform (SAP) on track Updates tender management process implemented, incl go / no go decisions Optimisation schemes for procurement, project management, and commerce Working capital (Fit for Cash) Reorganisations completed / on track, slight delay in capacity reduction within Non-residential; Continuously explore opportunities to innovate: Focus on marketing of successfully developed concepts as Heijmans One and Smart Highway Start of field testing Solar Noise Barriers Partner in development of metal bridge based on 3D printing technology in Amsterdam Implementation of Smart Living concept, by offering home management in all family homes 19


20 MX3D 3D metal print bridge Amsterdam 20
21 H Outlook Outlook 2015: improvements to become visible in 2nd half of 2015 Positive trend of housing market continues, Heijmans well positioned with Residential and Property Development; Gradual improvement of Non-residential and Infra business; For infra in particular, the key challenge is to make sure that several projects that were adjusted downwards in recent quarters are completed in time, with good progress of claim settlements; Order book offers good perspective; Heijmans strategy unchanged: Improve the core Integrated approach Innovative Solid solvency ratio, improving profitability remains top priority; Outlook 2015: improvements to become visible in 2nd half of


22 Harener Holt Haren 22
23 DEVELOPMENTS PER SECTOR PROPERTY DEVELOPMENT In EUR mln H H Revenues Underlying operating result 4-1 Underlying operating margin 3,2% -1,6% Order book After several years with historically low activity, market recovery continues: Revised government policies related to Dutch housing market are encouraging removals / mobilization. Low interest rates on mortgages. Especially in larger cities, house prices are stable or increasing again. Underlying demand for houses (demographic trends). New/changing roles for social housing corporations and institutional investors. Strong growth in revenues as planned, positive development of operating result; Housing sales increased to 746 (2014: 482), of which 565 to private buyers (2014: 244); Order book up, focus on enlarging housing showroom ; Good progress of large projects, including Harenerholt Haren, Wiener A dam and Marquant Pijnacker; Total invested capital in land positions comparable with FY


24 Het Timmerhuis Rotterdam 24
25 DEVELOPMENTS PER SECTOR RESIDENTIAL In EUR mln H H Revenues Underlying operating result 3-1 Underlying operating margin 1,5% -0,7% Order book Heijmans anticipates on the new reality of Dutch housing market: Standardisation brings high quality at a competitive price Anticipate on new demand with concept homes (standarsised engineering / production with selected co-makers) Increasing share of transformations and renovations; Energy neutral construction e.g. Zero Ready concept for renovation Significant growth in revenues, downward trend broken in 2015; Revenues: Netherlands ( 158 mln) and Belgium ( 46 mln), strong link with Property Development activity; Positive operating result, mainly contributable to Dutch activities; Order book stabilised compared to FY 2014, ambition is further growth based on standardised products (concepts such as Huismerk, Wenswonen, of which more than 500 were realised in 2014); Good progress of large projects, such as Wijnhaven The Hague, Kooiplein Leiden, Elisabethzaal Antwerp. 25

26 Bèta Campus FWN Leiden University 26
27 DEVELOPMENTS PER SECTOR NON-RESIDENTIAL In EUR mln H H Revenues Underlying operating result -2 1 Underlying operating margin -0,9% 0,6% Order book Niche profile with margin-over-volume strategy > added value proposition due to strong integration of construction and installation technique as well as design / construct / maintain capabilities; Revenues higher because of high production level, a.o. at Schiphol airport; Restructuring being executed with slight delay, capacity (> 200 jobs) and cost reduction remain required; Continued focus to improve project and risk management, especially in design phase; Good order intake in 2014, but no large projects acquired so far in 2015; Positive development of Services; Good start of operational phase National Military Museum Soesterberg. 27


28 A4 Delft-Schiedam 28
29 DEVELOPMENTS PER SECTOR INFRA NETHERLANDS In EUR mln H H Revenues Underlying operating result Underlying operating margin -5,0% -1,4% Order book Revenues decreased, poor performance, challenging conditions large projects; Improvements visible in regional projects (local governments); Large projects as A4 Delft-Schiedam and A9 Gaasperdammerweg on track; 2014 / 2015 figures heavily impacted (> 10 mln) by arbitrage casus Energiefabriek Tilburg. Project still challenging, to be ready for operational testing this year. Large scale projects became more complex over the past years, requiring more preparation. Organisation changes to improve margin and project control: Different methodology of pricing costs and risks; Tightening steering of tender and design phase, including go/no-go decisions; Investing in contract management, accelerating claim discussions with clients; Integrating Roads and Civil into Heijmans Infra, under centralized management with direct involvement Executive board. 29


30 Liefkenshoektunnel Antwerpen 30
31 DEVELOPMENTS PER SECTOR INFRA BELGIUM In EUR mln H H Revenues Underlying operating result 3 7 Underlying operating margin 5,3% 10,8% Order book Revenues in Belgium and operating result decreased slightly in 2015; But still healthy profit margins for both Heijmans Infra (Roads) and Van den Berg Leidingbouw (Civil Engineering); Challenging market conditions in Belgian (public) infra market will give pressure on revenues; Increase in order book contributable to Cables & Ducks segment. 31

32 Mercaden Dorsten (Germany) 32
33 DEVELOPMENTS PER SECTOR INFRA GERMANY In EUR mln H H Revenues Underlying operating result 1 0 Underlying operating margin 0,8% 0,0% Order book German business consists of Franki Grundbau (specialised in foundations) and Oevermann (both roads and non-residential); After some difficult years, revenues are increasing with positive margin contribution; Strong revenue growth at Oevermann Hochbau (Non-residential) using good market; Margin improvement mainly contributable to Oevermann; German infra market slightly better volume; Scheduled restructurings at Oevermann are completed. 33


34 St.-Jan parking garage s-hertogenbosch 34


35 Appendices


36 Smart Highway Heijmans Technology 36
37 Annex: Profit & Loss account (EBIT per sector) (in million ) Actual 2015 First half year Actual 2014 Full year Actual 2014 Revenues EBIT Revenues EBIT Omzet EBIT Property Development Residential - Netherlands Residential - Belgium Residential building Non-Residential Infra - Netherlands Infra - Belgium Infra - Germany Infra total Total operations Group costs/eliminations/others Contingency Revenues/ EBIT Business Extra-ordinary items Revenues/EBIT Total Financial results Result joint ventures after tax Others Result before tax Taxes Result after tax
38 Annex: Balance Sheet Balance sheet (in million ) Q Q Q Property, plant and equipment Intangible assets Real estate investments Participation in Joint Ventures Debtors - Staff related Financial assets Fixed assets Working capital (excl. cash and cash equivalents) Funding requirement Equity Provisions (non current) Net debt Funding
39 Annex: Balance Sheet Working capital (in million ) Strategic land bank Residential building under construction Residential building 'ready not sold' Inventories Work in progress Receivables Current and non-interestbearing liabilities Trade and other payables Work in progress Provisions (current) Income tax payables Net debt (in million ) Q Working capital Q Q Q Q Q Cumulative preference shares Non-current loans and other non-current financing Current loans and other current financing Interest-bearing loans Minus: cash and cash equivalents Net debt
40 Dive coaster Baron nd phase Bosrijk Efteling 40
41 Annex: Financial covenants 12 months rolling Financial covenants Definition Ratio Actual Actual Actual (in million ) 30-jun Leverage Ratio Consolidated Total Net Borrowings / Consolidated EBITDA Max 3 1,6-0,9 2,8 Interest Cover Ratio Consolidated EBITDA / Consolidated Net Interest Payable Min 3 8,0 3,4 5,1 Reported net debt (for accounting purposes) adjustments for financial covenant purposes (from Reported Net Debt to Consolidated Total Net Borrowings) IFRS 11 adjustments* Cumulative Preference shares (66) (66) (66) Non-recourse PFI debt (53) (53) (61) Other (0) (0) 1 Consolidated Total Net Borrowings (for financial covenant purposes) 64 (11) 52 Comments: Financial covenants were met in H with limited headroom on Leverage Ratio. Only for calculating the financial covenants per 30/6/2015, the project loss of the Energiefabriek Tilburg (EUR 9.2 mln) was excluded from the Consolidated EBITDA (as per agreement with the Lender s syndicate) Effective 12-month Consolidated EBITDA (for covenant purposes as per 30/6/2015) was EUR 18 mln For calculating the financial covenants, a.o. the following adjustments of the accounting figures should be made of Total Net Borrowings, Consolidated EBITDA and Consolidated Net Interest Payable: To add impact Joint Ventures that are not longer included under IFRS 11 as of 2014 (see asterisk above) To subtract impact of ringfenced (non recourse) project financings in relation to PFI/PPP activities To subtract impact of cumulative preference shares 41
42 Elisabeth Center Antwerp (Belgium) 42
 30-6-2015 31-12-2014 30-6-2014 Brabant & Gelderland 4 4 4 Northern provinces 16 17 21 Randstad 31 30")
 Brabant & Gelderland 30-6-2015 57 31-12-2014 57 30-6-2014 66 Northern provinces 7 7 9 Randstad 54 51")


43 Geographical spread land positions Strategic positions (in Mln. ) Brabant & Gelderland Northern provinces Randstad Southern provinces Land in exploitation (in Mln. ) Brabant & Gelderland Northern provinces Randstad Southern provinces Total land bank Land bank obligations 169,0 163,5 54,3 44,9 100,3 37,2 93,7 29,2 83,2 88,1 109,5 101,1 Individual valuation per position All positions evaluated periodically FY 2012 FY 2013 FY 2014 H Conditional obligations with no/limited cash impact Conditional obligations with limited cash impact Unconditional obligations Impairment in case of lower net cash value, excluding positive sales results and construction results


 Noorderhaven")
44 Annex: Property development 1. Design contests & selections 2. Fee-developments 3. Land positions Fenix Lofts Rotterdam (1) Overhoeks Amsterdam (2) Noorderhaven Zutphen (3) 44
45 Annex: Property development Process and timing unsold unsold unsold sold PROJECT sold sold sold PROCESS sold sold sold sold sold sold Obtaining Land position Start Property development Start sale Start building Delivery to consumer 70/80% pre-sold 1-6 years 1-2 years 3-6 months 1-2 years Revenues recognition is based upon the progress of construction of sold property 45
46 Annex: Property development Policies and corporate philosophy gradually developed and implemented as from mid 2008: Compact set-up with direct reporting to Executive management; Centralised organisation model: Heijmans acts in the market as One Company ; Centralised tender management. Direct involvement executive management; Senior management bonus system based on corporate goals; Periodic review meetings for businesses and (relevant) projects; Best in class project reporting providing good insight on project opportunities as well as risks, specific issues, cash flow and progress. Further improve uniformity; Direct involvement from Executive board in large and complex projects; Culture of openness on project performance. Issues to be escalated as soon as possible to enable effective follow-up and support; Substantial involvement for professionals of Procurement, Finance, Legal; High level of attention for cash management on all levels in the organisation; Development towards uniform ERP landscape. Objective to improve control & efficiency; Balance limitations of project size (over time) versus capacity. Partnering where required; Simplified legal structure with limited nr. of entities and managing directors. 46
47 Annex: Property development Number of projects Illustrative example 0% Gross project margin Additional attention and control Aim is not to eliminate all risks. These are and will remain to be, associated with project business; Objective is to control and manage risks with the purpose of achieving the best possible results with our company; Furthermore: decrease the likelihood of large (negative) project outcomes. 47


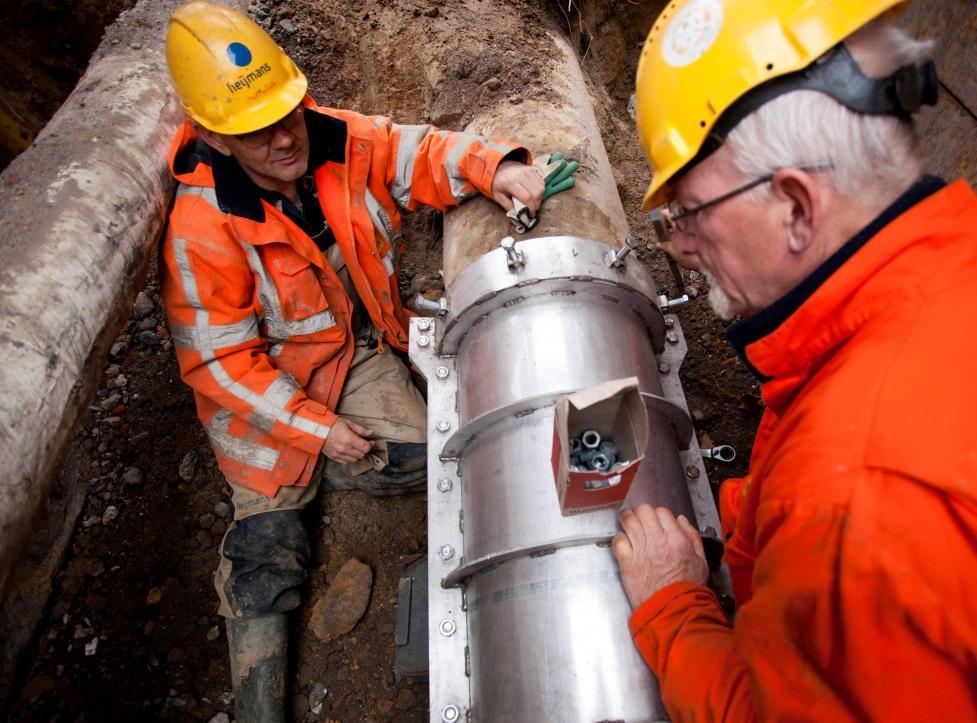
48 Kousrelining (renovation of waterpipes) Infrastructure for Electric cars Composite bridge Infra technology & mobility 48
, CFO & member of the Executive")
, COO & member of the Executive Board responsible for: Property Development, Residential Building, Non-Residential, PPP, Infra")
49 Annex: Executive Board Bert van der Els (1954), CEO and chairman of the Executive Board responsible for: General Affairs, Management Development and Diversity, HR, Commerce, Communication, Innovation, Infra Belgium Mark van den Biggelaar (1968), CFO & member of the Executive Board responsible for: Finance, Investor Relations, ICT, Legal Affairs, Procurement, Facility Management, Pensions, Infra Germany Ton Hillen (1961), COO & member of the Executive Board responsible for: Property Development, Residential Building, Non-Residential, PPP, Infra Netherlands, Materials 49


50 We are building the spatial contours of tomorrow 50
51 Project images in this handout Slide Project Location Segment 2 Asset Management Schiphol Schiphol Airport Infra 6 Eemskwartier Groningen Property Development 6 Meijster s Buiten Utrecht Property Development 6 Lounge 2 Schiphol Airport Non-residential 6 Music center Vredenburg Utrecht Non-residential 6 N23 Westfrisiaweg Province of North Holland Infra 6 A9 Gaasperdammerweg PPP Amsterdam Infra 10 A12 Motorway PPP Ede Veenendaal - Grijsoord Infra 12 National Military Museum Soesterberg Non-residential 22 Harener Holt Haren Residential 24 Het Timmerhuis Rotterdam Property Development 26 Beta Campus Leiden University Non-residential 28 A4 Motorway Delft-Schiedam Infra 30 Liefkenshoektunnel Antwerp Infra Belgium 32 Mercaden Dorsten Infra Germany 34 St. Jan Parking Garage s-hertogenbosch Infra 40 Dive Coaster Bosrijk Efteling Kaatsheuvel Residential 42 Elisabeth Center Antwerp Non-residential Belgium 44 Fenixloodsen Rotterdam Property Development 44 Overhoeks Amsterdam Property Development 44 Noorderhaven Zutphen Property Development 51
52 Disclaimer This presentation has been prepared by and is the responsibility of Heijmans N.V. This presentation is being supplied to you solely for your information and use. The information may not be further distributed or passed on to other people or published or reproduced in whole or in part. The information may be subject to updating, completion, revision and amendment and such information may change materially. This presentation contains certain forward-looking statements relating to the business, financial performance and results of the Heijmans N.V. and the industry in which it operates. These statements are based on Heijmans N.V.'s and its management's current plans, estimates and projections, as well as its expectations of external conditions and events. In particular the words expect, anticipate, predict, estimate, project, plan, may, should, would, will, intend, believe and similar expressions are intended to identify forward looking statements. Forward-looking statements are statements of future expectations that are based on current expectations and assumptions and involve known and unknown risks and uncertainties that could cause actual results, performance or events to differ materially from those expressed or implied in these statements. Neither Heijmans N.V. nor any of its subsidiaries undertake any obligation to publicly update or revise any forward-looking statement as a result of new information, future events or other information. No representation or warranty, express or implied, is or will be made by Heijmans N.V., its advisors or any other person as to the accuracy, completeness or fairness of the information or opinions contained in the presentation and any reliance you place on them will be at your sole risk. Without prejudice to the foregoing, neither Heijmans N.V., its associates, its advisors, nor its representatives accept any liability whatsoever for any loss howsoever arising, directly or indirectly, from the use of this presentation or its contents or otherwise arising in connection with this presentation. The presentation does not constitute or form part of, and should not be constructed as, an offer or invitation to subscribe for or purchase any securities. HEIJMANS N.V. CONTACT: PO Box 2 Guido Peters 5240 BB Rosmalen, The Netherlands Investor Relations Heijmans gpeters@heijmans.nl
Interim results August 19, 2015 Executive Board Heijmans N.V.
 Interim results 2015 August 19, 2015 Executive Board Heijmans N.V. Welcome The Student Hotel Transformation Parool & Trouw Building Amsterdam Heijmans benefits from recovering housing market, negative
Annual figures February 2016 Board of Directors Heijmans N.V.
 Annual figures 2015 25 February 2016 Board of Directors Heijmans N.V. Heijmans 2015: negative result, improvement visible second half of the year Improvement result remains top priority Bert van der Els
ANNUAL RESULTS February 27, 2014 Executive Board Heijmans N.V.
 ANNUAL RESULTS 2013 February 27, 2014 Executive Board Heijmans N.V. Heijmans records modest result in 2013 despite tough year Bert van der Els- chairman Heijmans Executive Board FY 2013 Highlights Another
Heijmans: annual results 2016, adjustment strategy and new financing agreements
 Heijmans: annual results 2016, adjustment strategy and new financing agreements 23 February 2017 Board of directors Heijmans N.V. Wijnhavenkwartier Den Haag Heijmans: annual results 2016, adjustment strategy
Heijmans annual results 2017
 Heijmans annual results 2017 23 FEBRUARY 2018 ZUIDASDOK, AMSTERDAM DE SCHOONE LEY, HAGA TERREIN DEN HAAG Heijmans annual results 2017: sound basis for continued recovery TON HILLEN, CEO HEIJMANS N.V. 2
Update 2016: preliminary annual figures, refinancing, strategy adjustment
 Update 2016: preliminary annual figures, refinancing, strategy adjustment 16 February 2017 Executive Board Heijmans N.V. Wijnhavenkwartier Den Haag Heijmans; preliminary results 2016, strategy adjustment
Heijmans interim results 2017
 Heijmans interim results 2017 16 AUGUST 2017 ZUIDASDOK, AMSTERDAM Heijmans: solid progress towards sustainable recovery TON HILLEN, CHAIRMAN EXECUTIVE BOARD HEIJMANS N.V. 2 Highlights interim results Recovery
Heijmans: moderate first half year, substantial growth order book 2014 transition year, residential market offers perspective
 Press release half year results 2014 Datum 20 augustus 2014 Pagina s 1 van 21 Heijmans: moderate first half year, substantial growth order book 2014 transition year, residential market offers perspective
Heijmans Business Update ROADSHOW BOOKLET, FEBRUARY 2018, BASED ON 2017 ANNUAL RESULTS
 Heijmans Business Update ROADSHOW BOOKLET, FEBRUARY 2018, BASED ON 2017 ANNUAL RESULTS 2 Key figures Key figures * x 1 million H2 2017 H2 2016 2017 2016 Revenues Netherlands 756 665 1.402 1.370 Underlying
Heijmans benefits from recovering housing market, negative result due to pressure on infra
 Press release Datum 19 augustus 2015 Pagina s 1 of 22 Heijmans benefits from recovering housing market, negative result due to pressure on infra Highlights: Number of homes sold increased to 746 in the
Heijmans interim results 2018
 Heijmans interim results 2018 15 AUGUST 2018 GAASPERDAMMERTUNNEL, A9 AMSTERDAM Heijmans continues improvement in first half of 2018 TON HILLEN, CHAIRMAN EXECUTIVE BOARD HEIJMANS N.V. 2 Safety Trend number
x 1 million H H *
 Press release Datum 26 februari 2015 Pagina s 1 van 21 Heijmans full year results: poor 2 nd half year 2014, order book and housing market offer good prospects Challenging market requires continuous improvement
Heijmans continues improvement in first half of Key figures * x 1 million H H
 Press release Date 15 August 2018 Page 1 of 25 Heijmans continues improvement in first half of 2018 Highlights: Turnover increased to 780 million in first half of 2018 (first half 2017: 646 million). Underlying
Heijmans: solid progress towards sustainable recovery. Key figures * x 1 million H H
 Press release Date Page 16 August 2017 1 of 21 Heijmans: solid progress towards sustainable recovery Highlights: Strong improvement in underlying EBITDA NL: 9 million (H1 2016: 9 million negative) largely
Zumtobel Group AG FY 2014/15 results
 Zumtobel Group AG FY 2014/15 results June 24, 2015 1 24 June 2015 Annual Results 2014/15 Improvement in revenues and earnings, restructuring measures on track Financials FY 2014/15 at a glance Group revenues
Investor Presentation 30/08/2017 Page #
 Investor Presentation 30/08/2017 Page # Disclaimer This presentation was prepared by PORR AG (the "Company") solely for use at investors meetings and is provided solely for informational purposes. This
Date: 6 th September Remko Dieker Secretary to the Managing Board T: I: Chairman s statement
 Date: 6 th September 2018 Contact: Remko Dieker Secretary to the Managing Board T: +31 20 557 51 80 I: www.kasbank.com Net result of EUR 5.1 million (H1 2017: EUR 8.5 million) Operating income of EUR 51.8
Zumtobel Group. Q1 2012/13 results. September 5, September
 Zumtobel Group Q1 2012/13 results September 5, 2012 1 September 2012 1 Solid results in a challenging operating environment Financial Highlights 1 st quarter 2012/13 Lighting Segment (Zumtobel / Thorn)
Zumtobel Group FY 2011/12 results
 Zumtobel Group FY 2011/12 results June 27, 2012 1 June 2012 1 Growth driver energy efficiency Selected reference projects THORN: Street lighting project Durham county (UK) More than 6.000 Oxane LED street
Zumtobel Group AG Q1 2015/16 results
 Zumtobel Group AG Q1 2015/16 results September 8, 2015 1 8 September 2015 Q1 2015/16 results An expected slow start to the FY but on track to meet full year guidance Financials Q1 2015/16 at a glance Group
Royal BAM Group nv First nine months Amsterdam, 18 November 2010
 Royal BAM Group nv First nine months 2010 Press and analysts meeting Amsterdam, 18 November 2010 BAM forecasts break-even result for 2010 despite property impairments Net result for the first nine months
Zumtobel Group AG Annual Financial Results 2017/18 & Update on strategy development process
 Zumtobel Group AG Annual Financial Results 2017/18 & Update on strategy development process 28 June 2018 title of presentation (change at 1st slide inside the slide master) xx.xx.xxxx Thomas Tschol Chief
Half-year figures July 2015
 Half-year figures 2015 22 July 2015 Agenda Erik van der Noordaa, CEO Ballast Nedam Highlights 3 Peter van Zwieten, CFO Ballast Nedam Finances 7 Erik van der Noordaa, CEO Ballast Nedam Public offer 25 Q&A
Zumtobel Group AG Q1 2018/19 & Strategic Outlook. September 2018
 Zumtobel Group AG Q1 2018/19 & Strategic Outlook September 2018 AGENDA Q1 2018/19 financial results Corporate Strategy Outlook ) Q1 2018/19 results & strategic outlook 04.09.2018 2 Stabilisation measures
4 th quarter and annual results 2011 strong growth in North America, gradual slowdown in Europe revenue up 13% and diluted earnings per share up 8%
 4 th quarter and annual results 2011 strong growth in North America, gradual slowdown in Europe revenue up 13% and diluted earnings per share up 8% Ben Noteboom, CEO Robert-Jan van de Kraats, CFO Randstad
Operating income increased by 4% to EUR 53.6 million (H1 2016: EUR 51.6 million)
") Date: 8 th September 2017 Contact: Remko Dieker Secretary to the Managing Board T: +31 20 557 51 80 I: www.kasbank.com Net result of EUR 8.5 million (H1 2016: EUR 0.9 million) Operating income increased
Date: 8 th September 2017 Contact: Remko Dieker Secretary to the Managing Board T: +31 20 557 51 80 I: www.kasbank.com Net result of EUR 8.5 million (H1 2016: EUR 0.9 million) Operating income increased
3 rd quarter results 2010 continued strong growth; revenue up 19% in Q3 2010
 3 rd quarter results 2010 continued strong growth; revenue up 19% in Q3 2010 Robert-Jan van de Kraats, CFO Randstad Holding nv disclaimer & definitions Certain statements in this document comprise forecasts
Interim Results Presentation. For the six months ended 31 December 2018
 Interim Results Presentation For the six months ended 31 December 2018 1 STEEL & TUBE IS One of New Zealand s leading providers of steel solutions, and a proud New Zealand company, with over 65 years of
BAM raises profit outlook for 2007 after a good first half year
 Runnenburg 9, 3981 AZ Bunnik / P.O. Box 20, 3980 CA Bunnik The Netherlands Telephone +31 (0)30 659 89 88MRO bank s-gravenhage 43.00.08.937 Date 6 September 2007 No. of pages 11 BAM raises profit outlook
Zumtobel Group AG H1 2018/19. 4 December 2018
 Zumtobel Group AG H1 2018/19 4 December 2018 Improvement of profitability despite challenging market environment Financials H1 2018/19 at a glance Group revenues 4.7% below prior year, UK (minus 15%) and
Transpacific FY15 Half Year Results Presentation
 Transpacific FY15 Half Year Results Presentation Robert Boucher CEO Brendan Gill CFO 20 February 2015 - Disclaimer Forward looking statements - This presentation contains certain forward-looking statements,
Nedap 2016 annual figures press release
 Revenue and operating profit rose in 2016 One-off costs of supply chain reorganisation lower than expected Groenlo, Netherlands, 16 February 2017 Nedap s overall revenue was up 3% in 2016, rising to 186.0
highlights key figures dividend outlook organic revenue growth +5% earnings per share +16% continued investments in growth and innovations
 organic revenue growth +5% earnings per share +16% continued investments in growth and innovations Utrecht, 26 February 2019 highlights revenue +2% to EUR 2,759 million (organic +5%) operating profit (EBITA)
2018 half year results. Amsterdam, 23 August 2018
 2018 half year results Amsterdam, 23 August 2018 BAM reports 1H18 adjusted pre-tax result of 57.8 million and reconfirms full year outlook Construction & Property: Dutch residential property development
Year of transition for Neways Improvement programme Up to the next level launched across the group
 PRESS CONFERENCE / ANALYST MEETING DATE: TODAY, TUESDAY 23 FEBRUARY 2016 TIME: 10.30 hrs LOCATION: Hotel Casa 400 (Eerste Ringdijk 4, AMSTERDAM) P R E S S R E L E A S E NEWAYS ELECTRONICS INTERNATIONAL
Accelerating Think Forward
 Accelerating Think Forward Bank of America Merrill Lynch 22 nd Annual Financials CEO Conference Ralph Hamers, CEO ING Group London 26 September 2017 The global financial crisis 10 years on 2 EC restructuring
2 nd quarter continuation of a stable trend. Ben Noteboom, CEO Robert Jan van de Kraats, CFO. Randstad Holding nv July 25, 2013
 2 nd quarter 2013 continuation of a stable trend Ben Noteboom, CEO Robert Jan van de Kraats, CFO Randstad Holding nv disclaimer & definitions Certain statements in this document concern prognoses about
Financial Year 2013 Media and Analysts Conference
 Financial Year Media and Analysts Conference Zurich, 25 February 2014 A. Affentranger / B. Fellmann Media and Analysts Conference Highlights Implenia Media and Analysts Conference February 2014 Page 2
PORR Q3 Update The next chapter. Vienna, November 2014
 PORR Q3 Update The next chapter Vienna, November 2014 Disclaimer This presentation was prepared by PORR AG (the "Company") solely for use at investors meetings and is furnished to you solely for informational
2017 Half-Year Results July 28 th, 2017
 2017 Half-Year Results July 28 th, 2017-1 - Disclaimer This presentation does not contain or constitute an offer of securities for sale or an invitation or inducement to invest in securities in France,
2018 half-year results presentation. 15 August 2018
 2018 half-year results presentation 15 August 2018 Forward-looking statements This presentation may include certain forward-looking statements, beliefs or opinions, including statements with respect to
Neways posts higher turnover and results in 2016
 PRESS RELEASE Annual results Neways posts higher turnover and results in 2016 Son (the Netherlands) 3 March 2016 Neways Electronics International N.V. (Euronext: NEWAY) ( Neways or the Company ), today
Cembrit Group Q Unaudited interim report
 Cembrit Group Q4 2017 Unaudited interim report 2017 main events COMMENTARY Strong demand across both markets and product categories resulted in revenue growth of 7.9% YoY 2017 EBITDA showed solid underlying
AUSTRALIA INTERMEDIATED (CGU) INVESTOR BRIEFING
 INVESTOR BRIEFING") 9 March 2012 ABN 60 090 739 923 AUSTRALIA INTERMEDIATED (CGU) INVESTOR BRIEFING Mike Wilkins Managing Director and Chief Executive Officer Peter Harmer Chief Executive Officer Australia Intermediated (CGU)
9 March 2012 ABN 60 090 739 923 AUSTRALIA INTERMEDIATED (CGU) INVESTOR BRIEFING Mike Wilkins Managing Director and Chief Executive Officer Peter Harmer Chief Executive Officer Australia Intermediated (CGU)
first quarter results 2010
 first quarter results 2010 back to growth in March Robert-Jan van de Kraats, CFO Randstad Holding nv April 28, 2010 disclaimer Certain statements in this document comprise forecasts on Randstad Holding
FY12 Results 22 May 2012
 FY12 Results 22 May 2012 DISCLAIMER --- Important Notice This presentation has been prepared by Thorn Group Limited (Thorn). This presentation is not a financial product or investment advice or recommendation,
Royal BAM Group nv Half-year results Analysts meeting Amsterdam, 23 August 2012
 Royal BAM Group nv Half-year results 2012 Analysts meeting Amsterdam, 23 August 2012 Highlights Net loss including impairments for H1 2012: 251 million Results at Construction and M&E services and Civil
Fitter for the Future Strategic Update
 Fitter for the Future Strategic Update 2017-21 Chairman s remarks Global strategic overview Significant market opportunity Basarab Overpass in Bucharest, Romania Naples underground (Toledo Station), Italy
Vita Group (VTG)! Results Presentation!
! Results Presentation!") Vita Group (VTG) Results Presentation First half FY14 Group highlights Sustained trend of strong profit, dividend growth Underlying EBITDA 1 +18%, underlying NPAT 2 +56%, dividend +66% Areas of strategic
Vita Group (VTG) Results Presentation First half FY14 Group highlights Sustained trend of strong profit, dividend growth Underlying EBITDA 1 +18%, underlying NPAT 2 +56%, dividend +66% Areas of strategic
Results FY 2017 Schaeffler AG. Conference Call March 7, 2018 Munich
 Results FY 2017 Schaeffler AG Conference Call Munich Disclaimer This presentation contains forward-looking statements. The words "anticipate", "assume", "believe", "estimate", "expect", "intend", "may",
Investor Relations ABN AMRO Q BofAML Annual Financials CEO Conference 25 September 2018
 Investor Relations ABN AMRO Q2 2018 BofAML Annual Financials CEO Conference 25 September 2018 ABN AMRO has shown strong capital generation since IPO Profit development Dividends per share and pay-out 1)
Zumtobel Group AG H1 2015/16 results. December 9, 2015
 Zumtobel Group AG H1 2015/16 results December 9, 2015 1 9 December 2015 H1 2015/16 results Solid Q2 after a weak start into the financial year Financials H1 2015/16 at a glance Group revenues increase
H1 16 interim results. 22 September 2015
 H1 16 interim results 22 September 2015 Important notice 2 This presentation may include certain forward-looking statements, beliefs or opinions, including statements with respect to the Company s business,
3 rd quarter back to growth in September. Robert Jan van de Kraats, CFO. Randstad Holding nv October 31, 2013
 3 rd quarter 2013 back to growth in September Robert Jan van de Kraats, CFO Randstad Holding nv disclaimer & definitions Certain statements in this document concern prognoses about the future financial
ANNOUNCEMENT OF PRELIMINARY RESULTS
 The leading high service distributor to engineers worldwide ANNOUNCEMENT OF PRELIMINARY RESULTS YEAR ENDED 31 MARCH 2009 29 May 2009 Agenda Overview and current trading Ian Mason Financial performance
Financial results briefing Q3/2015
 Financial results briefing Q3/2015 Jyri Luomakoski President and CEO Uponor Corporation Uponor, Inc. factory, Apple Valley, Minnesota, USA Q3/2015 market overview Nordics Construction activity in Sweden
Half year results TKH Group NV
 Half year results 2014 TKH Group NV 1 Half year results 2014 19-08-2014 Content 1 About TKH Group 2 Developments 1 st half year 2014 3 Notes to the results 1 st half year 2014 4 Strategic developments,
Results Amsterdam, 20 February Annual results February 2019
 Results 2018 Amsterdam, BAM delivers 2018 outlook with adjusted pre-tax result of 153.2 million Adjusted pre-tax margin of 2.1% despite the impact of sea lock IJmuiden project (OpenIJ) Construction and
Royal BAM Group nv First quarter results Investor presentation Bunnik, 19 May 2011
 Royal BAM Group nv First quarter results 2011 Investor presentation Bunnik, 19 May 2011 Nico de Vries, Chairman of the Executive Board of Royal BAM Group BAM s results for the first quarter were stable
STRATEGICALLY POSITIONED FOR GROWTH.
 STRATEGICALLY POSITIONED FOR GROWTH. ANNUAL REPORT 2017 SHOP APOTHEKE EUROPE N.V. DR. ULRICH WANDEL, CFO 12 MARCH 2018 DISCLAIMER. 2 THIS PRESENTATION AND ITS CONTENTS ARE NOT FOR RELEASE, PUBLICATION
Neopost Interim Results. October 2005
 Neopost 2005 Interim Results October 2005 3 October 2005 Disclaimer Safe Harbour Statement This presentation contains forward-looking statements (made pursuant to the safe harbour provisions of the Private
FULL YEAR RESULTS AND DEVELOPMENTS March 2018
 FULL YEAR RESULTS AND DEVELOPMENTS 2017 6 March 2018 CONTENTS 1 Highlights & progress strategy 2017 2 Developments solutions segments 3 Financial performance 4 Outlook 5 Questions & answers 2 FY Results
WAVIN GROUP REPORTS STRONG INCREASE IN REVENUE AND OPERATING RESULTS IN FIRST HALF YEAR 2007
 WAVIN GROUP REPORTS STRONG INCREASE IN REVENUE AND OPERATING RESULTS IN FIRST HALF YEAR 2007 Zwolle, 6 September 2007 Wavin N.V., leading supplier of plastic pipe systems and solutions in Europe, today
Cover Update PORR AG FY Q Investor Presentation. Investor Presentation. August 2016
 Cover Update PORR AG FY Q3 2016 1H Intelligent NEW 2016 BUILDING of PORR Building... AG Investor Presentation April November 2017 2016 Investor Presentation August 2016 Disclaimer This presentation was
PRESS CONFERENCE / ANALYST MEETING: TODAY, WEDNESDAY 26 AUGUST 2015 START: LOCATION: Hotel Casa 400 (Eerste Ringdijk 4, AMSTERDAM)
") Press Release 26 August 2015 Recovery turnover and results Neways in first half 2015 PRESS CONFERENCE / ANALYST MEETING: TODAY, WEDNESDAY 26 AUGUST 2015 START: 10.30 - LOCATION: Hotel Casa 400 (Eerste
Press Release 26 August 2015 Recovery turnover and results Neways in first half 2015 PRESS CONFERENCE / ANALYST MEETING: TODAY, WEDNESDAY 26 AUGUST 2015 START: 10.30 - LOCATION: Hotel Casa 400 (Eerste
PORR s VIEW: Vienna Main Railway Station. Q of PORR AG SOLID BASE FOR GROWTH Investor Presentation
 PORR s VIEW: Vienna Main Railway Station Q3 2015 of PORR AG SOLID BASE FOR GROWTH Investor Presentation Disclaimer This presentation was prepared by PORR AG (the "Company") solely for use at investors
Zumtobel Group AG Q1 2017/ September 2017
 Zumtobel Group AG Q1 2017/18 05 September 2017 Despite stalling growth momentum Group adj. EBIT only slightly below prior year Financials Q1 FY 2017/18 at a glance Group revenues fx-adjusted 0.7% below
Sustainability, a business opportunity
 ABN AMRO Investor Day Sustainability, a business opportunity Commercial Banking Daphne de Kluis 16 November 2018 We are committed to Pursuing sustainability as a business opportunity Service the Dutch
Analyst Presentation Q May 8, 2014 Dr Matthias Zieschang, CFO
 Analyst Presentation Q1 2014 May 8, 2014 Dr Matthias Zieschang, CFO Slide 2 Disclaimer This document has been prepared by Fraport solely for use in this presentation. The information contained in this
Half Year Results. for the six months ended 30 November January Chairman Chris Stone CEO Adam Palser CFO Brian Tenner
 Half Year Results for the six months ended 30 November 2017 16 January 2018 Chairman Chris Stone CEO Adam Palser CFO Brian Tenner Agenda Overview and strategy update Financial highlights Financial performance
Zumtobel Group AG. Q1 2014/15 results. September 2, Q1 2014/15 results
 Zumtobel Group AG Q1 2014/15 results September 2, 2014 1 02.09.2014 Restructuring measures on track, ongoing stabilisation of operating environment Financials Q1 2014/15 at a glance Group revenues increase
IN EUR CHANGE. Net result 15.1 million 14.9 million 1% Operating income million million -1%
 Date: 8th March 2018 Contact: Remko Dieker Secretary to the Managing Board T: +31 20 557 51 80 I: www.kasbank.com Net operational result of EUR 16.5 million (FY2016: EUR 8.2 million). Total net result
Financial Ambition 2017 ING Investor Day Patrick Flynn CFO, Member Executive Board ING Group. Amsterdam - 31 March 2014
 Financial Ambition 2017 ING Investor Day Patrick Flynn CFO, Member Executive Board ING Group Amsterdam - 31 March 2014 www.ing.com We entered the final phase to become a pure Bank 2009-2011 2012-2013 2014-2017
2006: higher results. January 2007
 2006: higher results 1 January 2007 On track Net result H1 2006: 16 mln (+ 23%) Profit before tax H1 2006: 24 mln (+ 26%) Earlier forecast 2006: net result + 20% ( 24 mln compared to 20 mln in 2005) New
Fiscal year 2011 off to a strong start
 Fiscal year 2011 off to a strong start Peter Löscher, President and CEO Joe Kaeser, CFO Q1 FY 11 Analyst call January 25, 2011 Copyright Siemens AG 2011. All rights reserved. Safe Harbour Statement This
Results Amsterdam, 21 February 2018
 Results 2017 Amsterdam, 21 February 2018 BAM reports full year adjusted result before tax of 63.3 million Full year adjusted result margin at 1%; excluding previously announced loss at sea lock IJmuiden
Full-Year 2018 Result: Improved operational EBIT across all SBUs. Susan Duinhoven, President & CEO Markus Holm, CFO & COO
 : Improved operational EBIT across all SBUs Susan Duinhoven, President & CEO Markus Holm, CFO & COO Highlights of FY 2018 Net sales Operational EBIT Operational EBIT margin Operational EPS Free cash flow
3Q 2018 Fornebu, October 24, 2018 Luis Araujo and Svein Stoknes
 3Q 2018 Fornebu, October 24, 2018 Luis Araujo and Svein Stoknes Agenda 3Q 2018 Answers Questions Introduction Luis Araujo Chief Executive Officer Financials Svein Stoknes Chief Financial Officer Q&A Session
Zumtobel Group AG H1 2016/ December 2016
 Zumtobel Group AG H1 2016/2017 6 December 2016 Nr. 2 Substantial increase in profitability despite lower revenues Financials H1 FY 2016/17 at a glance Fx-adjusted decline of 1.5% in Group revenues with
Q4 Presentation February, 2012
 Q4 Presentation 2011 15 February, 2012 Disclaimer This presentation has been prepared by Duni AB (the Company ) solely for use at this investor presentation and is furnished to you solely for your information
AUDITED RESULTS FOR THE YEAR ENDED 31 DECEMBER 2016
 AUDITED RESULTS FOR THE YEAR ENDED 31 DECEMBER 2016 AGENDA 2 1 Opening remarks / market update 2 Financial results 3 Operational review 4 Strategy update 5 Outlook 1 2 3 4 5 OPENING REMARKS / MARKET UPDATE
Fourth Quarter and Annual Results 2015
 Fourth Quarter and Annual Results 2015 Highlights Rising customer satisfaction supporting continued strong base growth in Consumer in Q4 2015 and FY 2015 +40k broadband net adds (FY 2015: +139k) and +69k
Q1 Q Q3 Q EUR million Jan-Mar 2018 Jan-Mar 2017 Change, % EUR million Jan-Dec 2017
 Stockholm, Sweden, 4 May Eltel Group Interim report January March January March Group net sales decreased 10.5% to EUR 266.6 million (297.8), mainly as a result of divestments and on-going discontinuation
PRESENTATION TO FUND MANAGERS & FINANCIAL ANALYSTS. 25 November 2013
 1 PRESENTATION TO FUND MANAGERS & FINANCIAL ANALYSTS Business update 25 November 2013 2 Agenda 01 02 03 04 02 03 04 SECTION 1 SECTION 2 SECTION 3 SECTION 4 Focusing on growth Group Five business model
Increase in turnover and result in all segments
 Press release TKH Group N.V. (TKH) Results first half year 2018 Increase in turnover and result in all segments Highlights second quarter 2018 Turnover growth of 13.5% to 414.7 million organic growth +13.0%.
NKT I IR presentation I Annual Report February 2014 I 1 NKT. Annual Report Webcast, 28 February 2014 at 9:00 am CET
 28 February 2014 I 1 NKT Annual Report 2013 Webcast, 28 February 2014 at 9:00 am CET 28 February 2014 I 2 Forward looking statements This presentation and related comments contain forward-looking statements.
K E N D R I O N N. V. P R E S S R E L E A S E. 1 9 F e b r u a r y
 K E N D R I O N N. V. P R E S S R E L E A S E 1 9 F e b r u a r y 2 0 1 9 KENDRION MAINTAINS PROFITABILITY FOR THE YEAR DESPITE DIFFICULT AUTOMOTIVE MARKET - Full-year revenue declined by 3% to EUR 448.6
Statkraft Investor Update. March 2014
 Statkraft Investor Update March 2014 Disclaimer This presentation has been prepared by, and the information contained herein (unless otherwise indicated) has been provided by Statkraft AS (the "Company").
Puma Energy : Fourth quarter & full year 2018 results Thursday 28 th March Puma Energy
 Puma Energy : Fourth quarter & full year 2018 results Thursday 28 th March 2019 Puma Energy The opportunity for Puma Energy Unique footprint, great people & strong business fundamentals in high potential
INVESTOR PRESENTATION ENEXIS HOLDING N.V.
 INVESTOR PRESENTATION ENEXIS HOLDING N.V. ANNUAL RESULTS 2017 MAARTEN BLACQUIÈRE 21 FEBRUARY 2018 KEY HIGHLIGHTS A leading DSO in the Netherlands Electricity grid outage time among lowest in Europe Publicly
Presentation. 13 May Results first quarter 2009
 Presentation 13 May 2009 Results first quarter 2009 Disclaimer This presentation for the first quarter 2009 is a translation of the Dutch presentation on the consolidated results for the first quarter
Foxtons Interim results presentation For the period ended 30 June 2018
 Foxtons Interim results presentation For the period ended 30 June 2018 Important information This presentation includes statements that are, or may be deemed to be, forward-looking statements. These forward-looking
13 May Shareholders meeting 2015
 13 May 2015 Shareholders meeting 2015 Achievements 2014 Koen Van Gerven CEO 2014 3 Our successful and focused strategy in action Generate continued productivity gains Continue to focus on core mail business
EVRY ASA Q PRESENTATION CEO BJÖRN IVROTH CFO HENRIK SCHIBLER
 1 EVRY ASA Q1 2018 PRESENTATION CEO BJÖRN IVROTH CFO HENRIK SCHIBLER Agenda Group highlights Business update Financial highlights Business area performance Targets and Concluding remarks Q&A 2 Group highlights
SMART STEEL. Q Results. Detlef Borghardt, CEO Dr. Matthias Heiden, CFO. August 14, 2018
 SMART STEEL Q2 218 Results Detlef Borghardt, CEO Dr. Matthias Heiden, CFO August 14, 218 Agenda Business Summary Guidance adjustment FY 218 Market update Regional trends: Status and profitability trend
Interim Report January September 2014
 Interim Report January September 2014 Johan Dennelind President & CEO Capital Markets Day summary 2018 2013 2014 2015 2016 2017 The New TeliaSonera Big changes Stabilize & shape Transform & perform Transform
Full year results presentation Year ended 31 March June 2018
 Full year results presentation Year ended 31 March 2018 7 June 2018 Disclaimer Not for publication, transmission, distribution or release, directly or indirectly, in or into any jurisdiction in which the
Analyst/Investor Presentation Q Results 20 November 2013
 Analyst/Investor Presentation Q3 2013 Results 20 November 2013 1 CONTENT 2 1 BUSINESS REVIEW Q3 2013: Johannes Nonn, CEO 2 RESULTS OF STRATEGIC REVIEW: Johannes Nonn, CEO 3 CAPITAL INCREASE AND BOD S COMPOSITION:
TomTom Q results. Harold Goddijn - CEO & Marina Wyatt - CFO 18 February 2011
 TomTom Q4 2010 results Harold Goddijn - CEO & Marina Wyatt - CFO 18 February 2011 Financial highlights Content & Services revenue grew by 16% to 98 million Automotive revenue grew by 52% to 55 million
Paragon Banking Group PLC. Financial Results for twelve months ended 30 September 2018
 Paragon Banking Group PLC Financial Results for twelve months ended 3 September 218 218 results highlights 2 Strong financial performance and further strategic progress Strong operational performance New