Heijmans Business Update ROADSHOW BOOKLET, FEBRUARY 2018, BASED ON 2017 ANNUAL RESULTS
|
|
|
- George Thomas
- 5 years ago
- Views:
Transcription


1 Heijmans Business Update ROADSHOW BOOKLET, FEBRUARY 2018, BASED ON 2017 ANNUAL RESULTS
2 2 Key figures Key figures * x 1 million H H Revenues Netherlands Underlying EBITDA Netherlands ** Result after tax Earnings per share ( in ) 0,00-4,59 0,91-5,16 Order book Netherlands Net debt Number of FTE Netherlands * Unless otherwise noted, the key figures are presented for all operations. In the consolidated income statement (see attached sheets) the results of the continued and discontinued operartions are shown separately. ** underlying EBITDA is the operating result before depreciation corrected for operating result joint ventures, write down on property assets, restructuring costs, book result on sale of subsidiaries and other extraordinary items.
3 3 Contents Company profile 4-15 Strategy Highlights 2017 annual results / Outlook Developments per sector Divestments & Financing Financial statements & Order book Annexes Resumes Executive Board 55 Property development process 56 Risk Management approach 57 Implementation new ERP platform 58 Percentage of completion method 59 Project images in this handout 60 Contact details / Disclaimer 61

4 HEIJMANS ONE Company profile 4


5 5 COMPANY PROFILE History 1923 founded by Jan Heijmans as Infra company 1945 and beyond - strong growth following WWII 1960 s - diversification towards residential building 1980 s - diversification towards property development 1993 listing on Amsterdam Stock Exchange 1993/2007 strong growth through acquisitions 2008/2009 reset strategy, start of restructuring 2013 strategy building spatial contours of tomorrow 2017 focus, discipline and excellence, divestment of foreign subsidiaries
6 6 COMPANY PROFILE Heijmans at a glance Building the spatial contours of tomorrow, where development and realization take into account people and the environment, both in projects for clients and in the company's own ecological footprint. The activities of Heijmans in the field of Living, Working and Connecting are organised within four business areas: Property Development, Residential Building, Non-Residential, Infra. Approximately 4,500 employees work on a daily basis from these business segments in the Netherlands. More than 99% of these employees are covered by a collective labour agreement. In 1H 2017, Franki, Oevermann (to PORR) and Heijmans Belgium (to Besix) were divested to strengthen balance sheet. Following the divestment programme, geographic focus is based on Dutch operations; To create added value by offering the client an integrated approach with focus on quality; Ambition to achieve leading position on quality, sustainability and profitability, resulting in: The best choice for clients; Innovation and focus on sustainability; Above-average long-term yield for shareholders; Being attractive and inspiring to employees.
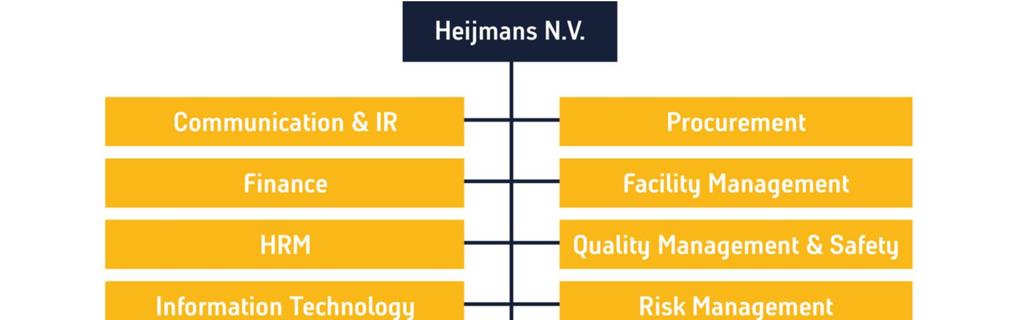
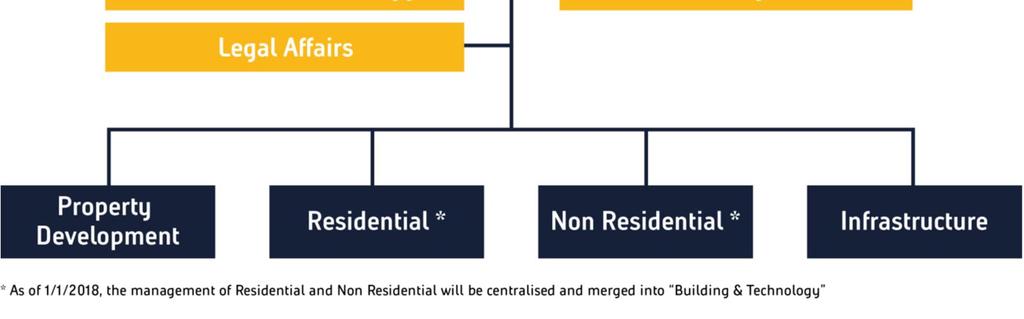
7 Organisation Chart 7

8 FENIX LOFTS - ROTTERDAM
 residential properties. It conducts its activities from four different offices under central management.")
9 9 COMPANY PROFILE Living: Property Development Property Development focuses on area development of both large and smaller-scale projects in urban and out-of-town areas. It fulfills the role of both initiator, developer and seller of (mainly) residential properties. It conducts its activities from four different offices under central management. In-depth knowledge of area development is bundled in one area development department, which manages the large accounts. This means we can benefit Katendrecht Rotterdam Kanaleneiland - Utrecht from both new-build contracts and (inner-city) transformation assignments.


10 One concept, Various applications HEIJMANS HUISMERK


11 11 COMPANY PROFILE Living: Residential Residential Building operates from three regional offices under central management. Its prime activity is new-build, but it also includes the restoration, redevelopment and renovation of existing housing, and, at an increasing level, maintenance and services. Being both Property Development and Residential Building experts, clients can be offered outstanding conceptual and construction skills. This enables us to realise complex city Wijnhavenkwartier Voetregel invoegen via The menu Hague Beeld > Koptekst en voettekst HAGA The Hague centre transformations, as well as new serial development projects.


12 MAINTENANCE MINISTRIES

13 13 COMPANY PROFILE Working: Non Residential Non-Residential designs, creates and maintains high-quality electro-technical and mechanical installations. It also realises large-scale and complex construction contracts in the customer and market segments of health care, government and semigovernment organisations, commercial property, the high-tech clean industry (such as laboratories) and data centres. Our unique quality is our integrated approach to construction and installation technology. Furthermore, our contracts that include Voetregel National Military invoegen Museum via menu Soesterberg Beeld > Koptekst en voettekst Hart van Zuid PPP - Rotterdam long-term management, maintenance and service are increasing.


14 BEATRIX LOCK - NIEUWEGEIN

15 15 COMPANY PROFILE Connecting: Infrastructure Infra focuses on the construction, improvement and maintenance of the Dutch road infrastructure and public spaces, including related installations and on-site objects. This includes roads, viaducts, tunnels, locks, water treatment plants and work related to cables, pipelines and energy supply. It also involves technical work to make roads and public spaces safer, such as lighting, camera and referral systems. The in-depth and varied engineering skills and execution capabilities enable an integrated approach to infra projects in which design, realisation, WinTrack - Tennet management and maintenance connect seamlessly.
16 Strategy : Focus, discipline, excellence 16 Transformation to purely Dutch company completed Focus on segments Living, Working and Connecting with approx. 1.5 billion in revenues; Sustainable recovery of company and its profitability, a.o. through: Derisking Infra business / large and complex projects in partnerships; Clear focus on strengthening tender process and project control; Strict margin over volume approach with selective acquisition based on core competencies; Bringing cost structure in line with changing scope and strategy Heijmans Nederland; Optimising cash management: from acquisition until completion, resulting in debt reduction and a structural improvement of financial leverage; Expanding role as director, long-term relationships via services, maintenance and (asset) management; Targeted development / innovation, close to the business and together with customers; Internal programmes focused on culture, core values, safety.
17 17 Strategy towards 2023 Setting our sights on the future making Heijmans future-proof: development of a strategic agenda towards 2023 Core company in order remains priority: following up on Focus, Discipline, Excellence strategy as the foundation of the company process management, quality of the organisation, safety, reduction of failure costs: improving continuously Focused development in the field of digitisation, smart solutions and innovative production technology: making our operations smarter Commitment to making the built environment more sustainable, integrated approach of area development, with focus on energy, materials and available space: sustainability

18 SPAARNDAMMERBUURT - AMSTERDAM
19 Strategy Property Development & Residential 19 Long term goal Residential: stable EBIT- Margin of 3-4% Long term goal Property Development: stable EBIT- Margin of 6-8% Growth from solid fundamentals, in margin and volume Accelerating property developments where land is owned to further realise debt reduction Combination: suburban areas and inner-city developments new-build and transformation/renovation Growth in integrated area development, in which we can differentiate by adding new positions in a creative and inventive manner with high added value Sales of own residential labels (Huismerk, Wenswonen and Heijmans ONE) with centralised procurement Integrated approach urban, often piled construction with Non-Residential and civil engineering expertise. NB. Following this ambition, as of 1/1/2018 Residential and Non Residential will be brought under central management and merged into Building & Technology


20 BESENSE PILOT AEGON HEAD OFFICE
21 21 Strategy Non-Residential Long term goal: stable EBIT- Margin of 3-4% Commercial focus and selective acquisition based on core competencies Armed with its installation expertise, Non-Residential is looking to forge more multi-year client relationships through the acquisition of long-term service contracts Focus on specific market segments with high level of knowledge and added value, especially newbuild / renovation of functionalities related to the public sector, laboratories, healthcare (cure) and data centres Growing importance of concepts and process standardisation Intensifying collaboration with Property Development on the realisation of urban projects, with a specific focus on high rise (>70m) buildings BeSense example of smart and efficient maintenance


22 A9 GAASPERDAMMERWEG

23 Public spending relatively stable, also in crisis years.but focus areas can shift from year to year 23 Strategy Infra Long term goal: stable EBIT- Margin of 3-4% Strategy redefined to improve profitability and to derisk: Strong progress on ringfencing / completing loss-making projects acquired in Changing leadership culture and implementing effective management structure Improvement risk control: project control, risk management, contract management New management role: Chief Risk Officer Sharpened commercial focus on line infrastructure, selective in water & energy More emphasis on regional projects, maintenance & asset management, specialties Realisation cost reduction to become more competitive and efficient Large projects max. 10% of annual infra revenues, with strong partners based on balanced risk distribution

24 24 COMPANY PROFILE Dutch market Year on year turnover is increasing again after difficult period. Growth strongly driven by booming housing market Pressure on procurement & availability of subcontractors Heijmans Top 5 player in a relatively fragmented market Public spending relatively stable with prominent role for centralised Rijkswaterstaat and Rijksvastgoedbedrijf Increasing demand for design & build (incl maintenance) solutions Therewith, more focus on design, engineering & procurement Top 20 Dutch construction companies (excl foreign companies and incl dredging companies) Specialised construction Infrastructure Residential / Non Residential Total Source: CBS, adjusted by Rabobank Real Estate (2017) Source: Cobouw, based on 2015 turnover
25 Living (Residential and Property Development) 25 STRATEGY Competitive strengths Heijmans multidisciplinary integrated approach is a major differentiator in the market. Through its centralised business model there is a high level of standardization of processes and procedures, including 3D BIM, SAP system, and procurement. With the appointment of a Chief Risk Officer in the business segments, risk management is prioritised throughout all stages of projects, from acquisition until completion. Development of urban and rural areas in both small and large-scale projects Combining creativity and customer focus with strength on realization Focus on complex renovations and transformations Standardization of concepts (e.g. Huismerk Huismerk, Heijmans Wenswonen) and innovative solutions (e.g. Heijmans ONE) Working (Non-Residential) Combining construction with technical services in integrated projects throughout the entire lifecycle Niche position in healthcare, higher education, hightech clean, data centres, government with focus on long-term relationships Connecting (Infrastructure) Top player in our market with proposition including asset / traffic management and technical services Strong capabilities and track record in larger and integrated projects Added value driven (focus on lean asset base and asphalt production)


26 NEW AMSTERDAM COURT HOUSE
27 Jul mio rights issue Nov-2009 disposal Heitkamp Rail and NSE 2010 disposal of non-core Belgium activities 2011 restructuring Oevermann Apr-2012 disposal of Telecom activities Burgers Ergon Dec FTE reduction Residential Dec-2012 Introduction of Improve The Core principles Aug-2013 Sub-10 share issue Dec FTE reductions Non-res., Oevermann, Civil. Feb-2016 Extension Credit Facility Feb-2017 Extension Credit Facility Jan-2018 Appointment of CRO, and merge of Residential and Non Residential Oct-2009 reverse 10-1 stock split Dec FTE reduction Dec-2010 Disposal of Leadbitter UK 2012 restructuring -Non-Residential Jun-2012 disposal of Prefab activities Dec-2012 Start Integral Working capital Management Fit for cash Jun-2013 PPP partnership 3i (equity inv.) Dec-2013 Acquisition Brinck Group May-2015 Sub-10 share issue to repurchase CumPrefs July-2016 Strategy Heijmans redefined Focus, Discipline, Excellence Jan-Apr 2017 Disposal of Franki, Heijmans Belgium and Oevermann STRATEGY Restructuring provides potential Since 2009, Heijmans has implemented a transformational strategic restructuring: Focus on core activities in the Netherlands Divestment of all foreign operations Reduction in strategic land bank positions Streamline organisation with centralisation of activities Improve contract-, risk- and project management through Improve the core and Focus, Discipline, and Excellence program 27


28 VAN GOGH ROOSEGAARDE BICYCLE PATH COMPOSITE BRIDGE HYDROFIT KOUSRELINING Kousrelining (renovation of waterpipes) BIKESCOUT SOLAR NOISE BARRIER RECOFLEX ASPHALT
29 29 STRATEGY Focus on innovation Investing in smart technological concepts / sustainable solutions within business segments: Creating competitive advantage towards clients; Improving future margin potential because of increased added value and focus on marketability; Cooperation with SPARK (network for creativity and knowledge); Being an attractive and interesting employer where new initiatives can and will be rewarded. In cooperation with clients focussed on marketability Examples of innovations already sold / ready for market launch: The Heijmans ONE portable house > 135 houses now sold; Hydrofit kousrelining with DSM > several projects realised; BikeScout: warning system to improve safety of cyclists; Smart living concept : standardised home control in all family homes; BeSense: enables smart and efficient building management by using sensor technology to generate data on occupation, usage and comfort. Examples of innovations in pilot phase Recoflex Self healing asphalt concept; 3D printing; Energy generating noise barrier ( Solar noise barrier ).

30 NATIONAAL MILITAIR MUSEUM - SOESTERBERG Heijmans annual results 2017: Sound basis for continued recovery Ton Hillen, chairman executive board Heijmans N.V. February 23,
31 31 Highlights annual results In 2017, Heijmans was transformed into a purely Dutch company with a focus on its core competencies in property development, residential building, non-residential and infrastructure Underlying ebitda Netherlands 30 mln (2016: 73 mln negative) Total number of homes sold 2,192 (2016: 1,962), of which 1,394 were sold to private buyers (2016: 1,019) Continuing strong growth in revenue and result Property Development, stable development Residential Building Infra from severely loss-making to profitable operation, lagging performance Non-Residential Net profit (incl. foreign operations) to 20 million in 2017 (2016: net loss of 110 mln) Solvency ratio 27%, net cash position year-end 14 mln (2016: net debt 100 mln)
32 32 Progress high-risk projects Completing / Ringfencing problem projects acquired in is progressing; Total impact 2016 nearly 90 mln: Infra approx. 75 mln / Non-Residential approx. 15 mln; N23: work on schedule, opening December 2018, official delivery March 2019 Drachtsterweg: opened for traffic (delivery documentation ready 1 April 2018) RIVM: decision to transfer Heijmans interest in consortium to Strukton: one-off loss 3,5 mln Wilhelmina lock project: pending definitive verdict and agreement on cost allocation interim ruling of the Arbitration board for the building industry indicates that neither the Province of Noord-Holland nor Heijmans could have foreseen the cause of the problem with the lock's design Turnover mix is improving, as problem projects are phasing out, and new order intake is improving given margin over volume approach.
33 33 Outlook 2017 transitional year, repositioning of the Dutch core business: Solid progress on all fronts: profit recovery, debt reduction, derisking Reduction impact of specific high-risk projects progressing well, withdrawal from RIVM-project is major step Order book year-end 2017 at similar level as year-end 2016: 1.9 billion Order book well filled and of good quality Key goal for 2018 remains continued recovery in profitability
")
34 HET FUNEN - AMSTERDAM Developments per sector (based on 2017 annual results) 34
35 Property development: excellent performance, driver for growth 35 Property development x 1 million H H Revenues Underlying EBITDA Underlying EBITDA margin 5,9% 4,3% 5,1% 4,5% Order book Strong growth revenue and performance continues, good prospects for 2018: revenue +18%, underlying ebitda +35%, number of homes sold +12% average sales price (incl. transaction costs, excl. VAT) of homes sold to private buyers +24% orderbook + 35% Combination of inner-city area development and development of suburban areas Slight decrease of investment commitments
 36 Level of tension Population Households 2015 2015-2019")


36 Level of tension High Medium Low Geographical spread land bank positions FY 2016 (in mln) 36 Level of tension Population Households High ,5% 446 6,0% ,4% 322 9,4% Medium ,6% 262 4,3% ,4% 206 7,6% Low Voetregel invoegen via menu 23 0,7% Beeld > Koptekst 8 0,2% en voettekst ,0% 64 4,2% Total ,6% 716 4,2% ,6% 592 7,7% Source Primos (2016)

 have resulted in a strong demand and increasing house prices again: at least 800,000 additional houses, to be realised before 2030; Specific")
37 # permits rising again. Property Development: Dutch market Source: CBS, adjusted by Rabobank Real Estate (2017) but hard to meet strong supply Traditionally high % of social housing. 60% 30% Total Other private sectór Private sector Social housing Fundamentals have improved considerably since 2014 after 7 years of declining market: Historically low interest rates, increased consumer confidence and government policies (incl. aanpak scheefwonen, capping tax deductibility interest) have resulted in a strong demand and increasing house prices again: at least 800,000 additional houses, to be realised before 2030; Specific growth areas: Innercity development / transformation (mainly Randstad) and affordable houses for 1-person households / starters. Main cities only able to fill in appr. half of the additional capacity, therewith also growth expected outside cities where prices are lower. Challenge to meet high demand as capacity in supply chain decreased during crisis years: Government: delays in permit procedures and higher building aesthetics requirements; Construction companies: prices going up due to increased demand for people and materials. Several factors however still require strict risk management procedures: Affordability for starters / young families, especially in cities; Monetary policy uncertain, potential impact on interest rates; Rental system still protective. Households forecast (left axis) 37 Houses inventory 2016 forecast (left axis) Social housing Private rental Private ownership 10%.but shifting given high demand private sector and discouraging governmental policy Houses shortage (right axis) Source: Rabobank Real Estate (2017)


38 LEIDSCHE RIJN CENTRUM - UTRECHT
39 39 Residential: controlled development Residential x 1 million H H Revenues Underlying EBITDA Underlying EBITDA margin 1,9% 1,4% 1,7% 1,4% Order book Revenue and underlying ebitda at comparable level Strong turnaround in the market, pressure on availability of subcontractors and procurement prices Focus on controlled growth and quality, execution partner for Property Developent projects, combined with own acquisition Focus on standardised products: Heijmans Huismerk and Heijmans Wenswonen (500 in 2017, expected in 2018), Heijmans ONE (135 since 2016) Growing demand renovation and sustainability, revenue mln


40 TH MAINTENANCE CONTRACT PGGM
41 41 Non-residential: lagging results Non-residential x 1 million H H Revenues Underlying EBITDA Underlying EBITDA margin -4,1% -0,8% -2,5% -4,4% Order book Revenue further declined in 2017, underlying ebitda negative Selective acquisition policy for new-build projects, Selective acquisition of new-build projects, insufficient coverage overhead Withdrawal RIVM project No further downscaling: new business opportunities expected in near future Maintenance activities (Services): decent performance, revenue of 171 mln Data-driven concepts: BeSense implementation at ten clients, several advanced leads


42 A1 APELDOORN - BEEKBERGEN
43 43 Infra: strong recovery Infra x 1 million H H Revenues Underlying EBITDA Underlying EBITDA margin 4,0% 0,3% 2,4% -11,8% Order book Revenue increased, strong improvement underlying ebitda Measures taken have proved to be effective: agreement on a numer of high-risk projects, tightened focus, organisational improvements, appointment CRO, reduction of cost structure, improved balance in types of projects N23: controlled realisation and good progress towards opening in 2018 A9: availability planned for end June 2018 Wilhelmina lock Zaandam: pending final verdict

44 A1/A27 PPP Cash flow and financing 44
45 45 Recovery according to plan Divestments foreign operations resulting in net debt impact of 97 mln, total net debt improved with 114 mln to 14 mln net cash Improved capital ratios: balance sheet downsized, capital base strengthened, improved debt position Steady working capital development and good progress in de-risking Solvency year-end 2017: 27% Early reduction of credit facility to 156 mln (FY 2016: 256 mln), 8 months ahead of schedule on track towards further reduction to 122 mln as per Throughout the year Heijmans operated well within the parameters of the agreed covenants Regular covenants will once again be in effect from 2018 onwards: Heijmans would already have been compliant with these covenants in Q4
46 46 APPENDIX In addition, several project financings in place in PPP and Property Development, both recourse and non recourse, as well as several operational and financial leases Financing in place The most significant financing arrangements include: mln in syndicated loan facility (see right column) - 45 mln in cumulative preference shares with a coupon of 7.9% and a perpetual tenor mln in guarantee facilities, of which roughly 2/3 is used Relevant details syndicated loan facility: Commitment to be reduced gradually to 122 mln per 30 June Latest reduction in October 17, 8 months ahead of schedule; Syndicate of Rabobank, ING, ABN Amro and KBC; EBITDA floor and Solvency floor applicable for 2017: minimum EBITDA to be tested at 20 million in Q (Q2: 0; Q3: 5); solvency ratio to be tested at 20% in Q (Q2: 16%; Q3: 18%);
47 Financial covenants Per 2018 testing based on following covenants: Interest Cover, tested quarterly, minimum 4; Leverage Ratio, tested semi-annually, max. 3; As of Mid 2018, average leverage ratio, tested quarterly, maximum 2.5. Covenants would already have been met if they had to be tested at Q Amounts x 1 million 2017 FY 2016 FY Net debt -13,7 100,1 Adjustments: Net debt Joint Ventures 89,2 84,7 Net debt non recourse project finance -95,0-92,6 Cumulative preference shares B -45,1-45,1 Other 5,3 2,0 Net debt covenants (A) -59,3 49,0 Reported EBITDA 59,0-75,4 Extraordinary items -14,2 28,7 EBITDA JV's -14,1-0,2 Underlying EBITDA 30,8-46,9 Adjustments: Capitalised interest 1,5 1,8 EBITDA non recourse projects -5,2-3,6 Other -1,3-0,6 EBITDA covenants (B) - Interest Cover 25,8-49,3 EBITDA from disposed subsidiaries 0,9 0,0 EBITDA covenants (C) - Leverage Ratio 24,9-49,3 Net interest 11,3 9,6 Adjustments: Net interest joint ventures 1,1 2,1 Net interest non recourse project financings -2,8-3,0 Interest cumulative preference shares B -3,6-3,6 Other -2,7-0,8 Net interest covenants (D) 3,3 4,3 Average net debt covenants (E) 46,8 111,3 Leverage ratio (A/C) <3-2,4-1,0 Interest cover ratio (B/D) >4 7,7-11,1 Average Leverage ratio (C/E) <2,5 1,9-2,3 47

48 ELASTOCOAST - WADDENZEEDIJK Financial statements 48
49 FINANCIAL STATEMENTS Balance sheet (x 1 million) 31 December December 2016 Non-current assets Property, plant and equipment Intangible assets Share in joint ventures and associates Other fixed assets Current assets Strategic land portfolio Other inventory Construction work in progress Trade and other receivables Cash and cash equivalents Assets held for sale Total assets Equity Non-current liabilities Cumulative financing preference shares Interest-bearing loans 9 13 Provisions and non-interest bearing debts Current liabilities Interest-bearing loans and other current financing Trade and other payables Construction work in progress Provisions Liabilities held for sale Total liabilities


50 RIVM / CBG - UTRECHT Asset Management lock of Terneuzen
51 x 1 million H H Revenues Netherlands FINANCIAL STATEMENTS Property development Residential Non-residential Construction & Technology P&L Infra Corporate/other Underlying EBITDA Netherlands Correction operating result joint ventures Write down on property assets Restructuring costs Soil remediation EBITDA Netherlands Depreciation/amortisation Netherlands Operating result Netherlands Operating result discontinued operations incl. bookresult Operating result Financial results Share of profit of associates and joint ventures Result before tax Income tax Result after tax
52 indirect method (x 1 million) 2017 Operating result - including discontinued operations FINANCIAL STATEMENTS Cash flow Loss on sale of assets held for sale 0 6 Gain on sale of subsidiaries Gain on sale of non-current assets and property investments -1-1 Depreciation and impairment of property, plant and equipment Amortisation of intangible assets 2 2 Adjustment of valuation of property and land bank excluding joint ventures 5 19 Change of net work in progress 1 29 Changes in other working capital and non-current provisions Operating result after adjustments Interest paid Interest received 2 5 Income tax paid -2-4 Cash flow from operating activities Investment in property, plant and equipment Proceeds from sale of property, plant and equipment 1 7 Proceeds from sale of subsidiaries 97 0 Loans granted to joint ventures and associates Loans repaid by joint ventures -2-4 Cash flow from investment activities Interest-bearing loans drawn down 0 67 Interest-bearing loans repaid Cash flow from financing activities Net cash flow in the period Cash and cash equivalents at 1 January Cash and cash equivalents assets held for sale Cash and cash equivalents at 31 December 74 30


53 53 FINANCIAL STATEMENTS Order Book Order book (x 1 million) Property development Residential Non-residential Infra Eliminations Netherlands Bananenstraat Rotterdam

54 TIMMERHUIS ROTTERDAM Appendices 54

 Janssen (1967), member of the Executive Board / CFO as of 30 October 2017. He previously held financial positions at Unilever, and was recently CFO of Mediq.")
55 55 APPENDIX Board of directors Ton (A.G.J.) Hillen (1961), Member of the Executive Board as of 18 April 2012, Chairman of the Executive Board as of 1 December responsible for: General Affairs, Infrastructure, Property Development, Residential Building*, Non-Residential*, Innovation, HR / Management Development, Communication, Sustainability * Residential and Non Residential will be merged into Building & Technology as per 1/1/2018 Hans (J.G.) Janssen (1967), member of the Executive Board / CFO as of 30 October He previously held financial positions at Unilever, and was recently CFO of Mediq. responsible for: Finance, Investor Relations, ICT, Legal Affairs, Pensions, Procurement (incl Facility Management).
56 56 Property development process Process and timing unsold unsold unsold sold sold sold sold sold sold sold sold sold sold Obtaining Land position Start Property development Start sale Start building Delivery to consumer 70/80% pre-sold 1-6 years 1-2 years 3-6 months 1-2 years Revenues recognition is based upon the progress of construction of sold property
57 57 ANNEX Risk management approach Policies and corporate philosophy gradually developed and implemented as from mid 2008: Compact set-up with direct reporting to Executive management; Centralised organisation model: to act as One Company ; Centralised tender management and procurement, with direct involvement executive management; Senior management bonus system based on corporate goals; Periodic review meetings for businesses and (relevant) projects. Also in execution phase to monitor project start up and stickto-the-plan approach; Best in class project reporting providing good insight on project opportunities as well as risks, specific issues, cash flow and progress. Further improve uniformity; Uniform risk classification for all projects into three categories. Direct involvement from Executive Board in large and complex projects in all phases; Culture of openness on project performance. Issues to be escalated asap to enable effective follow-up and support; High level of attention for cash management on all levels in the organisation ( Fit for cash program); Implementation of uniform ERP landscape to improve control. Balance limitations of project size (over time) versus capacity. Partnering where required; Simplified legal structure with limited number of entities and managing directors (2017) roll out of Chief Risk Officer within business segments, with an independent role opposed to project teams
58 58 ANNEX Towards one integrated ERP platform (SAP) Objectives 1. Strengthen Control 2. Integrate Procurement 3. Improve efficiency in back office processes Key changes Integrated system / Centralized data management Data entry at source (orders, hours) Three way match, digital invoicing AP 1 project structure, also for integrated projects Successful deployed to +/- 4,400 employees; Implemented at Infra, Holding, Residential, and Non Residential); To go: Property Development (2017); Proven project approach and timelines (Initiated in 2011, Blueprint Q4 2012, start roll-out 2013). Now close to completion; Generic processes based upon SAP Best Practices (limited customization, using only industry-standard or industry-customized SAP processes & add-on tools); Invested TD: 12 mln, limited to no impact on running IT costs (phase-out old systems); Top-down roll-out with dedicated change management; 2017 and beyond: to exploit and leverage contribution to real business value (enhance performance, more uniform organization, improve operational efficiency and management information, integrating CRM, Go / No Go decisions).
59 59 IFRS % of completion method Direct costing applied, i.e. the gross margin is recognized on the basis of the percentage of completion method. In this method, 50% of the gross profit is recognized half way the project, and 100% at completion. Suppose a EUR 100 mln with 10% gross margin and a 2 year construction period. What happens if a setback of EUR 10 mln is discovered? At t = 0 (for example in the final design stage), 10 mln should be deducted from future profits. The next two years of turnover will not contribute any gross margin At t = 1, 50% of the gross profit is already recognized in the previous year. EUR 5 mln should be deducted from future profits (in year 2 no gross margin contribution) and EUR 5 mln should be recorded as loss in the P&L At t=2 (just before completion) almost all gross profit has already been recognized as profits in previous year. The setback should be recorded as financial loss in year 2
60 60 Project images in this handout Slide Project Location Segment 4 Heijmans One Replaceable Residential 6 New Amsterdam Court House PPP Amsterdam Non Residential 8 Fenix Lofts Rotterdam Katendrecht Property Development / Residential 9 Kanaleneiland Utrecht Property Development / Residential 10 Heijmans Huismerk (own label) Utrecht Residential 11 HAGA Den Haag Property Development / Residential 12 Services / maintenance Ministries 19 locations in The Hague Non-Residential (Services) 13 Hart van Zuid PPP Rotterdam Non Residential / Property Development 14 Beatrix Lock PPP Nieuwegein Infra 15 Wintrack II Tennet Northern provinces Infra 16 Schiphol Assetmanagement Amsterdam Schiphol Infra 18 Spaarndammerbuurt Amsterdam Property Development / Residential 20 BeSense Pilot Aegon The Hague Non Residential (Services) 22 A9 Gaasperdammerweg PPP Amsterdam Infra 26 New Amsterdam Court House PPP Amsterdam Non Residential 28 Overview of innovations 30 National Military Museum Soesterberg Non-residential 34 Het Funen Amsterdam Property Development / Residential 38 Leidsche Rijn Centrum Utrecht Property Development / Residential 40 Maintenance contract PGGM Zeist Non Residential (Services) 42 A1 Apeldoorn / Beekbergen Apeldoorn - Beekbergen Infra 44 A27 / A1 PPP Utrecht - Eemnes Infra 48 Elastocoast Waddenzeedijk Infra 50 Terneuzen Lock Terneuzen Infra Asset Management 53 Bananenstraat Rotterdam Property Development / Residential 54 Het Timmerhuis Rotterdam Property Development / Non-Residential
61 61 CONTACT DETAILS HEIJMANS N.V. CONTACT: PO Box 2 Guido Peters 5240 BB Rosmalen, The Netherlands Investor Relations Heijmans gpeters@heijmans.nl DISCLAIMER This presentation has been prepared by and is the responsibility of Heijmans N.V. This presentation is being supplied to you solely for your information and use. The information may not be further distributed or passed on to other people or published or reproduced in whole or in part. The information may be subject to updating, completion, revision and amendment and such information may change materially. This presentation contains certain forward-looking statements relating to the business, financial performance and results of the Heijmans N.V. and the industry in which it operates. These statements are based on Heijmans N.V.'s and its management's current plans, estimates and projections, as well as its expectations of external conditions and events. In particular the words expect, anticipate, predict, estimate, project, plan, may, should, would, will, intend, believe and similar expressions are intended to identify forward looking statements. Forward-looking statements are statements of future expectations that are based on current expectations and assumptions and involve known and unknown risks and uncertainties that could cause actual results, performance or events to differ materially from those expressed or implied in these statements. Neither Heijmans N.V. nor any of its subsidiaries undertake any obligation to publicly update or revise any forward-looking statement as a result of new information, future events or other information. No representation or warranty, express or implied, is or will be made by Heijmans N.V., its advisors or any other person as to the accuracy, completeness or fairness of the information or opinions contained in the presentation and any reliance you place on them will be at your sole risk. Without prejudice to the foregoing, neither Heijmans N.V., its associates, its advisors, nor its representatives accept any liability whatsoever for any loss howsoever arising, directly or indirectly, from the use of this presentation or its contents or otherwise arising in connection with this presentation. The presentation does not constitute or form part of, and should not be constructed as, an offer or invitation to subscribe for or purchase any securities.

62 heijmans heijmansnl
Heijmans annual results 2017
 Heijmans annual results 2017 23 FEBRUARY 2018 ZUIDASDOK, AMSTERDAM DE SCHOONE LEY, HAGA TERREIN DEN HAAG Heijmans annual results 2017: sound basis for continued recovery TON HILLEN, CEO HEIJMANS N.V. 2
Heijmans: annual results 2016, adjustment strategy and new financing agreements
 Heijmans: annual results 2016, adjustment strategy and new financing agreements 23 February 2017 Board of directors Heijmans N.V. Wijnhavenkwartier Den Haag Heijmans: annual results 2016, adjustment strategy
Heijmans interim results 2017
 Heijmans interim results 2017 16 AUGUST 2017 ZUIDASDOK, AMSTERDAM Heijmans: solid progress towards sustainable recovery TON HILLEN, CHAIRMAN EXECUTIVE BOARD HEIJMANS N.V. 2 Highlights interim results Recovery
Update 2016: preliminary annual figures, refinancing, strategy adjustment
 Update 2016: preliminary annual figures, refinancing, strategy adjustment 16 February 2017 Executive Board Heijmans N.V. Wijnhavenkwartier Den Haag Heijmans; preliminary results 2016, strategy adjustment
Annual figures February 2016 Board of Directors Heijmans N.V.
 Annual figures 2015 25 February 2016 Board of Directors Heijmans N.V. Heijmans 2015: negative result, improvement visible second half of the year Improvement result remains top priority Bert van der Els
Interim results August 19, 2015 Executive Board Heijmans N.V.
 Interim results 2015 August 19, 2015 Executive Board Heijmans N.V. Welcome The Student Hotel Transformation Parool & Trouw Building Amsterdam Heijmans benefits from recovering housing market, negative
Heijmans interim results 2018
 Heijmans interim results 2018 15 AUGUST 2018 GAASPERDAMMERTUNNEL, A9 AMSTERDAM Heijmans continues improvement in first half of 2018 TON HILLEN, CHAIRMAN EXECUTIVE BOARD HEIJMANS N.V. 2 Safety Trend number
Heijmans Business Update. September 2015, based on H interim results
 Heijmans Business Update September 2015, based on H1 2015 interim results Asset Management Schiphol Airport 2 Contents Company profile Strategy H1 2015 Interim results and outlook Developments per sector
ANNUAL RESULTS February 27, 2014 Executive Board Heijmans N.V.
 ANNUAL RESULTS 2013 February 27, 2014 Executive Board Heijmans N.V. Heijmans records modest result in 2013 despite tough year Bert van der Els- chairman Heijmans Executive Board FY 2013 Highlights Another
Heijmans: solid progress towards sustainable recovery. Key figures * x 1 million H H
 Press release Date Page 16 August 2017 1 of 21 Heijmans: solid progress towards sustainable recovery Highlights: Strong improvement in underlying EBITDA NL: 9 million (H1 2016: 9 million negative) largely
Heijmans continues improvement in first half of Key figures * x 1 million H H
 Press release Date 15 August 2018 Page 1 of 25 Heijmans continues improvement in first half of 2018 Highlights: Turnover increased to 780 million in first half of 2018 (first half 2017: 646 million). Underlying
x 1 million H H *
 Press release Datum 26 februari 2015 Pagina s 1 van 21 Heijmans full year results: poor 2 nd half year 2014, order book and housing market offer good prospects Challenging market requires continuous improvement
ABN AMRO Investor Day. Future proof CIB. Corporate & Institutional Banking Rutger van Nouhuijs 16 November 2018
 ABN AMRO Investor Day Future proof CIB Corporate & Institutional Banking Rutger van Nouhuijs 16 November 2018 Key takeaways We are committed to: Sustainable relationships with multi-product clients in
Neways posts higher turnover and results in 2016
 PRESS RELEASE Annual results Neways posts higher turnover and results in 2016 Son (the Netherlands) 3 March 2016 Neways Electronics International N.V. (Euronext: NEWAY) ( Neways or the Company ), today
Investor Presentation 30/08/2017 Page #
 Investor Presentation 30/08/2017 Page # Disclaimer This presentation was prepared by PORR AG (the "Company") solely for use at investors meetings and is provided solely for informational purposes. This
Zumtobel Group AG FY 2014/15 results
 Zumtobel Group AG FY 2014/15 results June 24, 2015 1 24 June 2015 Annual Results 2014/15 Improvement in revenues and earnings, restructuring measures on track Financials FY 2014/15 at a glance Group revenues
H1 16 interim results. 22 September 2015
 H1 16 interim results 22 September 2015 Important notice 2 This presentation may include certain forward-looking statements, beliefs or opinions, including statements with respect to the Company s business,
Royal BAM Group nv Half-year results Analysts meeting Amsterdam, 23 August 2012
 Royal BAM Group nv Half-year results 2012 Analysts meeting Amsterdam, 23 August 2012 Highlights Net loss including impairments for H1 2012: 251 million Results at Construction and M&E services and Civil
Interim Results Presentation. For the six months ended 31 December 2018
 Interim Results Presentation For the six months ended 31 December 2018 1 STEEL & TUBE IS One of New Zealand s leading providers of steel solutions, and a proud New Zealand company, with over 65 years of
Half year results TKH Group NV
 Half year results 2014 TKH Group NV 1 Half year results 2014 19-08-2014 Content 1 About TKH Group 2 Developments 1 st half year 2014 3 Notes to the results 1 st half year 2014 4 Strategic developments,
Results Amsterdam, 21 February 2018
 Results 2017 Amsterdam, 21 February 2018 BAM reports full year adjusted result before tax of 63.3 million Full year adjusted result margin at 1%; excluding previously announced loss at sea lock IJmuiden
Heijmans: moderate first half year, substantial growth order book 2014 transition year, residential market offers perspective
 Press release half year results 2014 Datum 20 augustus 2014 Pagina s 1 van 21 Heijmans: moderate first half year, substantial growth order book 2014 transition year, residential market offers perspective
For personal use only
 ACN 072 507 147 ASX & MEDIA RELEASE 25 May 2017 THORN FY17 KEY NUMBERS UP, ISSUES BEING ADDRESSED Consumer leasing and business finance company, Thorn Group Limited (ASX: TGA), has lifted revenue, EBIT
For personal use only
 Affinity Education Group (ASX:AFJ) Morgans Conference 10 October 2014 Disclaimer This presentation contains general information in summary form which is current as at 10 October 2014. It presents financial
EVRY ASA Q PRESENTATION CEO BJÖRN IVROTH CFO HENRIK SCHIBLER
 1 EVRY ASA Q1 2018 PRESENTATION CEO BJÖRN IVROTH CFO HENRIK SCHIBLER Agenda Group highlights Business update Financial highlights Business area performance Targets and Concluding remarks Q&A 2 Group highlights
Half-year figures July 2015
 Half-year figures 2015 22 July 2015 Agenda Erik van der Noordaa, CEO Ballast Nedam Highlights 3 Peter van Zwieten, CFO Ballast Nedam Finances 7 Erik van der Noordaa, CEO Ballast Nedam Public offer 25 Q&A
Transpacific FY15 Half Year Results Presentation
 Transpacific FY15 Half Year Results Presentation Robert Boucher CEO Brendan Gill CFO 20 February 2015 - Disclaimer Forward looking statements - This presentation contains certain forward-looking statements,
AUSTRALIA INTERMEDIATED (CGU) INVESTOR BRIEFING
 INVESTOR BRIEFING") 9 March 2012 ABN 60 090 739 923 AUSTRALIA INTERMEDIATED (CGU) INVESTOR BRIEFING Mike Wilkins Managing Director and Chief Executive Officer Peter Harmer Chief Executive Officer Australia Intermediated (CGU)
9 March 2012 ABN 60 090 739 923 AUSTRALIA INTERMEDIATED (CGU) INVESTOR BRIEFING Mike Wilkins Managing Director and Chief Executive Officer Peter Harmer Chief Executive Officer Australia Intermediated (CGU)
2018 half year results. Amsterdam, 23 August 2018
 2018 half year results Amsterdam, 23 August 2018 BAM reports 1H18 adjusted pre-tax result of 57.8 million and reconfirms full year outlook Construction & Property: Dutch residential property development
Statkraft Investor Update. March 2014
 Statkraft Investor Update March 2014 Disclaimer This presentation has been prepared by, and the information contained herein (unless otherwise indicated) has been provided by Statkraft AS (the "Company").
PORR s VIEW: Vienna Main Railway Station. Q of PORR AG SOLID BASE FOR GROWTH Investor Presentation
 PORR s VIEW: Vienna Main Railway Station Q3 2015 of PORR AG SOLID BASE FOR GROWTH Investor Presentation Disclaimer This presentation was prepared by PORR AG (the "Company") solely for use at investors
Cover Update PORR AG FY Q Investor Presentation. Investor Presentation. August 2016
 Cover Update PORR AG FY Q3 2016 1H Intelligent NEW 2016 BUILDING of PORR Building... AG Investor Presentation April November 2017 2016 Investor Presentation August 2016 Disclaimer This presentation was
Strategy Update 2018 Investor Presentation. 10 December 2018
 Strategy Update 2018 Investor Presentation 10 December 2018 Speakers Strategy Update Jeff Gravenhorst, Group CEO Financials Pierre-Francois Riolacci, Group CFO Q&A 2 Forward-looking statements This presentation
Forward-looking statements
 Forward-looking statements Except for the historical information contained herein, the matters discussed in this statement include forward-looking statements. In particular, all statements that express
Heijmans benefits from recovering housing market, negative result due to pressure on infra
 Press release Datum 19 augustus 2015 Pagina s 1 of 22 Heijmans benefits from recovering housing market, negative result due to pressure on infra Highlights: Number of homes sold increased to 746 in the
Results Amsterdam, 20 February Annual results February 2019
 Results 2018 Amsterdam, BAM delivers 2018 outlook with adjusted pre-tax result of 153.2 million Adjusted pre-tax margin of 2.1% despite the impact of sea lock IJmuiden project (OpenIJ) Construction and
PORR Q3 Update The next chapter. Vienna, November 2014
 PORR Q3 Update The next chapter Vienna, November 2014 Disclaimer This presentation was prepared by PORR AG (the "Company") solely for use at investors meetings and is furnished to you solely for informational
Foxtons Interim results presentation For the period ended 30 June 2018
 Foxtons Interim results presentation For the period ended 30 June 2018 Important information This presentation includes statements that are, or may be deemed to be, forward-looking statements. These forward-looking
INTERIM REPORT ORDINA N.V
 INTERIM REPORT ORDINA N.V. 2013 1 CONTENTS About Ordina 3 Statement from the Management Board 4 Key figures 5 Highlights first half 2013 6 Stépan Breedveld, Ordina CEO, on the results 6 Outlook 6 Market
Financial Ambition 2017 ING Investor Day Patrick Flynn CFO, Member Executive Board ING Group. Amsterdam - 31 March 2014
 Financial Ambition 2017 ING Investor Day Patrick Flynn CFO, Member Executive Board ING Group Amsterdam - 31 March 2014 www.ing.com We entered the final phase to become a pure Bank 2009-2011 2012-2013 2014-2017
FY FEBRUARY 2015 ANALYST PRESENTATION
 FY 27 FEBRUARY 2015 ANALYST PRESENTATION Results Forward-looking Statements This presentation contains forward-looking statements, based on currently available plans and forecasts. By their nature, forward-looking
Sustainability, a business opportunity
 ABN AMRO Investor Day Sustainability, a business opportunity Commercial Banking Daphne de Kluis 16 November 2018 We are committed to Pursuing sustainability as a business opportunity Service the Dutch
NN Group. NN Group. Delfin Rueda, CFO Bernstein conference 27 September 2018
 NN Group NN Group Delfin Rueda, CFO Bernstein conference 27 September 2018 Leading Dutch insurer with strong businesses in European insurance, asset management and Japan Some facts and figures History
FY 2015 Results Presentation. 19 January 2016
 FY 2015 Results Presentation 19 January 2016 Disclaimer THIS PRESENTATION IS NOT AN OFFER OR SOLICITATION OF AN OFFER TO BUY OR SELL SECURITIES IN THE UNITED STATES OF AMERICA OR IN ANY OTHER JURISDICTION.
For personal use only
 FY16 FULL YEAR RESULTS REVIEW Agenda GROUP RESULTS OVERVIEW BUSINESS UNIT REVIEW OUTLOOK Eastlands Shopping Centre BSA completed the mechanical services upgrade and extension to one 29/08/2016 BSA Limited
Results Presentation Q
 Results Presentation Q1-3 2018 Disclaimer Cautionary note regarding forward-looking statements The information contained in this document has not been independently verified and no representation or warranty
Operating income increased by 4% to EUR 53.6 million (H1 2016: EUR 51.6 million)
") Date: 8 th September 2017 Contact: Remko Dieker Secretary to the Managing Board T: +31 20 557 51 80 I: www.kasbank.com Net result of EUR 8.5 million (H1 2016: EUR 0.9 million) Operating income increased
Date: 8 th September 2017 Contact: Remko Dieker Secretary to the Managing Board T: +31 20 557 51 80 I: www.kasbank.com Net result of EUR 8.5 million (H1 2016: EUR 0.9 million) Operating income increased
Date: 6 th September Remko Dieker Secretary to the Managing Board T: I: Chairman s statement
 Date: 6 th September 2018 Contact: Remko Dieker Secretary to the Managing Board T: +31 20 557 51 80 I: www.kasbank.com Net result of EUR 5.1 million (H1 2017: EUR 8.5 million) Operating income of EUR 51.8
Business Update. USPP Conference Miami. Luis Damasceno Group CFO Michael Williams Group Finance Director & Treasurer January 2019
 Business Update USPP Conference Miami Luis Damasceno Group CFO Michael Williams Group Finance Director & Treasurer 23-25 January 2019 www.alsglobal.com IMPORTANT NOTICE AND DISCLAIMER This presentation
4 th quarter and annual results 2011 strong growth in North America, gradual slowdown in Europe revenue up 13% and diluted earnings per share up 8%
 4 th quarter and annual results 2011 strong growth in North America, gradual slowdown in Europe revenue up 13% and diluted earnings per share up 8% Ben Noteboom, CEO Robert-Jan van de Kraats, CFO Randstad
2017 Half-Year Results July 28 th, 2017
 2017 Half-Year Results July 28 th, 2017-1 - Disclaimer This presentation does not contain or constitute an offer of securities for sale or an invitation or inducement to invest in securities in France,
Statkraft Investor Update. European Energy & Utilities Credit Conference 2013
 Statkraft Investor Update European Energy & Utilities Credit Conference 2013 Disclaimer This presentation has been prepared by, and the information contained herein (unless otherwise indicated) has been
ELECTROCOMPONENTS Full-year results for the year ended 31 March 2018
 ELECTROCOMPONENTS Full-year results for the year ended 31 March 2018 24 May 2018 SAFE HARBOUR This presentation contains certain statements, statistics and projections that are or may be forward-looking.
Zumtobel Group AG Q1 2018/19 & Strategic Outlook. September 2018
 Zumtobel Group AG Q1 2018/19 & Strategic Outlook September 2018 AGENDA Q1 2018/19 financial results Corporate Strategy Outlook ) Q1 2018/19 results & strategic outlook 04.09.2018 2 Stabilisation measures
Nedap 2016 annual figures press release
 Revenue and operating profit rose in 2016 One-off costs of supply chain reorganisation lower than expected Groenlo, Netherlands, 16 February 2017 Nedap s overall revenue was up 3% in 2016, rising to 186.0
For personal use only
 SAI Global Limited Company Update Peter Mullins, Chief Executive Officer May 7 th 2015 ASX:SAI Disclaimer 2 This document has been prepared by SAI Global Limited (SAI) and comprises written materials/slides
Investor Relations ABN AMRO Q BofAML Annual Financials CEO Conference 25 September 2018
 Investor Relations ABN AMRO Q2 2018 BofAML Annual Financials CEO Conference 25 September 2018 ABN AMRO has shown strong capital generation since IPO Profit development Dividends per share and pay-out 1)
PORR 1H 2014 Update Investor Presentation September 2014
 PORR 1H 2014 Update Investor Presentation September 2014 Disclaimer This presentation was prepared by PORR AG (the "Company") solely for use at investors meetings and is furnished to you solely for informational
ELECTROCOMPONENTS 2019 half-year financial results
 ELECTROCOMPONENTS 2019 half-year financial results 20 November 2018 SAFE HARBOUR This presentation contains certain statements, statistics and projections that are or may be forward-looking. The accuracy
FY2018 ANNUAL RESULTS RETIREMENTS WEALTH INVESTMENTS INSURANCE. Twelve months to 31 March 2018
 FY2018 ANNUAL RESULTS Twelve months to 31 March 2018 Andrew A. Darfoor Group Chief Executive Naidene Ford-Hoon Group Chief Financial Officer RETIREMENTS WEALTH INVESTMENTS INSURANCE Presentation agenda
1H18 RESULTS 6 MONTHS ENDED 31 DECEMBER 2017
 1H18 RESULTS 6 MONTHS ENDED 31 DECEMBER 2017 GROUP RESULTS 2 GROWTH IN PROFIT AND FCF Group Underlying 1 Reported 2 1H 2018 1H 2017 1H 2018 1H 2017 Revenue 856.5 808.7 856.5 808.7 EBIT 81.3 81.9 61.6 61.1
Watpac Limited. 30 June 2018 Full Year Results Presentation. 23 August 2018
 Watpac Limited 30 June 2018 Full Year Results Presentation 23 August 2018 Full year group snapshot Capital Earnings Asset Values Work-in-hand Strategy Strong liquidity maintained Full repayment of equipment
Investor Relations. Q results. analyst & investor call presentation 9 August 2017
 Investor Relations Q2 2017 results analyst & investor call presentation 9 August 2017 Good second quarter 2017 results Highlights Q2 2017 (vs. Q2 2016) Financial results Underlying net profit at EUR 960m
Westpac 2008 Full year results
 Westpac 2008 Full year results 30 October 2008 Westpac 2008 Full year results Gail Kelly Chief Executive Officer Key messages Performed well in a challenging environment, delivering a robust financial
Responsible investment in growth
 Responsible investment in growth Issued: 17 June 2014 Legal notice This presentation has been prepared to inform investors and prospective investors in the secondary markets about the Group and does not
For personal use only
 FY16 RESULTS BRIEFING H U G H M A R K S C H I E F E X E C U T I V E O F F I C E R G R E G B A R N E S C H I E F F I N A N C I A L O F F I C E R M I C H A E L S T E P H E N S O N C H I E F S A L E S O F
BAM raises profit outlook for 2007 after a good first half year
 Runnenburg 9, 3981 AZ Bunnik / P.O. Box 20, 3980 CA Bunnik The Netherlands Telephone +31 (0)30 659 89 88MRO bank s-gravenhage 43.00.08.937 Date 6 September 2007 No. of pages 11 BAM raises profit outlook
Presentation. 13 May Results first quarter 2009
 Presentation 13 May 2009 Results first quarter 2009 Disclaimer This presentation for the first quarter 2009 is a translation of the Dutch presentation on the consolidated results for the first quarter
Financial Year 2013 Media and Analysts Conference
 Financial Year Media and Analysts Conference Zurich, 25 February 2014 A. Affentranger / B. Fellmann Media and Analysts Conference Highlights Implenia Media and Analysts Conference February 2014 Page 2
Investor Relations. Q results. analyst & investor call presentation 17 May 2017
 Investor Relations Q1 2017 results analyst & investor call presentation 17 May 2017 Good first quarter 2017 results Highlights Q1 2017 (vs. Q1 2016) Financial results Underlying net profit at EUR 615m
Mitie Group plc. The UK s leading Facilities Management business. Analyst Presentation H1 18/19 22 November 2018
 Mitie Group plc The UK s leading Facilities Management business Analyst Presentation H1 18/19 22 November 2018 Disclaimer This presentation may contain certain forward-looking statements, beliefs or opinions,
Zumtobel Group AG Annual Financial Results 2017/18 & Update on strategy development process
 Zumtobel Group AG Annual Financial Results 2017/18 & Update on strategy development process 28 June 2018 title of presentation (change at 1st slide inside the slide master) xx.xx.xxxx Thomas Tschol Chief
WAVIN GROUP REPORTS STRONG INCREASE IN REVENUE AND OPERATING RESULTS IN FIRST HALF YEAR 2007
 WAVIN GROUP REPORTS STRONG INCREASE IN REVENUE AND OPERATING RESULTS IN FIRST HALF YEAR 2007 Zwolle, 6 September 2007 Wavin N.V., leading supplier of plastic pipe systems and solutions in Europe, today
VFB-Happening Rik Scheerlinck, KBC Group CFO
 Rik Scheerlinck, KBC Group CFO Important information for investors This presentation is provided for information purposes only. It does not constitute an offer to buy or sell any security issued by an
Zumtobel Group AG Q1 2015/16 results
 Zumtobel Group AG Q1 2015/16 results September 8, 2015 1 8 September 2015 Q1 2015/16 results An expected slow start to the FY but on track to meet full year guidance Financials Q1 2015/16 at a glance Group
NKT I IR presentation I Annual Report February 2014 I 1 NKT. Annual Report Webcast, 28 February 2014 at 9:00 am CET
 28 February 2014 I 1 NKT Annual Report 2013 Webcast, 28 February 2014 at 9:00 am CET 28 February 2014 I 2 Forward looking statements This presentation and related comments contain forward-looking statements.
Full year results to 30 June 2015 Greg Fitzgerald, Executive Chairman, and Graham Prothero, Finance Director
 Full year results to 30 June 2015 Greg Fitzgerald, Executive Chairman, and Graham Prothero, Finance Director FY15 Results Analyst Presentation, 16 September 2015 1 Agenda Overview Strategy to 2018 Financial
INTERIM RESULTS PRESENTATION SIX MONTHS TO 30 JUNE 2018
 INTERIM RESULTS PRESENTATION SIX MONTHS TO 30 JUNE 2018 DISCLAIMER The information contained in this presentation has not been independently verified and this presentation contains various forward-looking
Healthcare Automotive Industrial Automation Machine & Systems Energy. Annual Results Jan Willem Wienbelt Amsterdam, March 13, 2014
 Logistics Healthcare Automotive Industrial Automation Machine & Systems Energy Annual Results 2013 Jos Blejie Jan Willem Wienbelt Chairman and CEO CFO Amsterdam, March 13, 2014 AGENDA 1 2013 HIGHLIGHTS
Accelerating Think Forward
 Accelerating Think Forward Bank of America Merrill Lynch 22 nd Annual Financials CEO Conference Ralph Hamers, CEO ING Group London 26 September 2017 The global financial crisis 10 years on 2 EC restructuring
Second Quarter 2011 Results ING s underlying net profit increased 19.7% to EUR 1,528 million
 Second Quarter 2011 Results ING s underlying net profit increased 19.7% to EUR 1,528 million Jan Hommen CEO Amsterdam 4 August 2011 www.ing.com ING posted strong second quarter results ING Group underlying
Report of the Executive Board for 2017
 Report of the Executive Board for 2017 Annual General Meeting: Empowering people Ralph Hamers, CEO ING Group Amsterdam 23 April 2018 Think Forward: still as relevant as ever Purpose Empowering people to
Half Year Results. for the six months ended 30 November January Chairman Chris Stone CEO Adam Palser CFO Brian Tenner
 Half Year Results for the six months ended 30 November 2017 16 January 2018 Chairman Chris Stone CEO Adam Palser CFO Brian Tenner Agenda Overview and strategy update Financial highlights Financial performance
Vita Group (VTG)! Results Presentation!
! Results Presentation!") Vita Group (VTG) Results Presentation First half FY14 Group highlights Sustained trend of strong profit, dividend growth Underlying EBITDA 1 +18%, underlying NPAT 2 +56%, dividend +66% Areas of strategic
Vita Group (VTG) Results Presentation First half FY14 Group highlights Sustained trend of strong profit, dividend growth Underlying EBITDA 1 +18%, underlying NPAT 2 +56%, dividend +66% Areas of strategic
NKT I IR presentation I Interim Report Q November 2014 I 1 NKT. Interim Report Q Webcast, 13 November 2014 at 10:00 CET
 13 November 2014 I 1 NKT Interim Report Q3 2014 Webcast, 13 November 2014 at 10:00 CET 13 November 2014 I 2 Forward looking statements This presentation and related comments contain forward-looking statements.
Financial Industry Solutions. Second Quarter Financial Results AUGUST 9, 2018
 Financial Industry Solutions Second Quarter Financial Results AUGUST 9, Disclaimer Certain information in this presentation is forward-looking and related to anticipated financial performance, events and
Affinity Education Group. Half Year Results
 Affinity Education Group Half Year Results 29 August 2014 Disclaimer This presentation contains general information in summary form which is current as at 29 August 2014. It presents financial information
AUGUST HALF YEAR RESULTS to 30 June 2018
 AUGUST 2018 HALF YEAR RESULTS to 30 June 2018 Agenda Introduction John Morgan HY 2018 Financial & Operational Review Steve Crummett Strategy & Prospects John Morgan Highlights Strategic and operational
Cembrit Group Q Unaudited interim report
 Cembrit Group Q4 2017 Unaudited interim report 2017 main events COMMENTARY Strong demand across both markets and product categories resulted in revenue growth of 7.9% YoY 2017 EBITDA showed solid underlying
STRATEGICALLY POSITIONED FOR GROWTH.
 STRATEGICALLY POSITIONED FOR GROWTH. ANNUAL REPORT 2017 SHOP APOTHEKE EUROPE N.V. DR. ULRICH WANDEL, CFO 12 MARCH 2018 DISCLAIMER. 2 THIS PRESENTATION AND ITS CONTENTS ARE NOT FOR RELEASE, PUBLICATION
3 rd quarter results 2010 continued strong growth; revenue up 19% in Q3 2010
 3 rd quarter results 2010 continued strong growth; revenue up 19% in Q3 2010 Robert-Jan van de Kraats, CFO Randstad Holding nv disclaimer & definitions Certain statements in this document comprise forecasts
Lindorff. Company Presentation. November 2016
 Lindorff Company Presentation November 06 Disclaimer IMPORTANT INFORMATION Not for distribution in or into the United States, Australia, Canada, Japan or any other jurisdiction in which such distribution
Royal BAM Group nv First quarter results Investor presentation Bunnik, 19 May 2011
 Royal BAM Group nv First quarter results 2011 Investor presentation Bunnik, 19 May 2011 Nico de Vries, Chairman of the Executive Board of Royal BAM Group BAM s results for the first quarter were stable
Investor & Analyst Presentation Ful YearResults 30 June2016 For personal use only 25th August 2016 Rebekah O Flaherty - CEO I Jonathan Kenny - CFO
 Investor & Analyst Presentation Full YearResults 30 June2016 25th August 2016 Rebekah O Flaherty - CEO I Jonathan Kenny - CFO Agenda 1 Overview 2 Strategic Priorities 3 FY16 Financial Results 4 FY17 Outlook
On track! Results for Q1 Q3 2017
 On track! Results for Q1 Q3 2017 Technology-based financial services Investment highlights in Q1 Q3 2017 and forecast for 2017 Key figures for Q1 Q3 2017 (yoy) Revenue: 143.7 million (+27%) EBIT: 18.6
FY16 YEAR END RESULTS 5 APRIL 2016
 FY16 YEAR END RESULTS 5 APRIL 2016 DEFINITIONS AND IMPORTANT NOTICE The following definitions apply throughout Trading EBITDA (earnings before interest, tax, depreciation and amortisation): excludes exceptional
OVERVIEW 1H17 RESULTS
 CLICK 1H 2017 TO EDIT RESULTS MASTER TITLE 6 MONTHS ENDED 31 STYLE DECEMBER 2016 OVERVIEW 2 FINANCIAL SUMMARY Group Underlying Reported 1H 2017 1H 2016 1H 2017 1H 2016 Revenue 808.7 794.3 808.7 814.1 EBIT
K E N D R I O N N. V. P R E S S R E L E A S E. 1 9 F e b r u a r y
 K E N D R I O N N. V. P R E S S R E L E A S E 1 9 F e b r u a r y 2 0 1 9 KENDRION MAINTAINS PROFITABILITY FOR THE YEAR DESPITE DIFFICULT AUTOMOTIVE MARKET - Full-year revenue declined by 3% to EUR 448.6
The Food Travel Experts.
 The Food Travel Experts www.foodtravelexperts.com Presentation structure 1. Group highlights Kate Swann 2. Financial review Jonathan Davies 3. Business review Kate Swann 4. Q&A All 2 Group highlights Good
first quarter results 2010
 first quarter results 2010 back to growth in March Robert-Jan van de Kraats, CFO Randstad Holding nv April 28, 2010 disclaimer Certain statements in this document comprise forecasts on Randstad Holding