Annual figures February 2016 Board of Directors Heijmans N.V.
|
|
|
- Virgil York
- 5 years ago
- Views:
Transcription

1 Annual figures February 2016 Board of Directors Heijmans N.V.
2 Heijmans 2015: negative result, improvement visible second half of the year Improvement result remains top priority Bert van der Els - chairman Board of Directors Heijmans N.V.
3 Key figures 2015 Key figures x 1 million H Revenues Underlying operating result * Operating result Result after tax Order book Net debt Number of FTE * underlying operating result is the operating result corrected for operating result joint ventures, w rite dow n on property assets, restructuring costs and other extraordinary items.
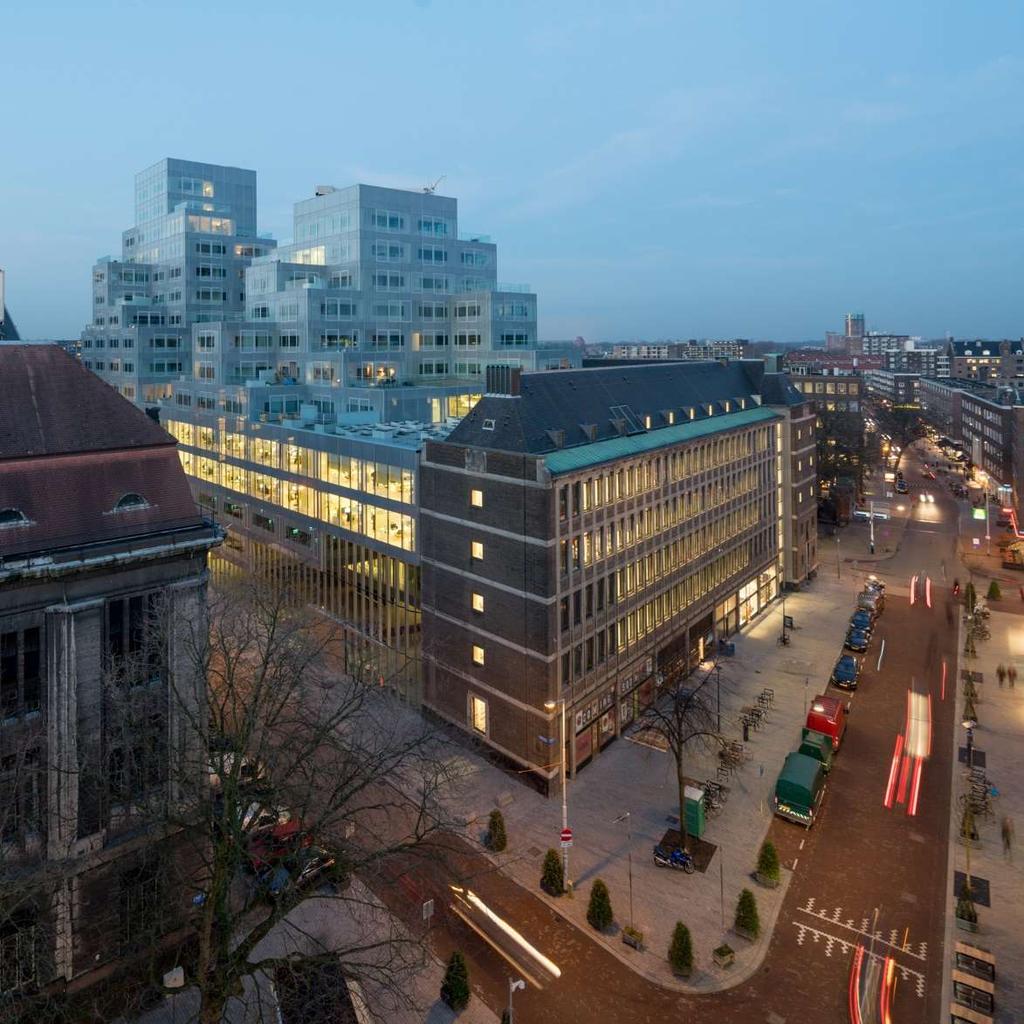
4 Timmerhuis, Rotterdam
5 FY 2015 highlights Turnover + 6% to nearly 2,0 bln; Underlying operational result H2: + 6 mln; Underlying operational result 2015: -/- 5 mln; Number of houses sold + 33% to 1.791; Net result /- 27 mln, partly due to impairment of land bank ( 12 mln); Result Residential / Property Development improved to 15 mln; Solid profit contribution of Belgium and Germany, together 15 mln; Result Infra Netherlands -/- 26 million.
6 FY 2015 highlights Safety improved due to internal program GO! (No accidents); Decline number of accidents and IF-figure NL to 3.9 in 2015 (2014: 5.6); Financing extended until 30 June 2018; Net debt comparable with 2014; strong focus on working capital; Restructurings almost completed, improvement measures on schedule; Proposed appointment of new board member with specific focus on infrastructure.
7 Situation NL Infrastructure Approx. 700 mln turnover, divided over: Regional projects & Asset Management ~40% Specialties ~20% Big Projects ~40% Big projects Integral Roads Civils 5-10 projects are loss making, acquired in ; Mainly to be completed in 2016; Various improvement measures implemented.
8 Control of big projects Market Tendering / Acquisition Execution & Organisation Contract Management Improvement measures Focus Suitable Partnerships Market vision Stick-to-the-plan approach Start Up reviews Tender management Design costs Start margins incl. pricing of risks Go / No go Use new ERP

9 A4 Delft- Schiedam

10 First 30 Heijmans ONEs sold to Wonen Limburg
11 2015 To improve and renew Processes and procedures Integration of Roads and Civil into one Heijmans Infra Implementation of new ERP platform (SAP) on schedule Process tender management incl go / no go moments company wide adopted Process improvements for project management, procurement and commerce Focus on working capital (Fit for Cash) and invested capital Technology The innovation BrainJoint successfully launched in the market Marketing of developed concepts: first 30 Heijmans One houses sold Pilot started with Solar Noise Barriers Partner in developing steel bridge with 3D-print technology Smart Living: house control application as new standard
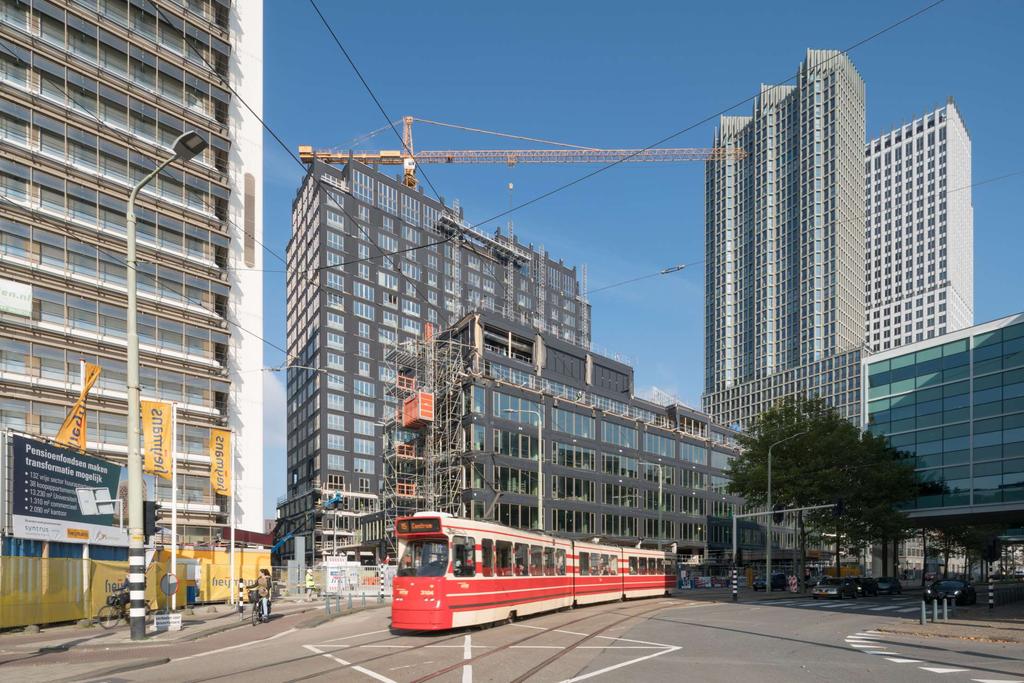
12 Wijnhavenkwartier, Den Haag
13 Outlook Continuing positive trend residential market, Heijmans well positioned; Gradual improvements Non Residential and Infrastructure, markets remain challenging; Germany and Belgium solid; Heijmans strategy remains unchanged: Improve the core Integrated approach (uniform processes / centralised steering) Innovative skills To move to the next level including positive underlying operational result in 2016.
14 Heijmans 2015: negative result, improvement visible second half of the year Mark van den Biggelaar CFO & member Board of Directors Heijmans N.V.
15 DEVELOPMENTS PER SECTOR PROPERTY DEVELOPMENT x 1 million Revenues Underlying operating result 9 4 Underlying operating margin 3,2% 2,2% Order book Turnover sharp increase (55%) with positive margin development; Houses sold increased with 33% to (2014: 1.347), of which 63% to private buyers; Order book increased; Start of construction 212 lofts Fenixloodsen (transformation Katendrecht in Rotterdam) and Kanaleneiland in Utrecht; Interesting new projects acquired, first deal with foreign developer; Decrease (strategic) land bank, 12 mln value adjustments.

16 Boszoom Pijnacker

17 Transformation Grootlab Amsterdam School of Arts
18 DEVELOPMENTS PER SECTOR RESIDENTIAL x 1 million Revenues Underlying operating result 6 2 Underlying operating margin 1,6% 0,7% Order book Turnover increased, > 50% with Property Development; Turnover divided into the Netherlands ( 295 mln) and Belgium ( 92 mln); Order book increased compared to 2014, growing share of transformations and renovations; Focus on growth with standardised products (Huismerk, Wenswonen); In 2015, completion of 500th Heijmans Huismerk house; Good progress of big projects, including Wijnhavenkwartier Den Haag, Kooiplein Leiden, and Elisabethcenter Antwerpen; Completion Student Hotel Amsterdam.

19 Elisabeth Center Antwerpen (B)

20 Groene Oever, Lent

21 Edith Stein College Den Haag

22 Plein van Leiden
23 DEVELOPMENTS PER SECTOR NON RESIDENTIAL Turnover higher due to production level; Break-even result, comparable with last year; Restructuring completed with delay; reduction of approximately 200 fte; Focus on improving project and risk management, also during design phase; Decrease in order book, less big projects acquired; Positive development Services (turnover and margin); Integrated services and maintenance contracts for data centers / offices tax authority Apeldoorn and 19 locations of DJI (Ministry of Defense); Completion Timmerhuis Rotterdam.

24 Services and maintenance Ministry of Defense
; Improvement measures implemented; Completion and opening for traffic of A4 Delft-Schiedam in")
25 DEVELOPMENTS PER SECTOR INFRA NETHERLANDS Turnover lower than last year; 5-10 complex projects; In total 26 mln loss; Improvements visible for regional projects, asset management and specialties (60% of turnover); Improvement measures implemented; Completion and opening for traffic of A4 Delft-Schiedam in December.

26 Rail crossing Station Bilthoven

27 A12 Veenendaal Ede - Grijsoord
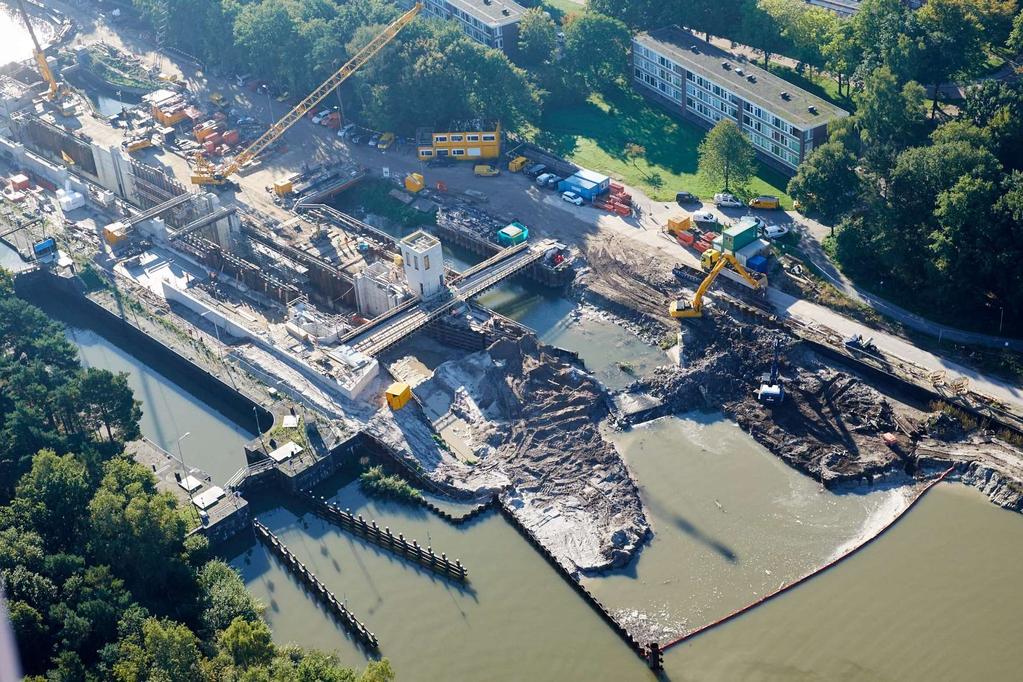
28 Wilhelminakanaal, Tilburg
29 DEVELOPMENTS PER SECTOR INFRA BELGIUM Slight decrease in turnover and profitability, but still at excellent level; Markt remains challenging, especially with public authorities; Increase in order book; R4 motorway in Gent was completed in 2015, start of construction N70 Sint Niklaas.

30 N70 Sint Niklaas (B)
31 DEVELOPMENTS PER SECTOR INFRA GERMANY Positive market developments, especially in non residential; Effects of completed Oevermann restructuring noticeable; Clear improvement of operating margin; Improvement of operational focus Franki, first effects visible.

32 Oevermann Erpho-Bogen Münster (D)

33 Franki Hammer Strasse, Hamburg (D)
34 Balance sheet and cash flow Balance sheet (in million ) Q Q Fixed assets Working capital improved, mainly due to lower receivables; Solvency solid at 26% (End of 2014: 27%); Complied with financial covenants: Interest Cover: 6,0 (>3) Working capital (excl. cash and cash equivalents) Funding requirement Equity Provisions (non current) Net debt Funding Solvability based on guaranteed capital 26,1% 27,0% Leverage Ratio: -/-2,6 (<3) Working capital (in million ) Q Q Strategic land bank Other inventories Work in progress Receivables Current and non-interestbearing liabilities Trade and other payables Work in progress Provisions (current) Working capital
35 Funding lender s syndicate As of April 1, 256 mln committed facility until 30 June 2018; ICR to be tested on quarterly basis as of Q1, per Q at level of 4; Impacted by sector wide events; Goal: to structurally improve debt / ebitda ratio.
36 Amounts x 1 million Interest bearing debt 135,1 105,2 Minus: cash and cash equivalents 125,4 73,8 Net debt 9,7 31,4 Appendix Adjustments: Net debt Joint Ventures 74,0 76,0 Net debt non recourse project finance -80,8-53,0 Cumulative preference shares B -45,1-66,1 Other -4,0-0,7 Net debt covenants (A) -46,2-12,4 Underlying operating result (including joint ventures) -5,1-12,4 Depreciation and amortisation 19,1 23,5 Underlying EBITDA 14,0 11,1 Adjustments: Capitalised interest 2,9 2,0 EBITDA non recourse projects -1,7-2,4 Other 2,2 1,5 EBITDA covenants (B) 17,4 12,2 Net interest 11,1 8,1 Adjustments: Net interest joint ventures 3,1 3,3 Interest cumulative preference shares B -3,7-5,2 Net interest non recourse project financings -4,5-2,1 Other -3,1-0,6 Net interest covenants 2,9 3,5 Leverage ratio (A/B) <3-2,7-1,0 Interest cover ratio (B/C) >3 6,0 3,5
37 Disclaimer This presentation has been prepared by and is the responsibility of Heijmans N.V. This presentation is being supplied to you solely for your information and use at the presentation which will be or was held on February 25, The information may not be further distributed or passed on to other people or published or reproduced in whole or in part. The information may be subject to updating, completion, revision and amendment and such information may change materially. This presentation contains certain forward-looking statements relating to the business, financial performance and results of the Heijmans N.V. and the industry in which it operates. These statements are based on Heijmans N.V.'s and its management's current plans, estimates and projections, as well as its expectations of external conditions and events. In particular the words expect, anticipate, predict, estimate, project, plan, may, should, would, will, intend, believe and similar expressions are intended to identify forward-looking statements. Forward-looking statements are statements of future expectations that are based on current expectations and assumptions and involve known and unknown risks and uncertainties that could cause actual results, performance or events to differ materially from those expressed or implied in these statements. Neither Heijmans N.V. nor any of its subsidiaries undertake any obligation to publicly update or revise any forwardlooking statement as a result of new information, future events or other information. No representation or warranty, express or implied, is or will be made by Heijmans N.V., its advisors or any other person as to the accuracy, completeness or fairness of the information or opinions contained in the presentation and any reliance you place on them will be at your sole risk. Without prejudice to the foregoing, neither Heijmans N.V., its associates, its advisors, nor its representatives accept any liability whatsoever for any loss howsoever arising, directly or indirectly, from the use of this presentation or its contents or otherwise arising in connection with this presentation. The presentation does not constitute or form part of, and should not be constructed as, an offer or invitation to subscribe for or purchase any securities.
38
Interim results August 19, 2015 Executive Board Heijmans N.V.
 Interim results 2015 August 19, 2015 Executive Board Heijmans N.V. Welcome The Student Hotel Transformation Parool & Trouw Building Amsterdam Heijmans benefits from recovering housing market, negative
Heijmans: annual results 2016, adjustment strategy and new financing agreements
 Heijmans: annual results 2016, adjustment strategy and new financing agreements 23 February 2017 Board of directors Heijmans N.V. Wijnhavenkwartier Den Haag Heijmans: annual results 2016, adjustment strategy
Heijmans interim results 2017
 Heijmans interim results 2017 16 AUGUST 2017 ZUIDASDOK, AMSTERDAM Heijmans: solid progress towards sustainable recovery TON HILLEN, CHAIRMAN EXECUTIVE BOARD HEIJMANS N.V. 2 Highlights interim results Recovery
Update 2016: preliminary annual figures, refinancing, strategy adjustment
 Update 2016: preliminary annual figures, refinancing, strategy adjustment 16 February 2017 Executive Board Heijmans N.V. Wijnhavenkwartier Den Haag Heijmans; preliminary results 2016, strategy adjustment
ANNUAL RESULTS February 27, 2014 Executive Board Heijmans N.V.
 ANNUAL RESULTS 2013 February 27, 2014 Executive Board Heijmans N.V. Heijmans records modest result in 2013 despite tough year Bert van der Els- chairman Heijmans Executive Board FY 2013 Highlights Another
Heijmans annual results 2017
 Heijmans annual results 2017 23 FEBRUARY 2018 ZUIDASDOK, AMSTERDAM DE SCHOONE LEY, HAGA TERREIN DEN HAAG Heijmans annual results 2017: sound basis for continued recovery TON HILLEN, CEO HEIJMANS N.V. 2
Heijmans interim results 2018
 Heijmans interim results 2018 15 AUGUST 2018 GAASPERDAMMERTUNNEL, A9 AMSTERDAM Heijmans continues improvement in first half of 2018 TON HILLEN, CHAIRMAN EXECUTIVE BOARD HEIJMANS N.V. 2 Safety Trend number
Heijmans Business Update. September 2015, based on H interim results
 Heijmans Business Update September 2015, based on H1 2015 interim results Asset Management Schiphol Airport 2 Contents Company profile Strategy H1 2015 Interim results and outlook Developments per sector
Heijmans benefits from recovering housing market, negative result due to pressure on infra
 Press release Datum 19 augustus 2015 Pagina s 1 of 22 Heijmans benefits from recovering housing market, negative result due to pressure on infra Highlights: Number of homes sold increased to 746 in the
x 1 million H H *
 Press release Datum 26 februari 2015 Pagina s 1 van 21 Heijmans full year results: poor 2 nd half year 2014, order book and housing market offer good prospects Challenging market requires continuous improvement
Heijmans: moderate first half year, substantial growth order book 2014 transition year, residential market offers perspective
 Press release half year results 2014 Datum 20 augustus 2014 Pagina s 1 van 21 Heijmans: moderate first half year, substantial growth order book 2014 transition year, residential market offers perspective
Heijmans Business Update ROADSHOW BOOKLET, FEBRUARY 2018, BASED ON 2017 ANNUAL RESULTS
 Heijmans Business Update ROADSHOW BOOKLET, FEBRUARY 2018, BASED ON 2017 ANNUAL RESULTS 2 Key figures Key figures * x 1 million H2 2017 H2 2016 2017 2016 Revenues Netherlands 756 665 1.402 1.370 Underlying
Royal BAM Group nv Half-year results Analysts meeting Amsterdam, 23 August 2012
 Royal BAM Group nv Half-year results 2012 Analysts meeting Amsterdam, 23 August 2012 Highlights Net loss including impairments for H1 2012: 251 million Results at Construction and M&E services and Civil
Heijmans continues improvement in first half of Key figures * x 1 million H H
 Press release Date 15 August 2018 Page 1 of 25 Heijmans continues improvement in first half of 2018 Highlights: Turnover increased to 780 million in first half of 2018 (first half 2017: 646 million). Underlying
Heijmans: solid progress towards sustainable recovery. Key figures * x 1 million H H
 Press release Date Page 16 August 2017 1 of 21 Heijmans: solid progress towards sustainable recovery Highlights: Strong improvement in underlying EBITDA NL: 9 million (H1 2016: 9 million negative) largely
Royal BAM Group nv First nine months Amsterdam, 18 November 2010
 Royal BAM Group nv First nine months 2010 Press and analysts meeting Amsterdam, 18 November 2010 BAM forecasts break-even result for 2010 despite property impairments Net result for the first nine months
Zumtobel Group AG FY 2014/15 results
 Zumtobel Group AG FY 2014/15 results June 24, 2015 1 24 June 2015 Annual Results 2014/15 Improvement in revenues and earnings, restructuring measures on track Financials FY 2014/15 at a glance Group revenues
Neways posts higher turnover and results in 2016
 PRESS RELEASE Annual results Neways posts higher turnover and results in 2016 Son (the Netherlands) 3 March 2016 Neways Electronics International N.V. (Euronext: NEWAY) ( Neways or the Company ), today
JinkoSolar Holding Co., Ltd. Q Earnings Call Presentation
 JinkoSolar Holding Co., Ltd. Q3 2018 Earnings Call Presentation November 26, 2018 Disclaimer This presentation does not constitute an offer to sell or issue or the solicitation of an offer to buy or acquire
Royal BAM Group nv First quarter results Investor presentation Bunnik, 19 May 2011
 Royal BAM Group nv First quarter results 2011 Investor presentation Bunnik, 19 May 2011 Nico de Vries, Chairman of the Executive Board of Royal BAM Group BAM s results for the first quarter were stable
AS MERKO EHITUS 9 months and Q interim report
 AS MERKO EHITUS 9 months and Q3 2016 interim report 3 November 2016 Kindergarten and school buildings complex in Pinki Agenda 1. Key highlights 2. Business review 3. Financial position 4. Market outlook
ABN AMRO Investor Day. Future proof CIB. Corporate & Institutional Banking Rutger van Nouhuijs 16 November 2018
 ABN AMRO Investor Day Future proof CIB Corporate & Institutional Banking Rutger van Nouhuijs 16 November 2018 Key takeaways We are committed to: Sustainable relationships with multi-product clients in
AUSTRIAN POST H INVESTOR PRESENTATION. Georg Pölzl/CEO, Rudolf Jettmar/CFO Vienna, August 19, 2011
 AUSTRIAN POST H1 2011 INVESTOR PRESENTATION Georg Pölzl/CEO, Rudolf Jettmar/CFO Vienna, August 19, 2011 1. Highlights and overview 2. Performance of the divisions 3. Group results 4. Outlook 2 SUCCESSFUL
AS MERKO EHITUS 6 months and Q interim report
 AS MERKO EHITUS 6 months and Q2 2016 interim report 4 August 2016 BAUHAUS shopping centre Agenda 1. Key highlights 2. Business review 3. Financial position 4. Market outlook 2 Hilton Tallinn Park Hotel
TomTom Group. Fourth quarter 2008 results. Harold Goddijn CEO Marina Wyatt - CFO
 TomTom Group Fourth quarter 2008 results Harold Goddijn CEO Marina Wyatt - CFO Disclaimer This Presentation has been produced by TomTom N.V. (the Company ) and is furnished to you solely for your information.
MERKO EHITUS Construction, Engineering & Real Estate. 24 April 2014
 MERKO EHITUS Construction, Engineering & Real Estate 24 April 2014 Contents 1. About the Group 2. Market Overview 3. Business Activities 4. 2013 Results 5. Market Outlook and 2014 Focus 2 Aruküla 330/110/20
Q RESULTS. Harold Goddijn CEO Taco Titulaer CFO 16 OCTOBER 2018
 Q3 2018 RESULTS Harold Goddijn CEO Taco Titulaer CFO 16 OCTOBER 2018 Operational highlights Groupe PSA selected TomTom s maps, navigation and live services for its next generation infotainment BMW Group
HAMBURGER HAFEN UND LOGISTIK AG
 HAMBURGER HAFEN UND LOGISTIK AG Analyst Conference Call on the Interim Results January to March 2017 Hamburg, 12 May 2017 Disclaimer The facts and information contained herein are as up to date as is reasonably
Zumtobel Group AG H1 2016/ December 2016
 Zumtobel Group AG H1 2016/2017 6 December 2016 Nr. 2 Substantial increase in profitability despite lower revenues Financials H1 FY 2016/17 at a glance Fx-adjusted decline of 1.5% in Group revenues with
AS MERKO EHITUS Consolidated 3 months interim report. 5 May 2016
 AS MERKO EHITUS Consolidated 3 months interim report 5 May 2016 Agenda 1. Key highlights 2. Business review 3. Financial position 4. Market outlook 2 North Estonian Medical Centre Merko group key highlights
Zumtobel Group AG H1 2018/19. 4 December 2018
 Zumtobel Group AG H1 2018/19 4 December 2018 Improvement of profitability despite challenging market environment Financials H1 2018/19 at a glance Group revenues 4.7% below prior year, UK (minus 15%) and
Q results 24 April Henri de Sauvage-Nolting, President and CEO Danko Maras, CFO Jacob Broberg, SVP IR
 Q1 2018 results 24 April 2018 Henri de Sauvage-Nolting, President and CEO Danko Maras, CFO Jacob Broberg, SVP IR 2 Q1 highlights Good EBIT delivery and Easter sales Net sales amounted to SEK 1,562m (1,222).
Second quarter Vestas Wind Systems A/S. Copenhagen, 18 August Classification: Public
 Second quarter Vestas Wind Systems A/S Copenhagen, 18 August Disclaimer and cautionary statement This presentation contains forward-looking statements concerning Vestas' financial condition, results of
MERKO EHITUS GROUP 9 months and Q interim report. November 2015
 MERKO EHITUS GROUP 9 months and Q3 2015 interim report November 2015 Agenda 1. Key highlights 2. Business review 3. Financial position 4. Market outlook Skanste residential development area in Riga 2 Merko
Results Amsterdam, 21 February 2018
 Results 2017 Amsterdam, 21 February 2018 BAM reports full year adjusted result before tax of 63.3 million Full year adjusted result margin at 1%; excluding previously announced loss at sea lock IJmuiden
Sustainability, a business opportunity
 ABN AMRO Investor Day Sustainability, a business opportunity Commercial Banking Daphne de Kluis 16 November 2018 We are committed to Pursuing sustainability as a business opportunity Service the Dutch
4 th quarter and annual results 2011 strong growth in North America, gradual slowdown in Europe revenue up 13% and diluted earnings per share up 8%
 4 th quarter and annual results 2011 strong growth in North America, gradual slowdown in Europe revenue up 13% and diluted earnings per share up 8% Ben Noteboom, CEO Robert-Jan van de Kraats, CFO Randstad
Forward-looking statements
 Forward-looking statements Except for the historical information contained herein, the matters discussed in this statement include forward-looking statements. In particular, all statements that express
Harold Goddijn - CEO & Marina Wyatt - CFO 21 July 2010
 TomTom T Q2 2010 results Harold Goddijn - CEO & Marina Wyatt - CFO 21 July 2010 Disclaimer This Presentation has been produced by TomTom N.V. (the Company ) and is furnished to you solely for your information.
PRESS CONFERENCE / ANALYST MEETING: TODAY, WEDNESDAY 26 AUGUST 2015 START: LOCATION: Hotel Casa 400 (Eerste Ringdijk 4, AMSTERDAM)
") Press Release 26 August 2015 Recovery turnover and results Neways in first half 2015 PRESS CONFERENCE / ANALYST MEETING: TODAY, WEDNESDAY 26 AUGUST 2015 START: 10.30 - LOCATION: Hotel Casa 400 (Eerste
Press Release 26 August 2015 Recovery turnover and results Neways in first half 2015 PRESS CONFERENCE / ANALYST MEETING: TODAY, WEDNESDAY 26 AUGUST 2015 START: 10.30 - LOCATION: Hotel Casa 400 (Eerste
Investor Presentation 30/08/2017 Page #
 Investor Presentation 30/08/2017 Page # Disclaimer This presentation was prepared by PORR AG (the "Company") solely for use at investors meetings and is provided solely for informational purposes. This
AS MERKO EHITUS 3 months 2018 interim report
 AS MERKO EHITUS 3 months 2018 interim report 10 May 2018 Noblessner Home Port in Estonia Agenda 1. Key Highlights 5. Stock Exchange Overview 2. Business Review 6. Market Outlook 3. Financial Position 7.
Q2 Presentation July, 2011
 Q2 Presentation 2011 15 July, 2011 Disclaimer This presentation has been prepared by Duni AB (the Company ) solely for use at this investor presentation and is furnished to you solely for your information
MERKO EHITUS GROUP 12 months and Q interim report. February 2016
 MERKO EHITUS GROUP 12 months and Q4 2015 interim report February 2016 Agenda 1. Key highlights 2. Business review 3. Financial position 4. Market outlook 2 Liepaja Concert Hall Merko group key highlights
Results First Quarter 2012/13
 Results First Quarter 2012/13 Investor Call Mannheim, 27 th June 2012 Dr. Michael Majerus CFO Disclaimer 2012 PHOENIX Pharmahandel GmbH & Co KG This document has been prepared by PHOENIX Pharmahandel GmbH
FULL YEAR RESULTS AND DEVELOPMENTS March 2018
 FULL YEAR RESULTS AND DEVELOPMENTS 2017 6 March 2018 CONTENTS 1 Highlights & progress strategy 2017 2 Developments solutions segments 3 Financial performance 4 Outlook 5 Questions & answers 2 FY Results
BRINGING UNIQUE EXPERIENCES TOGETHER ANNUAL R E SU LT S A N D COMPA N Y PRO FILE
 BRINGING UNIQUE EXPERIENCES TOGETHER 2 017 ANNUAL R E SU LT S A N D COMPA N Y PRO FILE WELCOME From the moment our guests consider a stay with PPHE Hotel Group to their safe return home, we want them to
TomTom Q results. Harold Goddijn - CEO & Marina Wyatt - CFO 18 February 2011
 TomTom Q4 2010 results Harold Goddijn - CEO & Marina Wyatt - CFO 18 February 2011 Financial highlights Content & Services revenue grew by 16% to 98 million Automotive revenue grew by 52% to 55 million
Media release. Helvetia increases profit and grows through acquisitions. St. Gallen, 16 March 2015
 Media release St. Gallen, 16 March 2015 Helvetia increases profit and grows through acquisitions Helvetia produced a very good performance in 2014 and successfully completed the acquisitions of Nationale
Q results 29 April Bengt Baron, CEO Danko Maras, CFO Jacob Broberg, SVP IR
 Q1 2013 results 29 April 2013 Bengt Baron, CEO Danko Maras, CFO Jacob Broberg, SVP IR 2 Q1 highlights Significantly improved underlying profitability Underlying EBIT of SEK 91m (47) Underlying margin of
STRABAG SE JANUARY MARCH 2018 RESULTS
 STRABAG SE JANUARY MARCH 2018 RESULTS 30 MAY 2018 DISCLAIMER This presentation is made by STRABAG SE (the "Company") solely for use at investor meetings and is furnished to you solely for your information.
2018 half year results. Amsterdam, 23 August 2018
 2018 half year results Amsterdam, 23 August 2018 BAM reports 1H18 adjusted pre-tax result of 57.8 million and reconfirms full year outlook Construction & Property: Dutch residential property development
FY 2015 Results Presentation. 19 January 2016
 FY 2015 Results Presentation 19 January 2016 Disclaimer THIS PRESENTATION IS NOT AN OFFER OR SOLICITATION OF AN OFFER TO BUY OR SELL SECURITIES IN THE UNITED STATES OF AMERICA OR IN ANY OTHER JURISDICTION.
FY 2017 FINANCIAL RESULTS. March 1 st, 2018
 FY 2017 FINANCIAL RESULTS March 1 st, 2018 FY 2017 Results 1. Highlights 2. FY Financial Performance Analysis 3. Appendix Verallia FY 2017 Financial Results 01/03/2018 2 2017 HIGHLIGHTS A very good financial
Q1 Presentation April, 2011
 Q1 Presentation 2011 28 April, 2011 Disclaimer This presentation has been prepared by Duni AB (the Company ) solely for use at this investor presentation and is furnished to you solely for your information
Q RESULTS. 19 July 2017 HAROLD GODDIJN CEO TACO TITULAER CFO
 Q2 2017 RESULTS 19 July 2017 HAROLD GODDIJN CEO TACO TITULAER CFO Our strategy is to build on our leading position in navigation technologies and to provide location content, software, and services to
SES Delivers Growth From Strong First Quarter Operational Performance
 PRESS RELEASE SES Delivers Growth From Strong First Quarter Operational Performance Luxembourg, 24 April 2009 SES S.A., the pre-eminent worldwide satellite operator, (Euronext Paris and Luxembourg Stock
Quarterly Statement as of September 30, 2017 QUALITY WORKS.
 Quarterly Statement as of September 30, 2017 QUALITY WORKS. 2017 LANXESS Group Key Data million 2016 2017 Change % 9M 2016 9M 2017 Change % Sales 1,921 2,404 25.1 5,784 7,327 26.7 Gross profit 446 551
DATATEC GROUP AUDITED PROVISIONAL RESULTS FOR THE YEAR ENDED 28 FEBRUARY 2018
 Technology Distribution Integration & Managed Services Consulting & Research AUDITED PROVISIONAL RESULTS FOR THE YEAR ENDED 28 FEBRUARY 2018 AGENDA Results summary, overview & strategic update Jens Montanana,
STRABAG SE JANUARY MARCH 2016 RESULTS
 STRABAG SE JANUARY MARCH 2016 RESULTS 31 MAY 2016 DISCLAIMER This presentation is made by STRABAG SE (the "Company") solely for use at investor meetings and is furnished to you solely for your information.
MERKO EHITUS GROUP 6 months and Q interim report. August 2015
 MERKO EHITUS GROUP 6 months and Q2 2015 interim report August 2015 Agenda 1. Key highlights 2. Business review 3. Financial position 4. Market outlook 2 300 MW Estonia Power Plant of Eesti Energia Merko
3M FY 2016/17 Financial results. 22 February
 3M FY 206/7 Financial results 22 February 207 0 Table of contents. Key Highlights 2. Financial Update Appendix Notice to recipients This presentation and any materials distributed in connection herewith
AS MERKO EHITUS 9 months and Q interim report
 AS MERKO EHITUS 9 months and Q3 2018 interim report 08 November 2018 Tõrva central square in Estonia Agenda 1. Key Highlights 4. Stock Exchange Overview 2. Business Review 5. Market Outlook 3. Financial
STRATEGICALLY POSITIONED FOR GROWTH.
 STRATEGICALLY POSITIONED FOR GROWTH. ANNUAL REPORT 2017 SHOP APOTHEKE EUROPE N.V. DR. ULRICH WANDEL, CFO 12 MARCH 2018 DISCLAIMER. 2 THIS PRESENTATION AND ITS CONTENTS ARE NOT FOR RELEASE, PUBLICATION
Half Year Results Presentation. For the six months ended 30 June 2016
 Half Year Results Presentation For the six months ended 30 June 2016 Disclaimer By attending the meeting where this presentation is made, or by reading this document, you agree to be bound by the limitations
Transpacific FY15 Half Year Results Presentation
 Transpacific FY15 Half Year Results Presentation Robert Boucher CEO Brendan Gill CFO 20 February 2015 - Disclaimer Forward looking statements - This presentation contains certain forward-looking statements,
Michel Lamie Chief Financial Officer Finance & Solvency II Capital Markets Day June 1, 2017 DELIVERING TOGETHER: BUILDING ON IMPROVED FUNDAMENTALS
 Michel Lamie Chief Financial Officer Finance & Solvency II Capital Markets Day June 1, 2017 DELIVERING TOGETHER: BUILDING ON IMPROVED FUNDAMENTALS KEY MESSAGES Operational result 2016 at approximately
JinkoSolar Holding Co., Ltd. Q Earnings Call Presentation
 JinkoSolar Holding Co., Ltd. Q4 2016 Earnings Call Presentation Feburary 27, 2017 Disclaimer This presentation does not constitute an offer to sell or issue or the solicitation of an offer to buy or acquire
July 26, 2017 LafargeHolcim Ltd 2015
 Second Quarter 2017 Results Beat Hess, Chairman and Interim CEO Roland Köhler, Interim COO and Regional Head of Europe, Australia/NZ & Trading Ron Wirahadiraksa, CFO July 26, 2017 LafargeHolcim Ltd 2015
2017 Half-Year Results July 28 th, 2017
 2017 Half-Year Results July 28 th, 2017-1 - Disclaimer This presentation does not contain or constitute an offer of securities for sale or an invitation or inducement to invest in securities in France,
Investor and Analyst Presentation. Results Q
 Investor and Analyst Presentation Results Q1-3 2017 Disclaimer Cautionary note regarding forward-looking statements The information contained in this document has not been independently verified and no
Second quarter Vestas Wind Systems A/S. Copenhagen, 17 August Classification: Public
 Second quarter Vestas Wind Systems A/S Copenhagen, 17 August Classification: Public Disclaimer and cautionary statement This document contains forward-looking statements concerning Vestas financial condition,
Saudi Hollandi Bank. Investor Presentation Financial Update Q Q2 Year
 Saudi Hollandi Bank Investor Presentation Financial Update Q2 Year 2014 Q3-2014 800-124-2525 Important notice Disclaimer: The information in this presentation is prepared by Saudi Hollandi Bank. The information
Year of transition for Neways Improvement programme Up to the next level launched across the group
 PRESS CONFERENCE / ANALYST MEETING DATE: TODAY, TUESDAY 23 FEBRUARY 2016 TIME: 10.30 hrs LOCATION: Hotel Casa 400 (Eerste Ringdijk 4, AMSTERDAM) P R E S S R E L E A S E NEWAYS ELECTRONICS INTERNATIONAL
2017 half year results. Amsterdam, 24 August 2017
 217 half year results Amsterdam, 24 August 217 BAM reports 1H17 adjusted result of 52.7 million and reconfirms full year outlook Margin improved to 1.7% on lower revenue Construction and Property: strong
TomTom Q results. Harold Goddijn CEO Marina Wyatt CFO 24 October 2011
 TomTom Q3 2011 results Harold Goddijn CEO Marina Wyatt CFO 24 October 2011 Summary Solid Q3 performance Consumer segment continues to be weak Strong performance of Automotive, Licensing and Business Solutions
Interim report January - June 2015
 Interim report January - June 2015 July 31, 2015 Continued stable earnings and growth Introduction to Hoist Finance Introduction Established in 1994, Hoist Finance is a leading debt restructuring partner
Zumtobel Group AG Q1 2015/16 results
 Zumtobel Group AG Q1 2015/16 results September 8, 2015 1 8 September 2015 Q1 2015/16 results An expected slow start to the FY but on track to meet full year guidance Financials Q1 2015/16 at a glance Group
General Meeting of Shareholders ASR Nederland N.V May, 2018
 General Meeting of Shareholders ASR Nederland N.V. 2018 31 May, 2018 Welcome Kick van der Pol Chair of the Supervisory Board 2 Agenda 1. Opening 2. Annual Report 2017 3. Financial Statements 2017 and Dividend
FY2009 FULL YEAR RESULTS REVIEW
 FY2009 FULL YEAR RESULTS REVIEW Sam Ong Group Deputy CEO & CFO Cho Wee Peng Group EVP & CIO 24 February 2010 Agenda FY2009 Financial Results Review Overview and Key Milestones in FY2009 Looking to FY2010
Financial Ambition 2017 ING Investor Day Patrick Flynn CFO, Member Executive Board ING Group. Amsterdam - 31 March 2014
 Financial Ambition 2017 ING Investor Day Patrick Flynn CFO, Member Executive Board ING Group Amsterdam - 31 March 2014 www.ing.com We entered the final phase to become a pure Bank 2009-2011 2012-2013 2014-2017
Analyst / Investor Presentation Ad-hoc Message November 4, 2013
 Analyst / Investor Presentation Ad-hoc Message November 4, Pierre-Pascal Urbon, CEO Lydia Sommer, CFO November 4, Disclaimer IMPORTANT LEGAL NOTICE This presentation does not constitute or form part of,
INTERIM REPORT Q1 2015
 INTERIM REPORT Q1 2015 HIGHLIGHTS Robust earnings with solid underlying EBITDA in the quarter Strong order intake during the quarter Good project execution and cost control Successful Initial Public Offering
AS MERKO EHITUS 12 months and Q interim report
 AS MERKO EHITUS 12 months and Q4 2018 interim report 14 February 2019 T1 Mall of Tallinn Agenda 1. Key Highlights 5. Stock Exchange Overview 2. Business Review 6. Market Outlook 3. Financial Position 7.
Bekaert First Half 2017 Results
 Bekaert First Half 2017 Results Matthew Taylor, CEO Beatríz García-Cos, CFO 28 July 2017 Bekaert achieves strong sales and profits in H1 2017 - Consolidated sales of 2.1 billion (+15%) and combined sales
TomTom Group. Second quarter 2009 results. Harold Goddijn CEO Marina Wyatt - CFO
 TomTom Group Second quarter 2009 results Harold Goddijn CEO Marina Wyatt - CFO Disclaimer This Presentation has been produced by TomTom N.V. (the Company ) and is furnished to you solely for your information.
Royal BAM Group nv Annual results Analysts meeting Amsterdam, 7 March 2013
 Royal BAM Group nv Annual results 2012 Analysts meeting Amsterdam, 7 March 2013 BAM delivers forecast operational result in tough home markets 2012 net loss 187 million due to impairments in first half
Zumtobel Group AG Q1 2017/ September 2017
 Zumtobel Group AG Q1 2017/18 05 September 2017 Despite stalling growth momentum Group adj. EBIT only slightly below prior year Financials Q1 FY 2017/18 at a glance Group revenues fx-adjusted 0.7% below
Results of the 1 st quarter PHOENIX group 2018/19
 Investor call Results of the 1 st quarter PHOENIX group 2018/19 Helmut Fischer, CFO Mannheim, 26 June 2018 Disclaimer 2018 PHOENIX Pharma SE / PHOENIX PharmahandelGmbH & Co KG This document has been prepared
Results Presentation Q
 Results Presentation Q1-3 2018 Disclaimer Cautionary note regarding forward-looking statements The information contained in this document has not been independently verified and no representation or warranty
Eesti Energia Audited Financial Results for 2016
 Eesti Energia Audited Financial Results for 2016 27 February 2017 Eesti Energia Narva Wind Park, Estonia 2 Disclaimer This presentation and any materials distributed or made available in connection herewith
HAMBURGER HAFEN UND LOGISTIK AG INTERIM RESULTS JANUARY SEPTEMBER 2015
 HAMBURGER HAFEN UND LOGISTIK AG INTERIM RESULTS JANUARY SEPTEMBER 2015 Analyst Conference Call, 12 November 2015 Hamburger Hafen und Logistik AG Disclaimer The facts and information contained herein are
Half year results TKH Group NV
 Half year results 2014 TKH Group NV 1 Half year results 2014 19-08-2014 Content 1 About TKH Group 2 Developments 1 st half year 2014 3 Notes to the results 1 st half year 2014 4 Strategic developments,
H RESULTS PRESENTATION
 H1 2018 RESULTS PRESENTATION 03.09.2018 H1 2018 RESULTS PRESENTATION DISCLAIMER This presentation (the "Presentation") has been prepared and is issued by, and is the sole responsibility of Telepizza Group,
GrandVision reports 2017 Revenue growth of 5.6% and adj. EBITDA of 552 million
 GrandVision reports 2017 Revenue of 5.6% and adj. EBITDA of 552 million Schiphol, the Netherlands 28 February 2018. GrandVision NV (EURONEXT: GVNV) publishes Full Year and Fourth Quarter 2017 results.
Results March Rik De Nolf, Chief Executive Officer Jan Staelens, Chief Financial Officer
 Results 2010 21 March 2011 Rik De Nolf, Chief Executive Officer Jan Staelens, Chief Financial Officer 1 Introductory remark The consolidated financial statements have been prepared in accordance with International
2015 Results Presentation. 14 March 2016
 2015 Results Presentation 14 March 2016 Disclaimer and Basis of Preparation Disclaimer The information set out herein may be subject to updating, completion, revision and amendment and such information
Presentation. 13 May Results first quarter 2009
 Presentation 13 May 2009 Results first quarter 2009 Disclaimer This presentation for the first quarter 2009 is a translation of the Dutch presentation on the consolidated results for the first quarter
B&S Group announces price range of its planned IPO, first trading expected on 23 March 2018
 B&S Group announces price range of its planned IPO, first trading expected on 23 March 2018 Larochette, Luxembourg 12 March 2018 B&S Group S.A. ( B&S Group or the Group ), a fast-growing, global distribution
Key highlights financial results Prudent financial policy
 Key highlights A leading DSO in the Netherlands Integration of Endinet DSO successfully finalized, outperformance on synergies expected Electricity grid outage time among lowest in Europe Update on strategy