Group Presentation. October 2007
|
|
|
- Marjory Holmes
- 5 years ago
- Views:
Transcription

1 Group Presentation October 2007


2 DIVERSIFIED PORTFOLIO OF BUSINESSES, BALANCED MIX WITH MATURE CASH GENERATING BUSINESSES AND HIGH GROWTH, HIGH RETURN BUSINESSSES STRATEGIC INVESTMENTS FINANCIAL INVESTMENTS REAL ESTATE CASINO MINES CONSTRUCTION CONCESSIONS ENERGY & ENVIRONMENT Competitive advantage Long-term investment horizon Sectors with synergies Stabilization of earnings Diversification of risk Short-to-medium-term investment horizon High returns Clear exit strategies Some synergies with strategic investments 1
3 PROFITS ARE NOT JUST GENERATED FROM THE CONSTRUCTION BUSINESS (1/2) Consolidated 1H 2007 Performance, IFRS (, m) ROUNDED CONSTRUCTION CONCESSIONS ENERGY & ENVIRONMENT REAL ESTATE QUARRIES OTHER HOLDINGS TOTAL Net Sales Ν/Α EBIT 12.6 N/A Profit from Associates Net profit Attica Ring Road 10.7 Attica Ring Road Operator 3.7 Other minor -0.6 Equity adjustment for HELLAS GOLD transaction with EUROPEAN GOLDFIELDS HELLAS GOLD profits for the period Casino profits for the period Other minor
4 PROFITS ARE NOT JUST GENERATED FROM THE CONSTRUCTION BUSINESS (2/2) Contribution by line of business excluding non-recurring events*, 1H 2007, IFRS (, m) ROUNDED Revenues EBIT Net profit 100% = % = % = 52 9% 7% 0% 2% 82% 4% 23% 18% 28% 27% 3% 15% 24% Construction 14% 18% 26% Concessions Energy & Environment Real Estate Quarries Other * Excluding 45.1 m for equity adjustment for HELLAS GOLD transaction with EUROPEAN GOLDFIELDS 3


 Expected to generate operating cash")
5 CONSTRUCTION HIGHLIGHTS Dominant position in Greece, sector shaper (initiated round of sector consolidation) Critical size provides economies of scale Inroads in South Eastern Europe and Middle East (~ 28% of total backlog), turning into a regional player Backlog of ~ 5 billion, more than 1 billion in revenues per annum over the next four years Recovery of operating margin (2Q 2007 at 4.6% from 2.7% in 1Q 2007) Expected to generate operating cash flows of 40 m 50 m per annum in the next few years 4
6 HISTORICALLY HIGHEST BACKLOG PROVIDES REVENUE VISIBILITY FOR THE NEXT 5 YEARS Construction Backlog, (, m) Backlog Distribution 100% = 4,848 mil. 1,384 4, ,848 Abroad 28% Greece 2,740 72% Backlog Greece Backlog Abroad Total signed Backlog Expected to be signed* Backlog PANTECHNIKI Total Backlog 23% Buildings Infrastructure (2,252) Buildings (267) Subsidiaries (221) Oman (699) Kuwait (46) Romania (91) Dubai (247) Qatar (238) Abu Dhabi (64) 77% Infrastructure * In
7 RECOVERY IN OPERATING MARGINS Consolidated Construction Financial Statements, IFRS (, m) ROUNDED 1Q Q 2007 % change Net Sales % EBIT % Operating margin recovery primarily due to: EBIT margin 2.7% 4.6% 70% Lower Lower bidding bidding costs costs Lower Lower establishment establishment cost cost associated associated with with penetrating penetrating foreign foreign markets markets 6
8 TARGETING ~ 5% OF OPERATING MARGIN IN THE MEDIUM-TERM BENCHMARKS 2006 FIGURES EBIT Working Capital/Revenue NPP&E/Revenue BOSKALIS 11.3% ACS (CONSTR.) < 0 SKANSKA 10% ACS (CONSTR.) 6.3% VINCI (CONSTR.) < 0 AKTOR 13% AKTOR 5.4% SKANSKA < 0-5% to -15% HOCHTIEF 15% VINCI (CONSTR.) 4.7% BALFOUR BEATTY < 0 BALFOUR BEATTY 25% SKANSKA 3.8% HOCHTIEF < 0 BOSKALIS 51% BALFOUR BEATTY 2.8% BOSKALIS 10% HOCHTIEF 2.3% AKTOR 21% Every 1% in EBIT improvement can add ~ 80 m in value Every 1% reduction in working capital can add ~ 10 m in value Every 1% reduction in NPP&E can add ~ 15 m in value 7
9 CONCESSIONS HIGHLIGHTS Holds significant stakes in the first two PPPs in Greece with expected nominal IRR of ~ 13% Secured participations in four new PPPs in Greece of over 5.3 bn total investment Expanded into parking concessions (~ 2,100 underground parking slots in operation and ~ 1,800 under construction) Accumulated experience in operating toll roads and parking facilities 8

 Expected IRR 13.")
 Debt repaid 65 m Dividend payout to begin in Operator * Post")
10 HIGH RETURN, LOW RISK (1/2) Type of concession Toll ring road in Athens ELTEB participation 39.17% 59.2%* Total length 65.2 km Start of operations (partial) March 2001 End of concession September 2024 Total investment 1,244 m (431 state contr., 174 equity, 639 loan) Expected IRR 13.1% Average daily traffic ~ 300,000 vehicles 2006 revenue 223 m (1H 2007, 121 m) 2006 net profit 47 m (1H 2007, 27 m) Debt repaid 65 m Dividend payout to begin in Operator * Post Pantechniki deal completion 2012 ATTIKES DIADROMES (31.3% ELTEB) 47.4%* 9


 Average daily traffic 12,100 vehicles 2006 revenue 43 m")

11 HIGH RETURN, LOW RISK (2/2) Type of concession Toll bridge ELTEB participation 15.77% 20.7%* Total length 2,252 m Start of operations August 2004 End of concession 2039 Total investment 839 m (400 state contr., 65 equity, 370 loan**) Debt repaid 20 m Expected IRR 11.5% (real) Average daily traffic 12,100 vehicles 2006 revenue 43 m 2006 net profit 8.5 m Dividend payout to begin in Operator * Post completion of the Pantechniki deal ** Plus 4 m interest from surplus cash 2007 GEFYRA LEITOURGIA* (15.77% ELTEB) 20.7%* 10

12 CONTROLLING STAKES IN TWO NEW CONCESSIONS (1/2) KORINTHOS-TRIPOLI-KALAMATAKA & LEFKTRO-SPARTI Total length of motorway 205 km MOREAS Consortium 13.33% 13.33% ELTEB PANTECHNIKI INTRACOM 73.34% Total investment ~ 1billion* Group s equity/quasi equity investment 10% 10% Equity 44% 46% State financial contribution Debt Concession period 30 years Construction period 4.5 years Concession contract signed on 31/1/07 Exploitation of tolls on existing sections begins 4 months after concession commencement Expected nominal IRR ~ 10% * Construction budget 865 mn Concession commenced 11

13 CONTROLLING STAKES IN TWO NEW CONCESSIONS (2/2) THESSALONIKI SUBMERGED TUNNEL THERMAIKI ODOS Consortium 17.5% Total length of Submerged Tunnel 7 km 32.5% 50% Total Investment ~ 470 million* ELTEB ARCHIRODON BOSKALIS Group s equity/quasi equity investment 13% 13% Equity 66% 21% State financial contribution Debt * Construction budget 345 mn ** Including operator Concession period 30 years Construction period 4 years Concession contract signed on 31/10/2006 Expected nominal IRR 10%** Concession commenced 12

14 MINORITY STAKES IN TWO NEW CONCESSIONS (1/2) MALIAKOS-KLEIDI OLYMPIA ODOS / AEGEAN Consortium 10% 5% 20% Total length of motorway 230 km 16.25% 13.75% 35% ELTEB HOCHTIEF VINCI J&P AEGEK ATHINA Total Investment ~ 1 billion* Group s equity/quasi equity investment 10% 10% 68% 22% Equity State financial contribution Debt Concession period 30 years Construction period 4.5 years Exploitation of tolls on existing sections begins immediately upon concession commencement Expected nominal IRR ~14% * Construction budget 718 mn Expected commencement date 1Q

15 MINORITY STAKES IN TWO NEW CONCESSIONS (2/2) KORINTHOS-PATRA-PYRGOS-TSAKONA Rio-Antirio Bridge Total length of motorway 379 km APION KLEOS Consortium 3% 18% 18% 25% ELTEB HOCHTIEF VINCI J&P ATHINA 36% Total Investment ~ 2.8 billion* Group s equity/quasi equity investment 7% 7% 18% Equity State financial contribution Debt 75% * Construction budget 2.1 bn Concession period 30 years Construction period 6 years Exploitation of tolls on existing sections begins immediately upon concession commencement Expected nominal IRR ~14% Expected commencement date 1Q


 with worldwide known")
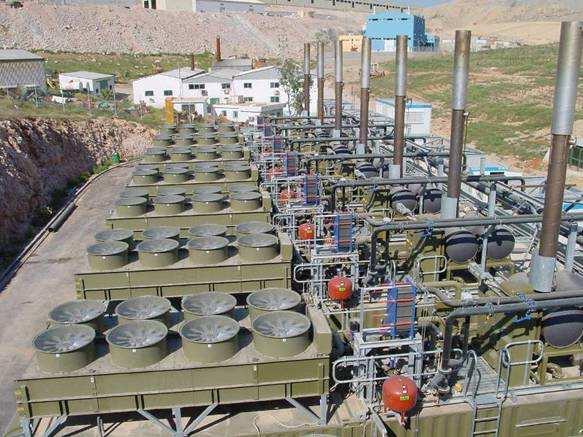
16 ENERGY AND ENVIRONMENT HIGHLIGHTS ~ 60 MW of installed capacity in full operation by end of 2006 ~ 30 MW of wind parks ~ 30 MW of biogas plants ~ 170 MW of wind parks in development expected to be in operation by end of 2009 Secured additional production licenses of ~ 200 MW to be developed beyond 2009 Market leader in Greece and Cyprus in waste mgmt Waste mgmt of the Athens 2004 Olympic Games Know-how in developing & operating: Landfills, Incinerators, Recycling plants Acquisition of the HERHOF technology (Germany) with worldwide known patented technology 15

17 FOR EVERY 1 MW OF WIND CAPACITY INSTALLED ~ 1.4* m IN SHAREHOLDER VALUE IS CREATED End of Year Installed Base High priority areas for the installation of wind parks ELTEB wind parks in operation ELTEB wind parks under development 2006A 2007E 2008F 2009F 22 MW Wind capacity installed (MW) ,3 MW 9 MW Biogas capacity installed (MW) HPA 13,6 MW Key Figures 30,6 MW 60,8 MW 31,5 MW 7,8 MW CAPEX / MW Equity / MW (20% CAPEX) 1.1 m 0.22 m Range of Equity value / MW 1.4 m 1.8 m Annual revenue/mw wind ,3 MW Annual revenue/mw biogas Wind parks EBIT margin 75% - 80% Biogas EBIT margin 40% - 45% * At locations with wind speeds > 7 m/s Corporate Development 16

18 ANOTHER ~400MW OF RENEWABLES IN EARLY STAGE OF DEVELOPMENT ~300 MW WIND PARKS 200 MW with production permits 100 MW to file for production permits before the end of 2007 ~20 MW PHOTOVOLTAIC PARKS 6 applications for 17 MW have been filed for production permits Additional applications excluded from the permit process to be filed in August, 2007 ~80 MW WASTE-TO-ENERGY 1 application for 20 MW has been filed for production permit 2 more applications for ~ 60 MW to be filed 17

")


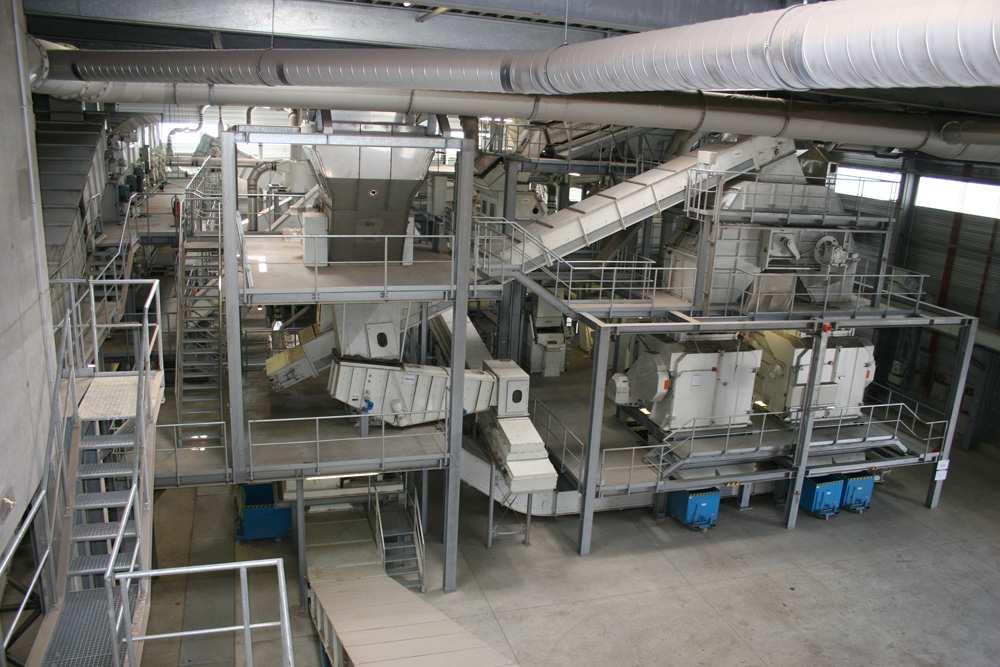
19 WASTE MANAGEMENT (1/2) Collection Transportation Treatment & Recycling Disposal Construction and operation of waste treatment (MSW* and commercial waste) plants in Germany HERHOF technology deployed in Europe: >30 composting plants and 7 MBT** plants Leader in construction and operation of sanitary landfills in Greece and Cyprus 7 landfills in Greece 2 landfills in Cyprus * Municipal Solid Waste ** Mechanical Biological Treatment 18
20 WASTE MANAGEMENT (2/2) Collection Transportation Treatment & Disposal Recycling Value Creation Construction Operation Landfills / Transfer stations Composting plants MBT plants Biological Treatment plants Backlog > 100 m Signed Contract Revenues > 330 m MBT plant (Germany) Hospital waste incinerator (Greece) Landfill (Cyprus) Landfill + Recycling plant (Cyprus) Incinerators Expected Revenue, (, m) 2006A 2007E 2008F Revenue


21 REAL ESTATE HIGHLIGHTS Developed commercial and entertainment centers and residential complexes in Greece Expanded into Romania acquired land for commercial and residential development Sold two commercial centers in Patras and Athens for a total price of ~ 40 m Secured a 70 m deal with a foreign real estate developer for one of its biggest real estate assets in Kantza Secured a 13 m deal with MCARTHURGLEN for its asset in Gyalou 20
22 GROUP REAL ESTATE ASSETS REDS* main assets YALOU KANTZA 300 K sqm 301 K sqm REDS Market cap 158 m % ELTEB 50.83% 2 plots in Bucharest Office buildings in Athens 40 K sqm 20 K sqm Value of REDS assets for the Group 80 m ELTEB main assets + Office buildings Athens Land in Athens ~ 10 K sqm 46 K sqm Value of ELTEB real estate assets 60 m Land in Ioannina 25 K sqm Land in Kantza Land in Gyalou 40 K sqm 36 K sqm Total value 140 m * Has recently sold out its two commercial centers (Athens, Patras) for 40 m and has MOUs for its other two main assets 21
 Tables will increase to 110 and slot machines to 1,500 at steady state Kassandra Mines 19.")
23 OTHER HOLDINGS Athens Mont Parnes Casino 1H 2007 casino revenues and EBIT amount to ~ 96.5 m and ~ 29.7 m respectively Expected to reach ~ 250 million in revenue and ~ 75 million in EBITDA at steady state (2009) Tables will increase to 110 and slot machines to 1,500 at steady state Kassandra Mines 19.9% stake in EUROPEAN GOLDFIELDS and 5% in HELLAS GOLD, the company that operates the Kassandra mines in Chalkidiki, in a concession area of ~ 317 million m 2. There are three mines: Stratoni, total capacity 14.4 Moz silver, 0.2 Mt lead and 0.3 Mt zinc (in operation) Skouries, total capacity 5.0 Moz gold and 1.04 Mt copper (under development) Olympias, total capacity 4.3 Moz gold, 60 Moz silver, 0.6 Mt lead and 0.8 Mt zinc (under development) 1H 2007 revenues of ~ 31.5 m and EBIT of ~ 13.9 m 22
24 SHAREHOLDING STRUCTURE* 16.03% Marketability ( 000 shares), 1/10/ % 32.57% Avg. last 12 months Avg. last 6 months Avg. last 3 months Avg. last 1 month 44.66% Major Shareholders Greek Institutional Investors Foreign Institutional Investors Retail * As of Agust
Group Presentation. August 2009
 Group Presentation August 2009 TABLE OF CONTENTS 1. Group overview 2. Undisputed leader in the Greek construction sector 3. Leading player in Greek concessions 4. Waste Management Services 5. Significant
Group Presentation. April 2013
 Group Presentation April 2013 Recent Developments / FY2012 Financial Highlights 9eld0029 2 In the current difficult economic environment, group results are stabilising : Group revenues increased by 2.4%
Group Presentation. December 2013
 Group Presentation December 2013 Recent Developments / 9M2013 Financial Highlights The agreements for the re-initiation of the suspended BOT projects of Argean Motorways and Olympia Odos have been submitted
Group Presentation. November 2012
 Group Presentation November 2012 Recent Developments / 9M2012 Financial Highlights 9M2012 financial highlights Group revenues in 9M 2012 reached 869.9 ml, decreased by 10.1% mainly as a result of lower
Group Presentation. September 2012
 Group Presentation September 2012 Recent Developments / 6M2012 Financial Highlights 6M2012 financial highlights Group revenues reached 596.5 ml, decreased by 14.1% mainly as a result of lower revenues
1H 2015 Group Results 31/8/2015
 1H 2015 Group Results 31/8/2015 1H 2015 highlights Increased macroeconomic and political uncertainty negatively affected the group s 6M2015 results and are likely to affect its prospects for 2015 extended
ANNUAL FINANCIAL REPORT
 ANNUAL FINANCIAL REPORT for the financial year January 1 st to December 31 st 2009 (according to the article 4 of the L.3556/2007 and the article 2 of the decision 7/448/11.10.2007 of the Hellenic Capital
Group Presentation. December 2014
 Group Presentation December 2014 Recent Developments / 9M2014 Financial Highlights Acceleration of construction backlog execution in the 3 rd Quarter 2014 resulted in increased Group revenues of 1,080.5
Group Presentation. May 2015
 Group Presentation May 2015 Recent Developments / 1 st Q 2015 Financial Highlights Group consolidated revenues increased by 29.2% to 377.9 ml ( vs 292.5 ml in 1Q 2014) mostly on the back of accelerated
6M2017 Group Results 14/9/2017
 6M2017 Group Results 14/9/2017 6M2017 highlights 6M2017 Highlights : in August 2017 construction at Olympia Odos and Maliakos was concluded, and the BOT projects are now fully operational in June 2017
Group Presentation. April 2014
 Group Presentation April 2014 Recent Developments / 2013 Financial Highlights The restructuring of the suspended BOT projects was successfully completed in December 2013 - the agreements were ratified
ANNUAL FINANCIAL REPORT for the financial year January 1 st to December 31 st 2008
 ANNUAL FINANCIAL REPORT for the financial year January 1 st to December 31 st 2008 (according to the article 4 of the L.3556/2007 and the article 2 of the decision 7/448/11.10.2007 of the Hellenic Capital
GEK TERNA GROUP. Group presentation
 GEK TERNA GROUP Group presentation GEK TERNA Group: Business Divisions Business Divisions Energy Concessions Construction Real Estate Supplementary activities (Industrial Products, Quarries) 2 GEK TERNA
GEK - TERNA GROUP. Group presentation
 GEK - TERNA GROUP Group presentation GEK - TERNA Group: Overview GEK and TERNA group holds one of the leading positions in Construction, Energy, Real Estate and Concessions, in Greece GEK is the parent
GEK TERNA GROUP. Group presentation
 GEK TERNA GROUP Group presentation GEK TERNA Group: Business Divisions Business Divisions Energy Concessions Construction Real Estate Supplementary activities (Industrial Products, Quarries) 2 GEK TERNA
Presentation of the Group
 The world s leading infrastructure developer Presentation of the Group Key figures & Global Strategy July 2012 Grupo ACS The world s leading infrastructure & concessions developer Engineering contractor
GEK TERNA GROUP. Group presentation
 GEK TERNA GROUP Group presentation GEK TERNA Group: Business Divisions Business Divisions Energy Concessions Construction Industrial Real Estate 2 GEK TERNA Group: Overview GEK TERNA is the parent company
Presentation to Investors. December 2013
 Presentation to Investors December 2013 Who we are Engineering contractor and greenfield developer Revenues 2012 > 38 bn Current Backlog 67 bn Civil Engineering Industrial Engineering Construction Environment
J&P AVAX S.A. Interim Condensed Financial Reporting
 J&P AVAX S.A. Interim Condensed Financial Reporting From January 1 st, 2011 to June 30th, 2011 J&P AVAX S.A. Company Registry # 14303/06/Β/86/26 16 Amarousiou-Halandriou Street, 151 25, Marousi, Greece
MANAGEMENT REPORT OF THE BOARD OF DIRECTORS OF AKTOR SA ON THE FINANCIAL STATEMENTS OF THE YEAR ENDED 31 DECEMBER 2014
 MANAGEMENT REPORT OF THE BOARD OF DIRECTORS OF AKTOR SA ON THE CONSOLIDATED AND SEPARATE FINANCIAL STATEMENTS FOR THE YEAR FROM 1 JANUARY TO 31 DECEMBER 2014 AKTOR SA CONSTRUCTION COMPANY 25 ERMOU STR.
SIX-MONTH FINANCIAL REPORT
 SIX-MONTH FINANCIAL REPORT (pursuant to Article 5 of Law 3556/2007) 25 ERMOU ST - 145 64 KIFISSIA Tax Registration No.: 094004914-TAX OFFICE FOR SOCIÉTÉS ANONYMES SA Reg. No: 874/06/Β/86/16 100065 G.E.MI.
Strategic Review Financial Highlights. Business opportunities. Results by business
 March 2004 Strategic Review 2003 Financial Highlights Business opportunities Results by business Conclusions A Construction & Services Market Reference # 1 in Spanish Construction # 1 in Industrial Services
The world s leading infrastructure developer. April 2012
 The world s leading infrastructure developer Investors Presentation Company profile, strategy and key financials April 2012 Grupo ACS The world s leading infrastructure developer Engineering contractor
J&P Avax. Hefty upside, but no catalysts. Greece, Construction. June 4, 2010
 Greece, Construction J&P Avax Hefty upside, but no catalysts June 4, 2010 Current price 1.45 Target price 5.40 From 6.50 Upside potential 272.4% Remains Outperform Key data Reuters code AVAr.AT Bloomberg
J&P Avax. No catalyst in sight remains cheap. Greece, Construction. April 8, 2010
 Greece, Construction J&P Avax No catalyst in sight remains cheap April 8, 2010 Current price 2.03 Target price 6.50 From 6.40 Upside potential 220.2% Remains Outperform Key data Reuters code AVAr.AT Bloomberg
Exane BNP Paribas 2005 European Seminar Paris, 9 June Antoine ZACHARIAS, CEO of VINCI Christian LABEYRIE, CFO of VINCI
 Exane BNP Paribas 2005 European Seminar Paris, 9 June 2005 Antoine ZACHARIAS, CEO of VINCI Christian LABEYRIE, CFO of VINCI 4 business lines operating in synergy CONSTRUCTION Project management Building
Corporate Presentation
 Corporate Presentation Group Structure 100% 38/50/25% * 100% 100% 100% Construction Energy Production* Concessions Real Estate Mining * 38% participation in TE, 50% ownership in the first plant (HERON
ANNUAL FINANCIAL REPORT
 ANNUAL FINANCIAL REPORT For the fiscal year from 1 January to 31 December 2015 (pursuant to article 4 of Law 3556/2007 and article 2 of the Decision 7/448/11.10.2007 of the Capital Market Commission s
Corporate Presentation
 Corporate Presentation Group Structure 100% 40/50/25% * 100% 100% 100% Construction Energy Production* Concessions Real Estate Mining * 40% participation in TE, 50% ownership in the first plant (HERON
INTERIM FINANCIAL REPORT
 INTERIM FINANCIAL REPORT For the period from 1 January to 30 June 2015 (pursuant to article 5 of Law 3556/2007 and article 4 of Decision 7/448/11.10.2007 of the Capital Market Commission BoD) ELLAKTOR
INTERIM FINANCIAL REPORT
 INTERIM FINANCIAL REPORT For the period from 1 January to 30 June 2012 (pursuant to article 5 of Law 3556/2007 and article 4 of Decision 7/448/11.10.2007 of the Capital Market Commission BoD) 25 ERMOU
ANNUAL FINANCIAL REPORT
 ANNUAL FINANCIAL REPORT For the financial year from 1 January to 31 December 2017 (pursuant to article 4 of Law 3556/2007) 25 ERMOU ST - 145 64 KIFISIA Tax Registration No.: 094004914- TAX OFFICE FOR SOCIÉTÉS
ROADSHOW USA - June 2001
 ROADSHOW USA - June 2001 1 This presentation has been prepared by VINCI for information purposes only. It is based on sources we believe to be reliable but neither its accuracy nor completeness is guaranteed.
FRANCISCO REYNÉS Vice-Chairman & CEO
 FRANCISCO REYNÉS Vice-Chairman & CEO Vision of Abertis Today 2015 results Strategic Plan 2015-17: Follow-up Conclusions 2015 ADT +6.1% EBITDA ( Mn) 913 Comparable +8% Capex ( Mn) 87 ACHIEVEMENTS Improved
ANNUAL REPORT 2005 Athens, June 2006
 ANNUAL REPORT 2005 Athens, June 2006 TABLE OF CONTENTS 1. REPORT OF THE BOARD OF DIRECTORS...7 1.1 OVERVIEW OF ACTIVITIES...7 1.2 Significant events for the financial year 2005...8 1.3 2005 Results and
ELLINIKI TECHNODOMIKI TEB GROUP ANNUAL REPORT 2007
 ELLINIKI TECHNODOMIKI TEB GROUP ANNUAL REPORT 2007 Kifissia, June 2008 THIS PAGE IS BLANK ON PURPOSE (1) / (178) TABLE OF CONTENTS COMPANY OVERVIEW...7 1. INFORMATION ON THE COMPILATION OF THE ANNUAL REPORT
J&P AVAX S.A. Interim Financial Report for the period from. January 01 to June 30, 2008
 J&P AVAX S.A. Interim Financial Report for the period from January 01 to June 30, 2008 J&P AVAX S.A. Company Registry # 14303/06/Β/86/26 16 Amarousiou-Halandriou Street, 151 25, Marousi, Greece INDEX OF
J&P Avax. 2Q10 preview. Greece, Construction. August 20, 2010
 Greece, Construction J&P Avax 2Q10 preview August 20, 2010 Current price 1.47 Target price 5.40 From 5.40 Upside potential 267.3% Remains Outperform Key data Reuters code AVAr.AT Bloomberg code AVAX GA
AKTOR SA CONSTRUCTION COMPANY 25 ERMOU STR KIFISIA Tax ID No.: Tax Office: ATHENS FABE SA Reg. No. 8153/01ΑΤ/Β/86/355/05
 MANAGEMENT REPORT OF THE BOARD OF DIRECTORS OF AKTOR SA ON THE CONSOLIDATED AND SEPARATE FINANCIAL STATEMENTS FOR THE YEAR FROM 1 JANUARY TO 31 DECEMBER 2013 AKTOR SA CONSTRUCTION COMPANY 25 ERMOU STR.
J&P Avax. 3Q10 preview. Greece, Construction. November 19, 2010
 Greece, Construction J&P Avax 3Q10 preview November 19, 2010 Current price 1.28 Target price 4.20 From 4.20 Upside potential 228.1% Remains Outperform Key data Reuters code AVAr.AT Bloomberg code AVAX
Ordinary General Shareholders' Meeting of
 Ordinary General Shareholders' Meeting of 8 May 2018 Speech by the CEO Marcelino Fernández Verdes Introduction Fellow shareholders, good morning and many thanks for attending this General Shareholders'
HELECTOR GROUP. Annual Financial Statements in line with the International Financial Reporting Standards for the year ended 31 December 2013
 HELECTOR GROUP Annual Financial Statements in line with the International Financial Reporting Standards for the year ended 31 December 2013 ENERGY & ENVIRONMENTAL APPLICATIONS 25 ERMOU STR. - 145 64 KIFISSIA
ASTM GROUP Investor Presentation 2018
 ASTM GROUP Investor Presentation 2018 2 ASTM GROUP DISCLAIMER This document (the document ) has been prepared by ASTM Group (the Company ) for the sole purpose described herein. Under no condition should
ANNUAL FINANCIAL REPORT
 ANNUAL FINANCIAL REPORT For the year from 1 January to 31 December 2012 (pursuant to article 4 of Law 3556/2007 and article 2 of Decision 7/448/11.10.2007 of the Capital Market Commission BoD) ELLAKTOR
SEMI ANNUAL FINANCIAL REPORT
 SEMI ANNUAL FINANCIAL REPORT For the period January 1 st till June 30 2008 (According to article 5 of L. 3556/2007 and article 4 of the Decision 7/448/11.10.2007 of the BoD of the Capital Market Commission)
ΟΜΙΛΟΣ ΗΛΕΚΤΩΡ HELECTOR S.A.
 Board of Directors Annual Report & Statements prepared in accordance with the International Financial Reporting Standards, for the financial year ended 31 December 2016 HELECTOR S.A. ENERGY & ENVIRONMENTAL
Acquisition of EGF November 14, 2014
 Acquisition of EGF November 14, 2014 Framework of the transaction Acquisition of EGF Deal: Privatization of 95% of EGF (remaining 5% were attributed to employees) Price: 147 M for 95% stake of EGF (includes
2005 interim results. 7 September 2005 analysts meeting
 2005 interim results 7 September 2005 analysts meeting Very good 1st half of 2005 Key figures In millions 1st half of 2004 1st half of 2005 Change 05/04 Net sales 9,086 10,051 +10.6% Operating profit from
ATTIKI ODOS SA ATTIKI ODOS SA KM OF ATTIKI ODOS PEANIA Tax ID No.: Ο.Υ.: ATHENS FABE. SA Reg.No /04/B/96/43(02)
") Annual Financial Statements prepared according to the 41.9 KM OF ATTIKI ODOS 190 02 PEANIA Tax ID No.: 094421389.Ο.Υ.: ATHENS FABE SA Reg.No. 35711/04/B/96/43(02) Table of Contents INDEPENDENT CERTIFIED
Annual Financial Statements prepared according to the 41.9 KM OF ATTIKI ODOS 190 02 PEANIA Tax ID No.: 094421389.Ο.Υ.: ATHENS FABE SA Reg.No. 35711/04/B/96/43(02) Table of Contents INDEPENDENT CERTIFIED
Kepler Cheuvreux Autumn Conference. Paris, 18 September 2014
 Kepler Cheuvreux Autumn Conference Paris, 18 September 2014 2014 first half highlights Berjaya Central Park (Kuala Lumpur) 2014 first half: a solid economic performance on a global scale Group revenue
Meeting 17 July 2000
 Meeting 17 July 2000 1 Antoine Zacharias Chairman of VINCI Jérôme Tolot Chief Operating Officer and Member of the Board of GTM Group 2 What is the alliance strategy of choice in the construction business?
Fitter for the Future Strategic Update
 Fitter for the Future Strategic Update 2017-21 Chairman s remarks Global strategic overview Significant market opportunity Basarab Overpass in Bucharest, Romania Naples underground (Toledo Station), Italy
Results Presentation th of February, 2014
 Results Presentation 2013 28 th of February, 2014 Executive Summary Consolidation of Global Leadership Good Operating Results Net Profit > 700 Financial structure reinforced HOCHTIEF Restructuring 2 ACS
ACS gains 388 million euros of net profit in the first half of 2016
 ACS gains 388 million euros of net profit in the first half of 2016 Sales reached 16,387 million euros, 5.3% lower in a like for like basis adjusted by currency impacts and the sale of renewable assets
6M 2007 IFRS FINANCIAL RESULTS. PRESENTED BY: CEO Mr. E. MYTILINEOS CFO Mr. I. DIMOU
 6M 2007 IFRS FINANCIAL RESULTS PRESENTED BY: CEO Mr. E. MYTILINEOS CFO Mr. I. DIMOU 1 Agenda Conference Call Highlights Group Financial & Operating Highlights Key Performance Indicators Summary Financial
6M 2007 IFRS FINANCIAL RESULTS. PRESENTED BY: CEO Mr. E. MYTILINEOS CFO Mr. I. DIMOU
 6M 2007 IFRS FINANCIAL RESULTS PRESENTED BY: CEO Mr. E. MYTILINEOS CFO Mr. I. DIMOU 1 Agenda Conference Call Highlights Group Financial & Operating Highlights Key Performance Indicators Summary Financial
2012 LONDON STAR Conference. London, 2 3 October 2012
 2012 LONDON STAR Conference London, 2 3 October 2012 1 1 ASTALDI is the largest Contractor in Italy, operating only in large infrastructures at worldwide level Construction RoW 42% ( 4.2Bn) Construction
2005 FINANCIAL RESULTS. PRESENTED BY: CEO Mr. E. MYTILINEOS CFO Mr. I. DIMOU
 2005 FINANCIAL RESULTS PRESENTED BY: CEO Mr. E. MYTILINEOS CFO Mr. I. DIMOU 23/02/2006 1 Disclaimer This presentation contains an announcement of expected results (guidance) for 2006. The Company s Administration
Interim condensed financial information in accordance with International Accounting Standard 34 for the period from 1 January to 30 September 2018
 Interim condensed financial information in accordance with 25 ERMOU ST - 145 64 KIFISIA Tax Registration No: 094004914 ATHENS TAX OFFICE FOR SOCIÉTÉS ANONYMES Société Anonyme Registration No: 874/06/Β/86/16
1 st H 2006 IFRS FINANCIAL RESULTS. PRESENTED BY: CEO Mr. E. MYTILINEOS CFO Mr. I. DIMOU
 1 st H 2006 IFRS FINANCIAL RESULTS PRESENTED BY: CEO Mr. E. MYTILINEOS CFO Mr. I. DIMOU 03/08/2006 1 Agenda A. Group Financial & Operating Highlights B. Key Performance Indicators Appendices i. Group History
Net Profit in the first semester of 2014 grew by 10.7% up to 395 Euro million
 Net Profit in the first semester of 2014 grew by 10.7% up to 395 Euro million Sales stand at 18,759 Euro million, 83.8% of them from abroad. Net debt of the Group accounts for 5,812 Euro million, showing
IFC s Approach to Solid Waste
 IFC s Approach to Solid Waste IFC Who We Are, What We Do Deep Industry Experience 2 IFC is a Member of the World Bank Group IBRD International Bank for Reconstruction and Development IDA International
Press Release. Paiania, 24 September 2018 INTRACOM HOLDINGS (ATHEX: INTKA) announces financial results for H1 2018, according to IFRS.
 announces financial results for H1 2018, according to IFRS.") Press Release INTRACOM HOLDINGS Group: Redefines the structure of participations and activities, and reports stable levels of sales and EBITDA with increased profitability. Consolidated turnover of 200,7
Press Release INTRACOM HOLDINGS Group: Redefines the structure of participations and activities, and reports stable levels of sales and EBITDA with increased profitability. Consolidated turnover of 200,7
Bank of America Merrill Lynch Construction and Building Materials Conference
 THE INFRASTRUCTURE BUSINESS Bank of America Merrill Lynch Construction and Building Materials Conference 12 October 2011 Forward-looking statements This announcement may include certain forward-looking
HALF-YEAR FINANCIAL REPORT
 HALF-YEAR FINANCIAL REPORT For the period from 1 January to 30 June 2018 (In accordance with article 5 of Law 3556/2007) ELLAKTOR S.A. 25 ERMOU ST - 145 64 KIFISIA Tax ID No.: 094004914 - ATHENS TAX OFFICE
Financial RepoRt FoR the FiRSt HalF-YeaR of 2009
 Financial Report FOR THE FIRST HALF-YEAR OF 2009 summary Management report for the first half-year of 2009 1 Condensed interim consolidated financial Statements at 30 June 2009 9 Financial statements 11
Analysts and Investors Conference Full year results 2011 February 29, 2012 Dr Frank Stieler, CEO Peter Sassenfeld, CFO. Turning Vision into Value.
 Analysts and Investors Conference Full year results 2011 February 29, 2012 Dr Frank Stieler, CEO Peter Sassenfeld, CFO 2011: a year of transition and challenges Earnings problems at Leighton Changes in
Daring to Shape our Future Equity Story
 Daring to Shape our Future Equity Story September 2014 Implenia at a glance Implenia is the leading construction company in Switzerland. well diversified covering the whole range of construction and construction
ANNUAL FINANCIAL REPORT. for the period
 TERNA SOCIETE ANONYME TOURISM TECHNICAL SHIPPING COMPANY 85 Mesogeion Ave., 115 26 Athens General Commerce Reg. No. 8554301000 S.A. Reg. No. 56330/01/Β/04/506(08) ANNUAL FINANCIAL REPORT for the period
Hellas Group 3nd Quarter 2007 Results. November 15, 2007
 Hellas Group 3nd Quarter 2007 Results November 15, 2007 Forward looking statement This presentation includes forward-looking statements. These forward-looking statements include all matters that are not
ΟΜΙΛΟΣ ΗΛΕΚΤΩΡ HELECTOR S.A.
 Board of Directors Annual Report & Statements prepared in accordance with the International Financial Reporting Standards, for the financial year ended 31 December 2017 HELECTOR S.A. ENERGY & ENVIRONMENTAL
Building our Future. Investor Presentation. September Efemçukuru Gold Mine, Turkey
 Building our Future Investor Presentation September 2015 Efemçukuru Gold Mine, Turkey Forward Looking Statement Certain of the statements made in this Presentation may contain forward-looking statements
FY16 Results Presentation
 Muskrat Falls Hydro Plant, Canada FY16 Results Presentation March 14, 2017 Agenda Warsaw subway Line 2, Poland 2016 Highlights Q4 & FY16 results Appendix 2 Fit for the Future our Strategy Plan Sustainable
Grupo ACS net profit in 2011 totals EUR 962 million
 Grupo ACS net profit in 2011 totals EUR 962 million Turnover grew up to EUR 28,472 million, a 98.7% increase. International turnover now accounts for 72.5% of the total. The Grupo ACS ordinary net profit
Roadshow March financial statements
 Roadshow March 2007 2006 financial statements Contents Internal environment Highlights Financial statements at 31 December 2006 VINCI business lines Outlook for 2007 Appendixes Internal environment Corporate
2007 financial statements
 2007 financial statements Analysts meeting 28 February 2008 Yves-Thibault de Silguy Chairman of the Board of Directors Xavier Huillard Director and CEO Christian Labeyrie Executive Vice-President and CFO
Infrastructure. Services 3Q2011 EARNINGS REPORT. Energy
 Infrastructure 3Q2011 EARNINGS REPORT Services Energy 1. HIGHLIGHTS 2 2. EXECUTIVE SUMMARY 3 3. SUMMARY BY BUSINESS AREA 4 4. INCOME STATEMENT 6 5. BALANCE SHEET 9 6. CASH FLOW 12 7. BUSINESS PERFORMANCE
Using Fuzzy Logic to Pattern Spot across Megaproject Cases. Dr. Athena Roumboutsos Business School Dpt Shipping Trade & Transport
 Using Fuzzy Logic to Pattern Spot across Megaproject Cases Dr. Athena Roumboutsos Business School Dpt Shipping Trade & Transport Introduction Ws Fuzzy Logic Linguistic Variables Small Application Megaproject
Paris, London, New York May 2011
 2011 Spring Roadshow Paris, London, New York May 2011 Disclaimer This presentation may contain forward-looking objectives and statements about VINCI s financial situation, operating results, business activities
Roadshow September - October 2002
 Roadshow September - October 2002 A major player in concessions, construction and related services Satisfactory first-half results in line with full-year targets Targets confirmed for full-year 2002 2
Astaldi. Italian Investment Seminar April 27, 2005
 Astaldi Italian Investment Seminar April 27, 2005 1 2004-2006 2006 Plan 2005-2009 2009 Plan >> The strong operating capacity of the Group, both in Italy and abroad, as proven by: The efficacy of 2004-2006
JOINT SHAREHOLDERS MEETING. 11 September 2000
 JOINT SHAREHOLDERS MEETING 11 September 2000 1 Why an alliance VINCI-GTM Significant presence of both groups in non cyclical activities Combining local expertise with a global approach to service large
Skanska. Building profitable growth
 Skanska Building profitable growth 1 We are Skanska 2 Skanska Investment Story Skanska is a world leader Construction and Project Development Focused on selected home markets in the Nordics, other European
UAE-Russia Infrastructure & Public-Private Partnership Investment Focus. October 2014
 UAE-Russia Infrastructure & Public-Private Partnership Investment Focus October 2014 About Gazprombank Gazprombank at a Glance General Information Asset Growth Third largest bank in Russia by assets, equity,
Applicability of Spanish PPP experience to Russian market
 Applicability of Spanish PPP experience to Russian market Fernando Gutiérrez de Vera Chairman of SEOPAN Concessions Commission 21 October 2008 1 What is SEOPAN? The Association of Major Spanish Contractors
Results Report 1H14 1H14. 29th August, Non Audited Figures 1
 Results Report 29th August, 2014 Non Audited Figures 1 INDEX 1 Executive Summary 3 1.1 Main figures 3 1.2 Relevant facts 4 2 Consolidated Financial Statements 6 2.1 Income Statement 6 2.1.1 Sales and Backlog
Business Plan Business Plan
 1 : the scenario The takes account of changes in the domestic scenario, such as: Change in Italian Government and consequent redefinition of public expenditure priorities, causing a slowdown in construction
Creating a Uniquely Global and Integrated Infrastructure Group. October 2017
 Creating a Uniquely Global and Integrated Infrastructure Group 1 October 2017 Agenda 1. Transaction Overview 2. Rationale for the Combination 3. Profile of the New HOCHTIEF 4. Key takeaways for ACS 2 Strategic
Skanska. Building profitable growth
 Skanska Building profitable growth 1 We are Skanska 2 Skanska Investment Story Skanska is a world leader Construction and Project Development Focused on selected home markets in the Nordics, other European
RESULTS PRESENTATION. 1 st HALF 2010
 RESULTS PRESENTATION 1 st HALF 2010 HIGHLIGHTS ECONOMIC AND FINANCIAL ANALYSIS REVENUES AND EBITDA ANALYSIS BY SEGMENT - METALLIC CONSTRUCTION - RENEWABLE ENERGY CAPEX NET DEBT ANNEXES 2 HIGHLIGHTS Analysis
2014 first half results. 1 August 2014
 2014 first half results 1 August 2014 Disclaimer This presentation may contain forward-looking objectives and statements about VINCI s financial situation, operating results, business activities and expansion
ACS gains 233 million euros, 6% more, in the first quarter of 2017
 ACS gains 233 million euros, 6% more, in the first quarter of 2017 Sales increased by 11.2% up to 8,357 million euros Backlog increases by 15.0% up to 68,092 million euros in March 2017 Net debt decreases
Equity Research. Update: MYTILINEOS ELVO Consolidation Expected in 2003
 Greece Equity Research July 29, 2003 120 General Index MYTILINEOS /[MYTIL GA] BUY 100 80 60 KEY DATA Price: 4.62 Mkt Cap: 187m Shares Outstanding: 40,520,340 40 20 Mytilineos 52-week high low:
BAUER Aktiengesellschaft
 BAUER Aktiengesellschaft Group Presentation First Quarter 2011 Foundation works in Jakarta, Indonesia 11-5-13 IR-Presentation_AnalystConference_Q12011 BAUER AG, D-86529 Schrobenhausen Key Figures FY 2010
2012 Results Presentation. Madrid, February 27, 2013
 2012 Results Presentation Madrid, February 27, 2013 Any declaration made in this presentation that may differ from previous past figures made in reference to, but not limited to; the operational development,
Infrastructure West Finance Forum
 Equity and M&A: Excess supply for few projects Adam Nicolopoulos, President and CEO Infrastructure West Finance Forum July 9, 2013 How are we doing in the US? Needed investment: $454 billion/yr Estimated
Madrid, February 25 th, 2011
 Madrid, February 25 th, 2011 This document contains forward-looking statements on the intentions, expectations or forecasts of Grupo ACS or its management at the time the document was drawn up and in reference
MARFIN INVESTMENT GROUP FINANCIAL RESULTS: Q1 2015
 MARFIN INVESTMENT GROUP FINANCIAL RESULTS: Q1 2015 Return to profitability at the level of consolidated EBITDA from business operations 1 for the 1st quarter of the year, despite seasonality: 18.6m profit
Profile of the Group in 2015
 A 0 Profile of the Group in 2015 Obrascón Huarte Lain (OHL) ranks among the leading international concession and construction groups, with more than 100 years of experience and an outstanding presence
Paris roadshow. 12 September 2003
 Paris roadshow 12 September 2003 Despite a mediocre business environment First-half marked by exceptional events: International tension War in Iraq SARS A generally poor business climate aggravated by