Group Presentation. April 2014
|
|
|
- Christine Casey
- 5 years ago
- Views:
Transcription


1 Group Presentation April 2014
2 Recent Developments / 2013 Financial Highlights The restructuring of the suspended BOT projects was successfully completed in December the agreements were ratified by the parliament of the Hellenic Republic and signed by all parties involved - current mobilisation of project sites to undertake construction works Group figures stabilised in revenues reached 1,241.8 ml (0.7% increase vs 2012) - operating profit (EBIT) amounted to 76.0 ml that includes however, real estate valuation adjustments ( 41.9 ml) and provisions from the RES New Deal and the RES tax levy ( 11.9 ml) - EBIT adjusted for the above items amounted to ml (increased by c. 11% vs 2012) Results after tax before minorities were losses of 49.0 ml, negatively impacted by deferred taxation charges ( 25 ml) and tax provisions on tax-free reserves ( 5.4 ml) The Group s liquidity position improved significantly with corporate related Net Debt reducing to ml (as of 31/12/2013) vs ml as of 31/12/ mainly due to improved liquidity position in construction The Group s funding risk significantly decreased with the completion of the refinancing at ELLAKTOR ( ml) and AKTOR Concessions ( 170 ml) through long term secured syndicated bank facilities Total construction backlog stands at ~ 3.0 bn (with another ~ 1.3 bl of contracts pending signature) 9eld0029 2
3 Key Investment highlights Leading infrastructure player in Greece with an increasing international footprint Significant values from participation in Eldorado Gold / Hellas Gold Well-balanced diversified portfolio of activities Growth prospects in Waste Management and Renewable Energy Unrivalled construction knowhow (backlog c. 3bn) Strong expected dividend stream from mature concessions (i.e. Attiki Odos) 9eld0029 3
4 Table of contents 1. Group overview Pages 5~8 2. Undisputed leader in the Greek construction sector Pages 9~11 3. Leading player in Greek concessions Pages 12~15 4. Market leader in Waste Management Services Pages 16~18 5. Significant growth prospects in the Energy sector Pages 19~21 6. Real Estate & Other Investments Pages Group financials & Shareholder information Pages 23~29 9eld0029 4
5 Key milestones in the ELLAKTOR Group history 1950 s & 1960 s Establishment of TEB, ELLINIKI TECHNODOMIKI and AKTOR Concession for ATTIKI ODOS and RION-ANTIRION Bridge signed Merger of TEB, ELLINIKI TECHNODOMIKI and AKTOR Entry in the Waste Management sector (HELECTOR) Acquisition of a stake in HELLAS GOLD First international construction contracts awarded in Romania and the Middle East (Kuwait) Participation in 3 out of 5 concession projects awarded in Greece 2007 Acquisition of PANTECHNIKI, leading to controlling stake in ATTIKI ODOS (59.2%) Concession activities spun off as AKTOR CONCESSIONS Swapped a 30% stake in HELLAS GOLD with a 20% stake in EUROREAN GOLDFIELDS Change of name from ELLINIKI TECHNODOMIKI TEB SA to ELLAKTOR SA Commencement of MOREAS, OLYMPIA ODOS and AEGEAN MOTORWAY concessions HELECTOR SA - AKTOR SA - AKTOR CONCESSIONS SA has signed contract for the project Construction and Operation of the Household Waste Management System in Saint Petersburg Final EIS (Environmental Impact Study) of HELLAS GOLD approved by the Ministry of Environment & Climate Change, on 26th of July 2011 Sale of a 7.07% stake in EGU to Qatar Holding (Oct.2011) 2012 European Goldfields ( EGU ) absorbed by Eldorado Gold ( ELD ) (21st February 2012) 9eld0029 5


 (1) As of 28 th of March 2014 9eld0029 6")
6 Ellaktor Group organisational structure Construction Concessions Waste management Energy Real estate Other holdings 100% AKTOR SA 100% AKTOR CONCESSIONS 95% HELECTOR SA 86% ELLINIKI TECHNODOMIKI ANEMOS 21.95% ELPEDISON POWER 55.46% REDS 15.3% HELLENIC CASINO OF PARNITHA No 1 in Greece No 1 in Greece Leader in Greece & Cyprus Significant growth prospects 4,264 full time employees with activities in more than 18 countries Listed on the ASE with a market capitalization of ~ 703 ml (1) (1) As of 28 th of March eld Ellaktor is the leading, diversified, regional infrastructure player
7 Ellaktor Group key financials (Amounts in ml) Revenues EBIT (1) (2) (3) Profit Before Tax Net profit after Minorities eld Notes : (1) 2013 Operating Profit (EBIT) includes real estate valuation adjustments of 41.9 ml and provisions from the RES New Deal and the RES tax levy of 11.9 ml (2) 2012 Operating Profit (EBIT) includes profit from the sale of Eldorado shares of 19 ml and provisions for doubtful receivables of 13 ml (3) 2011 Operating profit (EBIT) includes profit from the sale of a 7.07% stake in EGU to Qatar Holdings and from reclassifying the remaining participation in EGU and Hellas Gold as financial assets available for sale, provisions for doubtful receivables and adjustments for revised profitability of construction backlog
8 Ellaktor Group key financials (continued) (Amounts in ml) Total assets Total equity Net debt Corporate net debt (1) Notes : (1) Excluding debt and cash / cash equivalents of non recourse BOT related projects 9eld0029 8
, is the undisputed market leader in Greece with unmatched")


 OTHER Revenues include all Groups activities FY2013")
9 Construction segment overview 60 years in construction AKTOR SA, (a 100% subsidiary), is the undisputed market leader in Greece with unmatched technical know-how Emphasis on building our international backlog also due to the current Greek sovereign debt crisis ~ 31% of backlog is international (mostly Middle East and Europe) Key priorities Stabilizing operating margins Accelerate backlog execution Pending finalisation of on-going negotiations on construction work allocation (Olympia Odos and Aegean Motorway) OTHER Revenues include all Groups activities FY2013 Construction revenues : 893 ml 9eld0029 9
 Backlog by geography 2,974 1,903 BOT projects")
 3,17 613 2 2.558 2,471 620 1.851 785 1.271 3,005 669 647 2.335 2.")
10 Construction backlog at 3bn as of with another ~ 1.3bn of projects that remain to be signed Backlog Analysis by sector ( ml) Backlog by geography 2,974 1,903 BOT projects restructured * * Pending finalisation of on-going negotiations on construction work allocation , , Backlog Evolution ( ml) 3, , , Backlog Blue City To be signed 9eld
11 Construction Backlog : Selective projects Infrastructure Projects Building Projects BOT * Key current Greek projects Project Participation Amount (%) ( ml) Thessaloniki's Metro-Extension to Kalamaria 100% 370 Structure and Technical works in Chalikidi Mines 100% 94 ERGOSE Project: Rododafni-Psathopyrgos, Panagopoula's Tunnel 43% 137 ERGOSE Project: Lianokladi - Domokos 100% 44 Construction 2nd phase of Thriasio Complex 65% 26 Egnatia Highway: Koromilia -Krystalopigi (Kozani) 60% 32 New Port in Patras 100% 19 Distribution networks PPC 100% 18 Settlement of steam Eshatia (Attiki) 100% 7 Psittaleia STP: Operation and Maintenance 48% 5 Stylida's Deviation 50% 16 Expansion of Macedonia Airport 30% 7 North Road section in Crete 100% 3 Hania Airport : Extension-Plants 100% 44 Chalkida General Hospital 75% 28 Lefkada General Hospital 75% 15 National Gallery 100% 15 Airport Expansion Building in Ioannina 100% 14 National Museum of modern art 100% 8 Hospital Evagelismos:new surgical area 100% 6 Korinthos -Tripoli - Kalamata (Moreas) 71.67% 56 Elefsina - Patra - Tsakona (Olympia) 17% 423 Maliakos - Kleidi (Aegean) 19.3% 68 * Pending finalisation of on-going negotiations on construction work allocation Europe Gulf Region & Other countries Key current International projects Project Participation Amount (%) ( ml) Railway line Micasasa-Coslariu Simeria, Sect Brasov-Simeria (RO) 51% 71 Design & Build of National Road 18 Baia (RO) 100% 32 Highway E80, LOT2 Road and Bridges at Stanicenje (SR) 100% 73 Highway E80 Section Crvena Reca-Ciflic (SR) 100% 18 Highway Ε80, LOT2 Bancarevo, Crvena Reca (SR) 50% 36 Road Section Tirane -Elbasan SEGI & III (ALB) 49% 4 Hydroelectric projects in Albania 100% 17 Highway LOT4 Struma (BG) 100% 18 Highway Demir Kapija Smokvica (FYROM) 100% 172 Waste processing plant in Saint Petersburg (RU) 30% 65 Mostar wastewater Treatment Plant (BiH) 100% 10 Wastewater Treatment Plant Bacau (RO) 100% 8 Project Development of Internal Security Force Camp at Al Duhail (Qatar) Construction of Multipurpose Hall at SADD Sports Package 2 MainWorks (Qatar) Participation Amount (%) ( ml) 50% % 73 Banana Island Resort Village (Qatar) 100% 1 New Doha International Airport BUATC (Qatar) 40% 17 Wastewater Treatment Plan IZMIR (TUR) 51% 2 9eld
 Participates in the three out of five major concession projects under construction in Greece (Moreas, Olympia Odos and Aegean Motorway) The last two have been")

12 Concessions segment overview AKTOR CONCESSIONS S.A., a 100% subsidiary of ELLAKTOR, is the largest concession holder in Greece Holds mature assets (59.2% in Attiki Odos and 22.0% in Rion-Antirrion Bridge) Participates in the three out of five major concession projects under construction in Greece (Moreas, Olympia Odos and Aegean Motorway) The last two have been successfully restructured in December 2013, after more than two-years long discussions, following the reduction in traffic all over Greece due to the macroeconomic crisis of the country. The restructuring involved, among others, an increase in the State s contribution using EEC funds, a reduction in the scope of the project in the case of Olympia Odos and a resolution of all long pending matters. Participates in concessions of 6,800 parking spaces (5,000 already in operation) Selectively pursuing new opportunities with strategic partners, integrating necessary skills and expertise for successful project delivery and carefully managing its investment exposure. Current tenders include: international concession projects (Romanian motorway BOTs in a consortium with Vinci & Strabag (Preferred Bider in Comarnic-Brasov Motorway), waste PPP mandate in St. Petersburg, Russia) Greek Privatization Program opportunities (incl. Thessaloniki Water Supply & Sewerage Co. in partnership with Suez Environment and Regional Airports in partnership with Vinci Airports) Greek PPPs, primarily focusing on waste management together with HELECTOR (preferred bidder for the Western Macedonia waste PPP, prequalified for Agrinio, Achaia, Eperous, Attica, Eastern Macedonia-Thrace waste PPPs) 12
13 Overview of ELLAKTOR s Concession portfolio Ioannina Gefyra Igoumenitsa (Rion Antirrion Bridge) In operation since ,7bn contract price 22% stake Olympia Odos (Athens Corinth - Patra - Highway) Conditional Patra to Tsakona Under construction (completed 43,2%) 1,34bn contract price after restructuring 17% stake Larissa Trikala Karditsa Lamia Patra Aegio Korinthos Tripoli Sparta Kalamata Athens Aegean Motorway (Maliakos Klidi Highway) Under construction (76,58% completed) 1,02bn contract price 20% stake Attiki Odos (Athens Ring Road) In operation since ,2bn contract price 59% stake Moreas (Korinthos Tripoli Kalamata Highway) Under construction (91% completed) 0,85bn contract price 72% stake 9eld

 2.7ml (provisional) 2004 GEFYRA LEITOURGIA: 23.1% Note: (1) 8.")
14 Operating Concessions assets Low risk mature assets with high expected dividend streams Type of concession AKTOR Concessions (%) Total length Commencement of operation End of concession Toll ring road in Athens 59.2% 65.2Km March 2001 September 2024 Toll bridge 22.0% 2.3Km (1) August 2004 December 2039 Total investment 1,310ml 839ml Average daily traffic (2013) 2013 revenue 2013 net profit First Net Profit Year Operator ~200,561 vehicles 162,4ml 20,8ml 2012 ATTIKES DIADROMES: 47.4% ~8,685 vehicles 33,4ml (provisional) 2.7ml (provisional) 2004 GEFYRA LEITOURGIA: 23.1% Note: (1) 8.2 Km total length, which includes access bridges, toll plaza and the connections with the national roads network 9eld


15 Concessions under Construction... Moreas is nearing completion (expected within 2014). The Aegean Motorway and the Olympia Odos projects have been restructured, with the new construction schedule extended up to the end of 2015, beginning 2016 Type of concession AKTOR Concessions (%) Motorway Korinthos-Tripoli-Kalamata & Sparti-Lefktro 71.67% Motorway Maliakos - Kleidi 20.00% Motorway Elefsina -Korinthos-Patra (Pyrgos Tsakona) 17.00% Other Shareholdings 15.00% J&P-Avax 13.33% Intracom 35.00% Hochtief 13.75% Vinci 16.25% J&P-Avax 10.00% Aegek 5.00% Athina 29.90% Vinci 17.00% Hochtief 17.00% J&P-Avax 17.00% Gek Terna 2.10% Athina Total length 205 Km 230 Km 201 Km Commencement of operation March 2008 March 2008 August 2008 Restructured Dec Dec Duration of concession 30 Years 30 Years 30 Years Total investment 1.0bn 1.7bn 2.1bn Average daily traffic (2013) ~41,266 vehicles ~58,477 vehicles ~49,690 vehicles Operator The Concessionaire The Concessionaire OLYMPIA ODOS LEITOURGIA (shareholdings as in concession company) 9eld

16 Overview of Waste Management Services ( HELECTOR ) HELECTOR SA, a 94.4% subsidiary of the ELLAKTOR Group, is the market leader in Waste Management and Waste-to-Energy sectors in Greece and Cyprus while at the same time dynamically expanding abroad extensive know-how in designing, developing, operating and maintaining integrated waste management facilities, landfills, incinerators and sorting plants own worldwide patented technologies for Mechanical Biological Treatment (MBT) the largest landfill biogas producer in Europe with 30MW in operation and ~10MW under development Total HELECTOR backlog: Exceeding 270 ml Recurring operational revenue : ~ 62 m p.a. Significant prospects in Greece a number of Concession / PPP projects in Greece are in tender stage / expected to be tendered Already announced preferred bidder for the W. Macedonia PPP project (1 st Waste Management PPP project to be tendered) moving forward to financial close. Participating in 5 Competitive Dialogue procedures and in 3 PQ Significant prospects internationally signed a Waste Management PPP contract in St. Petersburg (Russia) (capacity 350,000 t/a pa) Recently signed a contract for the WM project of Sofia, Bulgaria (one of the biggest projects in Europe at the moment - capacity 410kt / a) Executing two projects in Croatia (WM plants & residual landfill), one in Slovenia (WM plant) and one in Jordan (landfill rehabilitation & biogas exploitation) More prospects expected in Cyprus (Nicosia & Limassol) 9eld
 % of BMW (1) land-filled in 2007 vs 1995 (1) Biodegradable Municipal Waste Source: Eurostat 2009 Promising potential in Greece")
17 Overview of the Waste Management market... the Greek market has better growth prospects compared to its EU peers 200.0% 175.0% 150.0% 125.0% 100.0% 75.0% 50.0% 25.0% 0.0% 9eld EU Municipal Waste Treatment, 2007 (% of total waste) % of BMW (1) land-filled in 2007 vs 1995 (1) Biodegradable Municipal Waste Source: Eurostat 2009 Promising potential in Greece from a move towards waste treatment (vs. landfill disposal) and power generation from biogas Concession / PPP pipeline WM projects in Greece includes W. Macedonia - 120k tons p.a. (Announced Preferred Bidder) Aitoloakarnania 110k tons p.a.(cd phase) Attica projects (4) 1,355κ tons p.a. (2 CD phase 2 PQ phase completed) Patras 150k tons p.a. (CD phase) Ioannina 150k tons p.a. (Bid phase) E. Macedonia - Thrace 155k tons p.a. (PQ phase) Corfu projects - ~ 100k tons p.a. (approved by PPP Secretariat) Thessaloniki 400k tons p.a. (Tender Pending) On a regional basis, market prospects are also promising given low market penetration in South Eastern Europe and the Balkans, where HELECTOR is already making inroads (Bulgaria, Slovenia, Croatia, Skopje, Russia, Lithuania) while also targeting the Turkish market PQ Prequalification CD Competitive Dialogue PB = Preferred Bidder
18 Current Waste Management Portfolio Project type Landfill & Leachate Treatment plants Construction & Management Mechanical Biological Plants Hospital Waste Mgt Plants Recycling Plants Waste to Energy Plants Wind Energy Description Location Country Capacity Ownership Status Comments Construction of Landfill Ano Liossia, Attica Greece 2,000 kt/y n/a Restoration - Construction of Landfill Fyli, Attica Greece 2,500 kt/y n/a Under construction - Construction of Landfill Tagarades, Salonica Greece 720 kt/y n/a Restoration - Construction of Landfill Mavrorachi, Salonica Greece 540 kt/y n/a Operation - Construction of Landfill Livadia Greece 50 kt/y n/a Under construction - Construction of Landfill Thiva Greece 70 kt/y n/a Under construction - Construction of Landfill Limnos Greece 40 kt/y n/a Operation - Management of Landfill Pafos Cyprus 70 kt/y 100% Operation 10-year concession since 2005 Management of Landfill Larnaka Cyprus 50 kt/y 100% Operation 10-year concession since 2010 Management of leachate treatment plant Fyli & A. Liossia Greece 750 m 3 /day 100% Operation 6 years operation contract Management of leachate treatment plant Pafos Cyprus 230 m 3 /day 100% Operation 6 years operation contract Herhof Recycling Osnabrueck Osnabrueck Germany 105 kt/y 100% Operation 17-year concession since 2006 Berlin MBT Berlin Germany 180 kt/y n/a Operation Turnkey for third party Trier MBT Trier Germany 180 kt/y n/a Operation Turnkey for third party Larnaka MBT Larnaka Cyprus 220 kt/y 100% Operation 10-year concession since 2010 Imathia MBT Vergina, Imathia Greece 100 kt/y 100% Contract signed 25-year concession A. Liossia Recycling & Compost Plant Attica Greece 300 kt/y 70% Contract signed 3+3 -year operation contract 1 st completed, Anaerobic Digestion Plants Schloßvippach, Kessel, Ulzen, Dorpen Germany Total 89 kt/y n/a 2 nd -3 rd under construction - Croatia MBT Plants Mariscina & Kastijun Croatia Total 190 kt/y n/a Contract signed Turnkey for third party Apotefrotiras (Hospital Waste Incinarator) Ano Liossia, Attica Greece 12 kt/y 70% (a) Operation 9-year concession since 2007 Fyli Recycling Plant Fyli, Attica Greece 100 kt/y n/a Operation Private Investment Koropi Recycling Plant Koropi, Attica Greece 75 kt/y n/a Operation Private Investment BEAL : Landfill biogas-fired plant (b) Ano Liossia, Attica Greece 23.5 MW 50% (c) Operation 20-year PPA since 2004 Tagarades : Landfill biogas-fired plant Tagarades, Salonica Greece 5.0 MW 100% Operation 20-year PPA since 2007 Fyli : Landfill biogas-fired plant Fyli, Attica Greece 10 MW 100% Production license Awarded in 2009 Jordan : Landfill biogas-fired plant Amman Jordan Up to 6 MW 100% Contract signed Turnkey for third party + 5y operation Aeiforiki Dodekanisou Rhodes, Kos, Patmos Greece 7.8 MW 99.5% Operation 20-year PPA since eld Note: (a) Remaining 20% controlled by Arsi SA; 10% by Polyeco (b) Largest in Europe (c) Remaining 50% controlled by EDL
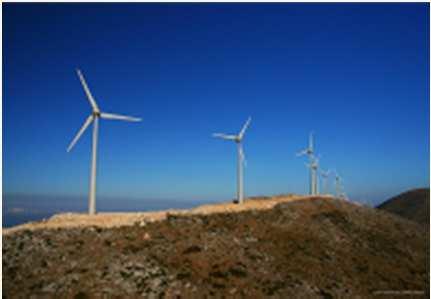
19 Renewables segment ( ELTECH Anemos )... favourable framework, for a growing market that faces however limitations in financing Regulatory framework RES must cover 20% of total energy consumption & 40% of electricity by 2020 Prospective target capacity of wind and solar generated power in Greece until 2020: 7,500 MW and 2,200 MW respectively New Deal (regarding RES, Law 4254/ ) is expected to gradually remove uncertainty in the regulatory framework and gradually resolve the liquidity issues of System Operators LAGIE / DEDDIE Among others the New Deal envisages for Wind: extension of PPAs for 7 years (total years) for existing projects in operation during the last 12 years) Wind tariffs reduced by c. 5-7% (wind tariffs range between /MWh depending on location and availability or not of CAPEX subsidy) credit invoice for 10% of 2013 Wind RES revenues CAPEX subsidies 20% to 40% (Law 3299/2004) valid for applications until 31/12/2013 ELLAKTOR entered the renewable energy sector in 2000 through its 86% subsidiary ELTECH Anemos Total installed capacity: is 171 MW (12 wind farms, 1 photovoltaic plant and 1 SHPP) 60 MW are currently under construction Execution model design, development and supervision in-house maintenance and daily operations outsourced Greece will continue to be our base market and we will explore attractiveness of foreign markets Future development of RES projects depends on the availability of financing Tracking of technological advances in RES is key core focus remains on wind, including offshore wind parks open to other RES technologies Excellent relations with wind turbine suppliers 9eld
 or on tariff /MWh ~ 1.30ml 0.32ml 0.52 ml 82 86 /MWh 92 93 /ΜWh 0.26ml 0.52ml / MW Overview of ELTECH Anemos portfolio Yearly Average Wind Speed 0-4 m/sec 4.")

20 RES assets overview and key economics Wind Project Key Economics CAPEX/MW Equity/MW (25% - 40% CAPEX) Tariffs : Interconnected Non interconnected Subsidies : Either on CAPEX (20%-40%) or on tariff /MWh ~ 1.30ml 0.32ml 0.52 ml /MWh /ΜWh 0.26ml 0.52ml / MW Overview of ELTECH Anemos portfolio Yearly Average Wind Speed 0-4 m/sec m/sec m/sec m/sec Evaluation for Production Permit Production License (RAE) Environmental License Installation License Under Construction Operation m/sec m/sec m/sec > 10 m/sec Operating Under Construction Installation License Production License & Environmental Terms Evaluation for Production Permit 9eld
 and Halcor (1.")

21 ELLAKTOR also has a ~ 22% stake in Elpedison Power Ellaktor is present in the thermal electricity generation sector through Elpedison Power, the 2 nd largest electricity producer in Greece Following the agreement signed in July 2008, HE&D owns a 22.74% stake of Elpedison Power set up together with the Hellenic Petroleum/Edison Joint Venture (75.78%) and Halcor (1.48%) Elpedison Power, aims at enhancing its generation portfolio and remain a key player in the Greek electricity market: 1 gas-fired 390MW CCGT in operation in Thessaloniki 1 gas-fired 420MW CCGT in operation in Thisvi ELLAKTOR HE&D HE&D and Halcor jointly have the institutional minority rights INTRACOM 96.56% 3.44% 24.22% Halcor HELLENIC PETROLEUM ELPEDISON POWER Thessaloniki Power (390MW) Thisvi Power (420MW) Other Assets/Activities Elpedison 75.78% EDISON 50% 50% Enhancement of its portfolio through acquisition of electricity generation assets expected to be privatized Further power generation opportunities considered in Greece and the Balkans 9eld

22 Real Estate REDS ELLAKTOR holds a 55.46% stake in R.E.D.S. SA Listed on ASE with a market cap : 39m (28/3/2014) REDS enjoys a high quality Property portfolio (~ 120,3 m, Book Value at 31/12/2013) Smart Park is operational as of 20/10/2011 Signed leases for 97% of GLA Long term project funding in place Kantza Mall Project : Town planning design procedure is under way. Project approval by the Ministry of Culture in place. Project s Geological Design approval is expected. Villa Cambas listed building permit is expected Other Investments MONT PARNES CASINO ELLAKTOR holds an indirect 15.3% stake in Hellenic Casino Parnitha Non-core asset Initial investment : 33 ml Dividends received to date : 20ml Other shareholders - Regency Entertainment : 35.7% - Greek State: 49.0% Revamping of facilities is underway Tables: 61 (of which 11 in VIP area) slot machines: ~660 ELLAKTOR 30% GOLD ELLAKTOR holds 1.1% in ELDORADO GOLD ( ELD *) 95% owner of Hellas Gold 5% of HELLAS GOLD *ELD is listed on Toronto and NYSE, with ~4.6 bn CAD$ (~3.1 bn ) market cap (28/3/2014) REGENCY ENTERTAINMENT 70% 2013 Key financials revenues: 94.7ml profit after tax: 2.7ml GREEK STATE ATHENS RESORT CASINO AE 51% 49% ATHENS MONT PARNES CASINO AE 9eld
23 Consolidated P&L FY2013 (IFRS in ml) (Amounts in ml) 31/12/ /12/2013 Change (%) Revenues 1, , % EBITDA % EBITDA margin (%) 17.7% 14.7% EBIT % EBIT margin (%) 9.3% 6.1% Profits/ (Loss) from Associates % Profit/ (Loss) before Tax % Profit Before Tax margin (%) 4.7% 1.3% Profit/ (Loss) after Tax before Minorities % Net Profit/ (loss) after Minorities % Earnings/ (Loss) per share (1) Notes : (1) Weighted average number of shares : 172,431,279 (2012 and 2013) Revenues marginally increased to 1,241.8 ml with increased revenues in Environment ( 13 ml) and Wind ( 5 ml) that absorbed the revenue decrease in Concessions (~ 12 ml) Group Operating Profit (ΕΒΙΤ) was 76.0 ml that includes however : real estate valuation adjustments ( 41.9 ml) provisions from the RES New Deal and the RES tax levy ( 11.9 ml) EBIT adjusted for the above items amounted to ml (increased by c. 11% vs 2012) Profit before tax reached 15.6 (vs 58.1 ml as of 2012 After tax (before minorities) the group reported losses of 49.0 ml vs profits of 32.4 ml in 2012, negatively affected by increased deferred taxation of ~ 25 ml (as a result of the corporate tax rate increase from 20% to 26% mainly impacting Attiki Odos) and provisions for tax-free reserves of 5.4 ml 9eld
24 Consolidated Balance Sheet (IFRS in ml) (Amounts in ml) 31/12/ /12/2013 Change (%) Intangible assets 1, , % Property, plant and equipment % Financial assets available for sale (1) % Financial assets held to maturity (1) % Receivables (2) 1, , % Other non-current assets % Other current assets % Cash (incl. restricted cash) % Total Assets 4, , % Total Debt 1, , % Other Short Term Liabilities % Other Long Term Liabilities % Total Liabilities 3, , % Shareholders Equity 1, , % Financial assets available for sale decreased from ml to 77.0 ml to mainly due to fair value adjustment of the Eldorado stake Real Estate Investments and Real Estate in Fixed Assets include a valuation adjustment of 41.9 ml The decrease of financial assets held to maturity (~ 78 ml) was absorbed by the increase in cash ( 110 ml) Total receivables (short-term and long-term) excluding deposits longer than 3 months decreased to 1,030.9 ml (from 1,091.4 ml as of 31/12/2012) Total equity excl. minorities decreased by ~ 74 ml mainly as a result of real estate valuation adjustments losses due to increased taxation and the fair value adjustment of the Eldorado stake Shareholders Equity (excluding minorities) % Notes: (1) Includes both current and non current assets (2) Receivables as of 31/12/2012 and 31/12/2013 include time deposits over 3 months of ml and 43.9 ml respectively 9eld
25 Consolidated Cash Flows (IFRS in ml) (Amounts in ml) 31/12/ /12/2013 Cash Flows from Operating Activities Cash Flows from Investment Activities Cash Flows form Financing Activities Net increase / (decrease) in cash and cash equivalent Cash equivalents at start of period Cash equivalents at end of period (1) Positive operating cash flows of ml Net Cash inflows from investment activities amounted to 74.0 ml and include - Inflow of ~ 57 ml from converting time deposits over 3 months to cash - Inflow of ~ 60 ml mainly from net inflows from financial assets held to maturity - capex of ~ 74 ml Construction: ~ 13 ml Concessions : ~ 44 ml (mainly Moreas) Wind Farms: ~ 14.5 ml Real Estate : ~ 1.5 ml Environment: ~ 1 ml Cash outflows from financing activities amounted to outflows of ml Notes : (1) Does not Include restricted cash (31/12/2012: 81.8 ml and 31/12/2013: 83.5 ml), time deposits over 3 months (31/12/2012: ml and 31/12/2013 : 43.9 ml) and bonds held to maturity (31/12/2012: ml and 31/12/2013 : 80.3 ml) 9eld
26 Segmental analysis of FY2013 Results (IFRS in ml) (Amounts in ml) Construction & Quarries Real Estate Concessions Environment Wind Farms Other Total Revenues ,241.8 EBITDA EBITDA margin (%) 5.4% nm 60.6% 18.3% 60.1% nm 14.7% EBIT EBIT margin (%) 3.0% nm 29.8% 11.9% 34.1% nm 6.1% Profit before Tax Profit before Tax margin (%) 2.1% nm 17.2% 12.9% 12.5% nm 1.3% Net Profit (before minorities) Net Profit margin (before minorities) (%) 1.2% nm -4.9% 6.9% 9.6% nm -3.9% Net Profit (after minorities) eld
27 Segmental analysis of FY2012 Results (IFRS in ml) (Amounts in ml) Construction & Quarries Real Estate Concessions Environment Wind Farms Other Total Revenues ,232.8 EBITDA EBITDA margin (%) 5.4% -20.4% 57.1% 30.0% 65.8% nm 17.7% EBIT EBIT margin (%) 2.6% -41.2% 30.4% 22.1% 41.4% nm 9.3% Profit before Tax Profit before Tax margin (%) 1.4% -76.6% 21.0% 21.3% 14.9% nm 4.7% Net Profit (before minorities) Net Profit margin (before minorities) (%) 0.6% -94.2% 16.1% 14.5% 11.9% nm 2.6% Net Profit (after minorities) eld

28 Ellaktor s debt profile ( ml, as of )... refinancing at ELLAKTOR and AKTOR Concessions was concluded in December 2013 reducing refinancing risk Ellaktor s key debt statistics Debt maturity profile + + = - = Long-term debt: 1,409.6 Short-term debt: Total debt: 1,657.5 Non Recourse Debt Corporate related Debt = Cash & Liquid Assets (1) 1,023.1 Non recourse related Cash & Liquid Assets Corporate related Cash Corporate related Net debt : Shareholder s equity: 1,150.4 Total capital (2): 1,505.2 Capital leverage ratio: 23.6% Corporate related Net Debt (1) / Gearing ratio (2) 31,3% 31,2% 29,0% 22,8% 23,6% 563,7 596,0 12,9% 513,2 372,3 354,8 174,9 31/12/ /12/ /12/ /12/ /12/ /12/ % 50% 40% 30% 20% 10% 0% (1) Includes Cash, Restricted Cash, Time deposits over 3 months, bonds held to maturity (2) Total equity + net debt Source: Company financial statements Net Debt Gearing Ratio Notes : (1) Corporate related Net Debt = (Short and Long Term Debt excluding BOT related Debt) [Cash and Liquid Assets (i.e. Cash & Cash Equivalents, Restricted Cash, Time deposits over 3 months under receivables, bonds held to maturity) but excluding Cash and Liquid Assets of BOT related projects) (2) Gearing ratio = Corporate related Net Debt / (Equity + Corporate Related Net Debt) 9eld
 CONSTRUCTION ELLAKTOR Greek Institutional Investors 12,84% Foreign Institutional Investors 18,08% 90,00 70,00 50,00 30,00 10,00 ATHEX 30% 25% ELLAKTOR share weighting on")
29 Share price performance and shareholder structure Shareholder structure (March 2014) Retail 31,34% Treasury 2,58% Management Team 35,16% 170,00 150,00 130,00 110,00 Share price performance LTM (28/3/2013 ~ 28/3/2014) CONSTRUCTION ELLAKTOR Greek Institutional Investors 12,84% Foreign Institutional Investors 18,08% 90,00 70,00 50,00 30,00 10,00 ATHEX 30% 25% ELLAKTOR share weighting on Indices (31/3/2014) 25,33% -10,00 20% 15% 10% Reuters ticker: HELr.AT Bloomberg ticker: ELLAKTOR:GA 5% 3,40% 2,29% 0% ASE General Index Construction Index FTSE Large Cap Index 9eld
30 Contact details Anastassios Kallitsantsis Chairman of the Board of Directors Stergios Pitoskas Investor Relations Antony Hadjioannou Treasurer ELLAKTOR S.A. 25, Ermou St., GR Nea Kifissia, Greece Athens TEL.: FAX: website: 9eld
Group Presentation. December 2013
 Group Presentation December 2013 Recent Developments / 9M2013 Financial Highlights The agreements for the re-initiation of the suspended BOT projects of Argean Motorways and Olympia Odos have been submitted
Group Presentation. December 2014
 Group Presentation December 2014 Recent Developments / 9M2014 Financial Highlights Acceleration of construction backlog execution in the 3 rd Quarter 2014 resulted in increased Group revenues of 1,080.5
Group Presentation. April 2013
 Group Presentation April 2013 Recent Developments / FY2012 Financial Highlights 9eld0029 2 In the current difficult economic environment, group results are stabilising : Group revenues increased by 2.4%
Group Presentation. May 2015
 Group Presentation May 2015 Recent Developments / 1 st Q 2015 Financial Highlights Group consolidated revenues increased by 29.2% to 377.9 ml ( vs 292.5 ml in 1Q 2014) mostly on the back of accelerated
Group Presentation. November 2012
 Group Presentation November 2012 Recent Developments / 9M2012 Financial Highlights 9M2012 financial highlights Group revenues in 9M 2012 reached 869.9 ml, decreased by 10.1% mainly as a result of lower
Group Presentation. September 2012
 Group Presentation September 2012 Recent Developments / 6M2012 Financial Highlights 6M2012 financial highlights Group revenues reached 596.5 ml, decreased by 14.1% mainly as a result of lower revenues
Group Presentation. August 2009
 Group Presentation August 2009 TABLE OF CONTENTS 1. Group overview 2. Undisputed leader in the Greek construction sector 3. Leading player in Greek concessions 4. Waste Management Services 5. Significant
Group Presentation. October 2007
 Group Presentation October 2007 DIVERSIFIED PORTFOLIO OF BUSINESSES, BALANCED MIX WITH MATURE CASH GENERATING BUSINESSES AND HIGH GROWTH, HIGH RETURN BUSINESSSES STRATEGIC INVESTMENTS FINANCIAL INVESTMENTS
1H 2015 Group Results 31/8/2015
 1H 2015 Group Results 31/8/2015 1H 2015 highlights Increased macroeconomic and political uncertainty negatively affected the group s 6M2015 results and are likely to affect its prospects for 2015 extended
6M2017 Group Results 14/9/2017
 6M2017 Group Results 14/9/2017 6M2017 highlights 6M2017 Highlights : in August 2017 construction at Olympia Odos and Maliakos was concluded, and the BOT projects are now fully operational in June 2017
ANNUAL FINANCIAL REPORT
 ANNUAL FINANCIAL REPORT for the financial year January 1 st to December 31 st 2009 (according to the article 4 of the L.3556/2007 and the article 2 of the decision 7/448/11.10.2007 of the Hellenic Capital
INTERIM FINANCIAL REPORT
 INTERIM FINANCIAL REPORT For the period from 1 January to 30 June 2012 (pursuant to article 5 of Law 3556/2007 and article 4 of Decision 7/448/11.10.2007 of the Capital Market Commission BoD) 25 ERMOU
INTERIM FINANCIAL REPORT
 INTERIM FINANCIAL REPORT For the period from 1 January to 30 June 2015 (pursuant to article 5 of Law 3556/2007 and article 4 of Decision 7/448/11.10.2007 of the Capital Market Commission BoD) ELLAKTOR
HELECTOR GROUP. Annual Financial Statements in line with the International Financial Reporting Standards for the year ended 31 December 2013
 HELECTOR GROUP Annual Financial Statements in line with the International Financial Reporting Standards for the year ended 31 December 2013 ENERGY & ENVIRONMENTAL APPLICATIONS 25 ERMOU STR. - 145 64 KIFISSIA
ANNUAL FINANCIAL REPORT
 ANNUAL FINANCIAL REPORT For the year from 1 January to 31 December 2012 (pursuant to article 4 of Law 3556/2007 and article 2 of Decision 7/448/11.10.2007 of the Capital Market Commission BoD) ELLAKTOR
AKTOR SA CONSTRUCTION COMPANY 25 ERMOU STR KIFISIA Tax ID No.: Tax Office: ATHENS FABE SA Reg. No. 8153/01ΑΤ/Β/86/355/05
 MANAGEMENT REPORT OF THE BOARD OF DIRECTORS OF AKTOR SA ON THE CONSOLIDATED AND SEPARATE FINANCIAL STATEMENTS FOR THE YEAR FROM 1 JANUARY TO 31 DECEMBER 2013 AKTOR SA CONSTRUCTION COMPANY 25 ERMOU STR.
ANNUAL FINANCIAL REPORT
 ANNUAL FINANCIAL REPORT For the fiscal year from 1 January to 31 December 2015 (pursuant to article 4 of Law 3556/2007 and article 2 of the Decision 7/448/11.10.2007 of the Capital Market Commission s
ANNUAL FINANCIAL REPORT for the financial year January 1 st to December 31 st 2008
 ANNUAL FINANCIAL REPORT for the financial year January 1 st to December 31 st 2008 (according to the article 4 of the L.3556/2007 and the article 2 of the decision 7/448/11.10.2007 of the Hellenic Capital
SIX-MONTH FINANCIAL REPORT
 SIX-MONTH FINANCIAL REPORT (pursuant to Article 5 of Law 3556/2007) 25 ERMOU ST - 145 64 KIFISSIA Tax Registration No.: 094004914-TAX OFFICE FOR SOCIÉTÉS ANONYMES SA Reg. No: 874/06/Β/86/16 100065 G.E.MI.
Annual Financial Statements in line with the International Financial Reporting Standards for the year ended 31 December 2012
 HELECTOR ΟΜΙΛΟΣ ΗΛΕΚΤΩΡ GROUP Annual Financial Statements in line with the International Financial Reporting HELECTOR S.A. ENERGY & ENVIRONMENTAL APPLICATIONS 25 ERMOU STR. - 145 64 KIFISSIA Tax ID No.:
ΟΜΙΛΟΣ ΗΛΕΚΤΩΡ HELECTOR S.A.
 Board of Directors Annual Report & Statements prepared in accordance with the International Financial Reporting Standards, for the financial year ended 31 December 2016 HELECTOR S.A. ENERGY & ENVIRONMENTAL
GEK TERNA GROUP. Group presentation
 GEK TERNA GROUP Group presentation GEK TERNA Group: Business Divisions Business Divisions Energy Concessions Construction Real Estate Supplementary activities (Industrial Products, Quarries) 2 GEK TERNA
ΟΜΙΛΟΣ ΗΛΕΚΤΩΡ HELECTOR S.A.
 Board of Directors Annual Report & Statements prepared in accordance with the International Financial Reporting Standards, for the financial year ended 31 December 2017 HELECTOR S.A. ENERGY & ENVIRONMENTAL
GEK TERNA GROUP. Group presentation
 GEK TERNA GROUP Group presentation GEK TERNA Group: Business Divisions Business Divisions Energy Concessions Construction Real Estate Supplementary activities (Industrial Products, Quarries) 2 GEK TERNA
GEK - TERNA GROUP. Group presentation
 GEK - TERNA GROUP Group presentation GEK - TERNA Group: Overview GEK and TERNA group holds one of the leading positions in Construction, Energy, Real Estate and Concessions, in Greece GEK is the parent
GEK TERNA GROUP. Group presentation
 GEK TERNA GROUP Group presentation GEK TERNA Group: Business Divisions Business Divisions Energy Concessions Construction Industrial Real Estate 2 GEK TERNA Group: Overview GEK TERNA is the parent company
ANNUAL FINANCIAL REPORT
 ANNUAL FINANCIAL REPORT For the financial year from 1 January to 31 December 2017 (pursuant to article 4 of Law 3556/2007) 25 ERMOU ST - 145 64 KIFISIA Tax Registration No.: 094004914- TAX OFFICE FOR SOCIÉTÉS
Corporate Presentation
 Corporate Presentation Group Structure 100% 38/50/25% * 100% 100% 100% Construction Energy Production* Concessions Real Estate Mining * 38% participation in TE, 50% ownership in the first plant (HERON
Corporate Presentation
 Corporate Presentation Group Structure 100% 40/50/25% * 100% 100% 100% Construction Energy Production* Concessions Real Estate Mining * 40% participation in TE, 50% ownership in the first plant (HERON
Company presentation. October 2016
 Company presentation October 2016 Disclaimer This presentation contains forward-looking statements. The words "believe", "expect", "anticipate", "intend", "plan, target, aim, will, may, would, could and
FY 2015 Results. March 2016
 FY 215 Results March 216 FY 215 Calendar of Main Events January 15: Refinancing of 43,7 ml bond loan maturing in 217 with favorable terms, lower interest rate and extended to 222. Significant increase
MANAGEMENT REPORT OF THE BOARD OF DIRECTORS OF AKTOR SA ON THE FINANCIAL STATEMENTS OF THE YEAR ENDED 31 DECEMBER 2014
 MANAGEMENT REPORT OF THE BOARD OF DIRECTORS OF AKTOR SA ON THE CONSOLIDATED AND SEPARATE FINANCIAL STATEMENTS FOR THE YEAR FROM 1 JANUARY TO 31 DECEMBER 2014 AKTOR SA CONSTRUCTION COMPANY 25 ERMOU STR.
HALF-YEAR FINANCIAL REPORT
 HALF-YEAR FINANCIAL REPORT For the period from 1 January to 30 June 2018 (In accordance with article 5 of Law 3556/2007) ELLAKTOR S.A. 25 ERMOU ST - 145 64 KIFISIA Tax ID No.: 094004914 - ATHENS TAX OFFICE
Interim condensed financial information in accordance with International Accounting Standard 34 for the period from 1 January to 30 September 2018
 Interim condensed financial information in accordance with 25 ERMOU ST - 145 64 KIFISIA Tax Registration No: 094004914 ATHENS TAX OFFICE FOR SOCIÉTÉS ANONYMES Société Anonyme Registration No: 874/06/Β/86/16
Fitter for the Future Strategic Update
 Fitter for the Future Strategic Update 2017-21 Chairman s remarks Global strategic overview Significant market opportunity Basarab Overpass in Bucharest, Romania Naples underground (Toledo Station), Italy
2015-H1 Results. August 2015
 215-H1 Results August 215 215-H1 Calendar of Main Events January 15 : Refinancing of 43,7 ml bond loan maturing in 217 with favorable terms, lower interest rate and extended to 222. Significant increase
9m 2018 Results. December 2018
 9m 218 Results December 218 Calendar of main events (1 9/218) Energy yield & performance +22,6% energy yield 26,9% capacity factor 98,7% weighted average availability New capacity 45,9 MW wind farms (17,1
COMPANY PRESENTATION. December 2018
 COMPANY PRESENTATION December 2018 Table of Contents KRI KRI at a glance Strategic Choices Facilities, CapEx, Location Financials Share information 2 KRI KRI at a glance Basic Figures Turnover Kri Kri
Terna Energy. Overweight Previous Rating: Overweight. Expanding RES Portfolio Drives Growth. Euroxx Research Renewable Energy. Company Update Report
 Euroxx Research Renewable Energy Overweight Previous Rating: Overweight Company Update Report Terna Energy Share Price: 2.65 (close of September 16) 12M Price Target: 3.60 Previous Target: 3.90 Expected
FY16 Results Presentation
 Muskrat Falls Hydro Plant, Canada FY16 Results Presentation March 14, 2017 Agenda Warsaw subway Line 2, Poland 2016 Highlights Q4 & FY16 results Appendix 2 Fit for the Future our Strategy Plan Sustainable
ANNUAL FINANCIAL STATEMENTS. For the financial year from 1 January to 31 December 2017 (TRANSLATED FROM THE GREEK ORIGINAL)
") ANNUAL FINANCIAL STATEMENTS For the financial year from 1 January to 31 December 2017 (TRANSLATED FROM THE GREEK ORIGINAL) A. MANAGEMENT REPORT OF THE BOARD OF DIRECTORS ON THE SEPARATE AND CONSOLIDATED
ANNUAL FINANCIAL STATEMENTS For the financial year from 1 January to 31 December 2017 (TRANSLATED FROM THE GREEK ORIGINAL) A. MANAGEMENT REPORT OF THE BOARD OF DIRECTORS ON THE SEPARATE AND CONSOLIDATED
SEMI ANNUAL FINANCIAL REPORT
 SEMI ANNUAL FINANCIAL REPORT For the period January 1 st till June 30 2008 (According to article 5 of L. 3556/2007 and article 4 of the Decision 7/448/11.10.2007 of the BoD of the Capital Market Commission)
Strategic Review Financial Highlights. Business opportunities. Results by business
 March 2004 Strategic Review 2003 Financial Highlights Business opportunities Results by business Conclusions A Construction & Services Market Reference # 1 in Spanish Construction # 1 in Industrial Services
Public Private Partnerships in Greece
 Public Private Partnerships in Greece Nikos Mantzoufas Special Secretary for PPPs 14 th Annual Investor Forum Building a New Greece Capital Link Forum Thursday, November 29, 2012 New York City Hellenic
ELLINIKI TECHNODOMIKI TEB GROUP ANNUAL REPORT 2007
 ELLINIKI TECHNODOMIKI TEB GROUP ANNUAL REPORT 2007 Kifissia, June 2008 THIS PAGE IS BLANK ON PURPOSE (1) / (178) TABLE OF CONTENTS COMPANY OVERVIEW...7 1. INFORMATION ON THE COMPILATION OF THE ANNUAL REPORT
ADMIE HOLDING REPORTS 9 MONTH 2018 RESULTS FOR PERIOD January 1 st, 2018 to September 30 th, 2018
 ADMIE HOLDING REPORTS 9 MONTH 2018 RESULTS FOR PERIOD January 1 st, 2018 to September 30 th, 2018 ADMIE Holding: Net Profit 29.2 million, in line with forecast targets Interim dividend 0,0316 per share,
J&P Avax. Hefty upside, but no catalysts. Greece, Construction. June 4, 2010
 Greece, Construction J&P Avax Hefty upside, but no catalysts June 4, 2010 Current price 1.45 Target price 5.40 From 6.50 Upside potential 272.4% Remains Outperform Key data Reuters code AVAr.AT Bloomberg
6m 2017 Results. September 2017
 6m 217 Results September 217 Calendar of main events Energy yield +2,8% increase in energy yield Overall performance 23,1% capacity factor 98,7% weighted average availability IPO (7/214) projects progress
ROADSHOW USA - June 2001
 ROADSHOW USA - June 2001 1 This presentation has been prepared by VINCI for information purposes only. It is based on sources we believe to be reliable but neither its accuracy nor completeness is guaranteed.
2013 3Q Results Presentation. Athens, 14 November 2013
 2013 3Q Results Presentation Athens, 14 November 2013 CONTENTS Executive Summary Industry Environment Group Results Overview Segmental Performance Financial Results Q&A 1 3Q 2013 GROUP KEY FINANCIALS FY
MOURGELAS GREEK LAW UPDATE
 MOURGELAS GREEK LAW UPDATE April 2012 Recently Issued Acts Company Law Modernization of legislation on general, limited and silent partnership companies & joint ventures A full set of provisions aiming
J&P AVAX S.A. Interim Condensed Financial Reporting
 J&P AVAX S.A. Interim Condensed Financial Reporting From January 1 st, 2011 to June 30th, 2011 J&P AVAX S.A. Company Registry # 14303/06/Β/86/26 16 Amarousiou-Halandriou Street, 151 25, Marousi, Greece
9m 2017 Results. November 2017
 9m 217 Results November 217 Calendar of main events Energy yield +7,5% increase in energy yield Overall performance 24,2% capacity factor 98,8% weighted average availability Wind farm investments 39,6
Southeast Europe is growing economically and the gas market is expected to grow by bcm by 2025 (60%-80% increase)
") PUBLIC GAS CORPORATION (DEPA) S.A. Business Opportunities with DEPA December er 2010 Harry Sachinis, Chairman & CEO, DEPA S.A. Business Opportunities with DEPA Southeast Europe is growing economically
PUBLIC GAS CORPORATION (DEPA) S.A. Business Opportunities with DEPA December er 2010 Harry Sachinis, Chairman & CEO, DEPA S.A. Business Opportunities with DEPA Southeast Europe is growing economically
J&P AVAX S.A. Interim Financial Report for the period from. January 01 to June 30, 2008
 J&P AVAX S.A. Interim Financial Report for the period from January 01 to June 30, 2008 J&P AVAX S.A. Company Registry # 14303/06/Β/86/26 16 Amarousiou-Halandriou Street, 151 25, Marousi, Greece INDEX OF
J&P Avax. No catalyst in sight remains cheap. Greece, Construction. April 8, 2010
 Greece, Construction J&P Avax No catalyst in sight remains cheap April 8, 2010 Current price 2.03 Target price 6.50 From 6.40 Upside potential 220.2% Remains Outperform Key data Reuters code AVAr.AT Bloomberg
3m 2018 Results. May 2018
 3m 218 Results May 218 Calendar of main events Energy yield + 3,6% energy yield Overall performance 35,% capacity factor 98,7% weighted average availability New capacity (May 218) 9,9 MW Pefkias W/F TOCs
monthly statistics bulletin 2014 JANUARY
 monthly statistics bulletin 2014 JANUARY 125 DISCLAIMER Athens Exchange (ATHEX) makes all efforts to keep all published information updated and accurate. The information is to be seen as general and it
EVN Presentation. 4 th HSBC Small/Mid Cap Conference Frankfurt, January 28, 2009
 EVN Presentation 4 th HSBC Small/Mid Cap Conference Frankfurt, January 28, 2009 Company profile fact sheet EVN Business areas Countries Employees Revenue EBITDA EBIT Net results Credit Rating EVN is a
EVN Presentation. EEI Conference London, March 16, 2009
 EVN Presentation EEI Conference London, March 16, 2009 EVN s strategy Growth perspectives Financial update and outlook Company profile fact sheet 2007/08 EVN Business areas Countries Employees Revenue
GREEK RENEWABLES SUPPORT SCHEME PROPOSALS
 BRIEFING GREEK RENEWABLES SUPPORT SCHEME PROPOSALS MARCH 2016 BRIEF OUTLINE OF THE SCHEME PHOTOVOLTAIC PROJECTS TRANSITIONAL PROVISIONS NON-INTERCONNECTED ISLANDS COMPETITIVE BIDDING PROCESS FROM 2017
JOINT SHAREHOLDERS MEETING. 11 September 2000
 JOINT SHAREHOLDERS MEETING 11 September 2000 1 Why an alliance VINCI-GTM Significant presence of both groups in non cyclical activities Combining local expertise with a global approach to service large
ANNUAL FINANCIAL REPORT. for the period
 TERNA SOCIETE ANONYME TOURISM TECHNICAL SHIPPING COMPANY 85 Mesogeion Ave., 115 26 Athens General Commerce Reg. No. 8554301000 S.A. Reg. No. 56330/01/Β/04/506(08) ANNUAL FINANCIAL REPORT for the period
EVN Presentation HSBC, Austrian Companies Conference. London, June 16, 2009
 EVN Presentation HSBC, Austrian Companies Conference London, June 16, 2009 Agenda > EVN s strategy > Growth perspectives > Results for the 1 st half-year 2008/09 2 Company profile fact sheet 2007/08 EVN
ATTIKI ODOS SA ATTIKI ODOS SA KM OF ATTIKI ODOS PEANIA Tax ID No.: Ο.Υ.: ATHENS FABE. SA Reg.No /04/B/96/43(02)
") Annual Financial Statements prepared according to the 41.9 KM OF ATTIKI ODOS 190 02 PEANIA Tax ID No.: 094421389.Ο.Υ.: ATHENS FABE SA Reg.No. 35711/04/B/96/43(02) Table of Contents INDEPENDENT CERTIFIED
Annual Financial Statements prepared according to the 41.9 KM OF ATTIKI ODOS 190 02 PEANIA Tax ID No.: 094421389.Ο.Υ.: ATHENS FABE SA Reg.No. 35711/04/B/96/43(02) Table of Contents INDEPENDENT CERTIFIED
Exane BNP Paribas 2005 European Seminar Paris, 9 June Antoine ZACHARIAS, CEO of VINCI Christian LABEYRIE, CFO of VINCI
 Exane BNP Paribas 2005 European Seminar Paris, 9 June 2005 Antoine ZACHARIAS, CEO of VINCI Christian LABEYRIE, CFO of VINCI 4 business lines operating in synergy CONSTRUCTION Project management Building
EVN - Annual Results 2008/09
 EVN - Annual Results 2008/09 Agenda > EVN s strategy > Growth perspectives > Results for 2008/09 2 Company profile fact sheet 2008/09 EVN Business areas Countries Employees Revenue EBITDA EBIT Net results
VALUATION REPORT. in respect of the companies. METKA INDUSTRIAL CONSTRUCTION SOCIETE ANONYME and MYTILINEOS HOLDINGS S.A.
 PKF EUROAUDITING S.A. Certified Public Accountants PKF Audit Tax & Business Advisory VALUATION REPORT in respect of the companies METKA INDUSTRIAL CONSTRUCTION SOCIETE ANONYME and MYTILINEOS HOLDINGS S.A.
MARFIN INVESTMENT GROUP FINANCIAL RESULTS: Q1 2015
 MARFIN INVESTMENT GROUP FINANCIAL RESULTS: Q1 2015 Return to profitability at the level of consolidated EBITDA from business operations 1 for the 1st quarter of the year, despite seasonality: 18.6m profit
2012 LONDON STAR Conference. London, 2 3 October 2012
 2012 LONDON STAR Conference London, 2 3 October 2012 1 1 ASTALDI is the largest Contractor in Italy, operating only in large infrastructures at worldwide level Construction RoW 42% ( 4.2Bn) Construction
1 st H 2006 IFRS FINANCIAL RESULTS. PRESENTED BY: CEO Mr. E. MYTILINEOS CFO Mr. I. DIMOU
 1 st H 2006 IFRS FINANCIAL RESULTS PRESENTED BY: CEO Mr. E. MYTILINEOS CFO Mr. I. DIMOU 03/08/2006 1 Agenda A. Group Financial & Operating Highlights B. Key Performance Indicators Appendices i. Group History
KRI KRI Milk Industry. September 2017
 KRI KRI Milk Industry September 2017 Table of Contents 1 KRI KRI at a glance 2 Segments Strategic Choices 3 Facilities, CapEx, Location 4 Management 5 Financials 6 Share Information September 2017 2 KRI-KRI
Working with the European Bank for Reconstruction and Development in Cyprus
 Working with the European Bank for Reconstruction and Development in Cyprus September 2017 What is the EBRD? An international financial institution, with the mandate to promote transition to modern and
ANNUAL ANALYST S PRESENTATION
 ANNUAL ANALYST S PRESENTATION Transforming the Enterprise Athens, May 3 2006 Public Power Corporation S.A. 1 AGENDA What is PPC attractive assets in advantaged market 2005 results year of transition Looking
H results 2 August 2017
 H1 2017 results 2 August 2017 Delivering the Strategy Plan 2 Sustainable growth Operational discipline Financial strength Major operational milestones met on time Commercial growth continues Revenue geographic
February 10, Astaldi. 4Q 2004 and 2004 Preliminary Results
 Astaldi 4Q 2004 and 2004 Preliminary Results February 10, 2005 1 Main Highlights (Million of euro) 2004 yoy 2006 CAGR 03-06 2004 RESULTS ABOVE 2004-2006 STRATEGIC PLAN TARGETS Order backlog 5,011 13.7%
Presentation of the Group
 The world s leading infrastructure developer Presentation of the Group Key figures & Global Strategy July 2012 Grupo ACS The world s leading infrastructure & concessions developer Engineering contractor
ANNUAL REPORT OF THE BOARD OF DIRECTORS. on the Company s Financial Statements for the year ended 31 December 2015
 ANNUAL REPORT OF THE BOARD OF DIRECTORS on the Company s Financial Statements for the year ended 31 December 2015 This Report accompanies the Financial Statements of 2015 and is submitted for approval
DIRECTORS REPORT OF THE COMPANY BIOSAR ENERGY SA ON THE FINANCIAL STATEMENTS FOR 2009
 DIRECTORS REPORT OF THE COMPANY BIOSAR ENERGY SA ON THE FINANCIAL STATEMENTS FOR 2009 Dear Shareholders, We hereby present the annual financial statements for the period 1.1.2009 31.12.2009. Breaking down
REDS Real Estate Development & Services
 ANNUAL FINANCIAL REPORT (pursuant to article 4 of Law 3556/2007 and article 2 of Decision 7/448/11.10.2007 of the Capital Market Commission BoD) REDS REAL ESTATE DEVELOPMENT& SERVICES 25 ERMOU STR. - 145
9M 2012 IFRS FINANCIAL RESULTS
 9M 2012 IFRS FINANCIAL RESULTS DISCLAIMER These preliminary materials and any accompanying oral presentation (together, the Materials ) have been prepared by Mytilineos Holdings SA (the Company ) and are
ADMIE (IPTO) Holding S.A. London Roadshow November 2017
 Holding S.A. London Roadshow November 2017") ADMIE (IPTO) Holding S.A. London Roadshow November 2017 Disclaimer This document contains forward-looking statements that involve risks and uncertainties. These statements may generally, but not always,
ADMIE (IPTO) Holding S.A. London Roadshow November 2017 Disclaimer This document contains forward-looking statements that involve risks and uncertainties. These statements may generally, but not always,
Meeting 17 July 2000
 Meeting 17 July 2000 1 Antoine Zacharias Chairman of VINCI Jérôme Tolot Chief Operating Officer and Member of the Board of GTM Group 2 What is the alliance strategy of choice in the construction business?
1H2016 IFRS FINANCIAL RESULTS
 1H2016 IFRS FINANCIAL RESULTS Disclaimer These preliminary materials and any accompanying oral presentation (together, the Materials ) have been prepared by MYTILINEOS Holdings SA (the Company ) and are
9M 2013 Results. November 11, 2013
 9M 2013 Results November 11, 2013 1 1 GOALS AND ACHIEVEMENTS FOR 2013 OUR GOALS OUR ACHIEVEMENTS Financial close and start-up of Turkish projects Financial support to domestic projects in order to deliver
ATTIKI ODOS SA DIRECTORS REPORT OF THE COMPANY ATTIKI ODOS SA ON THE FINANCIAL STATEMENTS FOR 2009 ATTIKI ODOS SA 41.9 KM OF ATTIKI ODOS PEANIA
 ATTIKI ODOS SA DIRECTORS REPORT OF THE COMPANY ATTIKI ODOS SA ON THE FINANCIAL STATEMENTS FOR 2009 ATTIKI ODOS SA 41.9 KM OF ATTIKI ODOS 190 02 PEANIA Tax ID No.: 094421389 Tax Office: ATHENS FABE SA Reg.No.
Corporate Presentation June 2018
 Corporate Presentation 2018 June 2018 Disclaimer This document contains forward-looking statements that involve risks and uncertainties. These statements may generally, but not always, be identified by
Group Presentation. May 2018
 Group Presentation May 2018 Disclaimer Some of the information in this presentation contains forward-looking statements within the meaning of securities laws. All forward-looking statements address matters
Mid Cap Conference April 2018
 Mid Cap Conference 2018 April 2018 Disclaimer This document contains forward-looking statements that involve risks and uncertainties. These statements may generally, but not always, be identified by the
9M 2017 results 14 November 2017
 9M 2017 results 14 November 2017 Agenda 2 Capital and financial strengthening Program Venezuela write-down 9M Results A comprehensive capital and financial strengthening program 3 A 400 million capital
2005 interim results. 7 September 2005 analysts meeting
 2005 interim results 7 September 2005 analysts meeting Very good 1st half of 2005 Key figures In millions 1st half of 2004 1st half of 2005 Change 05/04 Net sales 9,086 10,051 +10.6% Operating profit from
UAE-Russia Infrastructure & Public-Private Partnership Investment Focus. October 2014
 UAE-Russia Infrastructure & Public-Private Partnership Investment Focus October 2014 About Gazprombank Gazprombank at a Glance General Information Asset Growth Third largest bank in Russia by assets, equity,
Condensed interim financial statements in accordance with International Accounting Standard 34 for the period from 1 January to 31 March 2015
 Condensed interim financial statements in accordance with International Accounting Standard 34 for the period from 1 January to 31 March 2015 EL.TECH. ANEMOS SA 25 ERMOU STR. - 145 64 KIFISSIA Tax ID No.:
B U I L D I N G P A R T N E R S H I P S F O R E N E R G Y S E C U R I T Y
 "INOGATE Technical Secretariat & Integrated Programme in support of the Baku Initiative and the Eastern Partnership energy objectives" Project B U I L D I N G P A R T N E R S H I P S F O R E N E R G Y
Results Presentation th of February, 2014
 Results Presentation 2013 28 th of February, 2014 Executive Summary Consolidation of Global Leadership Good Operating Results Net Profit > 700 Financial structure reinforced HOCHTIEF Restructuring 2 ACS
J&P Avax. 2Q10 preview. Greece, Construction. August 20, 2010
 Greece, Construction J&P Avax 2Q10 preview August 20, 2010 Current price 1.47 Target price 5.40 From 5.40 Upside potential 267.3% Remains Outperform Key data Reuters code AVAr.AT Bloomberg code AVAX GA
PORR 1H 2014 Update Investor Presentation September 2014
 PORR 1H 2014 Update Investor Presentation September 2014 Disclaimer This presentation was prepared by PORR AG (the "Company") solely for use at investors meetings and is furnished to you solely for informational
The world s leading infrastructure developer. April 2012
 The world s leading infrastructure developer Investors Presentation Company profile, strategy and key financials April 2012 Grupo ACS The world s leading infrastructure developer Engineering contractor
RESULTS PRESENTATION 1 ST QUARTER 2011
 RESULTS PRESENTATION 1 ST QUARTER 2011 HIGHLIGHTS STRUCTURE AND SEGMENT REPORTING MANAGEMENT ANALYSIS - ECONOMIC AND FINANCIAL ANALYSIS - ANALYSIS BY SEGMENT - CAPEX - NET DEBT APPENDICES HIGHLIGHTS HIGHLIGHTS
Draft PPP Policy Outline
 Note 7 May 2012 Draft PPP Policy Outline This note is the seventh in a series of notes on developing a comprehensive policy, legal, and institution framework for public-private partnership (PPP) programs.