Annual Meeting
|
|
|
- Mildred Glenn
- 5 years ago
- Views:
Transcription


1 1
2 Agenda 1 Accredited dentist network 2 Sustainability & marketing 3 Innovation and digital transformation 4 Results and value driven Company 5 Odonto System acquisition 6 Final considerations 2
3 José Roberto Pacheco Accredited dentist network 1 3
4 Largest and best dentist network National distribution Differentiated academic background Continuous education 24/7 call center 28,000 dentists at 2,600 cities 4


5 Proprietary IT Platform: information-driven decisions Complete dental record of all beneficiaries 3 decades of actuarial data Risk management and fraud prevention 5


6 Proprietary IT Platform: information-driven decisions Quality assurance Clear barrier to entry Cost control 6

7 Continuous Education Program Courses via e-learning, clinical newsletters, podcasts, - Revista UNNA Conection Share technical information, to better manage the dental offices and the scientific update of the network Successful partnership with FUNDECTO, agreed to the School of Dentistry of São Paulo (FOUSP) 7


8 Rede Unna Forum Annual event with the professionals who stood out the most during the year regarding the service OdontoPrev beneficiaries Research conducted by Instituto DataFolha National and international lectures by renowned professionals in the market 8
9 Robert Wieselberg Marketing, Sustainability, 2 Innovation and Digital Transformation 9


10 Sustainability Environmental Policy published in 2004 Planting of more than 11,300 trees since equivalent to 13 football fields - in CO2 neutralization projects Support to 23 institutions providing access to oral health to children in situations of vulnerability - more than 108 thousand children attended from the beginning Signatory of the UN Global Compact 10

11 Amalgam Recycling Project Partneship with University of São Paulo since 2005 More than 8.5 kg of mercury and silver recovered through correct disposal of the amalgam by the accredited network - equivalent to more than 30 thousand restorations 11

12 Triple Bottom Line: People, Profit & Planet Planet - refers to the impacts of our actions on the planet People - refers to the impacts of our actions on society Profit - refers to the results of our shares for the shareholder 12


13 Emission management 2 thousand trees planted in Candido Portinari State Park (SP) by employees, suppliers, accredited network and partners 13


14 New brand placement Before: The healthcare of your smile. We empower and enhance people's self-esteem and well-being through the provision of quality dental plans at affordable prices. Invitation to society to think: "Your mouth speaks for you. What have you done for her? " 14

15 New E-commerce Platform Wide range of unique dental care solutions with higher average ticket 15


16 Digital transformation Prívian App Full refund process via App Payment in up to 48 hours Comfort, no bureaucracy Refund preview Virtual card Network Location Concierge Contacts 16

17 Digital transformation OdontoPrev UNNA Network App Launched in 2015, ~ 8,500 dentists Unique features that facilitates the accredited dentist routine Real-time sharing of:. Documents / X-rays / photographs of oral treatments Stored images available for consultation, including offline 17


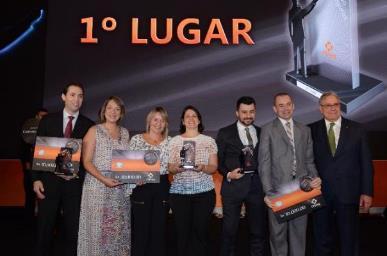
18 Image upload channels % 47% 12% M17 16% 30% 36% 47% 37% 34% CNSeg 2016 Award 1st place Mail Unna Network App Others 18
19 Marcelo Galvão Innovation and Digital Transformation 3 19

20 100+ Innovating in IT Award, in Health category: DCSS 20


21 DCSS Dental Care Sales System Multi-platform supporting device Technological Arquitecture Sales and comissioning structure flexibility Multichannel Brokers Call Center Partners Support to different sales scenarios Multi-branding DCSS Ease of use Different means of payment Bank slip Credit Card Automatic debit 21


22 DCSS Dental Care Sales System Multidisciplinary Team Design Thinking Agile methodology Shared management (IT + Marketing) 22
23 Innovation driven company Innovation map with four main drivers: Partnership and sales channel expansion Customer atraction and conversion Customer retention Operational efficiency increase 23

24 Innovation driven company Innovation map with four main drivers: Partnership and sales channel expansion Customer atraction and conversion Customer retention Operational efficiency increase Facilitated through the following digital platforms: Brokers Individuals SME Beneficiaries Accredited Network 24
25 José Roberto Pacheco Results and 4 Value driven Company 25

26 OdontoPrev: 11 years of sustainable value creation since IPO Revenues in R$ million ,070 1,156 1,250 1,365 1, IPO OCT16 SEP17 26


27 Total Shareholder remuneration since the IPO OdontoPrev x IBrX 27
28 3 accelerated growth cycles in the dental sector, over the last decade 28
29 3 accelerated growth cycles in the dental sector, over the last decade 1,5 Year Number of memebrs Strategic Reason 7,3 9,2 11,1 13,3 0, ~1 million Strategic partnership with OdontoPrev
30 5 19,6 13,3 11,1 0,6 2,1 9,2 7, ,1 1,1 3 accelerated growth cycles in the dental sector, over the last decade 1, Year Number of memebrs Strategic Reason ~1 million Strategic partnership with OdontoPrev ~1 million Acquisition by UnitedHealth 30
31 5 19,6 13,3 11,1 0,6 2,1 9,2 7, ,1 1,1 3 accelerated growth cycles in the dental sector, over the last decade 1, Year Since 2014 Number of memebrs ~1 million Acquisition by UnitedHealth +650 thousand +600 thousand Strategic Reason ~1 million Strategic partnership with OdontoPrev Strategic movement 31
32 Source: ANS Dental plans sector evolution DEC16 OCT17 (thousand lives) 21, Others 22,966 DEC16 With 14% of market share, two companies represented 59% of the sector growth in. OCT17 32
33 25 Monthly net additions (thousand lives) Source: ANS 56 Dental/ Medical (%) -8 OCT16 NOV16 DEC16 JAN17 FEB17 MAR17 APR17 MAY17 JUN17 JUL17 AUG17 SEP17 OCT17 61% 60% 61% 61% 62% 61% 63% 66% 69% 71% 73% 76% 77% 33
34 Monthly net additions (thousand lives) Source: ANS Dental/ Medical (%) OCT16 NOV16 DEC16 JAN17 FEB17 MAR17 APR17 MAY17 JUN17 JUL17 AUG17 SEP17 OCT17 65% 69% 69% 70% 76% 80% 80% 79% 80% 79% 81% 82% 82% 34

35 9M17 Results Net Revenues R$ million Adjusted EBITDA R$ million and % Sales Net Income R$ million 1,013 5% 1, % 258¹ 24.2¹ % 186¹ M16 9M17 9M16 9M17 9M16 9M17 ¹ ¹Ecludes Bradesco Dental and OdontoPrev INSS reversals 35

36 Membership and revenues breakdown 3Q14 Members Revenues 81% 76% 19% 3Q17 74% 65% 26% 35% 36% 24% 25% Corporate SME + Individual Plans 36

37 Corporate segment upturn Quarterly net additions (Thousand lives) Q15 2Q15 3Q15 4Q15 1Q16 2Q16 3Q16 4Q16 1Q17 2Q17 3Q17 37
38 Positive effects of bank channels & Retailers 3Q17 List prices R$45.60 R$29.90 Selling expenses Profitability 10% to 15% Higher 25% to 45% Lower 38

39 Positive effects of bank channels & Retailers Individual Plans portfolio breakdown 3Q17 3Q17 List prices R$45.60 R$29.90 Selling expenses Profitability 10% to 15% Higher 25% to 45% Lower 55% Retailers 45% Bank channels 39


40 Change in SME mix allows average ticket increase above inflation Breakdown of SME members 83% 2% 15% 78% 9% 13% 3Q16 3Q17 40
41 Pricing power minimizes higher Individual cost of services 9M Corporate SME Individual Plans Cost of services/member/month Average Ticket (R$/member/month) 41
42 Cash Flow since the IPO (R$ million) +2, Capital reduction and share buybacks Cash dividends 205-1, Net Cash DEC06 + Cash - Generation Acquisitions & Capex Shareholder Remuneration Stock Options Net Cash SEP17 42


43 Quarterly cash dividends to investors R$ million Payout Q16 2Q16 3Q16 4Q16 1Q17 2Q17 3Q17 80% 80% 80% 80% 80% 216%¹ 100% ¹Excludes Bradesco Dental and OdontoPrev INSS reversals Interest on Capital Dividends Practice of 80% payout until 1Q17 and 100% from 3Q17 43

44 Rodrigo Bacellar Odonto System Acquisition 5 44


45 OdontoPrev: Market leader since1998 6,276 Number of members September (Thousand members) 27% of Market share of beneficiaries 472 1,968 1,641 1, ( ) ( ) 45
46 Acquisition Dental only company, low-cost model 622 Thousand beneficiaries (65% corporate, 35% non-corporate) #3 player in the Northeast region, after Hapvida and OdontoPrev 9x EBITDA & 2019 earn-out 46
47 Acquisition Key Metrics (12 month period ended in June ) Revenues: R$97.5 million Average Ticket: ~R$13.00 DLR: ~35% Adjusted EBITDA: R$17.7 million Adjusted EBITDA margin: 18.1% 47
48 Rodrigo Bacellar Final considerations 6 48
49 Great portion of the middle class without a plan Brazil s population: 200 million people 100 million people in the middle class 100 million people out of the middle class 23 million people with a dental plan 77 million people without a dental plan 49
50 Dental and medical plans penetration in the USA x Brazil Today Future Medical 80% 25% 50% - 60% Dental 60% 11% 30% - 40% 50
51 Penetration in different employment relationship highlights market with exploitation opportunity Market size Dental plans penetration Corporate 21 million +50% SME 28 million < 5% 51
52 Dental plans growth in the last years demonstrates potential for the next ones Last 30 years: +3 million of members +20 million of members 15 years 15 years 52


53 New e-commerce in 2018 Dentist loyalty program Until : points program of dental materials, sent to the accredited network, at no charge From 2018: program maintenance and beginning of direct sales operations 100% online 53
, the mouth cancer is the 5th of biggest incidence (~ 16 thousand deaths per year) 80% of diagnosed cases in")
54 & Unique partnership with one of the world s biggest oncology center The dentist can send photos of oral lesion through the Rede UNNA app to A.C.Camargo In Brazil, according to the National Institute of Cancer (INCA), the mouth cancer is the 5th of biggest incidence (~ 16 thousand deaths per year) 80% of diagnosed cases in Brazil are already in advanced stage 54

55 Thank you! 55
Corporate Presentation 2Q18. New growth cycle and value innovation
 Corporate Presentation 2Q18 New growth cycle and value innovation Index 1 Dental benefits: an incipient sector in Brazil 2 Inside OdontoPrev: strategic competitive advantages 3 Financial and Operational
Corporate Presentation July New growth cycle and value innovation
 Corporate Presentation July 2017 New growth cycle and value innovation Index 1 Dental benefits: an incipient sector in Brazil 2 Inside OdontoPrev 3 Strategic competitive advantages 4 Financial and Operational
Corporate Presentation July New growth cycle and value innovation
 Corporate Presentation July 2018 New growth cycle and value innovation Index 1 Dental benefits: an incipient sector in Brazil 2 Inside OdontoPrev: strategic competitive advantages 3 Financial and Operational
Corporate Presentation February, New growth cycle and value innovation
 Corporate Presentation February, 2017 New growth cycle and value innovation Dental benefits: an incipient sector in Brazil 2 Brazilian dental opportunity 60% 11% % of the population covered by a private
New growth cycle and value innovation. May, 2013
 New growth cycle and value innovation May, 2013 Disclaimer The information contained herein has been prepared by Odontoprev S.A. ( OdontoPrev or the Company ) and this material does not constitute offering
2Q17 and 6M17 Earnings Release Resultados 4T12
 ex-inss: Revenues up 5%. Lower dental care ratio and decreasing bad debt expand adjusted EBITDA by 13%. EPS 17% higher. Cash dividends in the quarter reach R$111 million, 217% above 2Q16 Sao Paulo, July
1Q18 Earnings Release Resultados 4T12
 : Revenues up 5.4%, with net adds of 29 thousand lives in the quarter, from all three segments. Lower dental care ratio expands adjusted Ebitda 17.7%, with margin expansion of 300 bps to 28.7%. Net income
2Q15 Earnings Release Resultados 4T12
 Revenues and EBITDA up 7%, with margin of 27% in 2Q15 and 29% in 1H15, a record. 100% payout. Sao Paulo, July 29 th, 2015. OdontoPrev (BM&FBOVESPA: ODPV3; Bloomberg: ODPV3 BZ; Reuters: ODPV3.SA and ADR
Odontoprev S.A. Interim Financial statements as of June 30, 2016 Quarterly Information - ITR (A free translation of the original report in Portuguese)
") Interim Financial statements as of June 30, 2016 Quarterly Information - ITR (A free translation of the original report in Portuguese) Interim Financial Statements as of June 30, 2016 Quarterly Information
Interim Financial statements as of June 30, 2016 Quarterly Information - ITR (A free translation of the original report in Portuguese) Interim Financial Statements as of June 30, 2016 Quarterly Information
New growth cycle and value innovation. Webcast 3Q13
 New growth cycle and value innovation Webcast 3Q13 Disclaimer The information contained herein has been prepared by Odontoprev S.A. ( OdontoPrev or the Company ) and this material does not constitute offering
Institutional Presentation. March
 Institutional Presentation March 2013 Marisa at a glance Largest women fashion and lingerie retailer in Brazil 64 years of track record Focus on the middle class National footprint 2 Multiformat store
4Q17 and 2017 Earnings Release Resultados 4T12
 ex-inss: Revenues up 5.6%, with net adds of 34 thousand lives in the corporate segment. Dental care ratio down to 44.1%. Adjusted Ebitda up 30.9%, with margin expansion of 4.9 p.p. to 25.3%. Net cash of
Marisa at a Glance. Largest women fashion and underwear retailer in Brazil. Focus on the middle class. 63 years of track record.
 Institutional Presentation May 2012 Marisa at a Glance 63 years of track record Financial services platform Focus on the middle class Largest women fashion and underwear retailer in Brazil Multiformat
Review of Registered Charites Compliance Rates with Annual Reporting Requirements 2016
 Review of Registered Charites Compliance Rates with Annual Reporting Requirements 2016 October 2017 The Charities Regulator, in accordance with the provisions of section 14 of the Charities Act 2009, carried
Interim results presentation 2017
 Interim results presentation 2017 Contents Key indicators Operating environment What differentiates us Highlights Bank Save Credit Continued focus Key indicators Key indicators Earnings 4 000 3 500 3 000
Q Results presentation
 Q1 2016 Results presentation 12 May 2016 1 Disclaimer This presentation (the "Presentation") has been prepared and is issued by, and is the sole responsibility of Telepizza Group, S.A. ( Telepizza" or
Financial & Business Highlights For the Year Ended June 30, 2017
 Financial & Business Highlights For the Year Ended June, 17 17 16 15 14 13 12 Profit and Loss Account Operating Revenue 858 590 648 415 172 174 Investment gains net 5 162 909 825 322 516 Other 262 146
3Q16 results FLRY3. October 2016
 results FLRY3 October 2016 Disclosure This presentation may contain forward-looking statements. Such statements are not statements of historical facts and reflect the beliefs and expectations of the Company
Fiscal Year 2018 Project 1 Annual Budget
 Fiscal Year 2018 Project 1 Annual Budget Table of Contents Table Page Summary 3 Summary of Costs Table 1 4 Treasury Related Expenses Table 2 5 Summary of Full Time Equivalent Table 3 6 Positions Cost-to-Cash
ID Finance and Mintos Cooperation Overview
 ID Finance and Mintos Cooperation Overview INNOVATION LEADER BEST LENDING PLATFORM TOP-2 FASTEST GROWING FINTECH COMPANY IN EUROPE TOP-50 FASTEST GROWING COMPANY IN EUROPE BEST ALTERNATIVE FINANCE COMPANY
Common stock prices 1. New York Stock Exchange indexes (Dec. 31,1965=50)2. Transportation. Utility 3. Finance
2. Transportation. Utility 3. Finance") Digitized for FRASER http://fraser.stlouisfed.org/ Federal Reserve Bank of St. Louis 000 97 98 99 I90 9 9 9 9 9 9 97 98 99 970 97 97 ""..".'..'.."... 97 97 97 97 977 978 979 980 98 98 98 98 98 98 987 988
Digitized for FRASER http://fraser.stlouisfed.org/ Federal Reserve Bank of St. Louis 000 97 98 99 I90 9 9 9 9 9 9 97 98 99 970 97 97 ""..".'..'.."... 97 97 97 97 977 978 979 980 98 98 98 98 98 98 987 988
Institutional Presentation 3Q14
 Institutional Presentation 3Q14 1 I. GENERAL OVERVIEW II. BUSINESS ENVIRONMENT III. 3Q14 RESULTS IV. GROWTH OPPORTUNITIES 2 Cetip s Timeline 1986 Cetip starts its operations 1994 Beginning of OTC Derivatives
Fourth Quarter Fiscal Year 2017
 Fourth Quarter Fiscal Year 2017 October 25, 2017 J. Michael Bruff Vice President Investor Relations Mike.Bruff@Varian.com This presentation is intended exclusively for investors. It is not intended for
Net Element Inc. (NASDAQ: NETE)
") NEW YORK SÃO PAULO TORONTO Research Note Inc. (NASDAQ: ) reported developments in both its Netevia platform and Unified Payments subsidiary. intends to improve reveneue generation by extending its Netevia
NEW YORK SÃO PAULO TORONTO Research Note Inc. (NASDAQ: ) reported developments in both its Netevia platform and Unified Payments subsidiary. intends to improve reveneue generation by extending its Netevia
WESTWOOD LUTHERAN CHURCH Summary Financial Statement YEAR TO DATE - February 28, Over(Under) Budget WECC Fund Actual Budget
 Budget WECC Fund Actual Budget") WESTWOOD LUTHERAN CHURCH Summary Financial Statement YEAR TO DATE - February 28, 2018 General Fund Actual A B C D E F WECC Fund Actual Revenue Revenue - Faith Giving 1 $ 213 $ 234 $ (22) - Tuition $ 226
WESTWOOD LUTHERAN CHURCH Summary Financial Statement YEAR TO DATE - February 28, 2018 General Fund Actual A B C D E F WECC Fund Actual Revenue Revenue - Faith Giving 1 $ 213 $ 234 $ (22) - Tuition $ 226
XML Publisher Balance Sheet Vision Operations (USA) Feb-02
 Feb-02") Page:1 Apr-01 May-01 Jun-01 Jul-01 ASSETS Current Assets Cash and Short Term Investments 15,862,304 51,998,607 9,198,226 Accounts Receivable - Net of Allowance 2,560,786
Page:1 Apr-01 May-01 Jun-01 Jul-01 ASSETS Current Assets Cash and Short Term Investments 15,862,304 51,998,607 9,198,226 Accounts Receivable - Net of Allowance 2,560,786
London Borough of Barnet Pension Fund. Communication Strategy (2018)
") London Borough of Barnet Pension Fund Communication Strategy (2018) Background This document sets out the communication strategy for the London Borough of Barnet Pension Fund. The London Borough of Barnet
London Borough of Barnet Pension Fund Communication Strategy (2018) Background This document sets out the communication strategy for the London Borough of Barnet Pension Fund. The London Borough of Barnet
This presentation may include references and statements, planned synergies, estimates, projections of results, and future strategy for Banco do
 This presentation may include references and statements, planned synergies, estimates, projections of results, and future strategy for Banco do Brasil, its Associated and Affiliated Companies, and Subsidiaries.
2Q12 Results FLRY 3. August, 2012
 2Q12 Results FLRY 3 August, 2012 ALL RIGHTS RESERVED 2012 Disclaimer This presentation may contain forward-looking statements. Such statements are not statements of historical facts and reflect the beliefs
Institutional Presentation
 Institutional Presentation SulAmérica and Industry SULAMÉRICA BUSINESS MODEL Largest independent Brazilian insurer Multiline model One-stop shop and strong product cross selling Disciplined underwriting,
2Q15 Earnings Release
 2Q15 Earnings Release Barueri, August 4, 2015 - Smiles S.A. (BM&FBOVESPA: SMLE3), one of the largest loyalty programs in Brazil with over 10 million members, announces today its results for 2Q15. The financial
Investor Presentation
 Investor Presentation 3Q10 Growth for the next 115 years SULAMÉRICA TODAY A Unique Kind of Insurance Company Ranking as independent pure play Brazilian insurance company not owned by a bank #1 Ranking
German Investment Seminar 2011 Commerzbank AG New York January 10-11, 2011
 German Investment Seminar 2011 Commerzbank AG Mark Langer Chief Financial Officer Dennis Weber Head of Investor Relations New York January 10-11, 2011 German Investment Seminar, Commerzbank HUGO BOSS January
PRESS AND ANALYST CONFERENCE
 PRESS AND ANALYST CONFERENCE Metzingen April 12, 2010 Press and Analyst Conference 2010 HUGO BOSS April 12, 2010 2 / 39 AGENDA KEY FACTS 2009 FINANCIAL PERFORMANCE 2009 OUTLOOK 2010 GROWTH STRATEGY 2015
Corporate presentation May 2017 FLRY3
 Corporate presentation May 2017 FLRY3 Agenda Overview and Strategy Financial Performance Healthcare Sector in Brazil Expansion Plan Ownership Structure and Governance 2 Agenda Overview and Strategy Financial
Institutional Presentation
 Institutional Presentation SULAMÉRICA BUSINESS MODEL Largest independent Brazilian insurer, with leadership position in different segments 120 years of successful history in Brazil One-stop shop for financial
A purpose-driven, global, multichannel cosmetics group. Transaction close briefing 11th September 2017
 A purpose-driven, global, multichannel cosmetics group Transaction close briefing 11th September 2017 1 2 Three brands, one vision Guilherme Leal TODAY'S AGENDA A renewed governance and management structure
Spheria Australian Smaller Companies Fund
 29-Jun-18 $ 2.7686 $ 2.7603 $ 2.7520 28-Jun-18 $ 2.7764 $ 2.7681 $ 2.7598 27-Jun-18 $ 2.7804 $ 2.7721 $ 2.7638 26-Jun-18 $ 2.7857 $ 2.7774 $ 2.7690 25-Jun-18 $ 2.7931 $ 2.7848 $ 2.7764 22-Jun-18 $ 2.7771
27 July 2016 MEXICO. First half 2016
 27 July 2016 MEXICO First half 2016 Disclaimer IMPORTANT INFORMATION Banco Santander, S.A. ( Santander ) Warns that this presentation contains forward-looking statements within the meaning of the U.S.
Full year results presentation Year ended 31 March June 2018
 Full year results presentation Year ended 31 March 2018 7 June 2018 Disclaimer Not for publication, transmission, distribution or release, directly or indirectly, in or into any jurisdiction in which the
June Woongjin Coway
 June 2006 Woongjin Coway 0 Disclaimer This presentation contains historical information of the Company which should not be regarded as an indication of future performance or results. This presentation
Conference Call 3Q10 Results
 Conference Call 3Q10 Results In Portuguese with simultaneous translation in English Time: 11:00 am (US-ET)/ 1:00 pm (Brazil) Access in English: +1 (786) 9246977 Access in Portuguese: +55 (11) 46886361
HOPE NOW. Snapshot Industry Extrapolations and HAMP Metrics
 Snapshot Industry Extrapolations and HAMP Metrics Three Month Q2-215 Q3-215 Q4-215 Q1-216 Q2-216 Jun-16 Jul-16 Aug-16 Total Completed Modifications 119,658 97,773 84,798 86,167 1,198 41,872 34,815 36,6
Business Cycle Index July 2010
 Business Cycle Index July 2010 Bureau of Trade and Economic Indices, Ministry of Commerce, Tel. 0 2507 5805, Fax. 0 2507 5806, www.price.moc.go.th Thailand economic still expansion. Medium-run Leading
Conference Call Second Quarter 2013 Financial Results. Presentation3
 Conference Call Second Quarter 2013 Financial Results Presentation3 August 2, 2013 Agenda 1 Agenda 1 2 Opening Remarks 2Q13 Highlights 3 Operating and Financial Review 4 Closing Remarks 5 Q&A 2 1 Alicorp
Q Investor Presentation May 8, 2018
 Q1 2018 Investor Presentation May 8, 2018 Safe Harbor Disclosure and Definitions This presentation contains forward-looking statements. The use of words such as "anticipates," "estimates," "expects," "plans"
Corporate presentation March 2018
 Corporate presentation March 2018 Agenda Overview and Strategy Financial Performance Healthcare Sector in Brazil Expansion Plan Ownership Structure and Governance 2 Agenda Overview and Strategy Financial
HOPE NOW. Snapshot Industry Extrapolations and HAMP Metrics
 Snapshot Industry Extrapolations and HAMP Metrics Three Month Q4-2016 Q1-2017 Q2-2017 Q3-2017 Q4-2017 Oct-17 Nov-17 Dec-17 Total Completed Modifications 85,357 89,213 78,302 54,318 56,355 19,400 18,819
American Express Company Financial Community Meeting
 American Express Company Financial Community Meeting Kenneth Chenault Chairman and Chief Executive Officer Doug Buckminster President, International Consumer Card and Small Business Services February 9,
Corporate presentation August 2017 FLRY3
 Corporate presentation August 2017 FLRY3 Agenda Overview and Strategy Financial Performance Healthcare Sector in Brazil Expansion Plan Ownership Structure and Governance 2 Agenda Overview and Strategy
Earnings Release - 2Q14
 Earnings Release - 2Q14 Barueri, July 31, 2014 Smiles S.A. (BM&FBOVESPA: SMLE3), one of the largest loyalty programs in Brazil with over 10 million members, announces today its results for 1Q14. The financial
27 July 2018 Interim Results
 27 July 2018 Interim Results for the half year ended 30 June 2018 Disclaimer This presentation may contain forward-looking statements, including forward-looking statements within the meaning of the United
TERMS OF REFERENCE FOR THE INVESTMENT COMMITTEE
 I. PURPOSE The purpose of the Investment Committee (the Committee ) is to recommend to the Board the investment policy, including the asset mix policy and the appropriate benchmark for both ICBC and any
Foxtons Interim results presentation For the period ended June 2017
 Foxtons Interim results presentation For the period ended June 2017 Important information This presentation includes statements that are, or may be deemed to be, forward-looking statements. These forward-looking
Conference Call 2Q10 Results
 Conference Call 2Q10 Results In Portuguese with simultaneous translation in English Time: 12:00 pm (US-ET) / 1:00 pm (Brazil) Access in English: +1 (786) 924 6977 Access in Portuguese: +55 (11) 4688 6361
26 October 2016 MEXICO. January September 2016
 26 October 2016 MEXICO January September 2016 Disclaimer IMPORTANT INFORMATION Banco Santander, S.A. ( Santander ) Warns that this presentation contains forward-looking statements within the meaning of
Non-Deal Roadshow Presentation
 Non-Deal Roadshow Presentation 2 1 Disclaimer The material that follows is a confidential presentation of general background information about Qualicorp S.A. and its subsidiaries (collectively, Qualicorp
Annual Results Presentation
 Annual Results Presentation 28 February 2017 Capitec Bank Limited 1 Contents Key indicators Economic overview Banking clients Client service Credit Funding International Future Key indicators Capitec Bank
INSTITUTIONAL PRESENTATION 3Q18. p. 1
 INSTITUTIONAL PRESENTATION 3Q18 p. 1 Market under transformation and with high growth potential Company ready to capture increase in profitability PROFITABILITY Scale business with high dilution potencial
FY16 YEAR END RESULTS 5 APRIL 2016
 FY16 YEAR END RESULTS 5 APRIL 2016 DEFINITIONS AND IMPORTANT NOTICE The following definitions apply throughout Trading EBITDA (earnings before interest, tax, depreciation and amortisation): excludes exceptional
Ashtead Group plc. Growth and diversification. Analyst and Investor meeting 21 April 2016
 Ashtead Group plc Growth and diversification Growing complexity of the business needs to be considered when looking at key metrics Factors to consider General Tool and Specialty mix Mature stores vs new
The Hartford Financial Services Group, Inc. May 2017 Overview of The Hartford
 The Hartford Financial Services Group, Inc. May 2017 Overview of The Hartford Copyright 2017 by The Hartford. All rights reserved. No part of this document may be reproduced, published or posted without
Valuations. Apr 2016 ASX listed industrial company Valuation of divisions for purposes of evaluating bids
 2016 Valuations Jan 2016 ASX listed biotech Valuation of options for executive director Feb 2016 ASX listed financial services Valuation of business Feb 2016 ASX listed technology Valuation of director
ALPHA BANK: AGENDA 2010 REVISITED. Capital Markets Day. Bucharest, April 20, Retail Banking. G. Aronis, Executive General Manager
 ALPHA BANK: AGENDA 2010 REVISITED Retail Banking G. Aronis, Executive General Manager Capital Markets Day Bucharest, April 20, 2007 Strategic Emphasis on Retail Banking Rationalize product offering Apply
Evaluation of cost increase assumptions by medical schemes for the 2012 financial year
 CIRCULAR 54 of 2011 Reference : Evaluation of contribution increase assumptions for 2012 Contact : Nondumiso Khumalo Telephone : (012) 431 0514 Facsimile : (012) 431 0612 E-mail : n.khumalo@medicalschemes.com
Cost Estimation of a Manufacturing Company
 Cost Estimation of a Manufacturing Company Name: Business: Date: Economics of One Unit: Manufacturing Company (Only complete if you are making a product, such as a bracelet or beauty product) Economics
PRESS RELEASE. Securities issued by Hungarian residents and breakdown by holding sectors. January 2019
 7 March 2019 PRESS RELEASE Securities issued by Hungarian residents and breakdown by holding sectors January 2019 According to securities statistics, the amount outstanding of equity securities and debt
VANIG BUSINESS ANALYSIS
 VANIG BUSINESS ANALYSIS About US Market Analysis Contents ASEAN Competitor Analysis Risk Analysis Financial Analysis ABOUT US What is Vanig Vanig is an integrated e-commerce and supply chain solution powered
3Q15 Earnings Presentation
 Earnings Presentation 2 Agenda 1 Highlights...... 3 2 Consolidated Results....... 4 3 4 Famsa Mexico..... 6 Banco Famsa..... 7 5 Famsa USA...... 10 6 Financial Position Items...... 11 3 1. Highlights YTD
Adjusted Net Income. R$ million ,029 7,472 5,690 5,510 5,319
 APIMEC Meetings Disclaimer This presentation may include references and statements, planned synergies, estimates, projections of results and future strategy for Banco do Brasil, its Associated and Affiliated
Full Year 2012 Analyst and Investor Conference
 Full Year 2012 Analyst and Investor Conference DKSH Holding Ltd. Zurich, March 12, 2013 Welcome to the DKSH Full Year 2012 Analyst and Investor Conference Page 2 Executive Summary 2012: Another record
BANK HANDLOWY W WARSZAWIE S.A.
 BANK HANDLOWY W WARSZAWIE S.A. 2012 financial results Warsaw, 20 June, 2013 Macroeconomic environment Monetary policy Investments & Consumption NBP reference rate and inflation GDP growth and main components
LOCAMERICA Investors Institutional Presentation
 228, 132, 106 85, 134, 180 233, 234, 235 254, 221, 34 LOCAMERICA Investors Institutional Presentation 90, 90, 90 1, 64, 148 226, 31, 29 History of Entrepreneurship and Growth 1993 2000 2008 2012 2015/16
5 th ANNUAL SKBI CONFERENCE 2015ON "DIGITAL BANKING, FINANCIAL INCLUSION AND IMPACT INVESTING" P2P in China
 5 th ANNUAL SKBI CONFERENCE 2015ON "DIGITAL BANKING, FINANCIAL INCLUSION AND IMPACT INVESTING" P2P in China Dr. Rui, Oliver Meng(CFA, FRM) Professor of Finance and Accounting Director Ph.D. Program Co-director
Charles Mickey Flood. Joe Quarin. Investor Presentation May Executive Vice President, BFI Canada, CEO IESI. Chief Financial Officer BFI Canada
 Charles Mickey Flood Executive Vice President, BFI Canada, CEO IESI Joe Quarin Chief Financial Officer BFI Canada Investor Presentation May 2005 Safe Harbor Statement Our remarks and answers to your questions
Fixed Income Presentation 3Q17
 Fixed Income Presentation 3Q17 1 Agenda 1. Company Overview 2. Investment Highlights 3. Operating and Financial Highlights 2 Section 1 Company Overview 3 Company Overview Company Overview Competitive Advantages
Foundations of Investing
 www.edwardjones.com Member SIPC Foundations of Investing 1 5 HOW CAN I STAY ON TRACK? 4 HOW DO I GET THERE? 1 WHERE AM I TODAY? MY FINANCIAL NEEDS 3 CAN I GET THERE? 2 WHERE WOULD I LIKE TO BE? 2 Develop
Cover slide (same as IR cover)
") Integrated results for the year ended 31 March 2016 Cover slide (same as IR cover) 5 July 2016 This presentation is available at www.eskom.co.za/ir2016 Contents Overview of the year Financial review Operating
Integrated results for the year ended 31 March 2016 Cover slide (same as IR cover) 5 July 2016 This presentation is available at www.eskom.co.za/ir2016 Contents Overview of the year Financial review Operating
CFA EQUITY RESEARCH CHALLENGE 2014
 Milan February 2014 CFA EQUITY RESEARCH CHALLENGE 2014 A tailor-made investment Marta Giampietro Federico Braga Matteo Cataldi Davide Di Bucchianico Giovanni Galvani Agenda Introduction and investment
Banco Santander (Brasil) S.A.
 S.A.") Banco Santander (Brasil) S.A. 9M09 IFRS Results Pro forma October 28th, 2009 Table of Contents 2 Macroeconomic Scenario and Financial System 9M09 - Strategy -Results - Business Macroeconomic Scenario 3
Banco Santander (Brasil) S.A. 9M09 IFRS Results Pro forma October 28th, 2009 Table of Contents 2 Macroeconomic Scenario and Financial System 9M09 - Strategy -Results - Business Macroeconomic Scenario 3
Guideline for the preparation of a business plan pursuant to an application for an amalgamation of medical schemes as per Section 63 of the Medical
 as per Section 63 of the Medical Schemes Act 131 of 1998, as amended. September 2009 1. INTRODUCTION... 3 2. BUSINESS PLAN FORMAT... 4 2.1 EXECUTIVE SUMMARY... 4 2.1.1 Objective... 4 2.2 MEDICAL SCHEME
Institutional Presentation 1Q14
 Institutional Presentation 1Q14 1 I. GENERAL OVERVIEW II. BUSINESS ENVIRONMENT III. 1Q14 RESULTS IV. GROWTH OPPORTUNITIES 2 Cetip s Timeline 1984 Cetip is established as a not-for-profit organization 1986
Factor Leave Accruals. Accruing Vacation and Sick Leave
 Factor Leave Accruals Accruing Vacation and Sick Leave Factor Leave Accruals As part of the transition of non-exempt employees to biweekly pay, the UC Office of the President also requires standardization
Development of Economy and Financial Markets of Kazakhstan
 Development of Economy and Financial Markets of Kazakhstan National Bank of Kazakhstan Macroeconomic development GDP, real growth, % 116 112 18 14 1 113,5 11,7 216,7223,8226,5 19,8 19,8 19,3 19,619,7 199,
Discussion Material November, ParkShoppingSãoCaetano São Caetano (SP) 1
 1") Discussion Material November, 2017 ParkShoppingSãoCaetano São Caetano (SP) 1 Disclaimer This document may contain prospective statements, which are subject to risks and uncertainties as they were based
Discussion Material November, 2017 ParkShoppingSãoCaetano São Caetano (SP) 1 Disclaimer This document may contain prospective statements, which are subject to risks and uncertainties as they were based
February 2018 Company Overview
 February 2018 Company Overview SQUARE.COM/INVESTORS RUSTICA Minneapolis, MN Cautionary statement This document contains forward-looking statements within the meaning of Section 27A of the Securities Act
Fiscal 2014 Q3 Results
 Stephen MacPhail, President & CEO Doug Jamieson, Executive Vice-President & CFO Derek Green, President, CI Investments Steven Donald, President, Assante Wealth Management November 6, 2014 Important Information
Fixed Income Presentation 1Q18
 Fixed Income Presentation 1Q18 1 Agenda 1. Company Overview 2. Investment Highlights 3. Operating and Financial Highlights 2 Section 1 Company Overview 3 Company Overview Company Overview Competitive Advantages
Company Presentation. September 2017
 Company Presentation September 2017 Forward Looking Statement Disclaimer This presentation contains forward-looking statements that involve risks and uncertainties. These include statements regarding the
ANNOUNCEMENT OF PRELIMINARY RESULTS
 The leading high service distributor to engineers worldwide ANNOUNCEMENT OF PRELIMINARY RESULTS YEAR ENDED 31 MARCH 2009 29 May 2009 Agenda Overview and current trading Ian Mason Financial performance
Institutional Presentation 2016
 1 Institutional Presentation 2016 I. GENERAL OVERVIEW II. BUSINESS ENVIRONMENT III. 2016 IV. GROWTH OPPORTUNITIES 2 Cetip Overview Cetip is Latin America s largest depositary of private fixed income securities
HUD NSP-1 Reporting Apr 2010 Grantee Report - New Mexico State Program
 HUD NSP-1 Reporting Apr 2010 Grantee Report - State Program State Program NSP-1 Grant Amount is $19,600,000 $9,355,381 (47.7%) has been committed $4,010,874 (20.5%) has been expended Grant Number HUD Region
Earnings Results. Second Quarter 2015
 Earnings Results Second Quarter 2015 Forward Looking Statements This presentation contains, or may be deemed to contain, forward-looking statements. By their nature, forward-looking statements involve
It s a WIN-WIN when your health plan satisfies you and your employees.
 It s a WIN-WIN when your health plan satisfies you and your employees. Find out how you and your employees can have a WIN-WIN with your group health plan. Get your complimentary copy of Group Health Plans:
VTB Capital Investment Forum: Russia Calling October 2017
 VTB Capital Investment Forum: Russia Calling 2017 October 2017 Forward Looking Statement Disclaimer This presentation contains forward-looking statements that involve risks and uncertainties. These include
Amec Stewardship Code. October, 2016
 Amec Stewardship Code October, 2016 Agenda Amec Vision Amec Stewardship Code Amec Stewardship Code Principles Adherence and Monitoring Amec Vision Capital Markets development a crucial source of financing
PT EXCELCOMINDO PRATAMA Tbk. (XL)
") PT EXCELCOMINDO PRATAMA Tbk. (XL) 1H08 Corporate Presentation July 2008 1 Agenda 1. Management team and performance highlights 2. Our strategy XL Core business XL Tower business 3. Results to date 4. Summary
PT EXCELCOMINDO PRATAMA Tbk. (XL) 1H08 Corporate Presentation July 2008 1 Agenda 1. Management team and performance highlights 2. Our strategy XL Core business XL Tower business 3. Results to date 4. Summary
FEDERAL RESERVE BANK OF MINNEAPOLIS BANKING AND POLICY STUDIES
 FEDERAL RESERVE BANK OF MINNEAPOLIS BANKING AND POLICY STUDIES Minneapolis Options Report December 13 th Commodity Markets Option trading rose relative to two weeks ago to a more average level last week
OTHER DEPOSITS FINANCIAL INSTITUTIONS DEPOSIT BARKAT SAVING ACCOUNT
 WEIGHTAGES JAN FEB MAR APR MAY JUN JUL AUG SEPT OCT NOV DEC ANNOUNCEMENT DATE 19.Dez.14 27.Jän.15 24.Feb.15 26.Mär.15 27.Apr.15 26.Mai.15 25.Jun.15 28.Jul.15 26.Aug.15 23.Sep.15 27.Okt.15 25.Nov.15 MUDARIB
PY Principal Shareholder Yield Index ETF
 Principal Shareholder Yield Index ETF ETF.com segment: Equity: U.S. - Total Market Competing ETFs: QUAL, DGRO, MOAT, PKW, FNDB Related ETF Channels: North America, U.S., Smart-Beta ETFs, Broad-based, Total