NKT Holding. Den Danske Finansanalytikerforening Virksomhedsdag 2012
|
|
|
- Blaze Wood
- 5 years ago
- Views:
Transcription
1 NKT Holding Den Danske Finansanalytikerforening Virksomhedsdag 2012
2 Agenda 2 Facts about NKT (5 min) SWOT Analysis (15 min) Value drivers in Cash Flow / Cash Conversion / Shareholder Value (20 min)


3 The history erne Diversification ,6 bn. DKK revenue + 30 companies employees - 75% in DK - 25% abroad + 70% of revenue in DK ,5 bn. DKK revenue 4 divisions employees - 18% in DK - 82% abroad 6% of revenue in DK Market cap 7,1 bn. DKK EPS 11 DKK App. 20 bn. DKK revenue 7-8% organic growth Operational EBITDA-margin 14-15% ROI 20% EPS 50 DKK

4 Group structure June NKT Cables North, Central and Eastern Europe, China, Australia NKT Holding Nilfisk-Advance Photonics Group NKT Flexibles 51% Global presence NKT Photonics Lios Technology Vytran Ownership: NKT Holding: 51% Subsea 7: 49% In February 2012 agreement was signed concerning sale of NKT Flexibles to National Oilwell Varco. Transaction closed in April
5 62 Manufacturing PMI USA EURO zone Expectation indicator Above the line indicates positive expectations for the manufacturing sector and below the line indicates declining expectations for the manufacturing sector Below the line indicates expectations of recession
 12% 7-8% Goal 2015 2010 Goal 2015 Gearing (NIBD/Equity) 100% <100% Operational EBITDA margin, std.")
6 Strategy Powered by NKT Revenue, market prices (bndkk) 14,5 ap. 20 Revenue, std. prices (bndkk) 11,5 ap. 16 Average organic growth (CAGR) 12% 7-8% Goal Goal 2015 Gearing (NIBD/Equity) 100% <100% Operational EBITDA margin, std. prices 8,6% 14-15% NIBD/Operational EBITDA 4,2x <2,5x Solvency ratio 33% >30% Return on Capital Employed (RoCE) 7,5% 20% Earnings per share, EPS (DKK) 11,3 50 Strategic goals based on current levels for commodity prices, interest rates and currencies, etc. Expected growth of 1-3% in developed markets and 5-10% in emerging markets Unchanged view on optimal capital structure Continued best owner philosophy Appreciation of powering capabilities Structure, i.e. current number of business units and their exact scope not set in stone for the full strategy period but expected to remain unchanged during first half of the period


7 Megatrends 7


8 NKT Cables 8 VISION NKT Cables is creating value for its customers by providing solutions with cables


9 Energy flow with NKT Cables product range 9 Submarine cables VALCAP Monitoring OPGW- /OPPC- Accessoires HV accessoires up to 500 kv 30 kv 500 kv OPGW /OPPC HV cables up to 500 kv 110 kv- 500 kv 500 kv Superconducting cables 10 kv 30 kv 1 kv MV cables 10 kv - 30 kv Accessoires 10 kv - 36 kv 1 kv-cables Cabinets and Boxes Installation cables
 (Offshore)* Three core cables up to 1.2000 m (36 kv) (Offshore)* High voltage wind farm connections Single core cables up to 3.")
10 Product Scope for Sea Cables Cluster cables Complete scope of three core cables (Offshore)* Medium voltage wind farm connections Single core cables up to m (36 kv) (Offshore)* Three core cables up to m (36 kv) (Offshore)* High voltage wind farm connections Single core cables up to m (145 kv) (Offshore)* High voltage wind connections (Onshore) Three core cables (170 kv) Single core cables (420 kv) Accessories Appropriate accessories are available for all the cables mentioned (On and Offshore) Fibre Optic based monitoring with Real Time Thermal Rating system (RTTR) NKT own System for cables systems (On and Offshore) All cable types are available with integrated optical fibres (On and Offshore) From 2009 onwards longer cables lengths will be available
11 NKT Cables Sales by Customers Industry 30% Utilities 41% Wholesales 29% Sales by Markets Other 27% Asia 13% Railway 7% Denmark 9% Eastern Europe 26% Other 6% Germany 25% Sales by Fields of Applications (Products) Automotive 5% Construction 19% Electricity Infrastructure 63% 63% HV+offshore 33% MV 18% Other 12% Manufacturing and Sales Companies Sales Entities Sales by Customers and Fields of Applications are based on std. prices for FY Sales by Markets is based on market prices for FY 2011.

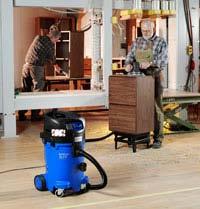


12 Nilfisk-Advance MISSION We enable sustainable cleaning worldwide to improve quality of life
13 Nilfisk-Advance Sales by Customers Domestic 12% Industrial 36% Commercial 52% Sales by Markets APAC 12% Americas 24% EMEA 64% Sales by Products Service 8% Other sales 7% Sales Entities Manufacturing Companies High pressure washers 19% Vacuum cleaners 25% Floor-care 41% All data based on FY 2011
14 Nilfisk-Advance - Industry trends Growth in emerging markets Sustainability Customer WC reduction Consolidation Continued cleaning outsourcing Emerging markets are gradually adapting cleaning standards of developed countries, driven in particular by entrance of supermarket chains (requiring modern cleaning standards) Requirements for reduction of power, water and detergents Increasing demands for suppliers being green throughout entire business system Customers focusing on cash and predictability and asking for innovative solutions Large customers are demanding that suppliers take over the responsibility for entire fleets of machines, including servicing and proposals for refurbishments/replacements Consolidation in the industry is expected to continue in order to gain scale advantages and broaden product range and geographical reach Contract cleaners taking increasing share of cleaning/facility management across all customer segments Increasing professionalisation of contract cleaners central purchasing


15 Photonics Group 15 15
16 Photonics Group Sales by entities Vytran 30% Lios Technology 22% NKT Photonics 48% HQ NKT Photonics HQ Lios Technology HQ Vytran All data based on FY 2011
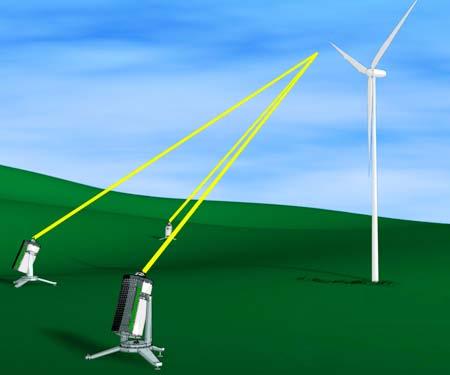
17 Photonics Group Ultra Precise Lasers KOHERAS High Power Fiber Lasers Crystal Fibre Super Continuum (White Light) KOHERAS & Crystal Fibre Distributed Temperature Sensing LIOS Technology Security (Perimeter) Wind measurements Oil exploration and exploitation Large displays Cutting and welding Semiconductor and solar cell production Anti missile defence Marking Biotech/microscopy Measurement/test equipm. Semiconductor inspection Surface topography Fire detection Power cable monitoring Oil exploitation LNG terminals and tankers High temp. ovens Market growing from low base New functionality drives application market Potential market of 1 bn. DKK Global market size: ~ 1,1 bn. DKK 9% of total laser market 30-40% annual growth rate Substitution from conventional lasers Market growing from low base New functionality drives application market Potential to substitute conventional laser market of estimated 1 bn. DKK Global market size: ~ 0,5 bn. DKK Market for power cable monitoring and oil exploitation expects to show strong growth
18 Agenda Facts about NKT (5 min) SWOT Analysis (15 min) Value drivers in Cash Flow / Cash Conversion / Shareholder Value (20 min)
19 19 19 SWOT Analysis Healthy Balance Sheet Clear strategy supported by compelling mega trends Global mindset and footprint Further improvement potential Diversity in business portfolio yields balanced risk Good Corporate Governance and CSR in place Long term industrial approach minded at superior value creation Active ownership
20 20 20 SWOT Analysis Cable division underperforming - Deployed assets yet underutilised - Offshore segment immature - Exposure to large projects - Exposure to delays on customer side Photonics remains to develop into industrial division Nilfisk-Advance lacks service offerings in US due to indirect distribution model
21 21 21 SWOT Analysis EU energy policy Renewable energy Emerging markets Continued polarisation in professional cleaning equipment sector China infrastructure Continued urbanisation Consolidation in industries
22 22 22 SWOT Analysis Adverse macro economic development Euro collapse Political exposure in China Consolidation in industries
23 Agenda Facts about NKT (5 min) SWOT Analysis (15 min) Value drivers in Cash Flow / Cash Conversion / Shareholder Value (20 min)
24 Value creation in a 25 year perspective Value ,2 bn. DKK Value ,0 bn. DKK Dividend pay-out 6,3 bn. DKK Shareholder return: > 9% annual return = 9,4 times pay back of investment 1,2 11,3
25 Cash generation mdkk Q4-07 Q1-08 Q2-08 Q3-08 Q4-08 Q1-09 Q2-09 Q3-09 Q4-09 Q1-10 Q2-10 Q3-10 Q4-10 Q1-11 Q2-11 Q3-11 Q4-11 Q Cash flow - operations LTM Free cash flow LTM Cash flow - investments LTM (excl. acquisitions) Operationelt EBITDA LTM

26 Ambitions Return on invested capital Working Capital management Tax management Capital structure Target: Increase 10% points Target: Reduce 2-3% points Target: 20-25% of EBT Target: NIBD/EBITDA < 2,5x Capex management Maintenance Capex: 250 mdkk Product dev. etc: 150 mdkk Cash Conversion (EBITDA to CFFO) : 70-80% (EBIT to FCF) : 70-80% FCF Yield of current Market Cap: 10 20% p.a.
27 Return on invested capital RoCE determines capital allocation - Capacity expansions - Acquisitions - Product development Leavers to increase return: - Customer Satisfaction - People & Performance - Risk Management - Growth combined with operational gearing - Product portfolio management (high value added) - Capacity utilisation (existing markets / new markets) - Price management ( Return on Customers ) - Cost competitive products (Mgt. footprint, sourcing) - Reduce complexity - Strict overhead cost control - Reduce Working Capital - Capex management / Positioning in the value chain


28 Return on invested capital Heavy pruning What do we do Analyse all cost related to specific product variants Work to correct prices or eliminate variants Modularity What do we do Define a vision of 100% modularity Include modularity principles in new product development Barnacles What do we do Define healthy business policies and processes around customer profitability Support implementation of these processes in small and medium-sized sales companies


29 Return on invested capital Delivery performance on par with or above industry average Service sustained at 95%/98% Global Operations Global Operations structure Reduce future inventory levels Next wave of improvements defined Rethink our structure and service levels
 Energy policy in EU What do we")

 25% of total Capital Employed / 40% of Tangible Fixed Assets are structurally well positioned, but yet")
30 Return on invested capital China HV Market What do we do Acquired Chinese factory with HV capabilities Factory upgrade to our standards Qualification of HV products (220 kv and above) Energy policy in EU What do we do Build a new HV factory with subsea cable capabilities Establish a project organisation Step-up on mgt. capacity and risk management High Speed Rail in China What do we do Waiting for re-activation by Ministry of Railway Factories in ramp-up mode Technology development Expand offering to rail segment (MV cables, Signal cables) 25% of total Capital Employed / 40% of Tangible Fixed Assets are structurally well positioned, but yet underutilised


31 Return on invested capital 31 31
32 Working Capital management ,0 Inventory NET in Days, excluding POC element 350, WC in % of MP 30,0% Inventory in COGS Days 120,0 100,0 80,0 60,0 40,0 20, ,0 250,0 200,0 150,0 100,0 50,0 Inventory in m Working Capital in m LTM ,0% 20,0% 15,0% 10,0% 5,0% 0,0% 0,0 0,0 WC monthly in m LE I BU 12 WC in %of Net Sales LTM WC in %of Net Sales 3 mth Inventory in m Inventory days 3 months Inventory days 12 months of 3 months Trade account receivables in Days Trade accounts receivables Days ,0 200,0 150,0 100,0 50,0 Trade accounts receivables in m Trade Accounts Payables in Days Trade Accounts Payables in Days Trade accounts payables in m 0 0,0 0 0 BU 12 LE I Trade receivables in m Trade receivables days 3 months Trade receivables days 12 months of 3 months BU 12 LE I Trade Paybles in m Trade Payables days 3 months Trade payable days 12 months of 3 months


33 Working Capital management 33 33


34 Capex management Gross CAPEX in Q is 89 mdkk vs. Q1 2011: 99 mdkk mdkk CAPEX ex. Cologne and Cangzhou Cologne and Cangzhou % of revenue (LTM) 0,1 0,09 0,08 0,07 0,06 0,05 0,04 0,03 0,02 Other 2% Nilfisk- Advance 28% NKT Cables 70% Investments in intangible assets in Q are 36 mdkk vs. Q1 2011: 29 mdkk jan jan jan-09 jan jan-11 jan-12 0,01 0 NKT Cables Other 5% 17% Nilfisk- Advance 78%
35 Capital structure mdkk Net interest bearing debt, mdkk Q ,0x 4.821mDKK Net interest bearing debt relative to operational EBITDA Q ,3x mdkk 6,0x 5,0x 4,0x NIBD of mdkk as per 31 March 2012 vs mdkk as per 31 December 2011 End net interest bearing debt amounts to 4,3x operational EBITDA (end 2011: 4,3x). Max. NIBD of 2,5x operational EBITDA remains the internal target. Proforma (incl. the sale of NKT Flexibles) 2,4x Q1-08 Q2-08 Q3-08 Q4-08 Q1-09 Q2-09 Q3-09 Q4-09 Q1-10 Q2-10 Q3-10 Q4-10 Q1-11 Q2-11 Q3-11 Q4-11 Q1-12 Profo 3,0x 2,0x 1,0x 0,0x Gearing of 109% (Q1 2011: 121%). Max. ratio of 100% remains the internal target. Proforma (incl. the sale of NKT Flexibles) 46% Solvency ratio of 30% (Q1 2011: 29%). Ratio >30% remains the internal target. Proforma (incl. the sale of NKT Flexibles) 41%
NKT. Annual Report 2010 Live presentation 1 March 2011 at 11:00 am. NKT Holding A/S / IR presentation / Annual Report
 NKT Annual Report 2010 Live presentation 1 March 2011 at 11:00 am NKT Holding A/S / IR presentation / Annual Report 2010 1 Agenda NKT Group 2010 in headlines Expectations 2011 Financial results 2010 NKT
NKT I IR presentation I Interim Report Q May 2013 I 1 NKT. Interim Report Q Audiocast, 22 May 2013 at 10:00 am CET
 22 May 2013 I 1 NKT Interim Report Q1 2013 Audiocast, 22 May 2013 at 10:00 am CET 22 May 2013 I 2 Agenda NKT Highlights Q1 2013 Financial results Q1 2013 Companies NKT Cables Nilfisk-Advance Photonics
NKT Holding. Interim Report Q Audiocast presentation 8 November 2012 at 10:00 am CET
 NKT Holding Interim Report Q3 2012 Audiocast presentation 8 November 2012 at 10:00 am CET Agenda Page Page 2 2 NKT Group Highlights Q3 2012 Financial results Q3 2012 Companies NKT Cables Nilfisk-Advance
Finansanalytikerforeningens Virksomhedsdag 2008 Presentation of NKT Group June 3, 2008 v/ CFO Michael Lyng
 Finansanalytikerforeningens Virksomhedsdag 2008 Presentation of NKT Group June 3, 2008 v/ CFO Michael Lyng 1 116 years history of innovation and entrepreneurship From growth oriented industrial conglomerate
NKT I IR presentation I Interim Report Q November 2013 I 1 NKT. Interim Report Q Webcast, 20 November 2013 at 10:00 am CET
 20 November 2013 I 1 NKT Interim Report Q3 2013 Webcast, 20 November 2013 at 10:00 am CET 20 November 2013 I 2 Forward looking statements This presentation and related comments contain forward-looking
INTERIM REPORT Q2-2011
 INTERIM REPORT Q2-2011 Live presentation 23 August 2011 at 11:00 am NKT Holding A/S / IR presentation / Interim Report 2, 2011 1 Agenda Highlights Q2 Financial results Q2 2011 Companies - NKT Cables -
NKT I IR presentation I Annual Report February 2014 I 1 NKT. Annual Report Webcast, 28 February 2014 at 9:00 am CET
 28 February 2014 I 1 NKT Annual Report 2013 Webcast, 28 February 2014 at 9:00 am CET 28 February 2014 I 2 Forward looking statements This presentation and related comments contain forward-looking statements.
NKT I Annual Report 2014 I Webcast. 27 February 2015 I 1 NKT. Annual Report Webcast, 27 February 2015, 10:00 CET
 27 February 2015 I 1 NKT Annual Report 2014 Webcast, 27 February 2015, 10:00 CET 27 February 2015 I 2 Forward looking statements This presentation and related comments contain forward-looking statements.
Interim report Q3 2016
 NKT I Interim report Q3 2016 I Webcast 11 November 2016 I 1 6 Interim report Q3 2016 Webcast, 11 November 2016, 09:30 CET NKT I Interim report Q3 2016 I Webcast 11 November 2016 I 2 Forward looking statements
NKT I Interim Report Q I Webcast. 13 May 2015 I 1 NKT. Interim Report Q Webcast, 13 May 2015, 08:30 CET
 13 May 2015 I 1 NKT Interim Report Q1 2015 Webcast, 13 May 2015, 08:30 CET 13 May 2015 I 2 Forward looking statements This presentation and related comments contain forward-looking statements. Such statements
August 2018 Interim Report Q2 2018
 August 2018 Interim Report Q2 2018 Investor presentation Forward looking statements This presentation and related comments contain forward-looking statements. Such statements are subject to many uncertainties
NKT I IR presentation I Interim Report Q November 2014 I 1 NKT. Interim Report Q Webcast, 13 November 2014 at 10:00 CET
 13 November 2014 I 1 NKT Interim Report Q3 2014 Webcast, 13 November 2014 at 10:00 CET 13 November 2014 I 2 Forward looking statements This presentation and related comments contain forward-looking statements.
NKT I Zürich Roadshow March 2017 I 1. Zürich - Roadshow. March 2017
 NKT I Zürich Roadshow March 2017 I 1 6 Zürich - Roadshow March 2017 NKT I Zürich Roadshow March 2017 I 2 Forward looking statements This presentation and related comments contain forwardlooking statements
27 February 2018 Annual Report 2017
 27 February 2018 Annual Report 2017 Webcast presentation Forward looking statements This presentation and related comments contain forward-looking statements. Such statements are subject to many uncertainties
17 August 2017 Interim Report Q2 2017
 17 August 2017 Interim Report Q2 2017 Webcast presentation Forward looking statements This presentation and related comments contain forward-looking statements. Such statements are subject to many uncertainties
NKT I Annual Report 2016 I Webcast 21 February 2017 I 1. Annual Report Webcast, 21 February 2017
 NKT I Annual Report 2016 I Webcast 21 February 2017 I 1 6 Annual Report 2016 Webcast, 21 February 2017 NKT I Annual Report 2016 I Webcast 21 February 2017 I 2 Forward looking statements This presentation
Interim Report Q3 2013
 Interim Report Q3 2013 NKT Holding A/S, Interim Report Q3 2013 20 November 2013, Announcement No. 18 CONTENTS Management s review Key messages 2 Financial highlights 3 The NKT Group 4 - NKT Cables 8 -
NKT Interim Report Q3 2015
 I 1 NKT Interim Report Q3 2015 Webcast, 12 November 2015, 10:00 CET I 2 Forward looking statements This presentation and related comments contain forwardlooking statements Such statements are subject to
Annual Report NKT annual report 2007 / xxx lxxx xx 1
 Annual Report 2007 NKT annual report 2007 / xxx lxxx xx 1 Contents Page 2007 in brief 4 5 years financial highlights 5 Management report 2007 Review of financial statements 6 Expectations 2008 9 Corporate
Interim Report Q1 2013
 Interim Report 2013 NKT Holding A/S, Interim Report 2013 22 May 2013, Announcement No. 11 Contents Management s review Key messages 2 Financial highlights 3 The NKT Group 4 - NKT Cables 8 - Nilfisk-Advance
The Chairman s report 2012
 Page 1 Page 2 Page 3 A/S Annual Report 2012 The Chairman s Report 1/16 The Chairman s report 2012 The NKT Group of today has been created on the basis of active ownership. As we saw in the film, the Group
Company Presentation. Cable Conference. ABN AMRO - London, 10th January 2008
 Company Presentation Cable Conference ABN AMRO - London, 10th January 2008 Agenda Company Overview Financials Outlook Appendix 1 A Global Cable Manufacturer The Prysmian Group operates 54 plants, has subsidiaries
Interim Report Q1 2017
 NKT A/S I Interim Report Q1 2017 I Webcast 17 May 2017 I 1 Interim Report Q1 2017 Webcast, 17 May 2017 NKT A/S I Interim Report Q1 2017 I Webcast 17 May 2017 I 2 Forward looking statements This presentation
16 November 2018 Interim Report Q3 2018
 16 November 2018 Interim Report Q3 2018 Webcast presentation Forward looking statements This presentation and related comments contain forward-looking statements. Such statements are subject to many uncertainties
FY 2017 FINANCIAL RESULTS. Milan February 27 th, 2018
 FY 2017 FINANCIAL RESULTS Milan February 27 th, 2018 1 AGENDA FY 2017 Highlights o o Group overview Results by business Financial results Appendix 2 Key Achievements of 2017 General Cable Acquisition Leadership
FY 2016 Financial Results. Milan March 1st 2017
 FY 2016 Financial Results Milan March 1st 2017 Agenda FY 2016 Highlights o o Group overview Results by business Financial results Appendix FY 2016 Financial Results 2 FY 2016 Highlights Adj. EBITDA at
Interim Report Q3 2016
 11 November 2016, Announcement No. 53. NKT Holding A/S, Vibeholms Allé 25, DK-2605 Brøndby, CVR No. 62 72 52 14 Interim Report Q3 2016 CONTENTS Management s review Financial highlights 2 Key messages 3
Q Financial Results. Milan May 10th, 2016
 Q1 2016 Financial Results Milan May 10th, 2016 Agenda Q1 2016 Highlights o o o Group overview Results by business Outlook Financial results Appendix Q1 2016 Financial Results 2 Q1 2016 Highlights Organic
H Financial Results. Milan July 28th, 2016
 H1 2016 Financial Results Milan July 28th, 2016 Agenda H1 2016 Highlights o o o Group overview Results by business Outlook Financial results Appendix H1 2016 Financial Results 2 H1 2016 Highlights Organic
H FINANCIAL RESULTS. Milan September 18 th, 2018
 H1 2018 FINANCIAL RESULTS Milan September 18 th, 2018 1 AGENDA H1 2018 Highlights o o o Group overview Results by business Outlook Financial results Appendix 2 H1 2018 Financial Highlights Organic sales
Nilfisk Q2 Interim Report 2018 Webcast presentation August 14
 Webcast presentation August 14 Agenda 1 2 3 4 5 Highlights Business unit update Financials Outlook 2018 Q&A 2 Strong financial performance in Q2 Financial highlights Strong financial performance with organic
Full-year 2008 Results. February 19, 2009
 Full-year 2008 Results February 19, 2009 Disclaimer All forward-looking statements are Schneider Electric management s present expectations of future events and are subject to a number of factors and uncertainties
Q FINANCIAL RESULTS. Milan May 10 th, 2018
 Q1 2018 FINANCIAL RESULTS Milan May 10 th, 2018 1 AGENDA Q1 2018 Highlights o o o Group overview Results by business Outlook Financial results Appendix 2 Q1 2018 Financial Highlights Organic growth recovery
FY 2018 FINANCIAL RESULTS. MILAN March 5 th,2019
 FY 2018 FINANCIAL RESULTS MILAN March 5 th,2019 AGENDA FY 2018 Highlights o Group overview o Results by business o Outlook Financial Results Appendix 2 FY 2018 Financial Highlights Fully combined organic
2014 Annual Report. NKT Holding A/S, Company Reg. No
 2014 Annual Report NKT Holding A/S, Company Reg. No. 62 72 52 14 This Annual Report was published on 27 February 2015 in English via Nasdaq Copenhagen. The Annual Report can also be found at www.nkt.dk
BUSINESS YEAR 2017/18 2 nd QUARTER, 1 st HALF
 BUSINESS YEAR 2017/18 2 nd QUARTER, 1 st HALF Investor Relations November 2017 www.voestalpine.com OVERVIEW BUSINESS MODEL» voestalpine is a leading technology and capital goods group with combined material
Schaeffler AG 17 th GCC Kepler Cheuvreux. Jan 17, 2018 Frankfurt
 Schaeffler AG 17 th GCC Kepler Cheuvreux Jan 17, 2018 Frankfurt Disclaimer This presentation contains forward-looking statements. The words "anticipate", "assume", "believe", "estimate", "expect", "intend",
NKT Annual General Meeting 2018
 NKT Annual General Meeting 2018 Demerger of Nilfisk completed Listed entity Underlying businesses NKT A/S Nilfisk Discontinued operation Key highlights NKT is a leading AC 1 and DC 2 high-voltage power
Group presentation. November 2007
 Group presentation November 2007 Safe Harbor This presentation contains forward-looking statements relating to the Group s expectations for future financial performance, including sales and profitability.
FY 2015 Financial Results. Milan February 24th, 2016
 FY 2015 Financial Results Milan February 24th, 2016 Agenda FY 2015 Highlights o o o Group overview Results by business Focus on OCI Acquisition Financial results Appendix FY 2015 Financial Results 2 FY
H Financial Results
 Milan, 7 th August 2012 Presentation title Prysmian Group Date 1 AGENDA Highlights & 2012 Outlook Financial Results Appendix 2 Key Financials Euro Millions, % on Sales Sales Adjusted EBITDA (4) Adjusted
Annual General Meeting 2016
 I 1 6 Annual General Meeting 2016 I 2 Long-term transformation towards increased value creation Nilfisk NKT Cables NKT Photonics Accelerate Growth Consolidating market-leading position Selected initiatives:
Half year results TKH Group NV
 Half year results 2014 TKH Group NV 1 Half year results 2014 19-08-2014 Content 1 About TKH Group 2 Developments 1 st half year 2014 3 Notes to the results 1 st half year 2014 4 Strategic developments,
Interim Report Q1 2017
 NKT A/S, Vibeholms Allé 25, DK-2605 Brøndby, Company Reg. No. 62 72 52 14 Interim Report Q1 2017 CONTENTS Management s review Intention to split NKT A/S 2 Key messages 3 NKT 4 NKT Photonics 9 Group financials
H Financial Results
 Milan August 1 st, 2013 1 AGENDA H1 2013 Highlights & FY 2013 Outlook Financial Results Appendix 2 H1 2013 Key Financials Euro Millions, % on Sales Sales Adjusted EBITDA (3) Adjusted EBIT (4) -1.8% * 7,973
COMPANY PRESENTATION. Danske Markets, December 1 st 2011 PAGE 1
 COMPANY PRESENTATION Danske Markets, December 1 st 2011 PAGE 1 AGENDA 1. Introduction to Topsil 2. Market outlook 3. Strategy 4. Financials DISCLAIMER: This presentation includes forward-looking statements
Nilfisk Q3 Interim Report 2018 Webcast presentation November 14, 2018
 Nilfisk Q3 Interim Report 2018 Webcast presentation November 14, 2018 Agenda 1 2 3 4 5 Highlights Business unit update Simplifications initiatives Financials Outlook 2018 6 Q&A 2 Q3 2018 results Financial
ROADSHOW PRESENTATION. March 2010
 ROADSHOW PRESENTATION March 2010 Disclaimer This presentation does not constitute or form part of, and should not be construed as, any offer or invitation to subscribe for, underwrite or otherwise acquire,
The LEONI Group. 1 st Quarter The Quality Connection
 The LEONI Group 1 st Quarter 2015 The Quality Connection Contents 1. LEONI Group 2. LEONI Divisions 3. Report 1 st Quarter 2015 4. Outlook 5. Appendix LEONI AG 2 LEONI Group Divisions 2014 Divisions Sales
Zurich, February 16, 2012 ABB Q4 and full-year 2011 results Joe Hogan, CEO Michel Demaré, CFO
 Zurich, February 16, 2012 ABB Q4 and full-year 2011 results Joe Hogan, CEO Michel Demaré, CFO Safe-harbor statement This presentation includes forward-looking information and statements including statements
The LEONI Group. The Quality Connection
 The LEONI Group 2013 The Quality Connection Contents 1. LEONI Group 2. LEONI Divisions 3. Report 1 st 4 th Quarter 2013 4. Outlook 5. Appendix LEONI AG 2 LEONI Group Divisions 2013 Divisions Sales breakdown
Global leader in high-end vacuum valve technology
 FOURTH QUARTER AND FULL-YEAR 2016 RESULTS Global leader in high-end vacuum valve technology Heinz Kundert, CEO and Andreas Leutenegger, CFO March 31, 2017 1 Agenda 1 2 3 Highlights Fourth quarter and full-year
Analyst and Investor Conference 2016 Dieter Bellé, Bruno Fankhauser, Dr Frank Hiller. The Quality Connection
 Analyst and Investor Conference 2016 Dieter Bellé, Bruno Fankhauser, Dr Frank Hiller The Quality Connection Agenda 1. Group (Dieter Bellé) 2. Wiring Systems (Dr Frank Hiller) 3. Wire & Cable Solutions
Q2 INTERIM REPORT Nilfisk Holding A/S Company reg. no Kornmarksvej 1, DK-2605 Brøndby, Denmark
 Q2 INTERIM REPORT 2018 Nilfisk Holding A/S Company reg. no. 38 99 88 70 Kornmarksvej 1, DK-2605 Brøndby, Denmark Q2 IN BRIEF HIGHLIGHTS Nilfisk delivered a strong financial performance in Q2 Organic growth
Interim Report Q3 2017
 Interim Report Q3 2017 NKT A/S Vibeholms Allé 25, DK-2605 Brøndby Company Reg: 6272 5214 www.nkt.com Contents Management Review 03 Nilfisk demerged from NKT A/S 04 Key messages 06 NKT 12 NKT Photonics
BUSINESS YEAR 2017/18 1 st QUARTER
 BUSINESS YEAR 2017/18 1 st QUARTER Investor Relations September 2017 www.voestalpine.com voestalpine GROUP OVERVIEW» voestalpine is a leading technology and capital goods group with combined material and
technicolor.com 7 JUNE 2018
 technicolor.com 7 JUNE 2018 COUNTRIES SITES REVENUES Connected Home 57% 57% 2017 2016 16% 1% 26% Production Services 18% DVD Services 24% North America 53% 2017 2016 25% 16% 52% 7% Europe, Middle-East
Investor presentation Full year and Q March 2017
 Investor presentation Full year and Q4 2016 17 March 2017 2 Introduction Forward-looking statement The statements on the future in this presentation, including expected sales and earnings, are associated
9M 2018 FINANCIAL RESULTS. Milan November 14 th, 2018
 9M 2018 FINANCIAL RESULTS Milan November 14 th, 2018 1 AGENDA 9M 2018 Highlights o Group overview o Results by business Financial results Appendix 2 9M 2018 Financial Highlights Organic sales growth at
ANNUAL REPORT 2011 SEB Enskilda 29 MARCH 2012
 ANNUAL REPORT 2011 SEB Enskilda 29 MARCH 2012 AGENDA 2011 in summary Market development Financial performance 2011 Update on key projects Expectations for 2012 Appendix 2011 - A CHALLENGING YEAR FOR TOPSIL
FINAL TRANSCRIPT 27/02/ :00 GMT 01:18:29 NKT HOLDINGS A/S ANNUAL REPORT 2012
 Contents Corporate Participants Page 3 Conference Call Participants Page 3 Presentation Page 3 Question and Answer Page 16 InterCall Transcription Document Page 2 of 27 Commercial in Confidence Corporate
The LEONI Group 1 st 3 rd Quarter The Quality Connection
 The LEONI Group 1 st 3 rd Quarter 2016 The Quality Connection Contents 1. LEONI Group overview 2. LEONI Divisions 3. Report 1 st 3 rd Quarter 2016 4. LEONI Group figures 5. Outlook 6. Appendix LEONI AG
Schaeffler Group Mobility for tomorrow Klaus Rosenfeld Chief Executive Officer
 Schaeffler Group Mobility for tomorrow Klaus Rosenfeld Chief Executive Officer Capital Markets Day July 20 th, 2016 London Agenda 1 Overview 2 Our Strategy 3 Our Action Plan 4 Our Financial Ambitions 5
Interim Report Q1 2017
 NKT A/S I Interim Report Q1 2017 I Investor roadshow 24 May 2017 I 1 Interim Report Q1 2017 Roadshow, London, 24 May 2017 NKT A/S I Interim Report Q1 2017 I Investor roadshow 24 May 2017 I 2 Forward looking
Global leader in high-end vacuum valve technology
 HALF YEAR 2017 RESULTS Global leader in high-end vacuum valve technology Heinz Kundert, CEO, Andreas Leutenegger, CFO and Jürgen Krebs, COO August 24, 2017 1 Agenda 1 2 3 Highlights Second quarter and
A.P. Møller - Mærsk A/S Den Danske Finansanalytikerforening s virksomhedsdag 2012
 A.P. Møller - Mærsk A/S Den Danske Finansanalytikerforening s virksomhedsdag 2012 7 June 2012 page 2 Forward-looking statements This presentation contains forward-looking statements. Such statements are
Siemens Gamesa Renewable Energy Q Results
 Siemens Gamesa Renewable Energy Q2 208 Results 04 May 208 Disclaimer This material has been prepared by Siemens Gamesa Renewable Energy, and is disclosed solely for information purposes. This document
Interim Report Q2 2016
 18 August 2016, Announcement No. 38. NKT Holding A/S, Vibeholms Allé 25, DK-2605 Brøndby, CVR No. 62 72 52 14 Interim Report Q2 2016 CONTENTS Management s review Financial highlights 2 Key messages 3 Nilfisk
Part 1 Executing our strategy
 Entwurf 19.09.018 15h00 Part 1 Executing our strategy Klaus Rosenfeld Chief Executive Officer Capital Markets Day 018 Berlin Disclaimer This presentation contains forward-looking statements. The words
FY 2012 Financial Results
 Milan, 27th February 2013 1 AGENDA Highlights Group Overview Results by business Financial Results Appendix 2 2012 Key Achievements All targets fully achieved despite a worsening economic environment Adj.
Results FY 2017 Schaeffler AG. Conference Call March 7, 2018 Munich
 Results FY 2017 Schaeffler AG Conference Call Munich Disclaimer This presentation contains forward-looking statements. The words "anticipate", "assume", "believe", "estimate", "expect", "intend", "may",
Schouw & Co. Full Year 2017
 Schouw & Co. Full Year 2017 Investor presentation MARCH 2018 CEO JENS BJERG SØRENSEN IR KASPER OKKELS 2017 Annual Report 09.03.2018 2 Schouw & Co. value proposition 1 Diversified portfolio 2 3 Leading
AGENDA. Group Overview & 2003 Results pp Industrial Businesses 2003 Results pp Pirelli Real Estate 2003 Insights pp.
 FY 2003 Results SAFE HARBOUR This presentation contains statements that constitute forward-looking statements within the meaning of the Private Securities Litigation Reform Act of 1995. These statements
Strengthening the economic model
 Strengthening the economic model Cécile CABANIS Executive Vice President, Chief Financial Officer Strategy and Information Systems DISCLAIMER This document is presented by Danone. It contains certain forward-looking
Q BAKKAFROST GROUP Oslo 20 February 2018
 BAKKAFROST GROUP Oslo 20 February 2018 DISCLAIMER This presentation includes statements regarding future results, which are subject to risks and uncertainties. Consequently, actual results may differ significantly
NKT Holdings transforming transactions - in a treasury perspective
 NKT I Group Treasury I Split and acquisition in treasury perspective 15 March 2017 I 1 6 NKT Holdings transforming transactions - in a treasury perspective 15 March 2017 Torben Skovsted, Head of Group
Schouw & Co. first half of 2016
 Schouw & Co. first half of Investor presentation AUGUST The best H1 in Schouw & Co. s history Schouw & Co. H1 11.08. 2 Revenue DKK 6.1bn Growth 4.4% // H1: 5.9bn Organic decline from lower volume in BioMar
Management report Nilfisk Annual Report 2016
 Nilfisk Annual Report 2016 1 Annual Report 2016 Nilfisk Annual Report 2016 2 NILFISK AT A GLANCE Nilfisk is a leading player in the professional cleaning equipment industry 45 16 Nilfisk has sales companies
Investor presentation Q August 2018
 Investor presentation Q2 2018 16 August 2018 2 Introduction Forward-looking statement The statements on the future in this presentation, including expected sales and earnings, are associated with risks
Trelleborg Financials
 Trelleborg Financials Capital Markets Day Ulf Berghult, Chief Financial Officer Berns, December 6 Agenda Financial targets Group structure Continuing operations Trelleborg Group Updated financial targets
FULL YEAR 2018 Vestas Wind Systems A/S
 FULL YEAR Vestas Wind Systems A/S Copenhagen, 7 February 2019 DISCLAIMER AND CAUTIONARY STATEMENT This document contains forward-looking statements concerning Vestas financial condition, results of operations
Second quarter Vestas Wind Systems A/S. Copenhagen, 17 August Classification: Public
 Second quarter Vestas Wind Systems A/S Copenhagen, 17 August Classification: Public Disclaimer and cautionary statement This document contains forward-looking statements concerning Vestas financial condition,
Contents Nilfisk Q2 Interim Report Q2 Interim Report 2017
 Nilfisk Interim Report 1 Interim Report Nilfisk Interim Report 2 IN BRIEF Highlights of Performance in and the first half of in line with expectations 1.7% organic revenue growth for Nilfisk in and 3.0%
02 Key messages 04 Financial outlook 06 NKT 14 NKT Photonics 16 Group financials 17 Shareholder information
 Interim Report Management Review Financial Statements 02 Key messages 04 Financial outlook 06 NKT 14 NKT Photonics 16 Group financials 17 Shareholder information 18 Group Management s statement 20 Income
HELLA H1 2014/15 Roadshow Presentation. February 2015
 HELLA H1 2014/15 Roadshow Presentation February 2015 Disclaimer This document was prepared with reasonable care. However, no responsibility can be assumed for the correctness of the provided information.
BAKKAFROST INTRAFISH SEAFOOD INVESTOR FORUM London 13 September 2018
 BAKKAFROST INTRAFISH SEAFOOD INVESTOR FORUM London 13 September 2018 DISCLAIMER This presentation includes statements regarding future results, which are subject to risks and uncertainties. Consequently,
FY 2016 RESULTS. March 2 nd, 2017
 FY 2016 RESULTS March 2 nd, 2017 AGENDA Key messages & strategy execution Financial update 2017 outlook & conclusion FY2016 RESULTS 2 KEY MESSAGES & STRATEGY EXECUTION KEY MESSAGES 2016 results in line
Q and Full Year 2016 EARNINGS CONFERENCE. March 14, 2017 Zürich, Switzerland
 Q4 2016 and Full Year 2016 EARNINGS CONFERENCE March 14, 2017 Zürich, Switzerland Speakers Lukas Winkler, President and CEO Key figures Q4 2016 and FY 2016 Target market business review Expectations 2017
FINANCIAL RESULTS Q2 2011
 FINANCIAL RESULTS Q2 2011 Carnegie, August 26 th 2011 2 Q2 2011 and Market outlook (NTD, PFZ, EPI) 12 Comments to Q2 2011 financials AGENDA 18 Actions and Key Focus 20 Greenfield and 8 24 Adjusted guidance
2016 Full Year Results. February 9, 2017
 2016 Full Year Results February 9, 2017 Safe Harbor This presentation contains forward-looking statements which are subject to various expected or unexpected risks and uncertainties that could have a material
Interim report July - September 2016
 Interim report July - September 2016 October 19 th, 2016 Mikael Ericson, CEO Erik Forsberg, CFO 2 Q3 2016 Highlights Continued good financial development All financial targets met: EPS growth, PD RoI and
Contents Nilfisk Q2 Interim Report Q3 Interim Report 2017
 Contents Nilfisk Q2 Interim Report 1 Interim Report Contents Nilfisk Q2 Interim Report 2 IN BRIEF Highlights of Performance in and the first nine months of in line with expectations The outlook for organic
Interim announcement 1 st Half-year 2015
 Interim announcement 1 st Half-year 2015 Danfoss at a glance Danfoss engineers technologies that enable the world of tomorrow to do more with less. We meet the growing need for infrastructure, food supply,
GLOBAL EXPERT IN ELECTRICAL POWER AND ADVANCED MATERIALS MARCH, 2017
 GLOBAL EXPERT IN ELECTRICAL POWER AND ADVANCED MATERIALS MARCH, 2017 MERSEN: OUR MISSION WE DEVELOP THE BEST TECHNOLOGIES FOR THE INDUSTRIES OF THE FUTURE WE PROVIDE INDUSTRIAL COMPANIES AROUND THE WORLD
02 Key messages 04 NKT 10 NKT Photonics 12 Group financials 13 Shareholder information
 Interim Report Q1 2018 Management Review 02 Key messages 04 NKT 10 NKT Photonics 12 Group financials 13 Shareholder information Financial Statements 14 Group Management s statement 16 Income statement
Financial Year 2006/07
 Financial Year Investor Relations June 2007 www.voestalpine.com - Status Quo Revenue EBITDA EBIT FY 7.05 bn 1.37 bn 1.01 bn Divisions Steel Railway Automotive Profilform Systems Revenue/Division 49 % 27
FY 2013 Financial Results
 Milan February 25 th, 2014 1 AGENDA FY 2013 Highlights Group Overview Results by business Financial Results Appendix 2 2013 Key Achievements FY targets achieved despite continuous weak economic environment
Naturgy: Much More London, 28 th June 2018
 Naturgy: Much More 2018-2022 London, 28 th June 2018 Index and Content 1. Industry trends and our industrial model 2. Value creation pillars 3. Business units goals 4. Financing strategy 5. Commitment
BUY RECOMMENDATION. Switzerland. Vakuum Apparate Technik (engl.: vacuum device technology) CFA Institute Research Challenge.
 CFA Institute Research Challenge.") CFA Institute Research Challenge Switzerland Natalia Grudina Jeroen Zandbergen Vakuum Apparate Technik (engl.: vacuum device technology) Sam Wagner BUY RECOMMENDATION v Jonathan Pavillard Mark Temnikov
CFA Institute Research Challenge Switzerland Natalia Grudina Jeroen Zandbergen Vakuum Apparate Technik (engl.: vacuum device technology) Sam Wagner BUY RECOMMENDATION v Jonathan Pavillard Mark Temnikov
2007 Revenue and Results. 2007: strong increase in results Strengthened growth momentum. February 15 th, 2008
 2007 Revenue and Results 2007: strong increase in results Strengthened growth momentum February 15 th, 2008 2007 revenue and results Agenda A successful 2007 Be the recognized industry leader John Glen