17 August 2017 Interim Report Q2 2017
|
|
|
- Lorin Rose
- 6 years ago
- Views:
Transcription

1 17 August 2017 Interim Report Q Webcast presentation

2 Forward looking statements This presentation and related comments contain forward-looking statements. Such statements are subject to many uncertainties and risks, as various factors of which several are beyond NKT A/S control, may cause that the actual development and results differ materially from the expectations 2
")

 President &")
3 Today s presenters Michael Hedegaard Lyng NKT A/S (formerly NKT Holding) Group Executive Director Hans Henrik Lund Nilfisk President & CEO Basil Garabet NKT Photonics President & CEO NKT (formerly NKT Cables) President & CEO 3
4 Agenda Update on the intended split of NKT A/S (formerly NKT Holding A/S) Highlights Q Business units NKT (formerly NKT Cables) Nilfisk NKT Photonics Questions & Answers 4
5 Intention to split NKT A/S into two separately listed entities Listed entity NKT Nilfisk Discontinued operation Underlying businesses Key highlights NKT, including the acquired ABB HV Cables, is a leading AC and DC high-voltage power cables supplier with a strong project backlog Significant synergy potential A leading high-end photonics player Significant growth and M&A potential A leading global premium supplier of professional cleaning equipment products and services Organic growth potential and significant M&A opportunities Improved profitability potential Strong cash flow Revenue (2016) EUR 1,405m* EUR 43m EUR 1,059m * Pro forma figures are 2016 NKT actuals, combined with 2016 pro forma figures for ABB HV Cables. Revenue is in market prices 5
6 Current timeline for intended split of NKT A/S Expected dates 17 August 19 September 10 October 12 October 15 November Q Interim Report Capital Markets Day Extraordinary General Meeting First day of trading Q Interim Reports As two separately listed entities 6
7 Agenda Update on the intended split of NKT A/S (formerly NKT Holding A/S) Highlights Q Business units NKT (formerly NKT Cables) Nilfisk NKT Photonics Questions & Answers 7
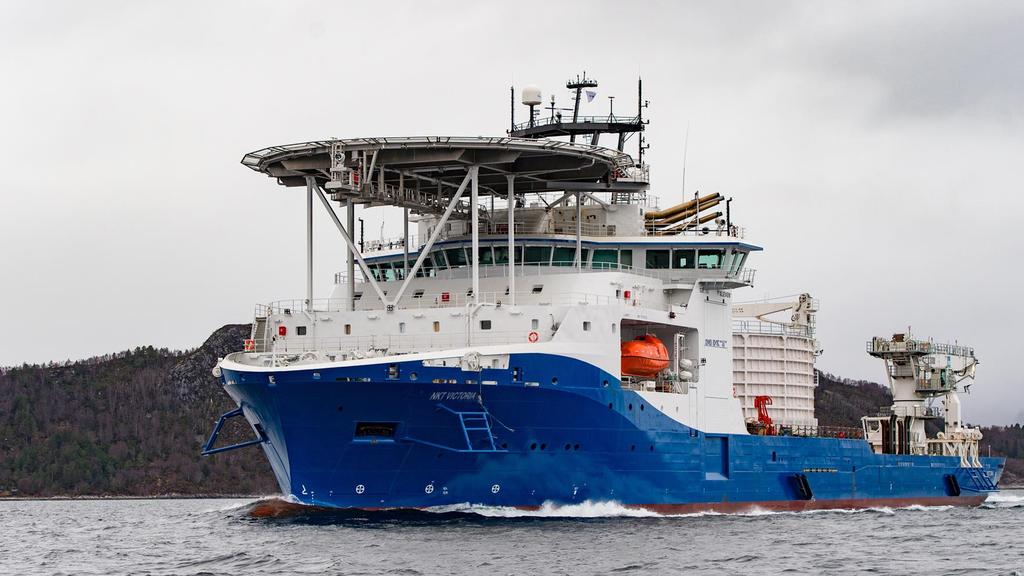
8 Group highlights Q Operational EBITDA more than doubled driven by ABB HV Cables Revenue* of EUR 288.1m was up by EUR 88.0m equivalent to organic growth of 8% driven by growth in the acquired ABB HV Cables business Operational EBITDA doubled to EUR 42.9m as the addition of ABB HC Cables drove higher profitability The integration of ABB HV Cables is progressing satisfactorily Divestment of Automotive business completed on 30 April 2017 NKT Victoria awarded Ship of the year in Norway and completed its first cable-laying campaign Strong organic growth and acquisition agreement announced EUR 11.2m in revenue, an increase of EUR 2.3m. Organic growth was 26% driven by Imaging & Metrology and Sensing & Energy segments EBITDA improved by EUR 1.0m to EUR 0.7m due to the increased revenue Agreement to acquire Onefive, a leading ultrafast laser supplier. Closing expected in beginning of September 2017 Appointment of new experienced COO Discontinued operation Continued revenue and margin improvements Performance in line with expectations as organic growth achieved in Q was 2% driven by continued growth in Americas EBITDA before special items increased by more than EUR 3m compared to Q as the gross margin was up due to improved product mix Hans Henrik Lund joined as CEO in the beginning of August 2017 as planned Launch of the new product, SC DELTA stationary high pressure washer * Std. metal prices 8
9 Financial outlook for 2017 maintained Revenue (EURm) Organic growth Operational EBITDA NKT ~EUR 1.1bn* - ~EUR 140m NKT Photonics - ~10% ~15% (margin) Nilfisk** - 2-4% % (margin) * Std. metal prices ** For Nilfisk, EBITDA before special items 9
10 Changes Q versus Q Continuing oper Incl. discontinued oper EURm Q Q Q Q Revenue Revenue, std.metal prices Operational EBITDA Oper. EBITDA margin, std.metal prices 14.6% 9.8% 13.7% 10.9% One-off s EBITDA Depreciation/Amortisation EBIT Financial items, net EBT Tax Profit for the year from continuing oper Profit for the year from discontinued oper Profit for the year RoCE 12.8% 9.3% CAPEX PPE Intangible assets Acquisition of business Working capital NIBD *01 EURm Revenue increased by Nilfisk (discontinued) 3.5 Revenue increased by (cont.) Metal prices 34.5 FX changes -3.3 Acquisitions 88.0 Divestments Organic growth 24.1 NKT 21.8 NKT Photonics 2.3 *02 EURm Operational EBITDA increased by 26.6 Nilfisk (discontinued) - Margin 12.8% (Q2 2016: 11.8%) Operational EBITDA increased by (cont.) NKT - Margin 14.9% (Q2 2016: 10.8%) 21.4 NKT Photonics 1.0 Other 0.8 *03 EURm EBITDA one-offs 7.8 NKT ABB integration costs 3.9 Excellence Cost related to split of NKT A/S 0.8 Nilfisk Accelerate+ 2.1 Cost related to split of NKT A/S
11 Delivery of NKT Victoria impacting cash flow Q2 1st half FY EURm EBITDA from continuing operations EBITDA from discontinued operations Financial items, net continuing and discontinued oper Change in working capital Other Cash flows from operating activities Acquisition of business Divestment of business Inv./disp. of property, plant and equipment, net Other investments, net Cash flows from investing activities Free cash flow Change in long- and short term loans Non-Controlling interest Dividend paid / dividends treasury shares Cash from disposal of treasury shares /share buyback Cash from issue of new shares / exercise of warrants Cash flows from financing activities Net cash flow The improved EBITDA contributed to better cash flows from operating activities, but a more normalised working capital in Nilfisk did offset the impact Delivery and payment of EUR 126m for NKT Victoria drew down cash flows from investment activities Cash flow from financing activities included further draw down for acquisition facilities 11
12 Net debt up as expected EURm x End x EUR -68m 0.5x Q2-2017* 2.6x EUR 742m 2,2x 2,6x 3,0x 2,5x 2,0x 1,5x 1,0x 0,5x With the payment of NKT Victoria net debt went further up since Q The development is in line with previous communication and the payments related to the acquisition has been finalised ,4x 0,0x -0,5x At Q2 2017, operational EBITDA (incl. Nilfisk), LTM, was EUR 230.8m Net interest-bearing debt Oper. EBITDA, Net interest-bearing LTM, % OF STD. debt METAL / oper. EBITDA, PRICES LTM -1,0x * For the Q1 and Q gearing ratios, pro forma EBITDA for the acquired ABB HV Cables activities has been added to LTM EBITDA in the period when NKT was not the owner of ABB HV Cables. The pro forma EBITDA is based on ABB HV Cables estimated average annual pro forma EBITDA of EUR 79m for

13
14 High-voltage offshore business driving organic growth Organic growth Quarterly (Y/Y) 6% -11% 1% -12% 16% 13% -12% 2% -24% -13% 1% -2% -8% 8% - Annually (year-to-date) -5% 4% -10% 1% Projects Q % Market Q % Offshore H % Onshore H % FY % Satisfactory execution in the offshore segment with continued progress on projects such as Caithness Moray, Hornsea and Nordlink Integration of the acquired ABB HV Cables business progressed satisfactorily with combined organisation taking shape The AC onshore market remains challenging Products Q % Market Q % Medium-voltage H % Low-voltage/BW H % Specialties FY % The low-voltage development was positive in Q with good activity in Germany, Sweden and UK Up against a strong development in Q due to the photo-year effect in Germany impacting medium-voltage Continued challenging market situation in Poland 14
15 High-voltage orders of more than EUR 1bn in backlog Orders on hand at EUR 1.03bn end-june 2017 Solid mix of high-voltage orders EURm ~60% ~40% and onwards HV on- and offshore combined Race Bank Galloper Dolwin 2 Walney East & West Nordergrunde Martin Linge Caithness Moray Rentel Johan Sverdrup Kriegers Flak Hornsea Nordlink Borssele Alpha Borssele Beta Q2 Q3 Q4 Q1 Q2 Q3 Q4 Q1 Q2 Q3 Q4 Potential 15
16 Operational EBITDA driven by increased high-voltage business EURm % 9.0% 9.7% 11.3% 12% 10% 8% 6% Improving margin reflects higher exposure to high-voltage market following acquisition of ABB HV Cables Operational EBITDA margin in Q amounted to 14.9% as earnings doubled versus Q % Oper. EBITDA, QTR Oper. EBITDA, LTM, % std.metal 2% 0% Q was the first quarter with full impact of the acquired ABB HV Cables business 16
17 Working capital gradually improving 25% 20% End % Q % Working capital improving as the high-voltage solutions segment is a larger part of revenue 15% 10% Positive impact from the acquisition of ABB HV Cables as well as the divestments of China and Automotive operations 5% Working capital was EUR -30.6m at end-june 2017 versus EUR 57.8m at end % Note: Working capital ratio calculated as average working capital as a percentage of revenues LTM 17


18 Strategic priorities for 2017 DEVELOP AND GROW FOCUS ON PROFITABILITY TURNAROUND AC/DC high-voltage offshore DC high-voltage onshore Building wire & Low-voltage AC high-voltage onshore Accessories Medium-voltage Railway 18
19 NKT Summary Financials Q2 1st half FY EURm Revenue ,003.7 Revenue, std metal prices Organic growth 8% -13% 1% -19% -10% Operational EBITDA Operational EBITDA margin* 14.9% 10.8% 12.8% 9.3% 9.7% RoCE, LTM 9.2% 6.1% 9.2% 6.1% 9.3% CAPEX PPE Intangible assets Acquisition of business Capital employed 1, , Working capital Cash flow from operating activities Cash flow from investing activities excl acq/div Free cash flow Full-time employees, end of period 3,358 3,148 3,358 3,148 2,769 Highlights and summary Organic growth positively impacted by development in the offshore high-voltage business both in Karlskrona with acquisition of ABB HV Cables - and Cologne The Products business impacted by competitive challenges in Eastern Europe and end of photo year in Germany compared to Q Integration of ABB HV Cables on track and NKT Victoria has completed its first campaign in Scotland Divestment of non-core Automotive business completed on 30 April 2017 RoCE up by 3.1%-points compared to Q Financial outlook for 2017 maintained Revenue (std. metal): ~EUR 1.1bn Operational EBITDA: ~EUR 140m * Std. metal prices 19


20 20

21 Continued strong performance in Americas Organic growth Quarterly (Y/Y) 9% 4% 0% 9% 0% 0% 4% -2% -1% 3% 4% 8% 5% 2% - Annually (year-to-date) 6% 0% 3% 3% Americas Q % H % EMEA Q % H % APAC Q % H % Specialty Q H Professional 0% 3% - Consumer -6% -8% Operating segments excl. Specialty Q % H % 21
22 Further improvement in operational EBITDA margin EURm EBITDA margin before special items in Q was 12.8%, up by 1%-point from Q % 10.1% 11.0% 11.9% 14% 12% 10% Improved margin driven by change in product mix and operational improvements % 6% Gross margin and EBITDA margin before special items in Q lower than Q Oper. EBITDA, QTR Oper. EBITDA, LTM, % 4% 2% 0% 2nd half 2017 EBITDA before special items expected to be lower than 1st half due to product mix, increasing raw material prices and higher overhead cost Note: Operational EBITDA = EBITDA before special items 22
23 Accelerate+ cost saving programme of EUR 35m EUR million 2016 H Expected annualised accumulated impact on EBITDA before special items (non- IFRS) related to levers executed prior to the end of each period Expected impact on reported EBITDA before special items (non-ifrs) in the income statement for the period Full potential end 2019* Accelerate+ cost savings programme of EUR 35m on track and with unchanged expectations The programme include cost savings from: Overhead reductions Production footprint Sourcing activities Complexity reductions Price management * Annualized expected savings from levers expected to be executed by December 31, The full cost saving potential is expected to be achieved as from December 2019 with full EBITDA impact from
24 Working capital 21% 20% End % Q % Working Capital in Q still at a relatively low level due to higher payables 19% 18% 17% 16% 15% Decrease in Working Capital of EUR 9.6m compared to Q2 2016, mainly driven by higher payables Working capital was EUR 184.1m end-q versus EUR end-q Note: Working capital ratio calculated as average working capital as a percentage of revenues LTM 24
25 Nilfisk Summary Financials* Q2 1st half FY EURm Revenue ,058.5 Organic growth 2% 3% 3% 1% 3% Overhead cost ratio 33.3% 32.8% 33.9% 34.1% 33.9% Operational EBITDA** Operational EBITDA** margin 12.8% 11.8% 12.9% 11.2% 11.0% RoCE, LTM 16.6% 12.7% 16.6% 12.7% 14.6% CAPEX PPE Intangible assets Capital employed Working capital Highlights and summary Organic growth of 3% in H and 2% in Q driven by continued strong growth in Americas EBITDA before special items of 12.8% in Q (11.8% in Q2 2016) driven by increased gross margin RoCE up by 3.9%-points compared to Q Financial outlook for 2017 maintained Organic growth: 2-4% EBITDA margin before special items: % Cash flow from operating activities Cash flow from investing activities excl acq/div Free cash flow Full-time employees, end of period 5,776 5,673 5,776 5,673 5,607 * Figures as shown in Nilfisk s Q Interim Report ** EBITDA before special items 25

26 26


27 Financial development in Q Imaging & Metrology Sensing & Energy Material Processing Focused growth area Strong progress in Q Larger OEM development projects driving growth Significant imaging development contract signed Established area Strong growth delivered in the quarter Higher demand for Koheras fiber lasers New growth area Agreement to acquire Onefive signed. Closing expected in September 2017 Division still of a relatively modest size Strong underlying market growth to support future potential 50% of revenue 38% of revenue 12% of revenue Note: Revenue distribution based on 2016 figures 27
28 NKT Photonics Summary Financials Highlights and summary Q2 1st half FY EURm Revenue Organic growth 26% 9% 4% 11% 7% Operational EBITDA Capital employed Working capital Full-time employees, end of period % 9.6% 14.7% 11.4% Oper. EBITDA, LTM Oper. EBITDA, LTM% 16% 14% 12% 10% 8% 6% 4% 2% 0% Strong recovery in organic growth as expected in Q compared to Q Revenue growth driven by Imaging & Metrology and Sensing & Energy EBITDA increased and the margin ended at 6.3% in Q driven by the higher revenue Agreement announced to acquire Onefive, a leading supplier of ultrafast lasers, to strengthen NKT Photonics Material Processing business. Closing expected in September 2017 Appointment of new Chief Operating Officer, Don Riddell, to support continued growth Financial outlook for 2017 maintained Organic growth: ~10% Operational EBITDA margin: ~15% 28
29 Agenda Update on the intended split of NKT A/S (formerly NKT Holding A/S) Highlights Q Business units NKT (formerly NKT Cables) Nilfisk NKT Photonics Questions & Answers 29
30 Financial calendar 2017 Event 19 September Capital Markets Day 15 November Interim Report Q For list of Investor Relations events, go to 30
Interim Report Q1 2017
 NKT A/S I Interim Report Q1 2017 I Webcast 17 May 2017 I 1 Interim Report Q1 2017 Webcast, 17 May 2017 NKT A/S I Interim Report Q1 2017 I Webcast 17 May 2017 I 2 Forward looking statements This presentation
27 February 2018 Annual Report 2017
 27 February 2018 Annual Report 2017 Webcast presentation Forward looking statements This presentation and related comments contain forward-looking statements. Such statements are subject to many uncertainties
NKT I Annual Report 2016 I Webcast 21 February 2017 I 1. Annual Report Webcast, 21 February 2017
 NKT I Annual Report 2016 I Webcast 21 February 2017 I 1 6 Annual Report 2016 Webcast, 21 February 2017 NKT I Annual Report 2016 I Webcast 21 February 2017 I 2 Forward looking statements This presentation
NKT I Zürich Roadshow March 2017 I 1. Zürich - Roadshow. March 2017
 NKT I Zürich Roadshow March 2017 I 1 6 Zürich - Roadshow March 2017 NKT I Zürich Roadshow March 2017 I 2 Forward looking statements This presentation and related comments contain forwardlooking statements
Interim report Q3 2016
 NKT I Interim report Q3 2016 I Webcast 11 November 2016 I 1 6 Interim report Q3 2016 Webcast, 11 November 2016, 09:30 CET NKT I Interim report Q3 2016 I Webcast 11 November 2016 I 2 Forward looking statements
August 2018 Interim Report Q2 2018
 August 2018 Interim Report Q2 2018 Investor presentation Forward looking statements This presentation and related comments contain forward-looking statements. Such statements are subject to many uncertainties
Interim Report Q1 2017
 NKT A/S I Interim Report Q1 2017 I Investor roadshow 24 May 2017 I 1 Interim Report Q1 2017 Roadshow, London, 24 May 2017 NKT A/S I Interim Report Q1 2017 I Investor roadshow 24 May 2017 I 2 Forward looking
16 November 2018 Interim Report Q3 2018
 16 November 2018 Interim Report Q3 2018 Webcast presentation Forward looking statements This presentation and related comments contain forward-looking statements. Such statements are subject to many uncertainties
NKT Annual General Meeting 2018
 NKT Annual General Meeting 2018 Demerger of Nilfisk completed Listed entity Underlying businesses NKT A/S Nilfisk Discontinued operation Key highlights NKT is a leading AC 1 and DC 2 high-voltage power
NKT Interim Report Q3 2015
 I 1 NKT Interim Report Q3 2015 Webcast, 12 November 2015, 10:00 CET I 2 Forward looking statements This presentation and related comments contain forwardlooking statements Such statements are subject to
NKT I IR presentation I Interim Report Q November 2014 I 1 NKT. Interim Report Q Webcast, 13 November 2014 at 10:00 CET
 13 November 2014 I 1 NKT Interim Report Q3 2014 Webcast, 13 November 2014 at 10:00 CET 13 November 2014 I 2 Forward looking statements This presentation and related comments contain forward-looking statements.
NKT I Annual Report 2014 I Webcast. 27 February 2015 I 1 NKT. Annual Report Webcast, 27 February 2015, 10:00 CET
 27 February 2015 I 1 NKT Annual Report 2014 Webcast, 27 February 2015, 10:00 CET 27 February 2015 I 2 Forward looking statements This presentation and related comments contain forward-looking statements.
Interim Report Q3 2017
 Interim Report Q3 2017 NKT A/S Vibeholms Allé 25, DK-2605 Brøndby Company Reg: 6272 5214 www.nkt.com Contents Management Review 03 Nilfisk demerged from NKT A/S 04 Key messages 06 NKT 12 NKT Photonics
NKT I Interim Report Q I Webcast. 13 May 2015 I 1 NKT. Interim Report Q Webcast, 13 May 2015, 08:30 CET
 13 May 2015 I 1 NKT Interim Report Q1 2015 Webcast, 13 May 2015, 08:30 CET 13 May 2015 I 2 Forward looking statements This presentation and related comments contain forward-looking statements. Such statements
02 Key messages 04 NKT 10 NKT Photonics 12 Group financials 13 Shareholder information
 Interim Report Q1 2018 Management Review 02 Key messages 04 NKT 10 NKT Photonics 12 Group financials 13 Shareholder information Financial Statements 14 Group Management s statement 16 Income statement
NKT I IR presentation I Interim Report Q November 2013 I 1 NKT. Interim Report Q Webcast, 20 November 2013 at 10:00 am CET
 20 November 2013 I 1 NKT Interim Report Q3 2013 Webcast, 20 November 2013 at 10:00 am CET 20 November 2013 I 2 Forward looking statements This presentation and related comments contain forward-looking
NKT I IR presentation I Annual Report February 2014 I 1 NKT. Annual Report Webcast, 28 February 2014 at 9:00 am CET
 28 February 2014 I 1 NKT Annual Report 2013 Webcast, 28 February 2014 at 9:00 am CET 28 February 2014 I 2 Forward looking statements This presentation and related comments contain forward-looking statements.
Interim Report Q1 2017
 NKT A/S, Vibeholms Allé 25, DK-2605 Brøndby, Company Reg. No. 62 72 52 14 Interim Report Q1 2017 CONTENTS Management s review Intention to split NKT A/S 2 Key messages 3 NKT 4 NKT Photonics 9 Group financials
NKT I IR presentation I Interim Report Q May 2013 I 1 NKT. Interim Report Q Audiocast, 22 May 2013 at 10:00 am CET
 22 May 2013 I 1 NKT Interim Report Q1 2013 Audiocast, 22 May 2013 at 10:00 am CET 22 May 2013 I 2 Agenda NKT Highlights Q1 2013 Financial results Q1 2013 Companies NKT Cables Nilfisk-Advance Photonics
Interim Report Q3 2016
 11 November 2016, Announcement No. 53. NKT Holding A/S, Vibeholms Allé 25, DK-2605 Brøndby, CVR No. 62 72 52 14 Interim Report Q3 2016 CONTENTS Management s review Financial highlights 2 Key messages 3
Page 1. November 17, 2017 Nilfisk Q3 Interim Report 2017 Webcast presentation
 Page 1 November 17, 2017 Webcast presentation Today s presenters Nilfisk CEO Hans Henrik Lund Nilfisk CFO Karina Deacon Page 2 Agenda 1 2 3 4 Highlights for Q3 and the first nine months of 2017 Financial
NKT Holding. Interim Report Q Audiocast presentation 8 November 2012 at 10:00 am CET
 NKT Holding Interim Report Q3 2012 Audiocast presentation 8 November 2012 at 10:00 am CET Agenda Page Page 2 2 NKT Group Highlights Q3 2012 Financial results Q3 2012 Companies NKT Cables Nilfisk-Advance
Annual General Meeting 2016
 I 1 6 Annual General Meeting 2016 I 2 Long-term transformation towards increased value creation Nilfisk NKT Cables NKT Photonics Accelerate Growth Consolidating market-leading position Selected initiatives:
02 Key messages 04 Financial outlook 06 NKT 14 NKT Photonics 16 Group financials 17 Shareholder information
 Interim Report Management Review Financial Statements 02 Key messages 04 Financial outlook 06 NKT 14 NKT Photonics 16 Group financials 17 Shareholder information 18 Group Management s statement 20 Income
NKT. Annual Report 2010 Live presentation 1 March 2011 at 11:00 am. NKT Holding A/S / IR presentation / Annual Report
 NKT Annual Report 2010 Live presentation 1 March 2011 at 11:00 am NKT Holding A/S / IR presentation / Annual Report 2010 1 Agenda NKT Group 2010 in headlines Expectations 2011 Financial results 2010 NKT
INTERIM REPORT Q2-2011
 INTERIM REPORT Q2-2011 Live presentation 23 August 2011 at 11:00 am NKT Holding A/S / IR presentation / Interim Report 2, 2011 1 Agenda Highlights Q2 Financial results Q2 2011 Companies - NKT Cables -
NKT Holdings transforming transactions - in a treasury perspective
 NKT I Group Treasury I Split and acquisition in treasury perspective 15 March 2017 I 1 6 NKT Holdings transforming transactions - in a treasury perspective 15 March 2017 Torben Skovsted, Head of Group
NKT Holding. Den Danske Finansanalytikerforening Virksomhedsdag 2012
 NKT Holding Den Danske Finansanalytikerforening Virksomhedsdag 2012 Agenda 2 Facts about NKT (5 min) SWOT Analysis (15 min) Value drivers in Cash Flow / Cash Conversion / Shareholder Value (20 min) The
Interim Report Q2 2016
 18 August 2016, Announcement No. 38. NKT Holding A/S, Vibeholms Allé 25, DK-2605 Brøndby, CVR No. 62 72 52 14 Interim Report Q2 2016 CONTENTS Management s review Financial highlights 2 Key messages 3 Nilfisk
Nilfisk Financial Results 2017 Webcast presentation - February 28
 Webcast presentation - February 28 Today s presenters Nilfisk CEO Hans Henrik Lund Nilfisk CFO Karina Deacon Page 2 Agenda 1 2 3 4 5 6 Highlights Business unit update Financials Nilfisk Next Outlook 2018
Hybrid Investor Presentation. August/September 2018
 Hybrid Investor Presentation August/September 208 Disclaimer IMPORTANT INFORMATION This investor presentation (this Presentation") has been produced by NKT A/S (the Issuer or the Company ) and its subsidiaries
Interim Report Q3 2013
 Interim Report Q3 2013 NKT Holding A/S, Interim Report Q3 2013 20 November 2013, Announcement No. 18 CONTENTS Management s review Key messages 2 Financial highlights 3 The NKT Group 4 - NKT Cables 8 -
Contents Nilfisk Q2 Interim Report Q2 Interim Report 2017
 Nilfisk Interim Report 1 Interim Report Nilfisk Interim Report 2 IN BRIEF Highlights of Performance in and the first half of in line with expectations 1.7% organic revenue growth for Nilfisk in and 3.0%
H Financial Results. Milan July 28th, 2016
 H1 2016 Financial Results Milan July 28th, 2016 Agenda H1 2016 Highlights o o o Group overview Results by business Outlook Financial results Appendix H1 2016 Financial Results 2 H1 2016 Highlights Organic
Nilfisk Q3 Interim Report 2018 Webcast presentation November 14, 2018
 Nilfisk Q3 Interim Report 2018 Webcast presentation November 14, 2018 Agenda 1 2 3 4 5 Highlights Business unit update Simplifications initiatives Financials Outlook 2018 6 Q&A 2 Q3 2018 results Financial
Q2 INTERIM REPORT Nilfisk Holding A/S Company reg. no Kornmarksvej 1, DK-2605 Brøndby, Denmark
 Q2 INTERIM REPORT 2018 Nilfisk Holding A/S Company reg. no. 38 99 88 70 Kornmarksvej 1, DK-2605 Brøndby, Denmark Q2 IN BRIEF HIGHLIGHTS Nilfisk delivered a strong financial performance in Q2 Organic growth
FY 2016 Financial Results. Milan March 1st 2017
 FY 2016 Financial Results Milan March 1st 2017 Agenda FY 2016 Highlights o o Group overview Results by business Financial results Appendix FY 2016 Financial Results 2 FY 2016 Highlights Adj. EBITDA at
FY 2017 FINANCIAL RESULTS. Milan February 27 th, 2018
 FY 2017 FINANCIAL RESULTS Milan February 27 th, 2018 1 AGENDA FY 2017 Highlights o o Group overview Results by business Financial results Appendix 2 Key Achievements of 2017 General Cable Acquisition Leadership
2014 Annual Report. NKT Holding A/S, Company Reg. No
 2014 Annual Report NKT Holding A/S, Company Reg. No. 62 72 52 14 This Annual Report was published on 27 February 2015 in English via Nasdaq Copenhagen. The Annual Report can also be found at www.nkt.dk
Q Financial Results. Milan May 10th, 2016
 Q1 2016 Financial Results Milan May 10th, 2016 Agenda Q1 2016 Highlights o o o Group overview Results by business Outlook Financial results Appendix Q1 2016 Financial Results 2 Q1 2016 Highlights Organic
H FINANCIAL RESULTS. Milan September 18 th, 2018
 H1 2018 FINANCIAL RESULTS Milan September 18 th, 2018 1 AGENDA H1 2018 Highlights o o o Group overview Results by business Outlook Financial results Appendix 2 H1 2018 Financial Highlights Organic sales
Nilfisk Q2 Interim Report 2018 Webcast presentation August 14
 Webcast presentation August 14 Agenda 1 2 3 4 5 Highlights Business unit update Financials Outlook 2018 Q&A 2 Strong financial performance in Q2 Financial highlights Strong financial performance with organic
ANNUAL REPORT 2017 BUILDING THE FUTURE OF CLEANING
 ANNUAL REPORT 2017 BUILDING THE FUTURE OF CLEANING AT A GLANCE 2017 IN BRIEF FINANCIAL PERFORMANCE 1,082mEUR 3.7% 11.1% 7.5% 16.0% Revenue Up 23 meur from 2016 Organic growth Total growth was 2.2% Organic
Interim Report Q1 2013
 Interim Report 2013 NKT Holding A/S, Interim Report 2013 22 May 2013, Announcement No. 11 Contents Management s review Key messages 2 Financial highlights 3 The NKT Group 4 - NKT Cables 8 - Nilfisk-Advance
Finansanalytikerforeningens Virksomhedsdag 2008 Presentation of NKT Group June 3, 2008 v/ CFO Michael Lyng
 Finansanalytikerforeningens Virksomhedsdag 2008 Presentation of NKT Group June 3, 2008 v/ CFO Michael Lyng 1 116 years history of innovation and entrepreneurship From growth oriented industrial conglomerate
9M 2018 FINANCIAL RESULTS. Milan November 14 th, 2018
 9M 2018 FINANCIAL RESULTS Milan November 14 th, 2018 1 AGENDA 9M 2018 Highlights o Group overview o Results by business Financial results Appendix 2 9M 2018 Financial Highlights Organic sales growth at
FY 2018 FINANCIAL RESULTS. MILAN March 5 th,2019
 FY 2018 FINANCIAL RESULTS MILAN March 5 th,2019 AGENDA FY 2018 Highlights o Group overview o Results by business o Outlook Financial Results Appendix 2 FY 2018 Financial Highlights Fully combined organic
H Financial Results
 Milan August 1 st, 2013 1 AGENDA H1 2013 Highlights & FY 2013 Outlook Financial Results Appendix 2 H1 2013 Key Financials Euro Millions, % on Sales Sales Adjusted EBITDA (3) Adjusted EBIT (4) -1.8% * 7,973
Q FINANCIAL RESULTS. Milan May 10 th, 2018
 Q1 2018 FINANCIAL RESULTS Milan May 10 th, 2018 1 AGENDA Q1 2018 Highlights o o o Group overview Results by business Outlook Financial results Appendix 2 Q1 2018 Financial Highlights Organic growth recovery
Contents Nilfisk Q2 Interim Report Q3 Interim Report 2017
 Contents Nilfisk Q2 Interim Report 1 Interim Report Contents Nilfisk Q2 Interim Report 2 IN BRIEF Highlights of Performance in and the first nine months of in line with expectations The outlook for organic
FLAT +3.8% YEAR-END REPORT JANUARY DECEMBER 2017 STRONG Q4 PUTS 2017 CASH FLOW WELL ABOVE EXPECTATIONS JOHAN DENNELIND PRESIDENT & CEO 2.
 YEAR-END REPORT JANUARY DECEMBER 2017 JOHAN DENNELIND PRESIDENT & CEO Q4 STRONG Q4 PUTS 2017 CASH FLOW WELL ABOVE EXPECTATIONS We said: cash flow above SEK 7.5 billion WE DID 9.7bn +0.8bn Q4 (+0.8bn Q4)
Investor Presentation Q Results. 11 November 2010
 Investor Presentation Q3 2010 Results 11 November 2010 Forward-looking Statements Forward-looking statements This presentation may contain forward-looking statements. Statements herein, other than statements
Annual Report NKT annual report 2007 / xxx lxxx xx 1
 Annual Report 2007 NKT annual report 2007 / xxx lxxx xx 1 Contents Page 2007 in brief 4 5 years financial highlights 5 Management report 2007 Review of financial statements 6 Expectations 2008 9 Corporate
A KEY MILESTONE IN PRYSMIAN S GROWTH STORY:
 A KEY MILESTONE IN PRYSMIAN S GROWTH STORY: THE ACQUISITION OF GENERAL CABLE DECEMBER 4 th, 2017 TRANSACTION HIGHLIGHTS Transaction terms and structure Prysmian has entered into a merger agreement to acquire
Company Presentation. Cable Conference. ABN AMRO - London, 10th January 2008
 Company Presentation Cable Conference ABN AMRO - London, 10th January 2008 Agenda Company Overview Financials Outlook Appendix 1 A Global Cable Manufacturer The Prysmian Group operates 54 plants, has subsidiaries
Siemens Gamesa Renewable Energy Q Results
 Siemens Gamesa Renewable Energy Q2 208 Results 04 May 208 Disclaimer This material has been prepared by Siemens Gamesa Renewable Energy, and is disclosed solely for information purposes. This document
2005 Full Year Results February 2, 2006 Gérard Hauser
 2005 Full Year Results February 2, 2006 Gérard Hauser Safe Harbor This presentation contains forward-looking statements relating to the Group s expectations for future financial performance, including
FY 2013 Financial Results
 Milan February 25 th, 2014 1 AGENDA FY 2013 Highlights Group Overview Results by business Financial Results Appendix 2 2013 Key Achievements FY targets achieved despite continuous weak economic environment
H Financial Results
 Milan, 7 th August 2012 Presentation title Prysmian Group Date 1 AGENDA Highlights & 2012 Outlook Financial Results Appendix 2 Key Financials Euro Millions, % on Sales Sales Adjusted EBITDA (4) Adjusted
Analyst and Investor Conference 2016 Dieter Bellé, Bruno Fankhauser, Dr Frank Hiller. The Quality Connection
 Analyst and Investor Conference 2016 Dieter Bellé, Bruno Fankhauser, Dr Frank Hiller The Quality Connection Agenda 1. Group (Dieter Bellé) 2. Wiring Systems (Dr Frank Hiller) 3. Wire & Cable Solutions
EDITED TRANSCRIPT. Q NKT A/S Earnings Call EVENT DATE/TIME: NOVEMBER 16, 2018 / 9:00AM GMT THOMSON REUTERS. THOMSON REUTERS Contact Us
 THOMSON REUTERS EDITED TRANSCRIPT Q3 2018 NKT A/S Earnings Call EVENT DATE/TIME: NOVEMBER 16, 2018 / 9:00AM GMT 1 CORPORATE PARTICIPANTS Basil Garabet NKT A/S - CEO & President of NKT Photonics CONFERENCE
6 OF 7 MARKETS 5BN/YEAR INTERIM REPORT JANUARY MARCH 2018 GOOD START OF 2018 JOHAN DENNELIND PRESIDENT & CEO MOBILE GROWTH ACROSS FOOTPRINT
 INTERIM REPORT JANUARY MARCH 2018 Q1 JOHAN DENNELIND PRESIDENT & CEO GOOD START OF 2018 MOBILE GROWTH ACROSS FOOTPRINT 6 OF 7 MARKETS REPORTED EBITDA GROWTH +7.4% STRONG OPERATIONAL FREE CASH FLOW 4.3BN
FY 2015 Financial Results. Milan February 24th, 2016
 FY 2015 Financial Results Milan February 24th, 2016 Agenda FY 2015 Highlights o o o Group overview Results by business Focus on OCI Acquisition Financial results Appendix FY 2015 Financial Results 2 FY
Group presentation. November 2007
 Group presentation November 2007 Safe Harbor This presentation contains forward-looking statements relating to the Group s expectations for future financial performance, including sales and profitability.
1Q 2005 Group Results 12th May 2005
 1Q 2005 Group Results 12th May 2005 AGENDA TRANSITION p.2 1Q 2005 GROUP RESULTS p.6 1Q 2005 INDUSTRIAL RESULTS p.9 1Q 2005 PIRELLI RE RESULTS p.14 PIRELLI GROUP 2005 OUTLOOK p.18 BACK UP SLIDES p.20 1
FY 2012 Financial Results
 Milan, 27th February 2013 1 AGENDA Highlights Group Overview Results by business Financial Results Appendix 2 2012 Key Achievements All targets fully achieved despite a worsening economic environment Adj.
Financial Year 2006/07
 Financial Year Investor Relations June 2007 www.voestalpine.com - Status Quo Revenue EBITDA EBIT FY 7.05 bn 1.37 bn 1.01 bn Divisions Steel Railway Automotive Profilform Systems Revenue/Division 49 % 27
Second-Quarter Results 2014
 2Q Second-Quarter Results 214 Fornebu, July 17, 214 Øyvind Eriksen and Leif Borge 214 Aker Solutions Slide 1 July 17, 214 Second-quarter results 214 Agenda 2Q 214 Introduction Øyvind Eriksen Chairman Financials
TietoEnator Q4 and full year February 2008, Helsinki Strategy and actions for 2008 Interim CEO Åke Plyhm
 TietoEnator Q4 and full year 2007 6 February 2008, Helsinki Strategy and actions for 2008 Interim CEO Åke Plyhm Performance and outlook CFO Timo Salmela Strategy and actions for 2008 Performance and outlook
Results FY 2017 Schaeffler AG. Conference Call March 7, 2018 Munich
 Results FY 2017 Schaeffler AG Conference Call Munich Disclaimer This presentation contains forward-looking statements. The words "anticipate", "assume", "believe", "estimate", "expect", "intend", "may",
Annual results Presentation 28 February M. Taylor, Chief Executive Officer B. García-Cos, Chief Financial Officer
 Annual results 2017 Presentation 28 February 2018 M. Taylor, Chief Executive Officer B. García-Cos, Chief Financial Officer Bekaert delivers 10% sales growth and 301 million underlying EBIT - Consolidated
Management report Nilfisk Annual Report 2016
 Nilfisk Annual Report 2016 1 Annual Report 2016 Nilfisk Annual Report 2016 2 NILFISK AT A GLANCE Nilfisk is a leading player in the professional cleaning equipment industry 45 16 Nilfisk has sales companies
Q3 trading update. 30 October 2017
 Q3 trading update 2017 30 October 2017 Business highlights Q3 2017 Signs of a stabilising oil and gas environment Revenue and results in building & infrastructure market segment increased; other markets
CEO Terje Mjøs. Oslo, 8 February Q Presentation
 CEO Terje Mjøs Oslo, 8 February 213 2 Presentation Part I ` Report o Group o Segments Part II Cost improvements o Revenue and margin analysis o Future proof Part III Outlook o Market o Company Summary
FINAL TRANSCRIPT 27/02/ :00 GMT 01:18:29 NKT HOLDINGS A/S ANNUAL REPORT 2012
 Contents Corporate Participants Page 3 Conference Call Participants Page 3 Presentation Page 3 Question and Answer Page 16 InterCall Transcription Document Page 2 of 27 Commercial in Confidence Corporate
SIX MONTHS REPORT, JANUARY JUNE 2014
 SIX MONTHS REPORT, JANUARY JUNE 2014 TELEPHONE CONFERENCE 11 JULY, 2014 TOMMY ANDERSSON, PRESIDENT AND CEO TO PARTICIPATE, PLEASE CALL 5 MINUTES BEFORE THE OPENING OF THE CONFERENCE CALL TO SWEDEN +46
Company presentation. Oct, 2015
 Company presentation Oct, 2015 Safe Harbor Forward-looking information in this presentation are based on risks and uncertainties, known and unknown to date, which may have an impact on the future performance
Royal Unibrew A/S. by Henrik Brandt, President & CEO May 2016 Nordic Market Day 2016
 Royal Unibrew A/S by Henrik Brandt, President & CEO 18-19 May 2016 Nordic Market Day 2016 1 ROYAL UNIBREW NORDIC MARKET DAY BOSTON AND NEW YORK MAY 2016 Facts about Royal Unibrew Royal Unibrew is the second
Bekaert delivers 10% sales growth and 301 million underlying EBIT
 Press release Regulated information 28 February 2018 07:00 a.m. CET Press - Investors Katelijn Bohez T +32 56 76 66 10 www.bekaert.com Full Year Results 2017 Bekaert delivers 10% sales growth and 301 million
Sustainable use of Earth s natural resources. Interim Report Q1 2017
 Sustainable use of Earth s natural resources Interim Report 2017 Safety performance Rate per million hours 14 12 10 8 6 4 2 0 Outotec global safety statistic 12-months running average Lost Time Incident
STREAMING & VIDEO EXPERTS Under the same roof. NKT Holding A/S. Transcript :: NKT Annual Report 2013, Audiocast 28 February 2014 : Operator
 Side 1 28 NKT Holding A/S :: NKT Annual Report 2013, Audiocast 28 February 2014 : Operator Ladies and gentlemen welcome to the NKT full-year result 2013. Today I am pleased to present, Group Executive
Siemens Gamesa Renewable Energy Q3 18 Results
 Siemens Gamesa Renewable Energy Q3 18 Results 27 July 2018 Disclaimer This material has been prepared by Siemens Gamesa Renewable Energy, and is disclosed solely for information purposes. This document
dbaccess Global Consumer Conference in Paris
 dbaccess Global Consumer Conference in Paris Royal Unibrew A/S By Lars Jensen, CFO 13 June 217 1 Facts about Royal Unibrew Royal Unibrew is the second biggest brewer in the Nordic and Baltic region Revenue
Full Year 2016 Results
 Full Year 2016 Results Solid Performance in 2016 after Airgas Integration Increase in Revenue, Net Profit and EPS Paris, 15 February 2017 Agenda 1 2016, a successful transformational year 2 Solid operational
Royal Unibrew A/S. by Henrik Brandt, President & CEO 15 June 2016 dbaccess Global Consumer Conference, Paris
 Royal Unibrew A/S by Henrik Brandt, President & CEO 15 June 216 dbaccess Global Consumer Conference, Paris 1 ROYAL UNIBREW dbaccess GLOBAL CONSUMER CONFERENCE - PARIS JUNE 216 Facts about Royal Unibrew
Investor Presentation Q3 Interim Results. 12 November 2013
 Investor Presentation Q3 Interim Results 12 November 2013 Forward-looking statements This presentation contains forward-looking statements, including, but not limited to, the statements and expectations
Intelligent energy and data solutions for tomorrow's world. Conference Call Q3 Results November 14, 2018
 Intelligent energy and data solutions for tomorrow's world Conference Call Q3 Results November 14, 2018 Current situation requires start of holistic improvement programme Focusing our organisation on profitable
Results FY14. Encouraging recovery in second half. 12 Feb 2015 Eric Van Zele, President & CEO
 Results FY14 Encouraging recovery in second half 12 Feb 2015 Eric Van Zele, President & CEO Agenda I. Financial highlights II. Divisional results & Business update III. Executive focus & Outlook IV. Q&A
Maersk Group Q3 report 2015
 Maersk Group report 6 November - Conference call 9.30am CET webcast available at www.maersk.com Forward-looking Statements page 2 This presentation contains forward-looking statements. Such statements
Investor Presentation Full year 2009 Results. 11 March 2010
 Investor Presentation Full year 2009 Results 11 March 2010 Forward-looking Statements Forward-looking statements This presentation may contain forward-looking statements. Statements herein, other than
The LEONI Group 2 nd quarter and 1 st half 2017
 The LEONI Group 2 nd quarter and 1 st half 2017 Contents page 3 4 LEONI Group overview page 5 24 LEONI divisions page 25 33 Report 2 nd quarter and 1 st half 2017 page page 34 41 42 45 LEONI Group figures
Financial Statements Release January December 2018
 Financial Statements Release January December 2018 Disclaimer In this presentation, all forward-looking statements in relation to the company or its business are based on the management judgment, and macroeconomic
Bekaert First Half 2017 Results
 Bekaert First Half 2017 Results Matthew Taylor, CEO Beatríz García-Cos, CFO 28 July 2017 Bekaert achieves strong sales and profits in H1 2017 - Consolidated sales of 2.1 billion (+15%) and combined sales
FY 2017 results. 26 st March 2018
 FY 2017 results 26 st March 2018 CONTENTS 1. Financial highlights 2. Net sales breakdown 3. Profit & loss 4. Net working capital 5. Net cash flow 6. Balance sheet 7. Future developments 8. Group structure
Q Interim Report. October 25, 2018 Panu Routila, President & CEO Teo Ottola, CFO
 Q3 2018 Interim Report October 25, 2018 Panu Routila, President & CEO Teo Ottola, CFO 2 Agenda 1. Group highlights 2. Business Area Service 3. Business Area Industrial Equipment 4. Business Area Port Solutions
Q3 Report 2007 Johan Molin, President & CEO
 Q3 Report 2007 Johan Molin, President & CEO 1 Financial Highlights Q3 Q3 - Solid improvement Good continued growth in all areas Raw material compensated & efficiency gains Earnings improvements in all
Solid quarter with broad-based progress, strategic focus areas are delivering
 Amer Sports Q3/2018 Solid quarter with broad-based progress, strategic focus areas are delivering October 25, 2018 Heikki Takala, President and CEO Profitable growth continued in Q3 Net sales EUR 757.2
FULL YEAR REPORT, 2017 TELEPHONE/AUDIO CONFERENCE 8 FEBRUARY 2018, AT CET TOMMY ANDERSSON, PRESIDENT AND CEO HELENA WENNERSTRÖM, EVP AND CFO
 TELEPHONE/AUDIO CONFERENCE 8 FEBRUARY 2018, AT 15.30 CET TOMMY ANDERSSON, PRESIDENT AND CEO HELENA WENNERSTRÖM, EVP AND CFO DIRECT LINK AUDIOCAST: HTTPS://TV.STREAMFABRIKEN.COM/BULTEN Q4 2017 TELECONFERENCE:
Sustainable Growth and Value Creation enabled by focused transformation. Amer Sports CMD 2018 Heikki Takala, President & CEO, and Jussi Siitonen, CFO
 Sustainable Growth and Value Creation enabled by focused transformation Amer Sports CMD 2018 Heikki Takala, President & CEO, and Jussi Siitonen, CFO Topics today We continue to grow and create value Our
Financial Year 2014/15 2 nd Quarter, 1 st Half
 Financial Year 2 nd Quarter, 1 st Half Investor Relations November 2014 voestalpineag AG www.voestalpine.com Overview From a steel producer to a technology and industrial goods corporation High-tech steel