Enriching people s way of life. Roadshow presentation January September 2017 Jyri Luomakoski, President & CEO Maija Strandberg, CFO October 2017
|
|
|
- Barnard Calvin Cole
- 5 years ago
- Views:
Transcription

1 Enriching people s way of life January September 2017 Jyri Luomakoski, President & CEO Maija Strandberg, CFO


2 Why invest in Uponor The company: An industry innovator building on a century of tradition Established brand with a proven historic growth, organically and through acquisitions Stable business with a track record of profitable performance, even during downturns An up-to-date production network from the production technology perspective, as well as regional spread Committed long-term key ownership with a clear understanding of the industry s dynamics The business: Solutions for safe drinking water delivery, energy-efficient heating and cooling and reliable infrastructure A leading international supplier of plastic plumbing and hydronic radiant heating systems and a strong position in civil engineering pipe systems in northern Europe A proven track record of superior quality supported by product, system and value chain innovation that meets customer expectations Total offering committed to: Comfort, Health, Efficiency, Sustainability and Safety Read more at: 2
3 Uponor at a glance Uponor is a leading international provider of plastic based piping systems for buildings and infrastructure Infrastructure solutions 26% 49% Plumbing solutions We provide safe drinking water delivery systems, energy-efficient radiant heating and cooling and reliable infrastructure solutions 25% Indoor climate solutions FACTS & FIGURES 1,1 30 billion euro Net sales 2016 countries with Uponor operations 14 production sites worldwide 3,900 worldwide staff 3

4 Our solutions enrich people s way of life Our vision Throughout the world, our solutions enrich people s way of life Our mission Partnering with professionals to create better plumbing, indoor climate and infrastructure solutions Our people We will build an exciting environment for growth and achievement both for the company and our employees 4

5 Shared values guide our operations With 3,900 committed employees in 30 countries, Uponor is at your service all over the world OUR VALUES CONNECT BUILD INSPIRE 5

6 Uponor milestones Johan de la Gardie establishes Wirsbo Bruks Aukusti Asko- Avonius establishes a carpentry workshop in Lahti, Finland 1964 Plastic division Upo-Muovi starts up in Nastola, Finland, and launches its first plastic pipes 1988 Uponor enters plastic hot water pipe business, acquires Wirsbo Asko Oy is listed on the Helsinki Stock Exchange 1938 Upo Oy starts to manufacture cast iron products and household appliances 1972 Wirsbo was first in the world to start manufacturing PEX pipes 1982 Asko Oy and Neste Oy jointly establish Oy Uponor Ab 1990 Wirsbo opens a factory in Apple Valley, Minnesota, USA 1999 Oras Invest becomes a major shareholder The business is consolidated under one brand 1997 Acquisition of Unicor in Merger with parent company Asko Oyj on 1 Jan Municipal business outside of the Nordic countries divested 2013 Start of Uponor Infra through a merger with KWH Pipe on 1 July Acquiring competence in hygienic drinking water delivery 2016 Establishes joint venture Phyn with Belkin International Inc. 6
7 Uponor s sustainability statement Uponor is committed to addressing the key issues of our time through innovations that help reduce environmental impact. Through partnerships, we strive to provide leadership in sustainable solutions for the mutual well-being of both people and the planet, while ensuring the long-term viability of our operations. Our sustainability pillars Strongly integrating sustainability into our corporate mindset. Driving down our environmental impact. Enriching life through our innovative solutions. Engaging external stakeholders in our sustainability journey. 7
")
8 Driving down our environmental impact Uponor has been reporting through CDP Climate change survey since Level B - Management = taking coordinated action on climate change issues Net sales, M GHG emissions, t CO2 (Scope 1) (rhs) 8

9 Group structure 9
10 Net sales breakdown Consolidated net sales for 2016: 1,1 billion BY BUSINESS GROUP BY SEGMENT 34% 30% 26% 34% 30% 26% Infrastructure solutions Plumbing solutions 39% 45% 49% Uponor Infra Building Solutions - North America 19% 26% 28% Indoor climate solutions Building Solutions - Europe 47% 44% 46% 27% 25% 25%


11 Uponor s plumbing offering For efficient and hygienic drinking water delivery Flexible pipe systems Multilayer pipe systems Risers Press fittings Pre-fabricated units Quick & Easy fittings Tools Intelligent water and hygiene 11


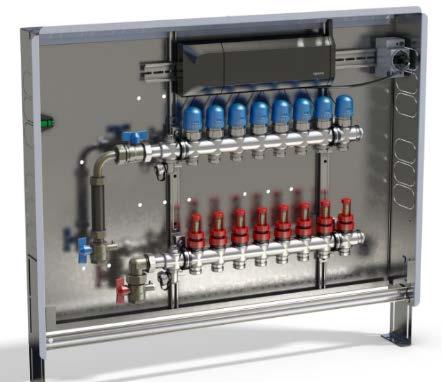
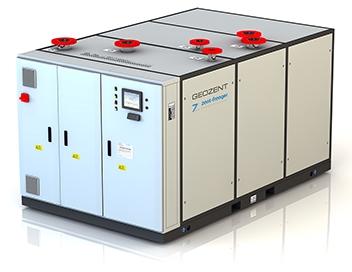


12 Uponor s indoor climate offering The basis for a comfortable and energy-efficient ambiance Radiant heating and cooling Thermally active slabs Ceiling cooling Geothermal energy stations Manifold stations Controls Local heat distribution Ventilation 12


13 Uponor s infrastructure offering Transporting water, air, electricity, telecommunications and data Standard Solutions 360 Project Services Technology 13
14 Investment in R&D and technology In 2016, Uponor s R&D expenditure exceeded 20 million for the first time New Group Technology function Investment in digitalisation initiatives New product, application and materials development Phyn Smatrix Aqua PLUS Aqua & Combi Port Strategic focus on hygiene, safety and sustainability UWater online monitoring Dec 2015 KaMo/Delta fresh water stations - Jan 2016 Joint venture Phyn with Belkin to pioneer in intelligent water - July 2016 Ecoflex Thermo PRO UWater Uponor Decibel 14
15 Throughout the world, our solutions enrich people s way of life First renovation project involving radiant ceiling cooling in tropical climate: Seng Choon Office Building, Singapore Water supply in demanding terrain: Glomfjord, Norway Restoring old-world charm to an iconic hotel: The Cavalier Hotel, Virginia, USA Radiant heating & cooling in European Central Bank: Frankfurt, Germany Water supply in extreme weather conditions: Gabriel de Castilla research station, Antarctica Securing safe transportation of waste water: Borås, Sweden Radiant heating & cooling in an underground women s university: Seoul, South Korea Ice-free pavement throughout the year: Lahti, Finland 15
16 Business gradually picking up after the global financial crisis M M 1 200,0 180, ,0 800,0 600,0 400,0 200,0 0,0 150,0 120,0 90,0 60,0 30,0 0,0 Net sales Operating profit (rhs) Comparable operating profit (rhs) 16
17 Uponor has a strategy to generate sustainable growth in the shorter and longer term Value We build options for future growth, e.g. sustainable hygienic solutions, digitalisation and new production technologies We expand in commercial markets with an aim to significantly grow designed solution sales We defend our strong position in the distribution business and the residential markets Time 17
18 Long-term financial targets Since 12 February 2013 Organic net sales growth to exceed annual GDP growth* by 3 ppts EBIT margin to exceed 10% ROI to exceed 20% Gearing to stay within 30 to 70 as an annual average of the quarters Dividend pay-out to be at least 50% of annual earnings (considering the gearing target) Achievement in % (target 4.7%*) 6.5% (comparable EBIT 8.2%) 14.1% % * GDP growth based on a weighted average growth in the top 10 countries 18

19 Dividends and payout ratio Dividend for 2016: 0.46 per share 19
20 Major shareholders 30 June 2017 Oras Invest Ltd 22.6% Varma Mutual Pension Insurance Company 5.3% Nordea Nordic Small Cap Fund 3.3% Ilmarinen Mutual Pension Insurance Company 2.7% 37,9% Mandatum Life Insurance Company Ltd 1.4% The Local Government Pensions Institution 1.3% Nordea Pro Finland Fund 1.0% Nominee registerations 24.5% Others 37.9% Currently valid foreign notifications 20 March 2017: the holdings of Franklin Resources, Inc., went down to below 5.0% 24,5% 22,6% 5,3% 3,3% 2,7% 1,4% 1,3% 1,0% 17,900 shareholders at the end of June 2017 Foreign shareholding was 24.8% at the end of June 2017, down from 26.1% in Dec
21 Interim results briefing Jyri Luomakoski President and CEO Maija Strandberg CFO 1 9 / 2017
22 Q3/2017: Uponor s good progress in the third quarter offsets the shortfall in the second quarter July - September, M 7-9/ / 2017 Change Net sales % Operating profit % Comparable operating profit % Net sales Building Solutions Europe s sales grew in all key countries but Finland Building solutions demand in the U.S. continued to grow, and improvements were made in securing smooth deliveries Uponor Infra posted robust growth in North America and Sweden Operating profit More efficient supply chain network in Building Solutions Europe, together with growth in net sales, improved performance Building Solutions North America reported a strong year-over-year increase, offsetting the weaker second quarter Uponor Infra benefited from sales price increases, which compensated for the raw material price increases in H1/

23 Developments by segment: Building Solutions Europe Favourable net sales growth across most key European markets Increasingly, building growth is curbed by lack of professionals, e.g. Sweden, Germany Uponor s range of new prefabricated products, such as the Uponor Port family, is helping to solve capacity issues in installation and planning 23

24 Developments by segment: Building Solutions North America The business environment continued healthy across North America Despite capacity constraints, Uponor is improving its ability to deliver customer orders Some products still on allocation The April production issue solved Manufacturing expansions under way to meet expected growth 10 th expansion in Apple Valley in progress, operations are planned to start early 2018 Acquisition of a Hutchinson, Minn. facility closed in August; operations are planned to start in the second half of

25 Developments by segment: Uponor Infra Net sales grew in a robust way in North America and Sweden Improving trend in profitability, year-to-date performance now ahead of last year Supported by price increases implemented due to first half-year resin price increases Production yield not yet on pre-relocation level in Finland Tanzania enters as the 12 th country to which Uponor has granted manufacturing license for its proprietary Weholite structured-wall pipe 25


26 Financial statements 1 9 / 2017
27 January September 2017: Key figures Uponor Group - continuing operations Change Y/Y 2016 Net sales M % 1,099.4 Operating profit M % 71.0 Comparable operating profit M % 90.7 Comparable operating profit margin % 9.0% 8.9% -0.1% pts 8.2% Earnings per share (diluted) % 0.57 Return on equity (p.a.) % 15.3% 20.2% +4.9% pts 13.1% Return on investment (p.a.) % 16.9% 19.4% +2.5% pts 14.1% Net interest bearing liabilities M % Gearing % 56.6% 48.2% -8.4% pts 48.8% Net working capital of net sales (p.a.) % 12.0% 11.0% -1.0% pts 10.2% Number of employees, end of period FTE 3,873 3, % 3,868 27
28 July September 2017: Income statement Uponor Group - continuing operations, M Change Y/Y Net sales % Cost of goods sold % Gross profit % Gross profit margin (%) 34.1% 34.4% +0.4% pts Other operating income % Expenses % Operating profit % Operating profit margin (%) 8.8% 12.7% +3.9% pts Financial expenses, net % Share of result in associated companies % Profit before taxes % Profit for the period % EBITDA % Net sales in July-September included only a marginal negative net impact from the USD, RUB and SEK Comparable gross profit grew slightly more than net sales and ended up at (97.6) million, with a gross profit margin of 34.4% (34.3%) Comparable operating profit reached 40.4m ( 29.0m), an increase of 38.9% There were no new items affecting comparability in the third quarter as the final measures related to the European transformation programmes were initiated during the second quarter of
29 January September 2017: Income statement Uponor Group - continuing operations, M Change Y/Y 2016 Net sales % 1,099.4 Cost of goods sold % Gross profit % Gross profit margin (%) 34.9% 33.6% -1.4% pts 34.2% Other operating income % 4.2 Expenses % Operating profit % 71.0 Operating profit margin (%) 7.6% 8.7% +1.1% pts 6.5% Financial expenses, net % 10.0 Share of result in associated companies % -0.6 Profit before taxes % 60.4 Profit for the period % 41.5 EBITDA % Net sales growth +7.4% in constant currency terms A negative net currency impact of 1.3m originating from the RUB, SEK and USD Comparable gross profit margin 33.7% (35.2%) Comparable operating profit 79.2m, which is 6.0% more than last year ( 74.6m) Financial expenses include a 3.6m positive impact from the Supreme Administrative Court s decision concerning Uponor s 2016 tax appeals in Finland 29

30 January September 2017: Net sales & comparable operating profit by segment Currency: M Net sales Comparable operating profit Building Solutions - Europe Building Solutions - North America Uponor Infra Building Solutions - Europe Building Solutions - North America Uponor Infra Building Solutions Europe: Year-to-date comparable operating profit exceeded last year s level (+6.3%) driven by solid growth of net sales in several national markets in Q3. Benefits from the transformation programme support the improvement in profitability Building Solutions North America: Strong performance in Q3 and recovery from the temporary production issue experienced in Q2. Year-to-date net sales (+8.9%) as well as operating profit (+5.2%) improved from 2016 even though deliveries to customers are still partly on allocation Uponor Infra: Favourable net sales development (+12.4%), and comparable operating profit exceeding last year (+3.0%). Despite a successful execution of price increases, comparable operating improved only slightly due to challenges related to production relocations in Finland 30
31 January September 2017: Net sales development by key markets M YTD net sales grew in key markets, with the exception of Germany and Denmark Growth driven by USA, Sweden and Canada After headwinds experienced in Q1 and flat net sales development in Q2, Germany reported small year-over-year growth in Q USA Germany Finland Sweden Canada Denmark Netherlands Spain Norway Austria Others Growth % in EUR 13.3% -3.2% 2.2% 16.2% 25.8% -3.3% 7.2% 7.3% 7.7% 12.2% 0.9% % in Curr. 14.1% 18.6% 25.2% -3.4% 6.8% 31 Jan-Sep 2015 Jan-Sep 2016 Jan-Sep 2017
32 January September 2017: Balance sheet Uponor Group, M 30 Sep 30 Sep Change 31 Dec Y/Y 2016 Property, plant and equipment Intangible assets Securities and long-term investments Inventories Cash and cash equivalents Other current and non-current assets Assets total Total equity Non-current interest-bearing liabilities Provisions Non-interest-bearing liabilities Current interest-bearing liabilities Shareholders' equity and liabilities total Property, plant and equipment increased mainly due to investments in capacity expansion and efficiency improvement Non-controlling interest represents 66.7m of the equity at 335.6m 80 million bond maturing in June 2018 is booked in current liabilities lowering long-term interest-bearing liabilities Gearing came to 48.2% (56.6%), with the fourquarter rolling gearing at 59.8% (51.8%) 32
33 January September 2017: Cash flow Uponor Group, M Change Y/Y 2016 Net cash from operations Change in NWC Net payment of income tax and interest Cash flow from operations Cash flow from investments Cash flow before financing Dividends paid Other financing Cash flow from financing Gross investments came to 37.4m (29.7) Cash flow from investments in the comparison period includes cash flow effect of m from the acquisition of KaMo & Delta Group and m from the investment in the joint venture Phyn Conversion differences Change in cash and cash equivalents

34 Outlook for the future 34

35 Abnormal weather patterns may influence the business and operations Impacts can be felt both in the building solutions as well as in the infrastructure solutions businesses Whether positive or negative, depends on the time span and the nature of the disaster 35
36 Leading indicators: Still solid, but growth is slowing Indicator YTD % Change Rolling 12-month % Change Data through Trend since Q2 update USA Housing starts +6% 1) N/A September 2017 Germany Housing permits - 4% +3% July 2017 Finland Housing permits +6% +7% August 2017 Sweden Housing starts +22% +24% June 2017 Canada Housing starts +0% 1) N/A September 2017 Denmark Housing starts -29% -1% March 2017 Netherlands Housing permits +37% +39% August 2017 Spain Housing permits +24% +22% July 2017 Norway Housing starts +5% +9% August 2017 Austria Housing starts +3% +3% June ) Seasonally adjusted, annualised rate vs. same month in

37 Residential building permit levels are still below historical average in Europe Euro area residential building permits % 180% 160% 140% 120% 100% 80% 60% 40% Summer 17 residential building permit levels compared to 17-year average 173% 121% 117% 100% 97% 69% 42% Jan-00 Jun-01 Nov-02 Apr-04 Sep-05 Feb-07 Jul-08 Dec-09 May-11 Oct-12 Mar-14 Aug-15 Jan-17 Euro area Euro area avg. 114 / 166 = 69% of long-term average Average = 166 Current = % 0% Sweden Norway Germany France Finland Euro area Spain 37 Source: Eurostat
38 Builder confidence continues to strengthen in most European markets 0 EU construction confidence index 30 Change in construction confidence index (Q avg. vs Q avg.) Jan-09 Jun-09 Nov-09 Apr-10 Sep-10 Feb-11 Jul-11 Dec-11 May-12 Oct-12 Mar-13 Aug-13 Jan-14 Jun-14 Nov-14 Apr-15 Sep-15 Feb-16 Jul-16 Dec-16 May Source: Eurostat
39 Companies reporting labour shortages is highest in the Nordics, but growing in Germany What factors are limiting your ability to increase business activity? Balance of respondents answers Germany Factors limiting building activity - Shortage of labour Jan-09 Jun-09 Nov-09 Apr-10 Sep-10 Feb-11 Jul-11 Dec-11 May-12 Oct-12 Mar-13 Aug-13 Jan-14 Jun-14 Nov-14 Apr-15 Sep-15 Feb-16 Jul-16 Dec-16 May-17 Balance of respondents answers Europe Factors limiting building activity - Shortage of labour Jan-09 Jul-09 Jan-10 Jul-10 Jan-11 Jul-11 Jan-12 Jul-12 Jan-13 Jul-13 Jan-14 Jul-14 Jan-15 Jul-15 Jan-16 Jul-16 Jan-17 Jul-17 Germany Spain EU-28 Finland Sweden 39 Source: Eurostat
40 USA: Despite cautionary expectations, market expansion has continued Consumer spending remains robust, while business investments have grown significantly from last year. However, labour shortages in some industries and rising interest rates are tempering growth Within the construction industry: Home builder confidence has retreated from the spring highs, but remains in expansionary territory Non-residential construction spending has flattened overall, but has grown in the commercial and office segments annualised housing starts (in 000 s) Housing Market Index (HMI) and housing starts HMI Residential construction spending continues to make year-over-year gains, but at a reduced rate from previous years Single-family starts (lhs) Housing Market Index (rhs) Multi-family Starts (lhs) 40 Source: US Census, NAHB/Wells Fargo
41 Germany: A strong labour market is supporting residential investment, but limiting construction activity With unemployment at a record low and business and consumer confidence near record highs, the economy continues to expand at a moderate pace Within the construction industry: Building construction activity has grown and construction confidence remains near all-timehighs New, multi-family housing continues to drive industry growth Permits (rolling 12-month total) German housing permits and builder confidence Construction confidence indicator However, labour shortages throughout the industry are limiting activity and order entry has slowed from the same period in 2016 Jan-09 Aug-09 Mar-10 Oct-10 May-11 Dec-11 Jul-12 Feb-13 Sep-13 Apr-14 Nov-14 Jun-15 Jan-16 Rolling 12-month permit total (lhs) Aug-16 Mar-17 Construction confidence (rhs) Source: Destatis and Eurostat 41
42 Finland: Fundamentals continue to improve Broad-based growth is materialising throughout the economy, with consumers remaining optimistic and improved order books accompanied by significant increases in business investments Within the construction industry: Residential and non-residential building activity has risen year-over-year, while civil engineering has been flat overall Continued growth in the residential multi-family segment, while non-residential permits have slowed in some segments Construction confidence has trended downwards, but remains relatively high rolling 12-month total, in thousand m Jan-09 Jul-09 Jan-10 Jul-10 Jan-11 Jul-11 Jan-12 Jul-12 Jan-13 Jul-13 Jan-14 Jul-14 Jan-15 Jul-15 Jan-16 Jul-16 Jan-17 Jul-17 Permits (lhs) Finnish housing permits and builder confidence Construction confidence indicator (rhs) construction confidence indicator Source: Statistics Finland & Eurostat 42

43 Management agenda for 2017 the focus remains intact Promote the strategic initiatives (new offerings, new sales and marketing setup) in Building Solutions Europe while fully utilising the renewed operational setup in key growth centres Return to acceptable service levels in Building Solutions North America, while new manufacturing capacity is brought online Continue to improve net sales and performance in Uponor Infra and return to high efficiency levels Progress on the road towards digital transformation and launch new ground-breaking digital offerings first in America and later in Europe 43
44 Guidance 2017 After reporting good third quarter figures, Uponor expects the January September trends to continue No material changes expected in near term market trends The previously announced capex guidance remains valid: capex estimated to exceed 60 million (excluding any investment in shares) in 2017 Assuming that economic development in Uponor's key geographies continues undisturbed, Uponor reiterates its annual guidance from February 2017: The Group s net sales and comparable operating profit are expected to improve from

45 New & improved version of Uponor s IR app available! Watch our webcasts Watch our quarterly release webcasts live or recorded via the app Create a watchlist Monitor our stock performance against other listed companies globally Share content with your network Share content with your connections via social media channels or through Be the first to know Turn on the push notifications to stay posted on our current news and events Download now!
46 Build on Uponor Follow us! Instagram: uponorgroup LinkedIn: Uponor YouTube: Uponor Group Uponor IR site: investors.uponor.com Uponor s IR app:
Enriching people s way of life Roadshow presentation Q Jyri Luomakoski, President & CEO Maija Strandberg, CFO May 2017
 Enriching people s way of life Roadshow presentation Q1 2017 Jyri Luomakoski, President & CEO Maija Strandberg, CFO May 2017 Why invest in Uponor The company: An industry innovator building on a century
Enriching people s way of life Roadshow presentation Jyri Luomakoski, President and CEO Riitta Palomäki, CFO May 2016
 Enriching people s way of life Roadshow presentation Jyri Luomakoski, President and CEO Riitta Palomäki, CFO May 2016 Uponor at a glance Uponor is a leading international provider of plastic based piping
Uponor roadshow presentation FY 2018
 Uponor roadshow presentation FY 2018 Jyri Luomakoski, President and CEO Uponor at a glance Uponor is a leading international provider of plastic based piping systems for buildings and infrastructure. We
Uponor roadshow presentation January December Jyri Luomakoski, President and CEO Maija Strandberg, CFO
 Uponor roadshow presentation January December 2017 Jyri Luomakoski, President and CEO Maija Strandberg, CFO Uponor at a glance Leading international provider of plastic based piping systems for buildings
Interim results briefing. Jyri Luomakoski President and CEO Riitta Palomäki CFO 1 9 / 2016
 Interim results briefing Jyri Luomakoski President and CEO Riitta Palomäki CFO 1 9 / 2016 Q3/2016: Performance in Europe improved, supply issues impacted North American business July - September, M Net
Financial results briefing 1-12/2017. Jyri Luomakoski President and CEO, Uponor Corporation Maija Strandberg CFO, Uponor Corporation
 Financial results briefing 1-12/2017 Jyri Luomakoski President and CEO, Uponor Corporation Maija Strandberg CFO, Uponor Corporation Q4/2017: Building and construction markets were lively in North America,
Uponor roadshow presentation H1/2018
 Uponor roadshow presentation H1/2018 Jyri Luomakoski, President and CEO Maija Strandberg, CFO Uponor celebrates its centenary in 2018 SHK Essen Germany Aquatherm Moscow, Russia Nordbygg Stockholm, Sweden
Interim results briefing Jyri Luomakoski President and CEO Riitta Palomäki CFO 1 3 / 2016
 Interim results briefing Jyri Luomakoski President and CEO Riitta Palomäki CFO 1 3 / 2016 Q1/2016: Steady progress in Europe, strong growth in North America January - March, M Net sales Healthy U.S. market
Uponor roadshow presentation Q3/2018. Jyri Luomakoski, President and CEO Maija Strandberg, CFO
 Uponor roadshow presentation Q3/2018 Jyri Luomakoski, President and CEO Maija Strandberg, CFO Uponor celebrates its centenary in 2018 SHK Essen Germany Aquatherm Moscow, Russia Nordbygg Stockholm, Sweden
Uponor roadshow presentation January March Jyri Luomakoski, President and CEO Maija Strandberg, CFO
 Uponor roadshow presentation January March 2018 Jyri Luomakoski, President and CEO Maija Strandberg, CFO Uponor celebrates its centenary in 2018 SHK Essen Germany Aquatherm Moscow, Russia Nordbygg Stockholm,
Financial results briefing Q3/2015
 Financial results briefing Q3/2015 Jyri Luomakoski President and CEO Uponor Corporation Uponor, Inc. factory, Apple Valley, Minnesota, USA Q3/2015 market overview Nordics Construction activity in Sweden
Financial results briefing Q3/2012
 Financial results briefing Q3/2012 Jyri Luomakoski President and CEO Uponor Corporation NCC Uponor s new head office, which will be taken into use 1 Jan 2013, will showcase sustainable and innovative Uponor
Performance in January-June August 2010
 Performance in January-June 2010 12 August 2010 Jyri Luomakoski President and CEO Uponor Corporation Summary of Q2/2010 Financial turmoil after Q1 rocked the stabilising development in the market-place
Strategic update. Jyri Luomakoski President and CEO, Uponor Corporation 11 December 2013
 Strategic update Jyri Luomakoski President and CEO, Uponor Corporation 11 December 2013 Presentation outline Markets Strategy Long-term financial targets In summary Appendices 2 Markets Building and construction
Results briefing Helsinki 26 October 2007
 Results briefing Helsinki 26 October 2007 Jan Lång President and CEO Declining market trends in Q3 Q3 showed a rapid drop in residential housing solutions demand Infrastructure solutions demand on satisfactory/good
Interim Jan June/ 2005 results briefing
 Interim Jan June/ 2005 results briefing Helsinki, 4 August 2005 Market and business review Financial results Outlook Jan Lång, President and CEO Jyri Luomakoski, CFO and Deputy CEO Jan Lång Questions Interim
Interim Jan-March 2007 results briefing Helsinki 26 April Jan Lång President and CEO
 Interim Jan-March 2007 results briefing Helsinki 26 April 2007 Jan Lång President and CEO Q1/2007: Positive market environment in Europe, decline in U.S. continues Lively demand for Uponor solutions Strong
Half year financial report
 Half year financial report January June 2018 25 July 2018 HALF YEAR FINANCIAL REPORT JANUARY JUNE 2018 Growth of net sales and operating profit was driven by strong performance by Uponor Infra Net sales
INTERIM REPORT 2010 Performance in January-March April Jyri Luomakoski President and CEO Uponor Corporation
 INTERIM REPORT 2010 Performance in January-March 2010 28 April 2010 Jyri Luomakoski President and CEO Uponor Corporation Summary of Q1/2010 What looked like an emerging recovery of building markets was
Interim report. January September 2018
 Interim report January September 2018 24 October 2018 INTERIM REPORT JANUARY SEPTEMBER 2018 Net sales and comparable operating profit fell behind from exceptionally strong comparison period Net sales in
Annual results briefing 2003
 Annual results briefing 2003 Helsinki, 3 Feb. 2004 Market and business review Financial statement 2003 Update on the restructuring programme New organisation at 1 March 2004 Outlook Jan Lång, CEO Jyri
Important dates in Uponor Investor Relations
 Annual report 2016 Important dates in 2017 Annual General Meeting Uponor Corporation s Annual General Meeting will be held on Monday, 20 March 2017 at 15.00 EET at the Helsinki Exhibition and Convention
Eurozone Economic Watch. February 2018
 Eurozone Economic Watch February 2018 Eurozone: Strong growth continues in 1Q18, but confidence seems to peak GDP growth moderated slightly in, but there was an upward revision to previous quarters. Available
Uponor Corporation Stock exchange release 3 Aug :00 JANUARY-JUNE 2006: UPONOR REPORTS CONTINUED STRONG DEVELOPMENT
 Uponor Corporation Stock exchange release 3 Aug. 11:00 JANUARY-JUNE : UPONOR REPORTS CONTINUED STRONG DEVELOPMENT - Net sales and results remained strong in the second quarter - Net sales (January-June)
FULL YEAR REPORT, 2017 TELEPHONE/AUDIO CONFERENCE 8 FEBRUARY 2018, AT CET TOMMY ANDERSSON, PRESIDENT AND CEO HELENA WENNERSTRÖM, EVP AND CFO
 TELEPHONE/AUDIO CONFERENCE 8 FEBRUARY 2018, AT 15.30 CET TOMMY ANDERSSON, PRESIDENT AND CEO HELENA WENNERSTRÖM, EVP AND CFO DIRECT LINK AUDIOCAST: HTTPS://TV.STREAMFABRIKEN.COM/BULTEN Q4 2017 TELECONFERENCE:
Interim report January March 2018
 Interim report January March 2018 3 May 2018 INTERIM REPORT JANUARY MARCH 2018 Strong net sales of North American businesses drive performance improvement in the first quarter Strong growth in net sales
WAVIN GROUP REPORTS STRONG INCREASE IN REVENUE AND OPERATING RESULTS IN FIRST HALF YEAR 2007
 WAVIN GROUP REPORTS STRONG INCREASE IN REVENUE AND OPERATING RESULTS IN FIRST HALF YEAR 2007 Zwolle, 6 September 2007 Wavin N.V., leading supplier of plastic pipe systems and solutions in Europe, today
Huhtamaki roadshow presentation. Investor Relations Q1 2009
 Huhtamaki roadshow presentation Investor Relations 2009 Huhtamaki in brief A leading manufacturer of consumer and specialty packaging with head office in Espoo, Finland Net sales EUR 2.3 billion in 65
ENIRO Q3 REPORT Johan Lindgren, CEO Mattias Lundqvist, CFO Cecilia Lannebo, Head of IR
 ENIRO Q3 REPORT 2012-10-25 Johan Lindgren, CEO Mattias Lundqvist, CFO Cecilia Lannebo, Head of IR CEO INTRODUCTION & SUMMARY A digital media company with 74 percent of revenues being digital the transformation
Makes it easier to be professional
 Makes it easier to be professional Handelsbanken Nordic Mid/small Cap Seminar June 8, 2017 President and CEO Johan Nilsson 2 2 Introduction One-Stop-Shop multi channel offering for professionals Branches
FINANCIAL STATEMENTS 1 Jan-31 Dec 2016 Uponor Corporation
 FINANCIAL STATEMENTS 1 Jan-31 Dec 2016 Uponor Corporation CONTENTS Review by the Board of Directors 3 Group key figures 14 Share-specific key figures 15 Definitions of key ratios 16 Consolidated statement
Eurozone Economic Watch. May 2018
 Eurozone Economic Watch May 2018 BBVA Research - Eurozone Economic Watch / 2 Eurozone: more moderate growth with higher uncertainty The eurozone GDP growth slowed in more than expected. Beyond temporary
Huhtamaki roadshow presentation. Investor Relations Copenhagen Jan 8, 2010
 Huhtamaki roadshow presentation Investor Relations Copenhagen Jan 8, 2010 Huhtamaki in brief A leading manufacturer of consumer and specialty packaging with head office in Espoo, Finland Net sales EUR
Communication on the future of the CAP
 Communication on the future of the CAP The CAP towards 2020: meeting the food, natural resources and territorial challenges of the future Tassos Haniotis, Director Agricultural Policy Analysis and Perspectives
Eurozone Economic Watch. July 2018
 Eurozone Economic Watch July 2018 Eurozone: A shift to more moderate growth with increased downward risks BBVA Research - Eurozone Economic Watch July 2018 / 2 Hard data improved in May but failed to recover
Cembrit Group Q Unaudited interim report
 Cembrit Group Q4 2017 Unaudited interim report 2017 main events COMMENTARY Strong demand across both markets and product categories resulted in revenue growth of 7.9% YoY 2017 EBITDA showed solid underlying
Eurozone Economic Watch. March 2018
 Eurozone Economic Watch March 20 Eurozone Economic Watch March 20 Eurozone: The moderation of confidence continues We expect GDP growth to remain steady early this year supported mostly by strong global
Interim Report January September 2017
 Interim Report January September 2017 Ari Lehtoranta, President and CEO Martti Ala-Härkönen, CFO October 27, 2017 Contents Group development Cash flow and financing Market outlook and guidance for 2017
Eurozone Economic Watch. November 2017
 Eurozone Economic Watch November 2017 Eurozone: improved outlook, still subdued inflation Our MICA-BBVA model for growth estimates for the moment a quarterly GDP figure of around -0.7% in, after % QoQ
Revenue and earnings growth continued JANUARY-SEPTEMBER 2018
 JARI ROSENDAL, PRESIDENT AND CEO PETRI CASTRÉN, CFO OCTOBER 24, 2018 Revenue and earnings growth continued JANUARY-SEPTEMBER 2018 Key financial highlights Q3 2018 Organic growth +9% Growth continued driven
Q1 Q Q3 Q EUR million Jan-Mar 2018 Jan-Mar 2017 Change, % EUR million Jan-Dec 2017
 Stockholm, Sweden, 4 May Eltel Group Interim report January March January March Group net sales decreased 10.5% to EUR 266.6 million (297.8), mainly as a result of divestments and on-going discontinuation
Clas Ohlson: Year-end report 1 May April 2013
 Clas Ohlson: Year-end report 1 May 2012 30 April 2013 Fourth quarter * Sales totalled SEK 1,274 M (1,272). In local currencies, growth was 3%. * Operating loss of SEK 19 M reported (profit: 10). * Loss
SEE macroeconomic outlook Recovery gains traction, fiscal discipline improving. Alen Kovac, Chief Economist EBC May 2016 Ljubljana
 SEE macroeconomic outlook Recovery gains traction, fiscal discipline improving Alen Kovac, Chief Economist EBC May 216 Ljubljana Real economy highlights Recent GDP track record reveals more favorable footprint
Lindab Group presentation Q3 2010
 lindab group presentation Lindab Group presentation Q3 2010 David Brodetsky, CEO Nils-Johan Andersson, CFO Agenda Highlights Group Business Areas Strategy Trends and outlook Q & A 2 Lindab Group Highlights
Update on current strategy
 Update on current strategy Jan Lång President and CEO The strategic actions launched in 2003 have mostly been completed Growth Brand Operational excellence Build on current platforms Grow essentially organically
Positive trend in earnings and strong cash flow
 Positive trend in earnings and strong cash flow Presentation of the Q3/2017 result Martin Lindqvist, President & CEO Håkan Folin, CFO October 25, 2017 Agenda Q3/2017 and performance by division Financials
The real change in private inventories added 0.22 percentage points to the second quarter GDP growth, after subtracting 0.65% in the first quarter.
 QIRGRETA Monthly Macroeconomic Commentary United States The U.S. economy bounced back in the second quarter of 2007, growing at the fastest pace in more than a year. According the final estimates released
EUROZONE ECONOMIC WATCH JANUARY 2017
 EUROZONE ECONOMIC WATCH JANUARY 2017 Key messages: some changes for the better Improving confidence in across the board shows the resilience of the eurozone to the various potentially disturbing political
Interim report Q3, July September 2017 Stockholm, 25 October 2017
 Interim report Q3, July September Stockholm, 25 October As of the second quarter of, Cloetta Italia S.r.l. is accounted for as discontinued operation. The comparative figures in the consolidated profit
Eurozone Economic Watch. April 2018
 Eurozone Economic Watch April 2018 Eurozone: solid growth and broadly unchanged projections, with protectionist risks BBVA Research - Eurozone Economic Watch / 2 Confidence has weakened in 1Q18 since the
Half Yearly Report January June 2017
 Half Yearly Report January June 2017 Ari Lehtoranta, President and CEO Martti Ala-Härkönen, CFO July 20, 2017 Contents Group development Cash flow and financing Market outlook and guidance for 2017 Operating
Lindab Group presentation Q2 2010
 lindab group presentation Lindab Group presentation Q2 2010 David Brodetsky, CEO Nils-Johan Andersson, CFO Agenda Highlights Group Business Areas Strategy Trends and outlook Q & A 2 Lindab Group Highlights
Orders received increased to EUR 3.1 billion and Comparable EBITA to EUR 196 million in 2016
 Orders received increased to EUR 3.1 billion and Comparable EBITA to EUR 196 million in 216 Financial Statements Review 216 February 8, 217 Pasi Laine, President and CEO Kari Saarinen, CFO Agenda Financial
Eurozone. Economic Watch FEBRUARY 2017
 Eurozone Economic Watch FEBRUARY 2017 EUROZONE WATCH FEBRUARY 2017 Eurozone: A slight upward revision to our GDP growth projections The recovery proceeded at a steady and solid pace in, resulting in an
Interim Report January September 2018
 Interim Report January September 2018 Ari Lehtoranta, President and CEO Martti Ala-Härkönen, CFO 25 October 2018 Contents Group development Q3/2018 Cash flow and financing Market outlook Update on the
Short-term indicators and Updated Forecasts. Eurozone NOVEMBER 2016
 Short-term indicators and Updated Forecasts Eurozone NOVEMBER 2016 EUROZONE WATCH NOVEMBER 2016 Key messages: resilience and unchanged projections The moderate pace of economic growth continued in the
SIX MONTHS REPORT, JAN JUN 2018
 SIX MONTHS REPORT, JAN JUN 2018 TELEPHONE/AUDIO CONFERENCE 11 JULY 2018, AT 11.00 CET TOMMY ANDERSSON, PRESIDENT AND CEO HELENA WENNERSTRÖM, EVP AND CFO DIRECT LINK AUDIOCAST: HTTPS://TV.STREAMFABRIKEN.COM/BULTEN
CEO s review Annual General Meeting 28 March 2017
 CEO s review Annual General Meeting 28 March 2017 Year 2016 in brief Financial performance Outlook and guidance 2 Operating environment during 2016 Finland Infra projects were supported by large-scale
Lindab Group Q4 and Full Year 2014
 Lindab Group Q4 and Full Year 2014 Anders Berg, CEO Per Nilsson, CFO Highlights 2 First year as One Lindab moving in One direction Some key highlights 2014 Acquisitions Novo Clima, Sweden: in-house production
Interim report 1 May January 2014
 Interim report 1 May 2013 31 January 2014 Third quarter 2013/14 Sales increased by 3 % to 2,238 MSEK (2,169). In local currencies, the increase was 7 % Operating profit increased by 34 % to 330 MSEK (247)
Interim Report January September 2013
 Interim Report January September 2013 Juhani Pitkäkoski President and CEO November 1, 2013 Contents Financial development Development by business Financial position Market outlook and guidance July September
Interim Results for the 6 months to 30 September NOVEMBER 2010
 Interim Results for the 6 months to 30 September 2010 8 NOVEMBER 2010 Nick Robertson Introduction Strong H1 Retail sales up 50%, group revenues up 45% Strong UK and international retail sales, up 26% and
ANNOUNCEMENT OF PRELIMINARY RESULTS
 The leading high service distributor to engineers worldwide ANNOUNCEMENT OF PRELIMINARY RESULTS YEAR ENDED 31 MARCH 2009 29 May 2009 Agenda Overview and current trading Ian Mason Financial performance
Quarterly Report 01/2018
 Q1 Quarterly Report 01/2018 CENTROTEC The European Energy-Saving Company Highlights > International expansion continues; stable development in German heating market > Group revenue up 1.5% on prior-year
ENIRO Q1 REPORT Johan Lindgren, CEO Mattias Lundqvist, CFO Cecilia Lannebo, Head of IR
 ENIRO Q1 REPORT 2012-04-25 Johan Lindgren, CEO Mattias Lundqvist, CFO Cecilia Lannebo, Head of IR FINANCIAL HIGHLIGHTS, Q1 2012 Revenues SEK 959 M (966), a decline of 0,7% (-24). Organically revenues declined
H & M HENNES & MAURITZ AB NINE-MONTH REPORT
 NINE-MONTH REPORT 2010 H & M HENNES & MAURITZ AB NINE-MONTH REPORT 1 December 2009 31 August 2010 NINE MONTHS The H&M Group s sales excluding VAT during the first nine months of the financial year amounted
Interim report for the third quarter, 2005
 int e r i m re p o r t 2 5 Interim report for the third quarter, 25 THE LINDAB GROUP REVENUES DURING THE QUARTER INCREASED BY 13 PERCENT OPERATING PROFIT (EBITA), EXCLUDING ONE-TIME ITEMS INCREASED BY
lindab we simplify construction Lindab Group Q Ola Ringdahl President and CEO Kristian Ackeby CFO
 lindab we simplify construction Lindab Group Q2 2018 Ola Ringdahl President and CEO Kristian Ackeby CFO Agenda Summary and overview Financials Highlights Outlook Summary and Q&A Summary and overview Key
CONSTI GROUP PLC INTERIM REPORT 1 JANUARY 30 SEPTEMBER 2018
 CONSTI GROUP PLC INTERIM REPORT 1 JANUARY 30 SEPTEMBER 2018 CEO Esa Korkeela CFO Joni Sorsanen Contents Highlights and Group performance Cash flow and financial position Market outlook, guidance and summary
Year-end Report January December 2014
 Year-end Report January December 2014 Johan Dennelind President & CEO 4 4G population coverage now exceeds 99 percent in Sweden 4G traffic now surpasses 3G traffic in Sweden 4 new villas per hour connected
Q3 Report 2007 Johan Molin, President & CEO
 Q3 Report 2007 Johan Molin, President & CEO 1 Financial Highlights Q3 Q3 - Solid improvement Good continued growth in all areas Raw material compensated & efficiency gains Earnings improvements in all
RESULT JANUARY-JUNE 2006, August 8th. Mr. Kim Gran, President and CEO
 RESULT JANUARY-JUNE 2006, August 8th Mr. Kim Gran, President and CEO 1 CONTENTS Result H1 2006 Page Key figures 3 Operating profit per quarter 4 Market situation 5 Nokian Tyres H1 2006 6 Net sales by product
NKT I IR presentation I Interim Report Q November 2014 I 1 NKT. Interim Report Q Webcast, 13 November 2014 at 10:00 CET
 13 November 2014 I 1 NKT Interim Report Q3 2014 Webcast, 13 November 2014 at 10:00 CET 13 November 2014 I 2 Forward looking statements This presentation and related comments contain forward-looking statements.
Continued favourable organic growth
 Continued favourable organic growth (Figures in brackets refer to the corresponding period in 2006.) Sales for kitchen company Nobia rose by 6 per cent during the third quarter to SEK 3,861 million (3,631).
THIRD QUARTER October 2009
 THIRD QUARTER 2009 21 October 2009 AGENDA CEO review Financial review Concluding remarks Harri Koponen Lars Nilsson Harri Koponen 2 2009-10-21 Third quarter 2009 HIGHLIGHTS Q3 Solid result with all regions
INEOS STYROLUTION. Q1/ 2018 Investor Earnings Call
 INEOS STYROLUTION Q1/ 2018 Investor Earnings Call Disclaimer The following presentation includes forward-looking statements, within the meaning of the US securities laws, based on our current expectations
Roadshow Oslo 5 September 2012
 Lemminkäinen Corporation Roadshow Oslo 5 September 212 CFO Robert Öhman IR Kati Sundström Contents Lemminkäinen in brief and financial development Strategy 21-213 and strategy update H1/212 result and
Financial Statements Release January December 2018
 Financial Statements Release January December 2018 Disclaimer In this presentation, all forward-looking statements in relation to the company or its business are based on the management judgment, and macroeconomic
Text. improvement in earnings. Textdemand drove continued
 Good Textdemand drove continued improvement in earnings Text Presentation of the Q2/2018 results Martin Lindqvist, President & CEO Håkan Folin, CFO July 20, 2018 Agenda Market and demand trends Performance
First Quarter 2017 April 19, qlirogroup.com
 First Quarter 2017 April 19, 2017 BUSINESS UPDATE Marcus Lindqvist, CEO 2 Increased Gross Profit and Credit Market Licence Highlights Strategy Focus 1. E-commerce gross profit increased 15 per cent to
Strong organic growth
 lindab interim report Jan - March Strong organic growth First quarter Net sales increased by 32% to SEK 1,972 M (1,494) The operating profit (EBITA) increased by 121% to SEK 188 M (85) The operating margin
Q2 Presentation August 23 rd 2018
 Q2 Presentation August 23 rd 2018 PRESENTERS Michael Holmberg CEO Andreas Kovacs CFO 2 3 RAKETECH S MISSION To guide and inspire people to informed decisions. RAKETECH S VISION To always be the first choice
Zenith Monthly Economic Report October 2011
 Zenith Monthly Economic Report October 211 ECONOMIC STATISTICS SUMMARY Cash Rate Inflation Rate (%) Unemployment Rate (%) GDP Annual Growth (%) Country Latest Last Change Latest Change Latest Change Past
Arçelik Financial Results
 Arçelik 2015 Financial Results 4Q15 developments Key developments Strong growth in international sales, both organic and FX related Record breaking monthly international sales in October and November Good
Eurozone Economic Watch Higher growth forecasts for January 2018
 Eurozone Economic Watch Higher growth forecasts for 2018-19 January 2018 Eurozone Economic Watch January 2018 Eurozone: Higher growth forecasts for 2018-19 Our MICA-BBVA model estimates a broadly stable
Func Food Group Financial Release / Q2 2017
 Func Food Group Financial Release / Q2 2017 Func Food Group Financial Release / Q2 2017 Func Food Group / Q2 2017 3 FUNC FOOD GROUP IN BRIEF Func Food Group ( FFG ) is a Nordic wellness company, which
The Cyprus Economy: from Recovery to Sustainable Growth. Vincenzo Guzzo Resident Representative in Cyprus
 The Economy: from Recovery to Sustainable Growth Vincenzo Guzzo Resident Representative in Growth momentum remains strong 18 : Real GDP ( billion) 1 Deviation from Pre-Crisis Level and Trend (Percent)
Interim report JANUARY JUNE 2015
 Interim report JANUARY JUNE 215 In light of the ongoing business transformation, I am satisfied with our overall second quarter performance, with organic growth of 1. per cent. This means that we have
Func Food Group Financial Release / Q1 2018
 Func Food Group Financial Release / Q1 2018 Func Food Group Financial Release / Q1 2018 Func Food Group / Q1 2018 3 FUNC FOOD GROUP IN BRIEF Func Food Group ( FFG ) is a Nordic wellness company, which
Interim report Q1/2013. Sakari Tamminen, President & CEO Rautaruukki Corporation 25 April 2013
 Interim report Q1/2013 Sakari Tamminen, President & CEO Rautaruukki Corporation 25 April 2013 Agenda Q1 in brief, key figures Financial performance Business area performance Business environment Key actions
RESULTS DNB GROUP FOURTH QUARTER
 RESULTS DNB GROUP FOURTH QUARTER 03.02.2017 Major achievements in 2016 CET1 ratio requirement reached one year ahead of plan. CET1 ratio 16.0 per cent. Leverage ratio 7.3 per cent, well above the upcoming
Interim Report Polygon AB
 Interim Report Polygon AB January - March 2017 FIRST QUARTER 2017 Sales + 21% 132.8 million (109.4) Strong organic growth of 21% as a result of healthy backlog levels also fuelled by an increased share
RECORD SALES, EBITA AND CASH FLOW ACCELERATED ORGANIC GROWTH TO 19 %
 RECORD SALES, EBITA AND CASH FLOW ACCELERATED ORGANIC GROWTH TO 19 % Bygghemma Group First AB (publ) 1 Today s presenters Mikael Olander President and CEO Martin Edblad CFO Bygghemma Group since 2012 CEO
Eurozone Economic Watch
 BBVA Research Eurozone Economic Watch November 2018 / 1 Eurozone Economic Watch November 2018 Eurozone: Growth to recover in 4Q18, but concerns about the slowdown next year are growing Eurozone GDP growth
HeidelbergCement. Results January to March 2007 Heidelberg, 10 May 2007 Dr. Bernd Scheifele, CEO and Dr. Lorenz Näger, CFO
 HeidelbergCement Results January to March 2007 Heidelberg, 10 May 2007 Dr. Bernd Scheifele, CEO and Dr. Lorenz Näger, CFO Slide 1-09.05.2007 Contents Overview Key figures Results per Group area Financial
Europe Outlook. Third Quarter 2015
 Europe Outlook Third Quarter 2015 Main messages 1 2 3 4 5 Moderation of global growth and slowdown in emerging economies, with downside risks The recovery continues in the eurozone, but still marked by
Britvic plc. Preliminary Results 2011
 Britvic plc Preliminary Results 2011 Gerald Corbett Chairman John Gibney Group Finance Director Agenda Financial performance John Gibney Britvic and the market review Paul Moody Group performance +14.6%
RECORD-BREAKING FOURTH QUARTER SALES AND EBITA AS MARKET CONDITIONS RETURN TO NORMAL
 RECORD-BREAKING FOURTH QUARTER SALES AND EBITA AS MARKET CONDITIONS RETURN TO NORMAL Bygghemma Group First AB (publ) 1 Today s presenters Mikael Olander President and CEO Martin Edblad CFO Bygghemma Group
HUHTAMÄKI OYJ INTERIM REPORT. January 1 March 31, 2013
 HUHTAMÄKI OYJ INTERIM REPORT January 1 March 31, 2013 Huhtamäki Oyj, Interim Report January 1 March 31, 2013 Net sales and EBIT increased Net sales growth of 4% led by the foodservice acquisition in Asia
Full-Year Result 2017
 Full-Year Result 2017 Susan Duinhoven, President and CEO Markus Holm, CFO & COO 8 February 2018 Before we start: Adjustments and Discontinued operations In January 2018 Sanoma announced an intention to