Uponor roadshow presentation Q3/2018. Jyri Luomakoski, President and CEO Maija Strandberg, CFO
|
|
|
- Lambert Conley
- 5 years ago
- Views:
Transcription


1 Uponor roadshow presentation Q3/2018 Jyri Luomakoski, President and CEO Maija Strandberg, CFO


2 Uponor celebrates its centenary in 2018 SHK Essen Germany Aquatherm Moscow, Russia Nordbygg Stockholm, Sweden 100-year anniversary celebration: Bucharest, Romania 100-year anniversary celebration: Budapest, Hungary Annual General Meeting 2018 Helsinki, Finland 2
3 Uponor at a glance Leading international provider of plastic based piping systems for buildings and infrastructure We provide safe drinking water delivery systems, energy-efficient radiant heating and cooling and reliable infrastructure solutions Uponor is listed on Nasdaq Helsinki since As of January 2018, the company is listed in the Large Cap category. Infrastructure solutions 27% 24% Indoor climate solutions 49% Plumbing solutions FACTS & FIGURES billion euro Net sales 2017 countries with Uponor operations 15 production sites worldwide 4,000 worldwide staff 3
4 Uponor globally 15 production sites Countries with Countries where Uponor Countries where Uponor Uponor operations operates through partners sells through export 4

5 Our solutions enrich people s way of life Our vision Throughout the world, our solutions enrich people s way of life Our mission Partnering with professionals to create better plumbing, indoor climate and infrastructure solutions Our people We will build an exciting environment for growth and achievement both for the company and our employees 5

6 Shared values guide our operations With 4,000 committed employees in 30 countries, Uponor is at your service all over the world. O U R V AL U E S CONNECT 6 BUILD INSPIRE


: 50Hertz headquarters, Berlin, Germany Radiant")


7 Throughout the world, our solutions enrich people s way of life MLC riser system for a cruise ship, cutting installation time to a bare minimum: Carnival Cruises PE pressure pipes and prefabricated fittings for the Copenhagen metro: Copenhagen, Denmark Radiant heating & cooling, snowmelt and plumbing: football team Vikings headquarters and practice facility, Minnesota, USA Uponor heating & cooling solutions - winner of Diamond & Gold awards from German Sustainable Building Council (DGNB): 50Hertz headquarters, Berlin, Germany Radiant cooling solution to create the most advanced learning environment: New campus for the International School of Kuala Lumpur (ISKL), Kuala Lumpur Reducing energy consumption with Uponor TABS shortlisted for a prestigious H&V News award: Dudley College, UK 7 First villa project in China - radiant heating & cooling to save energy and ensure high comfort: Changjia Villa, Kunshan, China Weholite stormwater tank to attenuate runoffs at the new Children's Hospital: Helsinki, Finland


")
8 Our business groups Plumbing solutions 49% ( * Indoor climate solutions 24% ( * Infrastructure solutions 27% ( * *) share of Group net sales 8


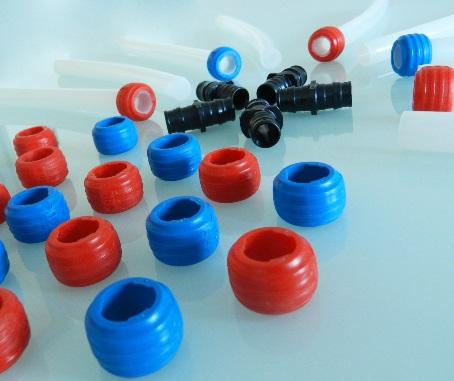

9 Uponor s plumbing offering For efficient and hygienic drinking water delivery Flexible pipe systems Multilayer pipe systems Risers Press fittings Prefabricated units Quick & Easy fittings Tools Intelligent water and hygiene 9


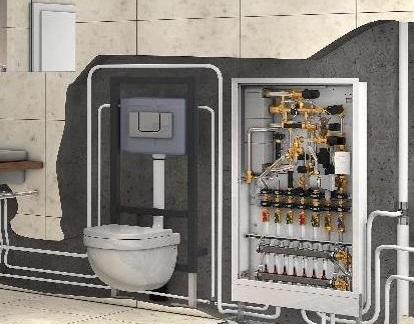
10 Uponor s indoor climate offering The basis for a comfortable and energy-efficient ambiance Radiant heating and cooling Thermally active slabs Ceiling cooling Geothermal energy stations Manifold stations Controls Local heat distribution Ventilation 10


11 Uponor s infrastructure offering Transporting water, air, electricity, telecommunications and data Standard Solutions 360 Project Services Weholite Technology Licensing 11

12 Investment in R&D and technology After 2016, another year of historically high R&D expenditure, with a total expenditure at 23.2 million or 2.0% of net sales Key projects steered by Group Technology function, established in 2016 Investment in digitalisation and hygienic initiatives continued Phyn Plus New smart water offering, Phyn Plus UWater online monitoring maturing into market entry through Uponor Infra Hygienic fresh water stations Prefabricated offering development Uponor Smatrix Style 12

13 Phyn Plus smart water assistant with nationwide installer network being built up in North America Introduced in the U.S. market in January 2018 at leading trade shows Won a number of Smart Home awards Commercial sales started in Q2/2018 European introduction planned for ISH 2019 Authorised network of installers, the Uponor Pro Squad In February 2018, Uponor invested an additional USD10 million to boost Phyn expansion, bringing total investment to USD25 million, or 50% 13

14 The Uponor online water quality monitoring The Uponor online water quality monitoring technology was acquired in Dec 2015 The innovative online technology will make the potable water distribution safer Uponor currently pioneering in infrastructure applications for potable water networks The flexible technology can be applied to industry, residential and public premises, such as hospitals, nursing homes and hotels 14
15 Uponor s sustainability statement Uponor is committed to addressing the key issues of our time through innovations that help reduce environmental impact. Through partnerships, we strive to provide leadership in sustainable solutions for the mutual well-being of both people and the planet, while ensuring the long-term viability of our operations. Our sustainability pillars Strongly integrating sustainability into our corporate mindset Driving down our environmental impact Enriching life through our innovative solutions Engaging external stakeholders in our sustainability journey 15
 Renewed sustainability section in the Annual report 2017 following the EU guidelines on non-financial reporting Uponor has been reporting")
16 Uponor s non-financial performance Overall sustainability performance supported by operational streamlining, including production concentration to fewer sites Exceeded our goal of reducing GHG emissions by 20% per net sales by 2020 (from the 2015 levels) Renewed sustainability section in the Annual report 2017 following the EU guidelines on non-financial reporting Uponor has been reporting through CDP Climate change survey since

17 Development of environmental indicators 17
18 Major shareholders 30 September 2018 Oras Invest Ltd 22.6% Varma Mutual Pension Insurance Company 5.3% Nordea Nordic Small Cap Fund 3.9% Ilmarinen Mutual Pension Insurance Company 2.4% 36,5% Mandatum Life Insurance Company Ltd 1.8% The Local Government Pensions Institution 1.3% SEB Gyllenberg Finlandia Fund 1.2% Paasikivi Pekka 1.0% Nominee registerations 24.0% Others 36.5% Currently valid foreign notifications 20 March 2017: the holdings of Franklin Resources, Inc., went down to below 5.0% 24,0% 22,6% 5,3% 3,9% 2,4% 1,8% 1,3% 1,2% 1,0% 20,847 shareholders at the end of June 2018 Foreign shareholding at 24.0%, vs 26.4% at the end of December
19 Long-term financial targets Since 12 February 2013 Organic net sales growth to exceed annual GDP growth* by 3 ppts EBIT margin to exceed 10% ROI to exceed 20% Gearing to stay within 30 to 70 as an annual average of the quarters Dividend pay-out to be at least 50% of annual earnings (considering the gearing target) Achievement in % (target 5.4%*) 8.2% (comparable EBIT 8.3%) 16.3% % * GDP growth based on a weighted average growth in the top 10 countries 19
20 Share price development 2002 Q3/ Uponor, OMX Helsinki CAP PI rebased
21 Interim results briefing 1-9/2018 Jyri Luomakoski President and CEO, Uponor Corporation Maija Strandberg CFO, Uponor Corporation
22 Q3/2018: Net sales and comparable operating profit fell behind from comparison period July - September, M 7-9/ / 2018 Change Net sales % Operating profit % Comparable operating profit % Net sales Net sales of Building Solutions Europe declined due to weaker sales in Central Europe and Nordics Net sales of Building Solutions North America declined. The company estimates that some distributors changed their behaviour and shifted volumes from Q3 to Q2 due to the price increases in July Uponor Infra s net sales grew, both in Europe and North America, which was divested at the end of August Operating profit Building Solutions Europe s profitability was impacted by weaker net sales, higher operational expenses in the Virsbo manufacturing facility and rising raw material prices Operating profit of Building Solutions North America declined. The comparison period for the segment was strong, but the price increases introduced in the summer began to take effect at the end of the quarter The operating profit improved in both Europe and North America 22
23 Monthly development of net sales and comparable operating profit in Q3 M 120,0 100,0 80,0 60,0 40,0 20,0 0,0 Net sales Jul 2017 Jul 2018 Aug 2017Aug 2018 Sep 2017Sep 2018 M 16,0 14,0 12,0 10,0 8,0 6,0 4,0 2,0 0, Jul 2017 Jul 2018 Comparable operating profit 14.4 Aug Aug Sep Sep 2018 Uponor Infra, North American business Uponor Infra, North American business 23

24 Development by segment: Building Solutions Europe Market environment continues mainly positive, but bottlenecks remain in planning and installation capacity First signs of weakening in Swedish and Norwegian markets Streamlining operational footprint: Close down of sales offices in Switzerland and Australia Review of European warehouse network; close down of warehouse operations in France Divestment of Zent-Frenger (closing expected by 31 Oct) Jan Peter Tewes (President, Building Solutions Europe) left his position on 30 Sept Recruitment process ongoing 24

25 Development by segment: Building Solutions North America Hutchinson manufacturing facility running as planned The price increases introduced in the summer began to take effect at the end of the quarter Profitability of the segment has improved quarter by quarter during

26 Development by segment: Uponor Infra The segment continued its strong performance Finland in particular has improved its operating profit The share of higher margin projects sales continued to grow On 31 Aug, Uponor Infra s North American business was divested to Wynnchurch Capital, an American private equity firm Licensing agreement signed with Infra Pipe Solutions Ltd to continue the manufacturing of Weholite pipes and products in North America 26


27 Financial statements Maija Strandberg CFO, Uponor Corporation 1 9 /
28 January September 2018: Key figures Uponor Group Change Y/Y 2017 Net sales M % 1,170.4 Operating profit M % 95.9 Comparable operating profit M % 97.2 Comparable operating profit margin % 8.9% 8.6% -0.3% pts 8.3% Earnings per share (diluted) % 0.83 Return on equity (p.a.) % 20.2% 20.9% +0.7% pts 19.4% Return on investment (p.a.) % 19.4% 19.1% -0.3% pts 16.3% Net interest bearing liabilities M % Gearing % 48.2% 42.2% -6.0% pts 43.5% Net working capital of net sales (p.a.) % 11.0% 12.7% +1.7% pts 10.4% Number of employees, end of period FTE 4,079 4, % 4,075 28
29 July September 2018: Income statement Change Uponor Group, M Y/Y Net sales % Cost of goods sold % Gross profit % Gross profit margin (%) 34.4% 34.0% -0.4% pts Other operating income % Expenses % Operating profit % Operating profit margin (%) 12.7% 14.3% +1.6% pts Financial expenses, net % Share of result in associated companies % Profit before taxes % Profit for the period % EBITDA % Net sales Negative translation impact from USD, SEK and CAD vs last year. In constant currency terms, net sales growth was 1.3% or 3.9% in organic terms, excluding the impact of the divestiture in August Comparable gross profit margin landed at 34.0% (34.4) Operating profit came to 44.6 (40.4) million, a growth of 10.6%. This includes the disposal gain from the divestment of Uponor Infra s North American business ( 12.2 million). Comparable operating profit came to 33.8 (40.4) million, a decline of 16.2% 29
30 January September 2018: Income statement Change 1-12 Uponor Group, M Y/Y 2017 Net sales % 1,170.4 Cost of goods sold % Gross profit % Gross profit margin (%) 33.6% 33.6% -0.0% pts 33.7% Other operating income % 3.1 Expenses % Operating profit % 95.9 Operating profit margin (%) 8.7% 9.8% +1.1% pts 8.2% Financial expenses, net % 5.4 Share of result in associated companies % -2.3 Profit before taxes % 88.2 Profit for the period % 65.4 EBITDA % Net sales totalled million, with growth of 2.5% or organic growth of 6.7% in constant currency terms A negative currency impact of 29 million mainly driven by the USD, SEK and CAD Comparable gross profit came to (300.1) million, with the comparable gross profit margin landing at 33.6% (33.7). Comparable operating profit came to 78.8 (79.2) million, a decline of 0.4% 30

31 January September 2018: Net sales & comparable operating profit by segment Currency: M Net sales Comparable operating profit Building Solutions - Europe Building Solutions - North America Uponor Infra 0 Building Solutions - Europe Building Solutions - North America Uponor Infra Building Solutions Europe segment suffered from weaker sales than expected, which also impacted the operating profit Building Solutions North America s net sales and operating profit decreased. However, the segment had a strong comparison period, which resulted from overcoming the delivery difficulties experienced in the second quarter of On the positive side, the profitability of the segment has improved quarter by quarter in 2018 Uponor Infra s business in Europe has continued to improve its net sales and profitability. The divested business in North America continued its strong performance until the divestment on 31 August 31
32 Net sales development by key markets January September 2018 M Net sales growth driven by USA, Finland, Sweden and Poland USA Germany Finland Sweden Canada Denmark Netherlands Spain Norway Poland Others Growth % in EUR 2.9% -2.4% 3.6% 2.1% -0.9% 0.6% -0.6% 3.2% -0.9% 59.8% 3.2% % in Curr. 9.4% 9.6% 4.4% 0.8% 2.7% 59.8% 32 Jan-Sep 2016 Jan-Sep 2017 Jan-Sep 2018
33 January September 2018: Balance sheet 30 Sep 30 Sep Change 31 Dec Uponor Group, M Y/Y 2017 Property, plant and equipment Intangible assets Securities and long-term investments Inventories Cash and cash equivalents Other current and non-current assets Assets total Total equity Non-current interest-bearing liabilities Provisions Non-interest-bearing liabilities Current interest-bearing liabilities Shareholders' equity and liabilities total Investments were mainly related to capacity expansion and efficiency improvement Uponor Business Solutions Oy received 11.4 million of taxes, surtaxes and delay interests from the Finnish tax authorities in September. Additionally, the proceeds from the sale of Uponor Infra s North American business (39 M ) was received in September Cash was used to pay back commercial papers (45 M ) as well as the remaining portion of dividends (0.25 /share, totalling 16.8 M ) Gearing at 42.2% (48.2), four-quarter rolling gearing at 54.1% (59.8) 33
34 January September 2018: Cash flow Change 1-12 Uponor Group, M Y/Y 2017 Net cash from operations Change in NWC Net payment of income tax and interest Cash flow from operations Cash flow from investments Cash flow before financing Dividends paid Other financing Cash flow from financing Conversion differences Change in cash and cash equivalents Cash flow from business operations came to 35.5 (65.4) million, mainly due to increased amount of net working capital resulting from higher inventories Gross investments came to 36.2 (37.4) million Cash flow from investments include 8.1 million acquisition of joint venture and 38.9 million proceeds from disposal of subsidiaries and businesses Cash flow from financing includes the the two instalments of the dividend payment, totalling 35.8 million 34


35 Outlook for the future Jyri Luomakoski President and CEO, Uponor Corporation 35
36 Leading indicators: Many markets moderating from the strong growth witnessed in recent years Indicator YTD % Change Rolling 12-month % Change Data through USA Housing starts +4% 1) N/A September 2018 Germany Housing permits +3% -2% July 2018 Finland Housing permits -11% -1% July 2018 Sweden Housing starts -10% -3% June 2018 Canada Housing starts -11% 1) N/A August 2018 Denmark Construction index +4% N/A July 2018 Netherlands Housing permits +6% +4% July 2018 Spain Housing permits +26% +27% July 2018 Norway Housing starts -17% 17% August 2018 Poland Housing completions +4% +5% August 2018 Trend since Q2 update 1) Seasonally adjusted, annualised rate vs. same month in previous year Source: National Statistics Offices 36
37 Residential building permits remain strong in Europe, but have plateaued or fallen in most markets 160 European building permits index (Euro Area 19, seasonally adjusted) Residential permits for January to June 2018 increased slightly from the same period in 2017, but have retreated from the 10-year high seen in December 2017 Developments in the more volatile nonresidential segment have been mixed, with significant variation between different countries Jan-10 Jun-10 Nov-10 Apr-11 Sep-11 Feb-12 Jul-12 Dec-12 May-13 Oct-13 Mar-14 Aug-14 Jan-15 Jun-15 Nov-15 Apr-16 Sep-16 Feb-17 Jul-17 Dec-17 May-18 Non-residential Residential Source: Eurostat (Base year = 2015) 37
38 USA - Continued expansion With Q2 GDP growth at its highest level in four years, private consumption and, especially, business profits and investments appear to be gaining strength as a result of recent tax reforms Within the construction industry: Home builder confidence has moderated from the multi-year highs reported in winter, but remains firmly in expansionary territory Construction spending in most segments has risen since last year, but at a slower rate than earlier annualised housing starts (in 000 s) Housing Market Index (HMI) and housing starts HMI Rising interest rates, labour shortages, and affordability concerns have increased down-side risks 0 Single-family starts (lhs) Housing Market Index (rhs) Multi-family Starts (lhs) 0 Source: US Census, NAHB/Wells Fargo 38
39 Germany - A strong labour market is supporting residential investment The economy rebounded during Q2, from a disappointing Q1, with private consumption continuing to drive growth Within the construction industry: Residential building permits appear to have stabilised during the summer, having retreated from post-reunification highs seen in 2017 (chart) Builder confidence remains at all-time highs, with order books improving again during Q3 Permits (rolling 12-month total) Jan-09 Aug-09 Mar-10 Oct-10 German housing permits and builder confidence May-11 Dec-11 Jul-12 Feb-13 Rolling 12-month permit total (lhs) Sep-13 Apr-14 Nov-14 Jun-15 Jan-16 Aug-16 Mar-17 Oct-17 May Construction confidence (rhs) Source: Destatis and Eurostat Construction confidence indicator 39

40 Management agenda for Q4 Speed up the sales shift from residential to commercial in certain markets, e.g. Sweden Continuous focus on selling price and operational cost management in Building Solutions Europe 40
41 Guidance 2018, revised on 5 September The building and construction market has remained on a healthy level in all countries where Uponor operates, although there are signs of especially Nordic markets having reached their peaks. The political uncertainties, e.g. Brexit and the challenges posed by tariff increases, have remained, but have not yet impacted on consumer or business behaviour. The Group's capital expenditure, excluding any investment in shares, will remain at roughly the same level as in 2017, mainly driven by the capacity expansion programme in North America Assuming that economic development in Uponor's key geographies continues undisturbed, Uponor repeats its full-year guidance for 2018 (revised on 5 September): Excluding the impact of currencies, Uponor expects its organic net sales to grow from 2017 and comparable operating profit to remain at the same level as in

42 Why invest in Uponor The company: An industry innovator building on a century of tradition Established brand with a proven historic growth, organically and through acquisitions Stable business with a track record of profitable performance, even during downturns An up-to-date production network from the production technology perspective, as well as regional spread Committed long-term key ownership with a clear understanding of the industry s dynamics The business: Solutions for safe drinking water delivery, energyefficient heating and cooling and reliable infrastructure A leading international supplier of plastic plumbing and hydronic radiant heating systems and a strong position in civil engineering pipe systems in northern Europe A proven track record of superior quality supported by product, system and value chain innovation that meets customer expectations Total offering committed to: Comfort, Health, Efficiency, Sustainability and Safety Read more at: 42


43 Uponor IR app: Stay up to date with our latest developments effortlessly on the go Watch our webcasts Watch our quarterly release webcasts live or recorded via the app Create a watchlist Monitor our stock performance against other listed companies globally Share content with your network Share content with your connections via social media channels or through Be the first to know Turn on the push notifications to stay posted on our current news and events Download now!


44 Uponor IR site: investors.uponor.com Uponor s IR app: Follow us
Uponor roadshow presentation H1/2018
 Uponor roadshow presentation H1/2018 Jyri Luomakoski, President and CEO Maija Strandberg, CFO Uponor celebrates its centenary in 2018 SHK Essen Germany Aquatherm Moscow, Russia Nordbygg Stockholm, Sweden
Uponor roadshow presentation January March Jyri Luomakoski, President and CEO Maija Strandberg, CFO
 Uponor roadshow presentation January March 2018 Jyri Luomakoski, President and CEO Maija Strandberg, CFO Uponor celebrates its centenary in 2018 SHK Essen Germany Aquatherm Moscow, Russia Nordbygg Stockholm,
Uponor roadshow presentation January December Jyri Luomakoski, President and CEO Maija Strandberg, CFO
 Uponor roadshow presentation January December 2017 Jyri Luomakoski, President and CEO Maija Strandberg, CFO Uponor at a glance Leading international provider of plastic based piping systems for buildings
Financial results briefing 1-12/2017. Jyri Luomakoski President and CEO, Uponor Corporation Maija Strandberg CFO, Uponor Corporation
 Financial results briefing 1-12/2017 Jyri Luomakoski President and CEO, Uponor Corporation Maija Strandberg CFO, Uponor Corporation Q4/2017: Building and construction markets were lively in North America,
Uponor roadshow presentation FY 2018
 Uponor roadshow presentation FY 2018 Jyri Luomakoski, President and CEO Uponor at a glance Uponor is a leading international provider of plastic based piping systems for buildings and infrastructure. We
Enriching people s way of life Roadshow presentation Q Jyri Luomakoski, President & CEO Maija Strandberg, CFO May 2017
 Enriching people s way of life Roadshow presentation Q1 2017 Jyri Luomakoski, President & CEO Maija Strandberg, CFO May 2017 Why invest in Uponor The company: An industry innovator building on a century
Interim results briefing. Jyri Luomakoski President and CEO Riitta Palomäki CFO 1 9 / 2016
 Interim results briefing Jyri Luomakoski President and CEO Riitta Palomäki CFO 1 9 / 2016 Q3/2016: Performance in Europe improved, supply issues impacted North American business July - September, M Net
Enriching people s way of life. Roadshow presentation January September 2017 Jyri Luomakoski, President & CEO Maija Strandberg, CFO October 2017
 Enriching people s way of life January September 2017 Jyri Luomakoski, President & CEO Maija Strandberg, CFO Why invest in Uponor The company: An industry innovator building on a century of tradition Established
Enriching people s way of life Roadshow presentation Jyri Luomakoski, President and CEO Riitta Palomäki, CFO May 2016
 Enriching people s way of life Roadshow presentation Jyri Luomakoski, President and CEO Riitta Palomäki, CFO May 2016 Uponor at a glance Uponor is a leading international provider of plastic based piping
Interim results briefing Jyri Luomakoski President and CEO Riitta Palomäki CFO 1 3 / 2016
 Interim results briefing Jyri Luomakoski President and CEO Riitta Palomäki CFO 1 3 / 2016 Q1/2016: Steady progress in Europe, strong growth in North America January - March, M Net sales Healthy U.S. market
Financial results briefing Q3/2015
 Financial results briefing Q3/2015 Jyri Luomakoski President and CEO Uponor Corporation Uponor, Inc. factory, Apple Valley, Minnesota, USA Q3/2015 market overview Nordics Construction activity in Sweden
Interim report. January September 2018
 Interim report January September 2018 24 October 2018 INTERIM REPORT JANUARY SEPTEMBER 2018 Net sales and comparable operating profit fell behind from exceptionally strong comparison period Net sales in
Financial results briefing Q3/2012
 Financial results briefing Q3/2012 Jyri Luomakoski President and CEO Uponor Corporation NCC Uponor s new head office, which will be taken into use 1 Jan 2013, will showcase sustainable and innovative Uponor
Performance in January-June August 2010
 Performance in January-June 2010 12 August 2010 Jyri Luomakoski President and CEO Uponor Corporation Summary of Q2/2010 Financial turmoil after Q1 rocked the stabilising development in the market-place
Results briefing Helsinki 26 October 2007
 Results briefing Helsinki 26 October 2007 Jan Lång President and CEO Declining market trends in Q3 Q3 showed a rapid drop in residential housing solutions demand Infrastructure solutions demand on satisfactory/good
Half year financial report
 Half year financial report January June 2018 25 July 2018 HALF YEAR FINANCIAL REPORT JANUARY JUNE 2018 Growth of net sales and operating profit was driven by strong performance by Uponor Infra Net sales
Strategic update. Jyri Luomakoski President and CEO, Uponor Corporation 11 December 2013
 Strategic update Jyri Luomakoski President and CEO, Uponor Corporation 11 December 2013 Presentation outline Markets Strategy Long-term financial targets In summary Appendices 2 Markets Building and construction
INTERIM REPORT 2010 Performance in January-March April Jyri Luomakoski President and CEO Uponor Corporation
 INTERIM REPORT 2010 Performance in January-March 2010 28 April 2010 Jyri Luomakoski President and CEO Uponor Corporation Summary of Q1/2010 What looked like an emerging recovery of building markets was
Interim Jan-March 2007 results briefing Helsinki 26 April Jan Lång President and CEO
 Interim Jan-March 2007 results briefing Helsinki 26 April 2007 Jan Lång President and CEO Q1/2007: Positive market environment in Europe, decline in U.S. continues Lively demand for Uponor solutions Strong
Interim Jan June/ 2005 results briefing
 Interim Jan June/ 2005 results briefing Helsinki, 4 August 2005 Market and business review Financial results Outlook Jan Lång, President and CEO Jyri Luomakoski, CFO and Deputy CEO Jan Lång Questions Interim
Annual results briefing 2003
 Annual results briefing 2003 Helsinki, 3 Feb. 2004 Market and business review Financial statement 2003 Update on the restructuring programme New organisation at 1 March 2004 Outlook Jan Lång, CEO Jyri
Uponor Corporation Stock exchange release 3 Aug :00 JANUARY-JUNE 2006: UPONOR REPORTS CONTINUED STRONG DEVELOPMENT
 Uponor Corporation Stock exchange release 3 Aug. 11:00 JANUARY-JUNE : UPONOR REPORTS CONTINUED STRONG DEVELOPMENT - Net sales and results remained strong in the second quarter - Net sales (January-June)
Interim report January March 2018
 Interim report January March 2018 3 May 2018 INTERIM REPORT JANUARY MARCH 2018 Strong net sales of North American businesses drive performance improvement in the first quarter Strong growth in net sales
Lindab Group presentation Q3 2010
 lindab group presentation Lindab Group presentation Q3 2010 David Brodetsky, CEO Nils-Johan Andersson, CFO Agenda Highlights Group Business Areas Strategy Trends and outlook Q & A 2 Lindab Group Highlights
PROPERTY EU EUROPEAN LOGISTICS INVESTMENT BRIEFING
 PROPERTY EU EUROPEAN LOGISTICS INVESTMENT BRIEFING RICHARD HOLBERTON, SENIOR DIRECTOR, EMEA RESEARCH, CBRE FEBRUARY 19 TH 2015 AGENDA Economy Market Activity Forecasts Issues ECONOMY 2014 Some Alarms and
Continued favourable organic growth
 Continued favourable organic growth (Figures in brackets refer to the corresponding period in 2006.) Sales for kitchen company Nobia rose by 6 per cent during the third quarter to SEK 3,861 million (3,631).
RESULT JANUARY-JUNE 2006, August 8th. Mr. Kim Gran, President and CEO
 RESULT JANUARY-JUNE 2006, August 8th Mr. Kim Gran, President and CEO 1 CONTENTS Result H1 2006 Page Key figures 3 Operating profit per quarter 4 Market situation 5 Nokian Tyres H1 2006 6 Net sales by product
Huhtamaki roadshow presentation. Investor Relations Copenhagen Jan 8, 2010
 Huhtamaki roadshow presentation Investor Relations Copenhagen Jan 8, 2010 Huhtamaki in brief A leading manufacturer of consumer and specialty packaging with head office in Espoo, Finland Net sales EUR
Clas Ohlson: Year-end report 1 May April 2013
 Clas Ohlson: Year-end report 1 May 2012 30 April 2013 Fourth quarter * Sales totalled SEK 1,274 M (1,272). In local currencies, growth was 3%. * Operating loss of SEK 19 M reported (profit: 10). * Loss
WAVIN GROUP REPORTS STRONG INCREASE IN REVENUE AND OPERATING RESULTS IN FIRST HALF YEAR 2007
 WAVIN GROUP REPORTS STRONG INCREASE IN REVENUE AND OPERATING RESULTS IN FIRST HALF YEAR 2007 Zwolle, 6 September 2007 Wavin N.V., leading supplier of plastic pipe systems and solutions in Europe, today
Huhtamaki roadshow presentation. Investor Relations Q1 2009
 Huhtamaki roadshow presentation Investor Relations 2009 Huhtamaki in brief A leading manufacturer of consumer and specialty packaging with head office in Espoo, Finland Net sales EUR 2.3 billion in 65
Lindab Group presentation Q2 2010
 lindab group presentation Lindab Group presentation Q2 2010 David Brodetsky, CEO Nils-Johan Andersson, CFO Agenda Highlights Group Business Areas Strategy Trends and outlook Q & A 2 Lindab Group Highlights
Communication on the future of the CAP
 Communication on the future of the CAP The CAP towards 2020: meeting the food, natural resources and territorial challenges of the future Tassos Haniotis, Director Agricultural Policy Analysis and Perspectives
U.S. Steel Market Outlook. Amy Ebben ArcelorMittal USA November 30, 2018
 U.S. Steel Market Outlook Amy Ebben ArcelorMittal USA November 30, 2018 Agenda ArcelorMittal introduction U.S. steel industry performance and trade Global steel industry Review of steel markets 1 About
FULL YEAR REPORT, 2017 TELEPHONE/AUDIO CONFERENCE 8 FEBRUARY 2018, AT CET TOMMY ANDERSSON, PRESIDENT AND CEO HELENA WENNERSTRÖM, EVP AND CFO
 TELEPHONE/AUDIO CONFERENCE 8 FEBRUARY 2018, AT 15.30 CET TOMMY ANDERSSON, PRESIDENT AND CEO HELENA WENNERSTRÖM, EVP AND CFO DIRECT LINK AUDIOCAST: HTTPS://TV.STREAMFABRIKEN.COM/BULTEN Q4 2017 TELECONFERENCE:
H & M HENNES & MAURITZ AB NINE-MONTH REPORT
 NINE-MONTH REPORT 2010 H & M HENNES & MAURITZ AB NINE-MONTH REPORT 1 December 2009 31 August 2010 NINE MONTHS The H&M Group s sales excluding VAT during the first nine months of the financial year amounted
Important dates in Uponor Investor Relations
 Annual report 2016 Important dates in 2017 Annual General Meeting Uponor Corporation s Annual General Meeting will be held on Monday, 20 March 2017 at 15.00 EET at the Helsinki Exhibition and Convention
ENIRO Q3 REPORT Johan Lindgren, CEO Mattias Lundqvist, CFO Cecilia Lannebo, Head of IR
 ENIRO Q3 REPORT 2012-10-25 Johan Lindgren, CEO Mattias Lundqvist, CFO Cecilia Lannebo, Head of IR CEO INTRODUCTION & SUMMARY A digital media company with 74 percent of revenues being digital the transformation
Eurozone Economic Watch. February 2018
 Eurozone Economic Watch February 2018 Eurozone: Strong growth continues in 1Q18, but confidence seems to peak GDP growth moderated slightly in, but there was an upward revision to previous quarters. Available
Financial Statements Release January December 2018
 Financial Statements Release January December 2018 Disclaimer In this presentation, all forward-looking statements in relation to the company or its business are based on the management judgment, and macroeconomic
Eurozone Economic Watch. July 2018
 Eurozone Economic Watch July 2018 Eurozone: A shift to more moderate growth with increased downward risks BBVA Research - Eurozone Economic Watch July 2018 / 2 Hard data improved in May but failed to recover
FINANCIAL STATEMENTS 1 Jan-31 Dec 2016 Uponor Corporation
 FINANCIAL STATEMENTS 1 Jan-31 Dec 2016 Uponor Corporation CONTENTS Review by the Board of Directors 3 Group key figures 14 Share-specific key figures 15 Definitions of key ratios 16 Consolidated statement
H & M HENNES & MAURITZ AB NINE-MONTH REPORT
 H & M HENNES & MAURITZ AB NINE-MONTH REPORT 1 December 2012 31 August 2013 NINE-MONTHS The H&M Group s sales including VAT increased in local currencies by 8 percent in the first nine months of the financial
Interim Report for Duni AB (publ) 1 January 30 June 2009
 1 January 30 June 2009") Interim Report for Duni AB (publ) 1 January 30 2009 (compared with the same period of the previous year) 29 July 2009 Strong cash flow and stable profitability 1 January 30 2009 Net sales increased by
Interim Report for Duni AB (publ) 1 January 30 2009 (compared with the same period of the previous year) 29 July 2009 Strong cash flow and stable profitability 1 January 30 2009 Net sales increased by
Orders received increased to EUR 3.1 billion and Comparable EBITA to EUR 196 million in 2016
 Orders received increased to EUR 3.1 billion and Comparable EBITA to EUR 196 million in 216 Financial Statements Review 216 February 8, 217 Pasi Laine, President and CEO Kari Saarinen, CFO Agenda Financial
Eurozone Economic Watch. March 2018
 Eurozone Economic Watch March 20 Eurozone Economic Watch March 20 Eurozone: The moderation of confidence continues We expect GDP growth to remain steady early this year supported mostly by strong global
Func Food Group Financial Release / Q2 2017
 Func Food Group Financial Release / Q2 2017 Func Food Group Financial Release / Q2 2017 Func Food Group / Q2 2017 3 FUNC FOOD GROUP IN BRIEF Func Food Group ( FFG ) is a Nordic wellness company, which
The real change in private inventories added 0.22 percentage points to the second quarter GDP growth, after subtracting 0.65% in the first quarter.
 QIRGRETA Monthly Macroeconomic Commentary United States The U.S. economy bounced back in the second quarter of 2007, growing at the fastest pace in more than a year. According the final estimates released
Economic Outlook. Global And Finnish. Technology Industries In Finland Economic uncertainty has not had a major impact yet p. 5.
 Economic Outlook Technology Industries of 1 219 Global And Finnish Economic Outlook Uncertainty dims growth outlook p. 3 Technology Industries In Economic uncertainty has not had a major impact yet p.
Tikkurila's Interim Report for January September 2011 Growth continued and profitability improved clearly during the third quarter
 Interim Report Q3 January-September 2011 1 (28) Tikkurila Oyj Interim Report October 27, 2011 at 9:00 a.m. (CET+1) Tikkurila's Interim Report for January September 2011 Growth continued and profitability
The real change in private inventories added 0.15 percentage points to the second quarter GDP growth, after subtracting 0.65% in the first quarter.
 QIRGRETA Monthly Macroeconomic Commentary United States The U.S. economy rebounded in the second quarter of 2007, growing at an annual rate of 3.4% Q/Q (+1.8% Y/Y), according to the GDP advance estimates
BE Group Year-end report 2006
 BE Group Year-end report 2006 Håkan Jeppsson, CEO Torbjörn Clementz, CFO BE Group in Brief A leading supplier independent steel service company. Broad range of steel, stainless steel and aluminium products.
ANNOUNCEMENT OF PRELIMINARY RESULTS
 The leading high service distributor to engineers worldwide ANNOUNCEMENT OF PRELIMINARY RESULTS YEAR ENDED 31 MARCH 2009 29 May 2009 Agenda Overview and current trading Ian Mason Financial performance
STOCK EXCHANGE RELEASE 1(12) April 27, 2010 at 9.00 a.m.
 April 27, 2010 at 9.00 a.m.") STOCK EXCHANGE RELEASE 1(12) INTERIM REPORT FOR JANUARY TO MARCH 2010: RECORD NET SALES WITH STRONG PROFITABILITY AND CASH FLOW Net sales for the first quarter increased 9% and reached a record level at
STOCK EXCHANGE RELEASE 1(12) INTERIM REPORT FOR JANUARY TO MARCH 2010: RECORD NET SALES WITH STRONG PROFITABILITY AND CASH FLOW Net sales for the first quarter increased 9% and reached a record level at
Chart pack to council for cooperation on macroprudential policy
 Chart pack to council for cooperation on macroprudential policy Contents List of charts... 3 Macro and macro-financial setting... 5 Swedish macroeconomic setting... 5 Foreign macroeconomic setting... Macro-financial
Makes it easier to be professional
 Makes it easier to be professional Handelsbanken Nordic Mid/small Cap Seminar June 8, 2017 President and CEO Johan Nilsson 2 2 Introduction One-Stop-Shop multi channel offering for professionals Branches
Q1 Q Q3 Q EUR million Jan-Mar 2018 Jan-Mar 2017 Change, % EUR million Jan-Dec 2017
 Stockholm, Sweden, 4 May Eltel Group Interim report January March January March Group net sales decreased 10.5% to EUR 266.6 million (297.8), mainly as a result of divestments and on-going discontinuation
First estimate for 2011 Euro area external trade deficit 7.7 bn euro bn euro deficit for EU27
 27/2012-15 February 2012 First estimate for 2011 Euro area external trade deficit 7.7 152.8 deficit for EU27 The first estimate for the euro area 1 (EA17) trade in goods balance with the rest of the world
Zenith Monthly Economic Report October 2011
 Zenith Monthly Economic Report October 211 ECONOMIC STATISTICS SUMMARY Cash Rate Inflation Rate (%) Unemployment Rate (%) GDP Annual Growth (%) Country Latest Last Change Latest Change Latest Change Past
March 2005 Euro-zone external trade surplus 4.2 bn euro 6.5 bn euro deficit for EU25
 STAT/05/67 24 May 2005 March 2005 Euro-zone external trade surplus 4.2 6.5 deficit for EU25 The first estimate for euro-zone 1 trade with the rest of the world in March 2005 was a 4.2 billion euro surplus,
Outlook 2015: Europe & Germany
 Part of the M&G Group Outlook 215: Europe & Germany Research presentation 27 th November 214 European Economic Fundamentals Update & Outlook 2 Economic recovery broadening GDP growth by country Q3 214
P R E S S R E L E A S E
 P R E S S R E L E A S E from ASSA ABLOY AB (publ) 9 August 2002 No. 11/02 INTERIM REPORT FOR THE SECOND QUARTER OF 2002 Sales increased 14% greater focus on organic growth Income before tax increased 26%
P R E S S R E L E A S E
 P R E S S R E L E A S E from ASSA ABLOY AB (publ) 2 November 2004 No. 12/04 ASSA ABLOY: CONTINUED STRONG ORGANIC GROWTH IN THE THIRD QUARTER Sales in the third quarter increased organically by 6% to SEK
Q3 Report October 25, 2017
 Q3 Report 2017 October 25, 2017 CEO s comments A weak operating profit, 49 MSEK (91). Different trends across the business. Organic sales growth: APAC +9% EMEA -5% Americas +/- 0 Overall the sales contracted
SEK 2,013 m. SEK 145 m. Systemair AB (publ) INTERIM REPORT Q1 1 May 31 July First quarter, May July 2018
 INTERIM REPORT Q1 1 May 31 July First quarter, May July 2018") Systemair AB (publ) INTERIM REPORT Q1 1 May 31 July 2018 Net sales Q1 SEK 2,013 m. First quarter, May July 2018 Net sales increased by 9.6 percent to SEK 2,013 million (1,837). Organic growth was 5.4 percent
Systemair AB (publ) INTERIM REPORT Q1 1 May 31 July 2018 Net sales Q1 SEK 2,013 m. First quarter, May July 2018 Net sales increased by 9.6 percent to SEK 2,013 million (1,837). Organic growth was 5.4 percent
INTERIM REPORT FOR THE PERIOD JANUARY JUNE 2012 VIKING LINE S SALES INCREASED SOMEWHAT BUT FUEL EXPENSES LOWERED ITS EARNINGS
 Press release INTERIM REPORT FOR THE PERIOD JANUARY JUNE 2012 VIKING LINE S SALES INCREASED SOMEWHAT BUT FUEL EXPENSES LOWERED ITS EARNINGS Consolidated sales of the Viking Line Group during the period
Banking in a tough environment
 Banking in a tough environment Carnegie Nordic Large Cap Seminar Stockholm Tonny Thierry Andersen CFO & Member of the Executive Board March 3, 2009 The real economy is now severely affected Index Industrial
Func Food Group Financial Release / Q1 2018
 Func Food Group Financial Release / Q1 2018 Func Food Group Financial Release / Q1 2018 Func Food Group / Q1 2018 3 FUNC FOOD GROUP IN BRIEF Func Food Group ( FFG ) is a Nordic wellness company, which
Interim report 1 May January 2014
 Interim report 1 May 2013 31 January 2014 Third quarter 2013/14 Sales increased by 3 % to 2,238 MSEK (2,169). In local currencies, the increase was 7 % Operating profit increased by 34 % to 330 MSEK (247)
RAMIRENT GROUP INTERIM REPORT
 RAMIRENT GROUP Interim report january JUNE 2008 Q2 LIVE AUDIOCAST AND CONFERENCE CALL ON 15 AUGUST, 2008 AT 10:00 AM LOCAL TIME A briefing for investment analysts and the press will be arranged on Friday
Revenue and earnings growth continued JANUARY-SEPTEMBER 2018
 JARI ROSENDAL, PRESIDENT AND CEO PETRI CASTRÉN, CFO OCTOBER 24, 2018 Revenue and earnings growth continued JANUARY-SEPTEMBER 2018 Key financial highlights Q3 2018 Organic growth +9% Growth continued driven
January 2005 Euro-zone external trade deficit 2.2 bn euro 14.0 bn euro deficit for EU25
 42/2005-23 March 2005 January 2005 Euro-zone external trade deficit 2.2 14.0 deficit for EU25 The first estimate for euro-zone 1 trade with the rest of the world in January 2005 was a 2.2 billion euro
Interim Report January March 2018
 Interim Report January March 2018 Loomis Interim Report January March 2018 2 January March 2018 Revenue SEK 4,486 million (4,279). Real growth 8 percent (3) and organic growth 3 percent (3). Operating
SIX MONTHS REPORT, JAN JUN 2018
 SIX MONTHS REPORT, JAN JUN 2018 TELEPHONE/AUDIO CONFERENCE 11 JULY 2018, AT 11.00 CET TOMMY ANDERSSON, PRESIDENT AND CEO HELENA WENNERSTRÖM, EVP AND CFO DIRECT LINK AUDIOCAST: HTTPS://TV.STREAMFABRIKEN.COM/BULTEN
Interim report Q3, July September 2017 Stockholm, 25 October 2017
 Interim report Q3, July September Stockholm, 25 October As of the second quarter of, Cloetta Italia S.r.l. is accounted for as discontinued operation. The comparative figures in the consolidated profit
H & M HENNES & MAURITZ AB THREE-MONTH REPORT
 THREE-MONTH REPORT 2010 H & M HENNES & MAURITZ AB THREE-MONTH REPORT 1 December 2009 28 February 2010 THE FIRST QUARTER The H&M Group s sales excluding VAT amounted to SEK 24,846 m (23,299), an increase
Operating earnings (EBIT) were SEK 118 million (95), which corresponds to an operating margin of 5.8% (5.3).
 were SEK 118 million (95), which corresponds to an operating margin of 5.8% (5.3).") JANUARY SEPTEMBER 2015 INTERIM REPORT Growth, improved earnings and strong order bookings third quarter Net sales reached SEK 618 million (593), up 4.1% on the same period last year. Operating earnings
JANUARY SEPTEMBER 2015 INTERIM REPORT Growth, improved earnings and strong order bookings third quarter Net sales reached SEK 618 million (593), up 4.1% on the same period last year. Operating earnings
January 2014 Euro area international trade in goods surplus 0.9 bn euro 13.0 bn euro deficit for EU28
 STAT/14/41 18 March 2014 January 2014 Euro area international trade in goods surplus 0.9 13.0 deficit for EU28 The first estimate for the euro area 1 (EA18) trade in goods balance with the rest of the
SEE macroeconomic outlook Recovery gains traction, fiscal discipline improving. Alen Kovac, Chief Economist EBC May 2016 Ljubljana
 SEE macroeconomic outlook Recovery gains traction, fiscal discipline improving Alen Kovac, Chief Economist EBC May 216 Ljubljana Real economy highlights Recent GDP track record reveals more favorable footprint
First Quarter Report 2011
 Copenhagen, Helsinki, Oslo, Stockholm, 28 April 2011 First Quarter Report 2011 Solid quarter CEO Christian Clausen s comment to the report: I am proud to present another strong quarter. Our relationship
August 2005 Euro-zone external trade deficit 2.6 bn euro 14.2 bn euro deficit for EU25
 STAT/05/132 20 October 2005 August 2005 Euro-zone external trade deficit 2.6 14.2 deficit for EU25 The first estimate for euro-zone 1 trade with the rest of the world in August 2005 was a 2.6 billion euro
Strong Increase in Net Sales and Profit
 1 (16) Ramirent Group s Interim Report January March, 2006 Strong Increase in Net Sales and Profit Net sales increased by 35.4% compared to the first quarter of 2005 and totalled EUR 105.1 (77.6) million
May 2012 Euro area international trade in goods surplus of 6.9 bn euro 3.8 bn euro deficit for EU27
 108/2012-16 July 2012 May 2012 Euro area international trade in goods surplus of 6.9 3.8 deficit for EU27 The first estimate for the euro area 1 (EA17) trade in goods balance with the rest of the world
August 2012 Euro area international trade in goods surplus of 6.6 bn euro 12.6 bn euro deficit for EU27
 146/2012-16 October 2012 August 2012 Euro area international trade in goods surplus of 6.6 12.6 deficit for EU27 The first estimate for the euro area 1 (EA17) trade in goods balance with the rest of the
P R E S S R E L E A S E from ASSA ABLOY AB (publ)
") P R E S S R E L E A S E from ASSA ABLOY AB (publ) August 10, 2000 no. 14/00 INTERIM REPORT JANUARY-JUNE 2000 Sales increased by 24% to SEK 6,079 M (4,920) Income before tax increased by 44% to SEK 610
P R E S S R E L E A S E from ASSA ABLOY AB (publ) August 10, 2000 no. 14/00 INTERIM REPORT JANUARY-JUNE 2000 Sales increased by 24% to SEK 6,079 M (4,920) Income before tax increased by 44% to SEK 610
Interim report Q1/2014. Sakari Tamminen, President & CEO Rautaruukki Corporation 24 April 2014
 Interim report Q1/214 Sakari Tamminen, President & CEO Rautaruukki Corporation 24 April 214 Agenda Q1 in brief, key figures Financial performance Business area performance Near-term outlook and guidance
June 2012 Euro area international trade in goods surplus of 14.9 bn euro 0.4 bn euro surplus for EU27
 121/2012-17 August 2012 June 2012 Euro area international trade in goods surplus of 14.9 0.4 surplus for EU27 The first estimate for the euro area 1 (EA17) trade in goods balance with the rest of the world
A good start to the year
 1 A good start to the year 28 April 2011 No. 17/11 Sales totaled SEK 8,699 M (8,345), representing an increase of 4%, made up of 6% organic growth, 7% acquired growth and exchange-rate effects of 9%. Strong
oras invest Annual Report 2008
 oras invest Annual Report 2008 CONTENTS Oras Invest in brief...1 Message from CEO... 2 Oras Invest Ltd key figures 2008... 4 Strategy and goals... 4 Portfolio companies Oras... 5 Uponor... 6 Kemira...7
CONSTI GROUP PLC INTERIM REPORT 1 JANUARY 30 SEPTEMBER 2018
 CONSTI GROUP PLC INTERIM REPORT 1 JANUARY 30 SEPTEMBER 2018 CEO Esa Korkeela CFO Joni Sorsanen Contents Highlights and Group performance Cash flow and financial position Market outlook, guidance and summary
Lindab International AB (publ) Interim Report
 Interim Report") Lindab Interim Report January-June Lindab International AB (publ) Interim Report Second quarter Net sales increased by 5 percent to SEK 2,118 m (2,016), of which organic growth amounted to 2 percent. Adjusted
Lindab Interim Report January-June Lindab International AB (publ) Interim Report Second quarter Net sales increased by 5 percent to SEK 2,118 m (2,016), of which organic growth amounted to 2 percent. Adjusted
WULFF GROUP PLC S INTERIM REPORT FOR JANUARY 1 SEPTEMBER 30, 2015
 WULFF GROUP PLC INTERIM REPORT November 5, 2015 at 9:00 A.M. WULFF GROUP PLC S INTERIM REPORT FOR JANUARY 1 SEPTEMBER 30, 2015 Operating result without non-recurring items increased in January-September
H & M HENNES & MAURITZ AB SIX-MONTH REPORT
 SIX-MONTH REPORT 2010 H & M HENNES & MAURITZ AB SIX-MONTH REPORT 1 December 2009 31 May 2010 THE FIRST HALF-YEAR The H&M Group s sales excluding VAT during the first six months of the financial year amounted
Beijer Ref AB Q4-2017
 Q4-2017 1 Q4-2017 Strongest-ever fourth quarter. Net sales for the fourth quarter of 2017 increased by 9 per cent compared with the corresponding period in the previous year and amounted to SEK 2,401M
Financial Results 2018 Johan Torgeby, President & CEO. Telephone conference 30 January 2019
 Financial Results 2018 Johan Torgeby, President & CEO Telephone conference 30 January 2019 jan-17 apr-17 jul-17 okt-17 jan-18 apr-18 jul-18 okt-18 jan-17 apr-17 jul-17 okt-17 jan-18 apr-18 jul-18 okt-18
Electrocomponents 2017 half-year financial results. 18 November 2016
 Electrocomponents 2017 half-year financial results 18 November 2016 Agenda Overview of results Lindsley Ruth Financial results and performance update David Egan Performance Improvement Plan Lindsley Ruth
Order intake increased by 31 per cent to 78,3 (59,6) MEUR. Adjusted for acquisition and
 MEUR. Adjusted for acquisition and") Interim report Q2 2017 January - June Troax Group AB (publ) Hillerstorp 16th August, 2017 INTERIM REPORT 2017 APRIL JUNE 2017 Order intake increased by 30 per cent to 39,8 (30,5) MEUR. Adjusted for acquisition
Interim report Q2 2017 January - June Troax Group AB (publ) Hillerstorp 16th August, 2017 INTERIM REPORT 2017 APRIL JUNE 2017 Order intake increased by 30 per cent to 39,8 (30,5) MEUR. Adjusted for acquisition
Ramirent US Roadshow September, 2008
 Ramirent US Roadshow 2008 11-12 September, 2008 Kari Kallio, President and CEO Heli Iisakka, CFO Franciska Janzon, IR 1 11-12 Sept, 2008 US Roadshow 2008 2008 Ramirent Ramirent in Brief Leading equipment
Text. improvement in earnings. Textdemand drove continued
 Good Textdemand drove continued improvement in earnings Text Presentation of the Q2/2018 results Martin Lindqvist, President & CEO Håkan Folin, CFO July 20, 2018 Agenda Market and demand trends Performance
NBIM Quarterly Performance Report Second quarter 2007
 NBIM Quarterly Performance Report Second quarter 2007 Government Pension Fund Global Norges Bank s foreign exchange reserves Investment portfolio Buffer portfolio Government Petroleum Insurance Fund Norges