Industry: CABLE TV August 7, 2013 Recommendation: BUY. Company Overview
|
|
|
- Victor Cole
- 5 years ago
- Views:
Transcription
 $50,590 EBITDA ($M) $7,480 EV/EBITDA 6.8x Forward P/E 10.6x Debt Management Long Term Debt/Equity N/A Total Debt/T12M EBITDA 2.4 Net Debt/EBIT 3.")
1 Price Target $74.09 Price (08/07/2013) $ WK ($) Market Cap ($M) $34,000 Outstanding Shares 556 Insider % 7.0 Revenue $30,750 Valuation TEV ($M) $50,590 EBITDA ($M) $7,480 EV/EBITDA 6.8x Forward P/E 10.6x Debt Management Long Term Debt/Equity N/A Total Debt/T12M EBITDA 2.4 Net Debt/EBIT 3.1 Total Debt/Capital Profitability Return on Equity (ttm) N/A Return on Assets (ttm) 15.8% Return on Invested Capital 23.8% Du Pont Analysis Asset Turnover 1.5 Tax Burden 0.7 Interest Burden 0.9 Leverage Ratio -5.0 Liquidity Indicators Cash Ratio 0.3 Current Ratio 1.0 Quick Ratio 0.8 CFO/Avg. Current Liab 1.1 CFO/Capex 1.7 Margins TEV Margin (mrq) 164.5% Gross Margin 47.4% Operating Margin 15.7% EBITDA Margin 24.3% Profit Margin 8.6% Growth - 5 year (%) Revenue 11.5 EBITDA 12.8 Net Income to DIRECTV 15.2 Earnings Per Share 30.5 Free Cash Flow 18.8 Company Overview The DIRECTV Group, Inc. is the world's leading provider of digital television entertainment services. It markets satellite-based Pay-TV services through two geographic business segments. Through its subsidiaries and affiliated companies in the United States, Brazil, Mexico and other countries in Latin America, DIRECTV provides digital television service to million customers in the United States and million customers in Latin America. DIRECTV reported revenues of $7.7 billion in the second quarter of DIRECTV is composed of two main operating units - DIRECTV U.S., and Latin America, as well as DIRECTV Regional Sports Networks. DIRECTV U.S. is the largest direct-to-home (DTH) provider and the second largest Pay TV provider in the United States. As of March 31, 2013, DIRECTV U.S. had average monthly revenue per subscriber (ARPU) of $ DIRECTV Latin America is a leading provider of DTH in Latin America. The business segment consists of PanAmericana, which provides services in Venezuela, Argentina, Chile, Colombia, Puerto Rico and certain other countries. It has a 93% owned subsidiary in Sky Brazil and a 41% stake (equity method investment) in Sky Mexico. Investment Thesis We issue a Buy recommendation on DIRECTV with a price target of $ The target price represents approximately 6.8x the 2014E EBITDA and is an 1
2 average of the discounted cash flow and residual income analyses. While there are concerns in the medium-term regarding the U.S. pay TV industry, the company s solid free cash flow generation in the U.S. business, the scope of growth in Latin American business and the management s willingness to repurchase company shares leads us to a positive outlook. Integration of recent Results Revenue growth in the 3Q13 and 4Q13 estimated to 6.2% and 5.9% y-o-y. This shows the beginning of the trend in a possible consolidation of the cable TV industry. EPS increases to $5.04 from $4.58 (base case) and picks up slowly as the company tries to cope with its current challenges in Brazil and the volatile FX rates. Industry trends and competitive landscape The U.S. Pay TV industry consists of many regional and national providers that deploy various forms of technology. As of 2012, the top 5 providers, by subscriber count, accounted for approximately 63.5% of all Pay TV subscribers in the U.S. Exhibit 1: Top 5 Pay TV providers in the U.S Subscribers Comcast 21,995 DIRECTV 20,084 DISH 14,056 Time Warner Cable 12,218 Verizon FiOS 4,726 Total Pay TV 73,079 U.S. Households Pay TV penetration (Subscribers in 000s) Source: Company filings 115, % The industry as a whole has undergone significant change in recent years and can be characterized by primarily by declining growth rates and markets share shifts among competitors. Since 2007, the U.S. pay industry had been terribly affected by the macroeconomic factors. The collapse of the subprime market coupled with depressed employment rates and weakened housing markets stunted the growth of the industry. In addition, the number of subscribers being added is growing at a decreasing rate. In 2012, the U.S. pay TV industry added only 91,000 subscribers (versus 332,000+ in 2011), ending the year with approx million subscribers. ) 2
3 Exhibit 2: U.S. Pay TV market Net Subscriber Additions 1 Risks - The U.S. Pay TV industry growth could be negatively affected by the emergence of a more disruptive technology/business plan. - A merger between AT&T and DISH could cost DIRECTV one of its largest reselling partners. - Competition, economic and political instability in Latin America could negatively affect growth prospects. - Increase in volatility in the FX rates. Competitive Analysis Standing as one of the industry leaders, DTV managed to beat the industry average in sales growth than its competitors with a corresponding high EBITDA growth rate. This can highlight management s ability to reduce costs. ROIC and ROA are the best in the industry. Name Mkt Cap (USD) Sales Growth (%) EBITDA Growth (%) EBITDA Margin Capex/Sales (%) ROIC ROA ROE Average $35, (0.4) (13.1) DIRECTV 33, N.A. COMCAST CORP 118, CABLEVISION SYSTEMS 5,237.5 (0.1) (24.7) N.A. 3.2 N.A. DISH NETWORK CORP 20,560.0 (1.2) (17.5) N.A. TIME WARNER CABLE 33, CHARTER COMMUNICATION 13, N.A. (1.6) (110.8) Source: Bloomberg 1 Company filings 3
4 DIRECTV has a low EBITDA multiple and a low P/E ratio which makes it an appealing investment. In addition, DTV has one of the lowest Enterprise Value per subscribers. Name EV EV/TTM EBITDA P/E P/FCF EV /Subscriber Average $51, x 24.7x 28.8x $4,658.9 DIRECTV 50, x 12.4x 17.2x 2,532.8 COMCAST CORP 161, x 21.3x 16.7x 7,421.6 CABLEVISION SYSTEMS 14, x N.A. 8.9x 5,068.4 DISH NETWORK CORP 25, x 21.2x 27.6x 1,791.7 TIME WARNER CABLE 56, x 20.1x 15.3x 4,757.2 CHARTER COMMUNICATION 26, x N.A. 92.1x 6,381.8 Source: Bloomberg Looking at the past performance of DTV with its competitors, DTV has performed fairly well except for the last year. Name 1 Yr Total Return (%) 5 Yr Annualized Total Return (%) Rev - 1 Yr Gr:Y EPS - 1 Yr Gr:Y Average DIRECTV COMCAST CORP CABLEVISION SYSTEMS (84.9) DISH NETWORK CORP (58.5) TIME WARNER CABLE CHARTER COMMUNICATION 67.7 N.A Source: Bloomberg 4
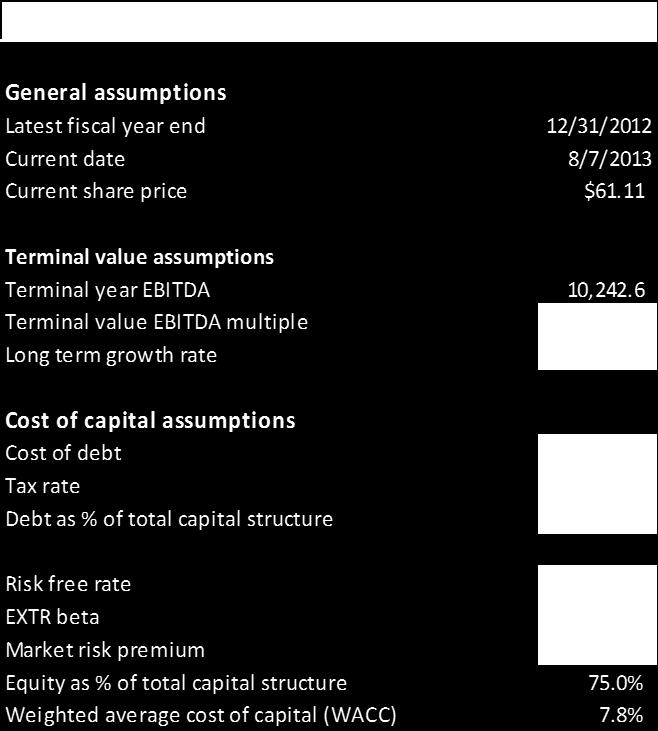
5 Valuation Using the management s guidance, the base case is created with the below mentioned projections. The best and weak cases are projected with a 5% change in revenue growth with a consequent 2% change in the COGS margin and Operating expenses margin. The tax rate is kept at a constant of 34% from Guidance is used where ever possible and straight lined when no information is available. In addition, for the supporting schedules of various balance sheet items, the assumptions are mentioned below. ASSUMPTIONS SHEET DIRECTV Base case Current case: Base case Operating assumptions 2013E 2014E 2015E 2016E 2017E Revenue growth 6.5% 6.4% 6.3% 6.3% 6.3% COGS margin 52.6% 53.7% 53.7% 53.7% 53.7% Operating expenses margin 31.7% 30.2% 30.2% 30.2% 30.2% Tax rate 36.2% 34.0% 34.0% 34.0% 34.0% Working capital assumptions AR as % of sales 8.4% 8.2% 8.2% 8.2% 8.2% Inventory as % of COGS 2.0% 2.0% 2.0% 2.0% 2.0% AP as % of COGS 8.0% 7.8% 7.8% 7.8% 7.8% Fixed asset assumptions Capital expenditures as % of revenue 5.7% 6.0% 6.0% 6.0% 6.0% Depreciation / Capital expenditures ratio 151.1% 153.4% 153.4% 153.4% 153.4% Capital structure assumptions Dividend payout ratio 0.0% 0.0% 0.0% 0.0% 0.0% Minimum cash desired 2, , , , ,000.0 Debt assumptions Interest rate 5.0% 5.0% 5.0% 5.0% 5.0% Cash assumptions Interest rate 1.0% 1.0% 1.0% 1.0% 1.0% 5
6 Best case Operating assumptions 2013E 2014E 2015E 2016E 2017E Revenue growth 11.5% 11.4% 11.3% 11.3% 11.3% COGS margin 48.6% 49.7% 49.7% 49.7% 49.7% Operating expenses margin 29.7% 28.2% 28.2% 28.2% 28.2% Tax rate 36.2% 34.0% 34.0% 34.0% 34.0% Working capital assumptions AR as % of sales 8.4% 8.2% 8.2% 8.2% 8.2% Inventory as % of COGS 2.0% 2.0% 2.0% 2.0% 2.0% AP as % of COGS 8.0% 7.8% 7.8% 7.8% 7.8% Fixed asset assumptions Capital expenditures as % of revenue 5.7% 6.0% 6.0% 6.0% 6.0% Depreciation / Capital expenditures ratio 151.1% 153.4% 153.4% 153.4% 153.4% Capital structure assumptions Dividend payout ratio 0.0% 0.0% 0.0% 0.0% 0.0% Minimum cash desired 2, , , , ,000.0 Debt assumptions Interest rate 5.0% 5.0% 5.0% 5.0% 5.0% Cash assumptions Interest rate 1.0% 1.0% 1.0% 1.0% 1.0% 6
7 Weak case Operating assumptions 2013E 2014E 2015E 2016E 2017E Revenue growth 4.5% 4.4% 4.3% 4.3% 4.3% COGS margin 54.6% 55.7% 55.7% 55.7% 55.7% Operating expenses margin 33.7% 32.2% 32.2% 32.2% 32.2% Tax rate 36.2% 34.0% 34.0% 34.0% 34.0% Working capital assumptions AR as % of sales 8.4% 8.2% 8.2% 8.2% 8.2% Inventory as % of COGS 2.0% 2.0% 2.0% 2.0% 2.0% AP as % of COGS 8.0% 7.8% 7.8% 7.8% 7.8% Fixed asset assumptions Capital expenditures as % of revenue 5.7% 6.0% 6.0% 6.0% 6.0% Depreciation / Capital expenditures ratio 151.1% 153.4% 153.4% 153.4% 153.4% Capital structure assumptions Dividend payout ratio 0.0% 0.0% 0.0% 0.0% 0.0% Minimum cash desired 2, , , , ,000.0 Debt assumptions Interest rate 5.0% 5.0% 5.0% 5.0% 5.0% Cash assumptions Interest rate 1.0% 1.0% 1.0% 1.0% 1.0% 7
8 FINANCIAL STATEMENT MODEL DIRECTV Base case Quarterly Financial Data Income Statement (Year end: Dec 31) Mar Jun Sep Dec Mar Jun Sep Dec Mar Jun Sep Dec ($ in millions except EPS) 1Q11A 2Q11A 3Q11A 4Q11A 1Q12A 2Q12A 3Q12A 4Q12A 1Q13A 2Q13A 3Q13E 4Q13E Revenues $6,319.0 $6,600.0 $6,844.0 $7,463.0 $7,046.0 $7,224.0 $7,416.0 $8,054.0 $7,580.0 $7,700.0 $7,873.5 $8,526.1 Cost of Revenues (3,136.0) (3,255.0) (3,525.0) (4,039.0) (3,567.0) (3,627.0) (3,957.0) (4,428.0) (3,843.0) (3,926.0) (4,207.0) (4,732.0) Gross Profit $3,183.0 $3,345.0 $3,319.0 $3,424.0 $3,479.0 $3,597.0 $3,459.0 $3,626.0 $3,737.0 $3,774.0 $3,666.4 $3,794.1 Operating Expenses (2,028.0) (2,115.0) (2,289.0) (2,210.0) (2,171.0) (2,186.0) (2,391.0) (2,328.0) (2,329.0) (2,424.0) (2,589.6) (2,541.1) Operating Income (EBIT) $1,155.0 $1,230.0 $1,030.0 $1,214.0 $1,308.0 $1,411.0 $1,068.0 $1,298.0 $1,408.0 $1,350.0 $1,076.9 $1,253.0 Interest (Expense) ($172.0) ($203.0) ($194.0) ($194.0) ($204.0) ($214.0) ($204.0) ($220.0) ($217.0) ($219.0) ($219.0) ($219.0) Net Non-Operating (Losses) (29.0) (56.0) (106.0) (56.0) (56.0) (56.0) Pretax Income $1,032.0 $1,106.0 $807.0 $1,039.0 $1,157.0 $1,141.0 $920.0 $1,224.0 $1,085.0 $1,075.0 $898.0 $1,075.3 Income Tax (Expense) (349.0) (397.0) (286.0) (316.0) (416.0) (425.0) (348.0) (276.0) (387.0) (414.0) (336.6) (396.8) Tax rate 33.8% 35.9% 35.4% 30.4% 36.0% 37.2% 37.8% 22.5% 35.7% 38.5% 37.5% 36.9% Net Income $683.0 $709.0 $521.0 $723.0 $741.0 $716.0 $572.0 $948.0 $698.0 $661.0 $561.4 $678.5 Minority Interests (9.0) (8.0) (5.0) (5.0) (10.0) (5.0) (7.0) (6.0) (8.0) (1.0) (1.0) (1.0) Net Income to DIRECTV $674.0 $701.0 $516.0 $718.0 $731.0 $711.0 $565.0 $942.0 $690.0 $660.0 $552.3 $671.9 Depr. and amort. expense ($603.0) (606.0) (545.0) (556.0) (583.0) (570.0) (604.0) (605.0) (665.0) (718.0) (718.5) (741.8) EBITDA $1,758.0 $1,836.0 $1,575.0 $1,770.0 $1,891.0 $1,981.0 $1,672.0 $1,903.0 $2,073.0 $2,068.0 $1,795.4 $1,994.8 Wt. Avg. Comm. Shr Diluted Diluted EPS $0.85 $0.91 $0.70 $1.02 $1.07 $1.09 $0.90 $1.55 $1.20 $1.18 $1.02 $1.25 Revenue Growth 11.5% 9.5% 8.4% 7.9% 7.6% 6.6% 6.2% 5.9% COGS Margin 49.6% 49.3% 51.5% 54.1% 50.6% 50.2% 53.4% 55.0% 50.7% 51.0% 53.4% 55.5% Operating Expenses Margin 32.1% 32.0% 33.4% 29.6% 30.8% 30.3% 32.2% 28.9% 30.7% 31.5% 32.9% 29.8% Quaterly Commonsize Income Statement Revenues 100.0% 100.0% 100.0% 100.0% 100.0% 100.0% 100.0% 100.0% 100.0% 100.0% 100.0% 100.0% Cost of Revenues 49.6% 49.3% 51.5% 54.1% 50.6% 50.2% 53.4% 55.0% 50.7% 51.0% 53.4% 55.5% Gross Profit 50.4% 50.7% 48.5% 45.9% 49.4% 49.8% 46.6% 45.0% 49.3% 49.0% 46.6% 44.5% Operating Expenses 32.1% 32.0% 33.4% 29.6% 30.8% 30.3% 32.2% 28.9% 30.7% 31.5% 32.9% 29.8% Operating Income (EBIT) 18.3% 18.6% 15.0% 16.3% 18.6% 19.5% 14.4% 16.1% 18.6% 17.5% 13.7% 14.7% Interest (Expense) 2.7% 3.1% 2.8% 2.6% 2.9% 3.0% 2.8% 2.7% 2.9% 2.8% 2.8% 2.6% Net Non-Operating (Losses) 0.8% 1.2% -0.4% 0.3% 0.8% -0.8% 0.8% 1.8% -1.4% -0.7% -0.7% -0.7% Pretax Income 16.3% 16.8% 11.8% 13.9% 16.4% 15.8% 12.4% 15.2% 14.3% 14.0% 11.4% 12.6% Income Tax (Expense) 5.5% -6.0% 4.2% 4.2% 5.9% 5.9% 4.7% 3.4% 5.1% 5.4% 4.3% 4.7% Net Income 10.8% 10.7% 7.6% 9.7% 10.5% 9.9% 7.7% 11.8% 9.2% 8.6% 7.1% 8.0% Minority Interests 0.1% 0.1% 0.1% 0.1% 0.1% 0.1% 0.1% 0.1% 0.1% 0.0% 0.0% 0.0% Net Income to DIRECTV 10.7% 10.6% 7.5% 9.6% 10.4% 9.8% 7.6% 11.7% 9.1% 8.6% 7.0% 7.9% Depreciation and amortizatio 9.5% 9.2% 8.0% 7.5% 8.3% 7.9% 8.1% 7.5% 8.8% 9.3% 9.1% 8.7% EBITDA 27.8% 27.8% 23.0% 23.7% 26.8% 27.4% 22.5% 23.6% 27.3% 26.9% 22.8% 23.4% 8
9 Annual Financial Data Income Statement $mm Actuals Projected 2010A 2011A 2012A 2013E 2014E 2015E 2016E 2017E Revenues $24,102.0 $27,226.0 $29,740.0 $31,673.1 $33,700.2 $35,823.3 $38,080.2 $40,479.2 Cost of goods sold (COGS) (12,105.0) (13,955.0) (15,579.0) (16,660.1) (18,097.0) (19,237.1) (20,449.0) (21,737.3) Gross profit $11,997.0 $13,271.0 $14,161.0 $15,013.0 $15,603.2 $16,586.2 $17,631.1 $18,741.9 Operating expenses (8,101.0) (8,642.0) (9,076.0) (10,040.4) (10,177.5) (10,818.6) (11,500.2) (12,224.7) Operating profit (EBIT) $3,896.0 $4,629.0 $5,085.0 $4,972.7 $5,425.7 $5,767.5 $6,130.9 $6,517.2 Interest expense (557.0) (763.0) (842.0) (879.0) (935.0) (935.0) (935.0) (935.0) Other (expense) / income, net Pretax profit $3,514.0 $3,984.0 $4,442.0 $4,292.7 $4,689.7 $5,031.5 $5,394.9 $5,781.2 (Taxes) / Tax benefits (1,202.0) (1,348.0) (1,465.0) (1,553.9) (1,594.5) (1,710.7) (1,834.3) (1,965.6) Tax rate 34.2% 33.8% 33.0% 36.2% 34.0% 34.0% 34.0% 34.0% Net income $2,312.0 $2,636.0 $2,977.0 $2,738.7 $3,095.2 $3,320.8 $3,560.6 $3,815.6 Minority Interests (114.0) (27.0) (28.0) ($28.0) ($28.0) ($28.0) ($28.0) ($28.0) Net Income to DIRECTV $2,198.0 $2,609.0 $2,949.0 $2,710.7 $3,067.2 $3,292.8 $3,532.6 $3,787.6 Depre and amort expense (2,446.0) (2,310.0) (2,362.0) (2,728.2) (3,101.6) (3,297.0) (3,504.7) (3,725.5) EBITDA $6,342.0 $6,939.0 $7,447.0 $7,700.9 $8,527.3 $9,064.5 $9,635.6 $10,242.6 Diluted Wt. avg shares Diluted earnings per share $2.48 $3.47 $4.58 $5.04 $6.46 $6.93 $7.44 $7.97 Revenue growth 13.0% 9.2% 6.5% 6.4% 6.3% 6.3% 6.3% COGS margin 50.2% 51.3% 52.4% 52.6% 53.7% 53.7% 53.7% 53.7% Operating expenses margin 33.6% 31.7% 30.5% 31.7% 30.2% 30.2% 30.2% 30.2% Tax rate 34.2% 33.8% 33.0% 36.2% 34.0% 34.0% 34.0% 34.0% 9
 16.2% 17.0% 17.1% 15.7% 16.1% 16.1% 16.1% 16.1% Interest expense -2.")
10 Annual Commonsize Income Statement Revenues 100.0% 100.0% 100.0% 100.0% 100.0% 100.0% 100.0% 100.0% Cost of goods sold (COGS) -50.2% -51.3% -52.4% -52.6% -53.7% -53.7% -53.7% -53.7% Gross profit 49.8% 48.7% 47.6% 47.4% 46.3% 46.3% 46.3% 46.3% Operating expenses -33.6% -31.7% -30.5% -31.7% -30.2% -30.2% -30.2% -30.2% Operating profit (EBIT) 16.2% 17.0% 17.1% 15.7% 16.1% 16.1% 16.1% 16.1% Interest expense -2.3% -2.8% -2.8% -2.8% -2.8% -2.6% -2.5% -2.3% Other (expense) / income, net 0.7% 0.4% 0.7% 0.6% 0.6% 0.6% 0.5% 0.5% Pretax profit 14.6% 14.6% 14.9% 13.6% 13.9% 14.0% 14.2% 14.3% (Taxes) / Tax benefits -5.0% -5.0% -4.9% -4.9% -4.7% -4.8% -4.8% -4.9% Net income 9.6% 9.7% 10.0% 8.6% 9.2% 9.3% 9.4% 9.4% Minority Interests -0.5% -0.1% -0.1% -0.1% -0.1% -0.1% -0.1% -0.1% Net Income to DIRECTV 9.1% 9.6% 9.9% 8.6% 9.1% 9.2% 9.3% 9.4% Depre and amort expense -10.1% -8.5% -7.9% -8.6% -9.2% -9.2% -9.2% -9.2% EBITDA 26.3% 25.5% 25.0% 24.3% 25.3% 25.3% 25.3% 25.3% The graph below tracks the price movement along with the components of the income statement. It can be noted that as the price kept increasing, the SG&A remained more or less constant even as the revenues kept appreciating. A simultaneous increase in the operating income (lower portion) can be seen. Source: Bloomberg 10
11 Annual Balance Sheet Data Balance Sheet $mm Actuals Projected 2010A 2011A 2012A 2013E 2014E 2015E 2016E 2017E Cash & cash equivalents $1,502.0 $873.0 $1,902.0 $5,253.6 $9,347.5 $13,679.9 $18,317.7 $23,279.9 Accounts receivable 2, , , , , , , ,319.3 Inventory Other current assets PPE 6, , , , , , , ,728.5 Other assets 6, , , , , , , ,606.0 Total assets $17,909.0 $18,423.0 $20,555.0 $22,869.5 $26,015.5 $29,397.3 $33,024.4 $36,912.5 Accounts payable $951.0 $1,195.0 $1,208.0 $1,332.8 $1,411.6 $1,500.5 $1,595.0 $1,695.5 Other current liabilities 3, , , , , , , ,333.0 Long term liabilities 13, , , , , , , ,045.0 Revolver Total liabilities $17,879.0 $21,265.0 $25,586.0 $25,710.8 $25,789.6 $25,878.5 $25,973.0 $26,073.5 Common stock / additional paid $5,563.0 $4,799.0 $4,021.0 $3,500.0 $3,500.0 $3,500.0 $3,500.0 $3,500.0 Convertible preferred stock Retained earnings / accumulated (5,757.0) (7,906.0) (9,452.0) (6,741.3) (3,674.1) (381.2) 3, ,939.0 Other equity-related Total equity $30.0 ($2,842.0) ($5,031.0) ($2,841.3) $225.9 $3,518.8 $7,051.4 $10,839.0 Balance check
12 Cash Flow Statement Annual Cash Flow Statement Actuals Projected 2010A 2011A 2012A 2013E 2014E 2015E 2016E 2017E Net income $2,710.7 $3,067.2 $3,292.8 $3,532.6 $3,787.6 Depreciation 2, , , , ,725.5 Accounts receivable 35.5 (102.9) (174.1) (185.1) (196.7) Inventory 78.8 (28.7) (22.8) (24.2) (25.8) Other current assets Other assets Accounts payable Other current liabilities Long-term liabilities Cash from operations activities $5,678.0 $6,115.9 $6,481.8 $6,922.5 $7,391.0 Capital expenditures (1,805.4) (2,022.0) (2,149.4) (2,284.8) (2,428.8) Cash from investing activities ($1,805.4) ($2,022.0) ($2,149.4) ($2,284.8) ($2,428.8) Dividends Revolver Common Stock / additional paid in capital (521.0) Convertible preferred stock Other equity-related Cash from financing activities ($521.0) $0.0 $0.0 $0.0 $0.0 Net change in cash during period $3,351.6 $4,093.9 $4,332.4 $4,637.7 $4,
13 Supporting Schedules Actuals Projected 2010A 2011A 2012A 2013E 2014E 2015E 2016E 2017E Accounts receivable roll-forward Accounts receivable, beginning of period (BOP) balance $2,696.0 $2,610.6 $2,660.6 $2,775.0 $2, /- additions (85.4) Accounts receivable, end of period (EOP) $2,001.0 $2,474.0 $2,696.0 $2,610.6 $2,660.6 $2,775.0 $2,894.3 $3,018.7 AR as % of sales 8.3% 9.1% 9.1% 8.4% 8.2% 8.2% 8.2% 8.2% Inventory roll-forward Inventory, beginning of period (BOP) balance $412.0 $339.4 $361.4 $377.0 $ /- additions (72.6) Inventory, end of period (EOP) balance $247.0 $280.0 $412.0 $339.4 $361.4 $377.0 $393.2 $410.1 Inventory as % of COGS 2.0% 2.0% 2.6% 2.0% 2.0% 2.0% 2.0% 2.0% Accounts payable roll-forward Accounts payable, beginning of period (BOP) balance $1,208.0 $1,357.5 $1,409.6 $1,470.3 $1, /- additions Accounts payable, end of period (EOP) b $951.0 $1,195.0 $1,208.0 $1,357.5 $1,409.6 $1,470.3 $1,533.5 $1,599.4 AP as % of COGS 7.9% 8.6% 7.8% 8.0% 7.8% 7.8% 7.8% 7.8% PP&E roll-forward PP&E, beginning of period (BOP) balance $8,395.0 $7,489.5 $6,450.2 $5,366.1 $4, Capital expenditures 1, , , , , Depreciation (2,676.9) (2,986.1) (3,114.5) (3,248.4) (3,388.1) PP&E, end of period (EOP) balance $6,679.0 $7,438.0 $8,395.0 $7,489.5 $6,450.2 $5,366.1 $4,235.4 $3,056.1 Capital expenditures as % of revenue 5.7% 6.0% 6.0% 6.0% 6.0% Depreciation / Capital expenditures ratio 151.1% 153.4% 153.4% 153.4% 153.4% Retained earnings roll-forward Retained earnings, beginning of period (BOP) balance ($9,452.0) ($7,594.0) ($5,516.6) ($3,327.8) ($1,022.9) + Net income 1, , , , , Dividends Retained earnings, end of period (EOP) b($5,757.0) ($7,906.0) ($9,452.0) ($7,594.0) ($5,516.6) ($3,327.8) ($1,022.9) $1,403.3 Dividend payout ratio 0.0% 0.0% 0.0% 0.0% 0.0% 13
14 Revolver roll-forward Revolver, beginning of period (BOP) balance $0.0 $0.0 $0.0 $0.0 $0.0 +/- additions Revolver, end of period (EOP) balance $0.0 $0.0 $0.0 $0.0 $0.0 $0.0 $0.0 Cash at BOP 1, , , , ,317.7 Minimum cash desired 2, , , , ,000.0 Excess cash at BOP (98.0) 3, , , ,317.7 Excess cash plus cash generated during period (prior to revolver 3, , , , ,279.9 Interest rate on debt 5.0% 5.0% 5.0% 5.0% 5.0% Interest expense $0.0 $0.0 $0.0 $0.0 $0.0 Interest rate on cash 1.0% 1.0% 1.0% 1.0% 1.0% Interest income $35.8 $73.0 $115.1 $160.0 $
15 Sensitivity Analysis Diluted EPS based on various revenue growth assumptions (column) and COGS margin assumptions (row) 2013 COGS margin $ % 50.0% 52.0% 54.0% 56.0% 9.5% $6.98 $6.21 $5.44 $4.66 $ % $6.87 $6.11 $5.35 $4.59 $ Revenue growth range 6.4% $6.76 $6.01 $5.26 $4.51 $ % $6.66 $5.92 $5.18 $4.44 $ % $6.55 $5.82 $5.09 $4.36 $ % $6.37 $5.66 $4.95 $4.24 $ COGS margin $ % 50.0% 52.0% 54.0% 56.0% 9.5% $9.42 $8.46 $7.50 $6.53 $ % $9.28 $8.33 $7.38 $6.43 $ Revenue growth range 6.4% $9.13 $8.19 $7.25 $6.32 $ % $8.99 $8.07 $7.14 $6.22 $ % $8.85 $7.94 $7.03 $6.12 $ % $8.61 $7.72 $6.83 $5.94 $ COGS margin $ % 50.0% 52.0% 54.0% 56.0% 9.5% $10.10 $9.07 $8.05 $7.02 $ % $9.94 $8.93 $7.92 $6.91 $ Revenue growth range 6.4% $9.78 $8.78 $7.79 $6.79 $ % $9.64 $8.65 $7.67 $6.69 $ % $9.48 $8.51 $7.55 $6.58 $ % $9.23 $8.28 $7.34 $6.39 $

16 DCF Valuation 16
17 Free Cash Flow Buildup $mm Projected 2013P 2014P 2015P 2016P 2017P Fiscal year end 12/31/ /31/ /31/ /31/ /31/2017 EBIT 4, , , , ,517.2 tax rate 36.2% 34.0% 34.0% 34.0% 34.0% EBIAT 3, , , , ,301.3 Depreciation 2, , , , ,725.5 Accounts receivable 35.5 (102.9) (174.1) (185.1) (196.7) Inventory 78.8 (28.7) (22.8) (24.2) (25.8) Other current assets Other assets Accounts payable Other current liabilities Long-term liabilities Unlevered cash from operations 2, , , , ,603.5 Capital expenditures (1,805.4) (2,022.0) (2,149.4) (2,284.8) (2,428.8) Unlevered free cash flows $4,334.4 $4,607.7 $4,846.2 $5,151.5 $5,476.0 Period Discount factor 92.7% 86.0% 79.8% 74.0% 68.6% Present value of free cash flows 4, , , , ,755.9 Terminal Value Perpetuity approach FCF in last forecast period (t) 5,476.0 FCF t+1 5,530.8 Long term growth rate (g) 1% Terminal value 80,948.2 Present value of terminal value 55,521.2 Enterprise value 74,934.4 Exit EBITDA multiple approach Terminal year EBITDA 10,242.6 Terminal value EBITDA multiple 7.3x Terminal value 74,771.0 Present value of terminal value 51,284.4 Enterprise value 70,
18 Net Debt Debt - Revolver 20,045.0 Debt equivalent - convertible preferr 0.0 Cash (1,902.0) Net debt 18,143.0 Valuation Perpetuity Exit EBITDA Enterprise value 74, ,697.6 Net debt 18, ,143.0 Equity value 56, ,554.6 Equity value per share $ $97.69 % premium / (discount) over market share p 72.7% 59.9% Sensitivity Analysis Equity value per share (growth rate vs WACC) $ % 8% 9% 10% 1% $ $ $84.75 $ % $ $ $97.63 $ % $ $ $ $ % $ $ $ $ Equity value per share (exit multiple vs WACC) $ % 8% 9% 10% 6.5x $90.70 $87.24 $83.90 $ x $ $ $96.55 $ x $ $ $ $ x $ $ $ $
19 EVA Analysis As can be seen below, the EVA has grown at a very steady and rapid rate from 2006 to 2012, and starts to grow at a slower pace as in the year This can be attributed to the problems the company is facing in Latin America from competition and the expected industry stagnation. EVA is tied to stock return, so it is imperative to keep constant tabs on the EVA in the future E Total Debt $8,398.1 $8,750.0 $11,583.0 $14,949.0 $17,879.0 $21,265.0 $25,586.0 $25,710.0 $25,789.0 Equity 6, , , , (2,842.0) (5,031.0) (2,841.3) Total 15, , , , , , , , ,014.9 % Debt 55.5% 58.1% 70.0% 81.9% 99.8% 115.4% 124.5% 112.4% 99.1% % Equity 44.5% 41.9% 30.0% 18.1% 0.2% -15.4% -24.5% -12.4% 0.9% Rate of Debt 5.0% 5.0% 5.0% 5.0% 5.0% 5.0% 5.0% 5.0% 5.0% Tax rate 35.0% 35.0% 35.0% 38.4% 35.6% 37.4% 36.4% 36.8% 36.0% Risk-Free Rate 2.0% 2.0% 2.0% 2.0% 2.0% 2.0% 2.0% 2.0% 2.0% Beta Equity Risk Premium 8.0% 8.0% 8.0% 8.0% 8.0% 8.0% 8.0% 8.0% 8.0% Cost of Equity 9.4% 9.4% 9.4% 9.4% 9.4% 9.4% 9.4% 9.4% 9.4% WACC 6.0% 5.8% 5.1% 4.2% 3.2% 2.2% 1.7% 2.4% 3.3% Common Equity 6, , , , (2,842.0) (5,031.0) (2,841.3) Total Debt 8, , , , , , , , ,789.0 Invested Capital 15, , , , , , , , ,014.9 EBIT*(1-t) 1, , , , , , , , ,452.1 ROIC 9.6% 10.7% 10.6% 9.0% 14.0% 15.7% 15.7% 13.8% 13.3% EVA , , , , , ,500 3,000 2,500 2,000 1,500 1, EVA E 19
20 30,000 25,000 20,000 15,000 10,000 5,000 Invested Capital E Residual Income Analysis The residual income continues to decrease over the long term as the company reaches it maturity. Using the average book value of equity and the average number of shares, we get the equity value per share equal to $ Residual Income (Millions) FY2013 FY2014 FY2015 FY2016 FY2017 Net Income $2,710.7 $3,067.2 $3,292.8 $3,532.6 $3,787.6 Equity Capital (2841.3) Cost of Equity (%) 9.36% 9.36% 9.36% 9.36% 9.36% Equity Charge (265.9) Residual Income Period Discount Factor 91.4% 83.6% 76.5% 69.9% 63.9% Present Value $2,721.9 $2,547.0 $2,265.8 $2,008.4 $1,772.8 Total Present Value Avgerage Book Value Total Equity Value Avgerage Number of Shares Equity Value per Share $

21 EPS Consensus Source: Zacks Investment Research Arriving at the Price Target We arrive at the price target in three steps: - We take the prices from the three cases (Best, base and weak case) in the DCF valuation. - We generate the prices from the three cases using the EBITDA multiple. - We take the average of these two prices (Perpetuity and Exit EBITDA) in each of the three scenarios and finally take a weighted average between the three cases. It should be noted that the weak case was given a 50% weight, the best case a 10% weight and the base case a 40% weight. - This method gives us a price target equal to $92.60, which is a 51.5% upside potential. DCF Equity Value Per Share Perpetuity Exit EBITDA Weights Weighted Average Base Case $ $ % $40.65 Best Case $ $ % $17.58 Weak Case $70.3 $ % $34.37 Equity Value Per Share $92.60 Upside Potential 51.5% 21
22 In addition, we combine this price target with the target generated from the residual income method and take a weighted average of the two. This leads us to our conclusion price target of $74.09, which is a 21.2% upside potential. Price Target Weight EVPS using Residual Income Valuation $ % $9.27 EVPS using DCF valuation $ % $64.82 Equity Value Per Share $74.09 Upside Potential 21.2% 22
CEMEX Cement. Quarterly Report February 9, CEMEX remains on track to regain its investment grade.
 Quarterly Report CEMEX Market Outperformer 2017 Price Target US$11.0 Price 8.9 12M Price Range 4.1/9.5 Shares Outstanding (Mill)* 1,545 Market Cap USD (Mill) 13,797 Float 78.6% Net Debt USD (Mill)** 12,516
DIRECTV Latin America 2008 Media Fall Preview
 DIRECTV Latin America 2008 Media Fall Preview Bruce Churchill President DIRECTV Latin America Cautionary Statement and Non-GAAP Financials Cautionary Statement: This presentation includes certain statements
CEMEX Cement. Quarterly Report July 27, CX: Proving the success of its Value-before-Volume strategy.
 Quarterly Report CEMEX Market Outperformer 12M FWD Price Target US$10.8 Price 7.1 12M Price Range 3.8/8.6 Shares Outstanding (Mill)* 1,542 Market Cap USD (Mill) 10,976 Float 78.6% Net Debt USD (Mill)**
BIMBO Food. Quarterly Report October 27, BIMBO Market Underperformer 2016 Price Target P$41.9
 Quarterly Report BIMBO Market Underperformer 2016 Price Target P$41.9 Price 51.51 12M Price Range 45.02 / 59.86 Shares Outstanding (Mill) 4,703.2 Market Cap (Mill) 242,262 Float 24.0% Net Debt (Mill) 72,562
Finance and Accounting for Interviews
 This document was developed and written by Ian Lee. All information is meant for public use and purposed for the free transfer of knowledge to interested parties. Send questions and comments to ianlee@uclalumni.net
U.S. Silica Holdings Inc. Hilton Garden Inn Washington, D.C. February 21, 2014
 U.S. Silica Holdings Inc. Hilton Garden Inn Washington, D.C. February 21, 2014 Business Description Company roots are established in 1901 In 2012, U.S. Silica goes public In 1987, Pennsylvania Glass Sand
Verizon Communications Inc.
 April 22, 2016 Verizon Communications Inc. VZ * - NYSE Rating: Neutral Price: (4/21/16) $50.03 Price Targets: 12-18 month: $53 5-year: $57 Industry: Telecommunications James G. Moorman, CFA 212.240.9863
Charter Communications Inc.
 December 12, 2014 Charter Communications Inc. Current Recommendation NEUTRAL Prior Recommendation Underperform Date of Last Change 02/26/2014 Current Price (12/11/14) $164.16 Target Price $172.00 SUMMARY
ESV Ensco plc Sector: Energy SELL
 Analysts: Spencer Elkinton, Jake Gregg and Adam Smith Washburn University Applied Portfolio Management ESV Sector: Energy SELL Report Date: 4/18/2016 Market Cap (mm) $2,013 Annual Dividend.60 2 Yr Beta
EXC Exelon Corporation Sector: Utilities HOLD
 Analysts: Alexa Bowen, Blake Porter and Kennedy White Washburn University Applied Portfolio Management EXC Sector: Utilities HOLD Report Date: 4/18/2016 Market Cap (mm) $31,337 Annual Dividend $1.24 2
CIF Stock Recommendation Report (Fall 2012)
") Date:_10/9/2012 Analyst Name: Scott R. Mertens CIF Stock Recommendation Report (Fall 2012) Company Name and Ticker:_JPMorgan Chase_(JPM) Section (A) Summary Recommendation Buy: Yes Target Price: $49.24
Date:_10/9/2012 Analyst Name: Scott R. Mertens CIF Stock Recommendation Report (Fall 2012) Company Name and Ticker:_JPMorgan Chase_(JPM) Section (A) Summary Recommendation Buy: Yes Target Price: $49.24
Hillhouse Research Partners
 Hillhouse Research Partners DISH Network Corp. DISH NASDAQ Rating : HOLD Industry: Cable TV Changes From To November 25, 2009 (Previous) (Current) Rating - HOLD Target Price - $23.50 Initiate with HOLD
CHAPTER 3. Analysis of Financial Statements
 CHAPTER 3 Analysis of Financial Statements 1 Topics in Chapter Ratio analysis Du Pont system Effects of improving ratios Limitations of ratio analysis Qualitative factors 2 Determinants of Intrinsic Value:
RASSINI Automotive Industry
 RASSINI Market Outperformer 12M FWD Price Target P$49.0 Price 43.31 12M Price Range 28.8 / 39.4 Shares Outstanding 320 Market Cap (Mill) 13,865 Float 30.0% Net Debt (Mill) 1,867 EV (Mill) 16,345 Dividend
M.A. W M.A. WRIGHT FUND EQUITY RESEARCH LOWE S (NYSE: LOW) Sell. S&P Sector Consumer Discretionary INDUSTRY INSIGHT
 Sell. S&P Sector Consumer Discretionary INDUSTRY INSIGHT") M.A. W M.A. WRIGHT FUND EQUITY RESEARCH Ivy Ghose Ghosei@rice.edu Jan 30, 2002 LOWE S (NYSE: LOW) S&P Sector Consumer Discretionary Sell MARKET DATA Price $44.79 52 wk range $48.88-24.59 Price Target $46
M.A. W M.A. WRIGHT FUND EQUITY RESEARCH Ivy Ghose Ghosei@rice.edu Jan 30, 2002 LOWE S (NYSE: LOW) S&P Sector Consumer Discretionary Sell MARKET DATA Price $44.79 52 wk range $48.88-24.59 Price Target $46
CVX Chevron Corporation Sector: Energy SELL
 Analysts: Zachary Haller, Andrew Paley Brown and Sean Miller Washburn University Applied Portfolio Management CVX Sector: Energy SELL Report Date: 4/18/2016 Market Cap (mm) $157,566 Annual Dividend $4.28
VITRO Conglomerates. Quarterly Report July 29, VITRO Market Outperformer 12M FWD Price Target P$73.0
 Quarterly Report VITRO Market Outperformer 12M FWD Price Target P$73.0 Price 61.1 12M Price Range 36.3/ 66.7 Shares Outstanding (Mill) 483.6 Market Cap (Mill) 1,564 Float 20% Net Debt ( Mill) -424 EV Adj.
Yamama Cement Company
 Update Report- Transfer of Coverage Buy Year End Target Price SAR 62 120 110 100 90 80 70 May er 19, 27, 2014 2015 Expected Total Return Price as on May-26, 2015 49.07 Upside to Target Price 26.8% Expected
CIF Stock Recommendation Report (Fall 2012)
") Date: 10/11/12 Analyst Name: Joseph Brendel CIF Stock Recommendation Report (Fall 2012) Section (A) Summary Company Name and Ticker: Prudential (PRU) Recommendation Buy: No Target Price: 35 Sector: Financials
Date: 10/11/12 Analyst Name: Joseph Brendel CIF Stock Recommendation Report (Fall 2012) Section (A) Summary Company Name and Ticker: Prudential (PRU) Recommendation Buy: No Target Price: 35 Sector: Financials
November 30 th, Students: Edward Barr, Michael Marrkand, CFA, Navneet Venkatesh Long: Stamps.com (STMP)
") November 30 th, 2018 Students: Edward Barr, Michael Marrkand, CFA, Navneet Venkatesh Long: Stamps.com (STMP) Stock Price ($) Recommendation BUY Current Price (11/16/2018) $153.57 Target Price $201 Target
November 30 th, 2018 Students: Edward Barr, Michael Marrkand, CFA, Navneet Venkatesh Long: Stamps.com (STMP) Stock Price ($) Recommendation BUY Current Price (11/16/2018) $153.57 Target Price $201 Target
Recommendation: SELL
 Lauren Soulis Philip Griffin Bill Rugg lsoulis@smu.edu pngriffi@smu.edu wrugg@smu.edu WAG CVS Comp. Agg. Current Price: $ 45.16 $ 24.38 Market Cap: $ 46.44 B $ 19.82 B P/E (ttm): 25.5 20.38 19.7 P/E (fwd):

Verizon Communications Inc. Sector: Telecommunication Services Hold
 Applied Portfolio Management Analysts: Travis Hirt, Brandon Holle and Mark Latimer VZ Verizon Communications Inc. Sector: Telecommunication Services Hold Report Date: 4/4/25 Market Cap (mm) $85,94 Annual
LifeVantage Corp. NasdaqCM: LFVN
 LifeVantage Corp. NasdaqCM: LFVN New Products and Valuation Outweigh issues in Japan, reiterate Strong Buy LifeVantage Corp (LFVN) focuses on selling healthy living products through direct selling. They
Buy Dec 2018 TP (IDR) 4,600 Consensus Price (IDR) 4,591 TP to Consensus Price +0.2% vs. Last Price +29.2%
 4,600 Consensus Price (IDR) 4,591 TP to Consensus Price +0.2% vs. Last Price +29.2%") Telekomunikasi Indonesia Tbk (TLKM) Counts on Way More Healthy Competition Constrained Margin TLKM posted 4Q17 s robust growth of 23.2% y-y into IDR12.89 trillion in data revenue amid the decline in 4Q17
Telekomunikasi Indonesia Tbk (TLKM) Counts on Way More Healthy Competition Constrained Margin TLKM posted 4Q17 s robust growth of 23.2% y-y into IDR12.89 trillion in data revenue amid the decline in 4Q17
KIMBERLY CLARK DE MEXICO Re-Rating Completed; Downgrading to Hold
 Latin American Equity Research Mexico City, November 20, 2006 KIMBERLY CLARK DE MEXICO Re-Rating Completed; Downgrading to Hold Joaquín Ley* Mexico: Santander Banco Santander S.A. 5255) 5269-1921 jley@santander.com.mx
Results for Q4 FY2014 (Quarter Ended March 31, 2014) Earnings Announcement: April 30, 2014
 Earnings Announcement: April 30, 2014") Results for Q4 FY2014 (Quarter Ended March 31, 2014) Earnings Announcement: April 30, 2014 Risks and Non-GAAP Disclosures This presentation contains forward-looking statements, which are based on current
Results for Q4 FY2014 (Quarter Ended March 31, 2014) Earnings Announcement: April 30, 2014 Risks and Non-GAAP Disclosures This presentation contains forward-looking statements, which are based on current
CHAPTER 3. Topics in Chapter. Analysis of Financial Statements
 CHAPTER 3 Analysis of Financial Statements 1 Topics in Chapter Ratio analysis DuPont equation Effects of improving ratios Limitations of ratio analysis Qualitative factors 2 Determinants of Intrinsic Value:
Finance Recruiting Interview Preparation
 Finance Recruiting Interview Preparation Discounted Cash Flows Session #3 This presentation is for informational purposes only, and is not an offer to buy or sell or a solicitation to buy or sell any securities,
Buy Dec 2018 TP (IDR) 42,350 Consensus Price (IDR) 36,475 TP to Consensus Price % vs. Last Price %
 42,350 Consensus Price (IDR) 36,475 TP to Consensus Price % vs. Last Price %") United Tractors Tbk (UNTR) Is Persistently Capable of Thriving Fantastic Growth in Heavy Machinery Segment The heavy machinery segment posted sales of IDR7.3 trillion (+106.6% y-y) in 4Q17. The surge in
United Tractors Tbk (UNTR) Is Persistently Capable of Thriving Fantastic Growth in Heavy Machinery Segment The heavy machinery segment posted sales of IDR7.3 trillion (+106.6% y-y) in 4Q17. The surge in
Cablevision Systems Corporation.
 January 14, 2015 Cablevision Systems Corporation. Current Recommendation SUMMARY DATA NEUTRAL Prior Recommendation Outperform Date of Last Change 02/10/2014 Current Price (01/13/15) $20.00 Target Price
Nike Inc. (NKE) Slight Delay As We Taxi For Takeoff. 21 March 2017 Americas/United States Equity Research Footwear
 Slight Delay As We Taxi For Takeoff. 21 March 2017 Americas/United States Equity Research Footwear") Americas/United States Equity Research Footwear Rating OUTPERFORM Price (21-Mar-17, US$) 58.01 Target price (US$) 67.00 52-week price range (US$) 64.90-49.62 Market cap (US$ m) 95,976.22 Target price is
Americas/United States Equity Research Footwear Rating OUTPERFORM Price (21-Mar-17, US$) 58.01 Target price (US$) 67.00 52-week price range (US$) 64.90-49.62 Market cap (US$ m) 95,976.22 Target price is
Energomontaż- Południe
 Analyst: Andrzej Bernatowicz, a.bernatowicz@idmsa.pl, +48 (22) 489 94 74 Energomontaż- Południe Investment story In our view, Energomontaż-Południe (EPD) is the best vehicle in our coverage universe to
UBS 36 th Annual Global Media and Communications Conference. Jon Rubin Senior VP of Financial Planning and Investor Relations
 UBS 36 th Annual Global Media and Communications Conference Jon Rubin Senior VP of Financial Planning and Investor Relations December 8, 2008 Cautionary Statement This presentation includes certain statements
Sample Questions and Solutions
 Sample Questions and Solutions Public Comparables Question Facts for Company XYZ: Closing stock price is $18.00 1,000 shares outstanding, and 100 outstanding options outstanding with an average exercise
Buy Dec 2017 TP (IDR) 3,250 Consensus Price (IDR) 3,469 TP to Consensus Price -6.3% vs. Last Price +18.2%
 3,250 Consensus Price (IDR) 3,469 TP to Consensus Price -6.3% vs. Last Price +18.2%") Surya Citra Media, Tbk (SCMA) Is Optimistic about Performance Improvement Less Maximum Growth SCMA closed 2016 by booking the revenue of IDR4.5 trillion (+6.7% y-y), while in Q4 2016, SCMA s revenue was
Surya Citra Media, Tbk (SCMA) Is Optimistic about Performance Improvement Less Maximum Growth SCMA closed 2016 by booking the revenue of IDR4.5 trillion (+6.7% y-y), while in Q4 2016, SCMA s revenue was
CIF Stock Recommendation Report (Fall 2012)
") Date: 10/13/2012 Analyst Name: Ryan Ellingsen CIF Stock Recommendation Report (Fall 2012) Company Name and Ticker: Colgate-Palmolive Company (CL) Section (A) Summary Recommendation Buy: Hold Target Price:
Date: 10/13/2012 Analyst Name: Ryan Ellingsen CIF Stock Recommendation Report (Fall 2012) Company Name and Ticker: Colgate-Palmolive Company (CL) Section (A) Summary Recommendation Buy: Hold Target Price:
MSU: Metro Inc. Pitch February 24, 2016
 MSU: Metro Inc. Pitch February 24, 2016 Disclaimer The analyses and conclusions of Queen s Capital contained herein are based on publicly available information. The analyses provided may include certain
CIF Stock Recommendation Report (Fall 2012)
") Section (A) Summary CIF Stock Recommendation Report (Fall 2012) Recommendation: Do Not Buy Recommended Buy Price: $69 Sector: Industrials Company Name and Ticker: Caterpillar Inc. (CAT) Industry: Farm
Section (A) Summary CIF Stock Recommendation Report (Fall 2012) Recommendation: Do Not Buy Recommended Buy Price: $69 Sector: Industrials Company Name and Ticker: Caterpillar Inc. (CAT) Industry: Farm
EQUITY RESEARCH. Sector Outperform. Price Target USD 35.50
 EQUITY RESEARCH 1 December 14, 2017 Our View: GameStop is priced on a near-term liquidation basis, despite management s progress towards shifting business strategies and diversifying revenue streams. We
CIF Stock Recommendation Report (Fall 2012)
") Section (A) Summary CIF Stock Recommendation Report (Fall 2012) Company Name and Ticker: Boeing BA Recommendation Buy: Yes Target Price: $83.00 Sector: Industrials Industry: Aerospace & Defense Market
Section (A) Summary CIF Stock Recommendation Report (Fall 2012) Company Name and Ticker: Boeing BA Recommendation Buy: Yes Target Price: $83.00 Sector: Industrials Industry: Aerospace & Defense Market
FAIR MARKET VALUE ANALYSIS (a) Valuation Method Exhibit Low High Low High. Fair Market Value of 100.0% Equity. Proposed Price $204 Million (c)
 Valuation Method Exhibit Low High Low High. Fair Market Value of 100.0% Equity. Proposed Price $204 Million (c)") Sony Pictures Entertainment Inc. Exhibit 1 Summary of Values (currency in millions) - FAIR MARKET VALUE ANALYSIS (a) Fair Market Value of 100.0% Equity Interest (USD millions) (b) Valuation Method Exhibit
Sony Pictures Entertainment Inc. Exhibit 1 Summary of Values (currency in millions) - FAIR MARKET VALUE ANALYSIS (a) Fair Market Value of 100.0% Equity Interest (USD millions) (b) Valuation Method Exhibit
CIF Stock Recommendation Report (Fall 2012)
") Date: Saturday, November 10, 2012 Analyst Name: Fausto Guillén Aguilar Jr. CIF Stock Recommendation Report (Fall 2012) Company Name and Ticker: International Business Machines Corp IBM Section (A) Summary
Date: Saturday, November 10, 2012 Analyst Name: Fausto Guillén Aguilar Jr. CIF Stock Recommendation Report (Fall 2012) Company Name and Ticker: International Business Machines Corp IBM Section (A) Summary
AAON, Inc. (AAON) NEUTRAL Price Target: $34 Price: $ Sidoti & Company, LLC
 NEUTRAL Price Target: $34 Price: $ Sidoti & Company, LLC") December 16, 2016 Morning Meeting Note Raise Price Target AAON, Inc. (AAON) Equity Research Raise Target To $34 (From $28) On Anticipation Of A Lower Tax Rate; Continue To Forecast Strong Growth In 2017-2018;
December 16, 2016 Morning Meeting Note Raise Price Target AAON, Inc. (AAON) Equity Research Raise Target To $34 (From $28) On Anticipation Of A Lower Tax Rate; Continue To Forecast Strong Growth In 2017-2018;
CMPC. Target Price Update
 CMPC Target Price: CLP 2,350 Recommendation: Buy Risk: Medium 2012-May-08 Sector: Forestry Target Price Update Analyst: Vicente Meschi vicente.meschi@corpgroup.cl Target Price Update Investment Thesis
TOFAS. Company Update. Still offers potential value BUY. Rating. 19 February 2019
 Feb-18 Mar-18 Apr-18 May-18 Jun-18 Jul-18 Aug-18 Sep-18 Oct-18 Nov-18 Dec-18 Jan-19 Company Update TOFAS Still offers potential value Tofas has been a laggard in the last one-year period, due to weaker
KMI Kinder Morgan, Inc. Sector: Energy HOLD
 Analysts: Aleck Boyd, Dario Munoz Poletti, Bernadette Smith and Sara Specht Washburn University Applied Portfolio Management KMI Sector: Energy HOLD Report Date: 4/18/2016 Market Cap (mm) $39,563 Annual
Comcast EQUITY RESEARCH QUARTERLY UPDATE OUTPERFORM. Comcast 2Q16 Follow-Up: Raising Price Target to $74, 8x 2017E EBITDA.
 EQUITY RESEARCH QUARTERLY UPDATE July 29, 2016 Stock Rating: OUTPERFORM 12-18 mo. Price Target $74.00 CMCSA - NASDAQ $67.86 3-5 Yr. EPS Gr. Rate 17% 52-Wk Range $68.36-$50.01 Shares Outstanding 2,446.0M
Investment Highlights
 Vtech Holdings 15 November 2017 Maintaining TP of HK$130 Slower growth in top line Vtech Holdings (0303.HK) Export Sector Rating Buy Target Price HK$130.0 (12/18) Close Price 52 weeks high/low Market cap
Buy Dec 2017 TP (IDR) 57,600 Consensus Price (IDR) 45,545 TP to Consensus Price +26.5% vs. Last Price +20.7%
 57,600 Consensus Price (IDR) 45,545 TP to Consensus Price +26.5% vs. Last Price +20.7%") Unilever Indonesia, Tbk (UNVR) Will Ads Cost Dip? Better Sales Growth UNVR booked higher sales growth since the end of 2015. The sales growth increased from 5.7% in 2015 into 9.8% in 2016, and is estimated
Unilever Indonesia, Tbk (UNVR) Will Ads Cost Dip? Better Sales Growth UNVR booked higher sales growth since the end of 2015. The sales growth increased from 5.7% in 2015 into 9.8% in 2016, and is estimated
Mitra Keluarga Company Focus
 October 13, 2015 Mitra Keluarga Company Focus Patricia Gabriela (patricia.gabriela@trimegah.com) Titan in medical industry Initiate coverage on MIKA with BUY We initiate our coverage on MIKA with a Buy
American Tower Corp. AMT 3Q16 Results: Solid Quarter with a Beat and Raise on EBITDA
 EQUITY RESEARCH COMPANY UPDATE October 27, 2016 Stock Rating: OUTPERFORM 12-18 mo. Price Target $130.00 AMT - NYSE $115.67 3-5 Yr. EPS Gr. Rate 20% 52-Wk Range $118.26-$83.07 Shares Outstanding 430.0M
Discussion and Reconciliation of Non-GAAP Measures
 Discussion and Reconciliation of Non-GAAP Measures We believe the following measures are relevant and useful information to investors as they are part of AT&T's internal management reporting and planning
US Cable, DBS and Telecom
 US Cable, DBS and Telecom 3Q Quarterly Preview We continue to favor the DBS firms over cable and now favor most of the IXCs over the RBOCs. We recommend avoiding the developing RBOC-MSO battle and finding
VITRO Conglomerates. Company Note March 1, VITRO completes acquisition of the OEM Business from PGW
 Company Note VITRO Market Outperformer 2017 Price Target P$88.5 Price 70.1 12M Price Range 36.3/ 66.7 Shares Outstanding (Mill) 483.1 Market Cap (Mill) 1,703 Float 20% Net Debt ( Mill) 273 EV Adj. (Mill)
Darden Restaurants, Inc.
 Darden Restaurants, Inc. DRI: Reports Solid Performance; Expectations Were Pretty High Despite Evidence Segment Is Slowing Our View: We reiterate our OW rating following shares coming under pressure because
Telkom (TLKM IJ) HOLD (from Buy) Recovery mostly priced-in. Equity Indonesia Telecommunication. Company Update. 28 November 2018
 HOLD (from Buy) Recovery mostly priced-in. Equity Indonesia Telecommunication. Company Update. 28 November 2018") Equity Indonesia Telecommunication Telkom (TLKM IJ) HOLD (from Buy) Stock Data Target price (Rp) Prior TP (Rp) Shareprice (Rp) Rp4, Rp4,1 Rp3,72 Upside/downside (%) +7.5 Sharesoutstanding (m) 99,62 Marketcap.
Equity Indonesia Telecommunication Telkom (TLKM IJ) HOLD (from Buy) Stock Data Target price (Rp) Prior TP (Rp) Shareprice (Rp) Rp4, Rp4,1 Rp3,72 Upside/downside (%) +7.5 Sharesoutstanding (m) 99,62 Marketcap.
ORMAT TECHNOLOGIES (NYSE:ORA) BY: Kelvin Li
 BY: Kelvin Li") ORMAT TECHNOLOGIES (NYSE:ORA) BY: Kelvin Li Company Overview Revenue Segmentation Details of Operations Product 42% Electricity 58% Other Foreign Countries 6% Kenya 20% United States 74% Ormat Technologies
ORMAT TECHNOLOGIES (NYSE:ORA) BY: Kelvin Li Company Overview Revenue Segmentation Details of Operations Product 42% Electricity 58% Other Foreign Countries 6% Kenya 20% United States 74% Ormat Technologies
Research Report- Update
 The Standard of Excellence in the Microcap Market Member: NASD, SIPC Buy Research Report- Update Robert C. Schroeder UFP Technologies, Inc. May 15, 2000 Ticker: UFPT--$2.56 (NASDAQ) FY1997 FY1998 FY1999A
Results for Q1 Fiscal 2018
 Results for Q1 Fiscal 2018 Earnings Announcement: July 27, 2017 (Quarter Ending June 30, 2017) Risks and Non-GAAP Disclosures This presentation contains forward-looking statements, which are based on current
Session 2, Sunday, April 2nd (1:30-5:00) v Association for Financial Professionals. All rights reserved. Session 3-1
 v Association for Financial Professionals. All rights reserved. Session 3-1") Session 2, Sunday, April 2nd (1:30-5:00) v2.0 2014 Association for Financial Professionals. All rights reserved. Session 3-1 Chapters Covered Financial Accounting and Reporting: Part I, Domain B Chapter
Session 2, Sunday, April 2nd (1:30-5:00) v2.0 2014 Association for Financial Professionals. All rights reserved. Session 3-1 Chapters Covered Financial Accounting and Reporting: Part I, Domain B Chapter
Note Important Disclosures on Pages 5-6 Note Analyst Certifications on Page 5
 COMPANY UPDATE / ESTIMATE CHANGE Key Metrics WGL - NYSE - as of 2/7/18 $85.41 Price Target -- 52-Week Range $81.59 - $86.89 Shares Outstanding (mm) 51.4 Market Cap. ($mm) $4,386.0 1-Mo. Average Daily Volume
Chase Carey. President & CEO The DIRECTV Group
 Chase Carey President & CEO The DIRECTV Group The DIRECTV Group Cautionary Statement This presentation includes certain statements that may be considered to be, forward-looking statements within the meaning
Opus Group. Equity Research. US could be supportive. Buy (Neutral) Target price: SEK 9.00 (10.0) Share price: SEK August, 2015.
 Target price: SEK 9.00 (10.0) Share price: SEK August, 2015.") Equity Research 21 August, 20 Opus Group US could be supportive Q2 EBITDA slightly better than expected US platform in place Relative pricing in favor Q2 figures The Q2 EBITDA of SEK 94m (88) was 2-3%
Equity Research 21 August, 20 Opus Group US could be supportive Q2 EBITDA slightly better than expected US platform in place Relative pricing in favor Q2 figures The Q2 EBITDA of SEK 94m (88) was 2-3%
Yale University Martin Wexler, Steven Hao, Stephen Oshman, Michael Simpson, Ayung Tseng April 2, 2009
 Yale University Martin Wexler, Steven Hao, Stephen Oshman, Michael Simpson, Ayung Tseng April 2, 2009 Ticker: PVH Target Price: $22 Market Price: $21 Investment Thesis: Source: Yahoo Finance 1. Resilient
CIF Stock Recommendation Report (Fall 2012)
") Section (A) Summary Date: 12/6/2012 Analyst Name: Jacob Allen CIF Stock Recommendation Report (Fall 2012) Company Name and Ticker: Qualcomm Inc. (QCOM) Recommendation Buy: Yes No Target Price: $67.00 Sector:
Section (A) Summary Date: 12/6/2012 Analyst Name: Jacob Allen CIF Stock Recommendation Report (Fall 2012) Company Name and Ticker: Qualcomm Inc. (QCOM) Recommendation Buy: Yes No Target Price: $67.00 Sector:
CDW Corporation. Webcast Conference Call May 4, CDW.com
 CDW Corporation Webcast Conference Call May 4, 2016 CDW.com 800.800.4239 Today's Agenda 1st Quarter Results Key Performance Drivers and Strategic Progress Financial Results Outlook Q&A 1 Disclaimers This
First Quantum (TSE: FM)
") Company report First Quantum (TSE: FM) Rating: SELL (PT: CAD 12.38, 30.6% downside) FM is a small player with cost of production right at the industry average Speculative credit rating, high debt balance
Company report First Quantum (TSE: FM) Rating: SELL (PT: CAD 12.38, 30.6% downside) FM is a small player with cost of production right at the industry average Speculative credit rating, high debt balance
CONSUMER DISCRETIONARY STOCK PITCH. 4/2/2013 The Ohio State University SIM Portfolio Nolan Cox Shengyu Cao Trey Morrish Ziyang Zhong
 CONSUMER DISCRETIONARY STOCK PITCH 4/2/2013 The Ohio State University SIM Portfolio Nolan Cox Shengyu Cao Trey Morrish Ziyang Zhong Overview Key Takeaways S&P 500 11.74% SIM 12.28% SIM Overweight by.54%
Stock Rover Profile Metrics
 Stock Rover Profile Metrics Average Volume (3m) The average number of shares traded per day over the past 3 months. Company Unit: Name The full name of the company. Employees The number of direct employees.
SUN TV Network NEUTRAL. Performance Highlights CMP. `297 Target Price - 1QFY2013 Result Update Media. Investment Period -
 1QFY2013 Result Update Media August 8, 2012 SUN TV Network Performance Highlights Quarterly data (Standalone) (` cr) 1QFY13 1QFY12 % yoy 4QFY12 %qoq Revenue 426 454 (6.2) 427 (0.3) EBITDA 323 366 (11.7)
RCN Corporation Rating: Buy
 SATELLITE, CABLE & BROADCASTING David B. Kestenbaum 212-218-3851 dkestenbaum@morganjoseph.com James Leahy 212-218-3784 jleahy@morganjoseph.com Company Update September 7, 2007 Key Metrics RCNI - NASDAQ
Rebranding Doesn t Matter; Losing Ground to Peers in a Decelerating Industry Does Rating: SELL Price Target: $42.50 (13.
 CFA INSTITUTE RESEARCH CHALLENGE 2014 Rebranding Doesn t Matter; Losing Ground to Peers in a Decelerating Industry Does Rating: SELL Price Target: $42.50 (13.3% DISCOUNT) AGENDA 1) Industry at Cyclical
Lockheed Martin. Sector Manager: Daniel Curran. Senior Analyst: Kevin McDonnell. Team Analysts: Jason Flynn. Mike Havris. TJ O Sullivan.
 Lockheed Martin T r i n i t y S M F Lockheed Martin Sector Manager: Daniel Curran Senior Analyst: Kevin McDonnell Team Analysts: Jason Flynn Mike Havris TJ O Sullivan Mark Perham T R I N I T Y S M F Investment
SENSATA THIRD QUARTER 2017 EARNINGS PRESENTATION OCTOBER 24, 2017
 SENSATA THIRD QUARTER 2017 EARNINGS PRESENTATION OCTOBER 24, 2017 Forward-Looking Statements In addition to historical facts, this earnings presentation, including any documents incorporated by reference
Frontier Communications Corporation
 January 20, 2015 Frontier Communications Corporation Current Recommendation SUMMARY DATA NEUTRAL Prior Recommendation Underperform Date of Last Change 02/27/2006 Current Price (01/19/15) $6.83 Target Price
CIF Stock Recommendation Report (Fall 2012) Summary
 Summary") Date: 11/6/2012 Analyst Name: Kyle Temple CIF Stock Recommendation Report (Fall 2012) Company Name and Ticker: Dover Corp Summary DOV Recommendation Buy: Yes No Target Price: $65.00 Sector: Industrials
Date: 11/6/2012 Analyst Name: Kyle Temple CIF Stock Recommendation Report (Fall 2012) Company Name and Ticker: Dover Corp Summary DOV Recommendation Buy: Yes No Target Price: $65.00 Sector: Industrials
Buy Dec 2018 TP (IDR) 4,770 Consensus Price (IDR) 4,002 TP to Consensus Price +19.2% vs. Last Price +61.1%
 4,770 Consensus Price (IDR) 4,002 TP to Consensus Price +19.2% vs. Last Price +61.1%") Pembangunan Perumahan Tbk (PTPP) Optimism Beyond Expectation Consistent and Stellar Growth in New Contracts Compared to other State-Owned Enterprises (SOEs) construction, PTPP s new contract growth figures
Pembangunan Perumahan Tbk (PTPP) Optimism Beyond Expectation Consistent and Stellar Growth in New Contracts Compared to other State-Owned Enterprises (SOEs) construction, PTPP s new contract growth figures
Our thesis considers the following:
 Quarterly Report OMA Market Underperformer 2016 Price Target P$108.8 Price 114.23 12M Price Range 77.19 / 115.63 Shares Outstanding (Mill) 392.2 Market Cap (Mill) 44,796 Float 46% Net Debt (Mill) 2,782
Millicom International Cellular Rating: Buy
 SATELLITE, CABLE & BROADCASTING David B. Kestenbaum 212-218-3851 dkestenbaum@morganjoseph.com Heather Hou 212-218-3713 hhou@morganjoseph.com Company Update October 7, 2008 Key Metrics MICC - NASDAQ $58.45
Indofood Sukses Makmur(INDF IJ)
") Equity Research Company Update Thursday,27 September 2018 BUY MAINTAIN Last price (IDR) 5,975 Target Price (IDR) 8,200 Upside/Downside +37.2% Previous Target Price (IDR) 8,000 Stock Statistics Sector Bloomberg
Equity Research Company Update Thursday,27 September 2018 BUY MAINTAIN Last price (IDR) 5,975 Target Price (IDR) 8,200 Upside/Downside +37.2% Previous Target Price (IDR) 8,000 Stock Statistics Sector Bloomberg
CFO COMMENTARY Q1 FY 2019
 Q1 FY 2019 FINANCIAL INFORMATION AND CONFERENCE CALL Please see the accompanying earnings press release available at www.scansource.com in the Investor Relations section. The information included in this
Ratios Current Industry Historical Median
 [1] 51.90 Medical Devices Market Cap: 820 Mil Draegerwerk AG & Co KGaA provides medical and safety technology. The Company has two main divisions: safety division and medical division. It provides Fire
[Please refer to Appendix. Verizon Communications, Inc. (VZ) Competition Weighing on Revenue, but Cash Flow Solid RAISING PRICE TARGET
 Competition Weighing on Revenue, but Cash Flow Solid RAISING PRICE TARGET") July 26, 2016 Baird Equity Research Connected Technology Verizon Communications, Inc. (VZ) Competition Weighing on Revenue, but Cash Flow Solid Maintain Neutral rating. This morning, Verizon reported mixed
July 26, 2016 Baird Equity Research Connected Technology Verizon Communications, Inc. (VZ) Competition Weighing on Revenue, but Cash Flow Solid Maintain Neutral rating. This morning, Verizon reported mixed
SENSATA FOURTH QUARTER AND FULL YEAR 2017 EARNINGS PRESENTATION FEBRUARY 1, 2018
 SENSATA FOURTH QUARTER AND FULL YEAR 2017 EARNINGS PRESENTATION FEBRUARY 1, 2018 Forward-Looking Statements This earnings presentation contains "forward-looking statements" within the meaning of Section
CDW Corporation. Webcast Conference Call May 2, CDW.com
 CDW Corporation Webcast Conference Call May 2, 2018 CDW.com 800.800.4239 Today's Agenda First Quarter 2018 Results Key Performance Drivers and Strategic Progress Financial Results Outlook Q&A 2 Disclaimers
CIF Stock Recommendation Report (Fall 2012)
") CIF Stock Recommendation Report (Fall 2012) Date: Nov 27 th 2012 Analyst Name: Tung Linh Company Name and Ticker: W.W. Grainger, Inc. (GWW) Section (A) Summary Recommendation Buy: No Target Price: Stop-Loss
CIF Stock Recommendation Report (Fall 2012) Date: Nov 27 th 2012 Analyst Name: Tung Linh Company Name and Ticker: W.W. Grainger, Inc. (GWW) Section (A) Summary Recommendation Buy: No Target Price: Stop-Loss
***************************** SAMPLE PAGES FROM TUTORIAL GUIDE *****************************
 DCF Modeling Copyright 2008 by Wall Street Prep, Inc. Table of contents SECTION 1: OVERVIEW DCF in theory and in practice Unlevered vs. levered DCF SECTION 2: MODELING THE DCF Modeling unlevered free cash
2Q16 Highlights: 12M FWD EV/EBITDA 12M PRICE PERFORMANCE VS. IPC P/E
 GISSA Market Outperformer 12M FWD Price Target P$45.0 Price 31.4 12M Price Range 29.5/ 33.09 Shares Outstanding 356 Market Cap (Mill) 11,169 Float 19.5% Net Debt (Mill) 46 EV (Mill) 11,164 Dividend Yield
AFP Financial Planning & Analysis Learning System Session 2, Sunday, April 2nd (1:30-5:00)
") AFP Financial Planning & Analysis Learning System Session 2, Sunday, April 2nd (1:30-5:00) Chapters Covered Financial Accounting and Reporting: Part I, Domain B Chapter 7 Ratio Analysis: Part I, Domain
AFP Financial Planning & Analysis Learning System Session 2, Sunday, April 2nd (1:30-5:00) Chapters Covered Financial Accounting and Reporting: Part I, Domain B Chapter 7 Ratio Analysis: Part I, Domain
Samsung / BBRY Pitch Book. Eduard Biller Paul Dawson Mashada Kamal Simon Foucher
 Samsung / BBRY Pitch Book Eduard Biller Paul Dawson Mashada Kamal Simon Foucher AGENDA 1 2 3 4 Deal Overview Industry Target Overview- Blackberry Business Valuation 5 Synergies & Forecast 1 DEAL OVERVIEW
AAON, Inc. (AAON) NEUTRAL Price Target: $33 Price: $ Sidoti & Company, LLC
 NEUTRAL Price Target: $33 Price: $ Sidoti & Company, LLC") December 13, 2018 Morning Meeting Note Company Update AAON, Inc. (AAON) Equity Research In Our View, AAON s Outlook For 2019 Is Positive Based On Backlog, Order Trend And Price/Cost; However, We Are Cautious
December 13, 2018 Morning Meeting Note Company Update AAON, Inc. (AAON) Equity Research In Our View, AAON s Outlook For 2019 Is Positive Based On Backlog, Order Trend And Price/Cost; However, We Are Cautious
UNITED STATES SECURITIES AND EXCHANGE COMMISSION WASHINGTON, DC FORM 8-K
 UNITED STATES SECURITIES AND EXCHANGE COMMISSION WASHINGTON, DC 20549 FORM 8-K CURRENT REPORT Pursuant to Section 13 or 15(d) of the Securities Exchange Act of 1934 Date of report (Date of earliest event
Q Earnings. Webcast Presentation November 1, 2018
 Q3 2018 Earnings Webcast Presentation November 1, 2018 2 Q3 2018 Earnings Webcast 11/1/18 Safe Harbor Statement All statements made herein that are not historical facts should be considered as forward-looking
Zacks Small-Cap Research
 Zacks Small-Cap Research Sponsored Impartial - Comprehensive May 1, 2018 Lisa Thompson 312-265-9154 lthompson@zacks.com scr.zacks.com 10 S. Riverside Plaza, Chicago, IL 60606 Revolution Lighting Technologies,
AAPL. Apple Inc. Sector: Information Technology HOLD. Analysts: Alexander Anguiano, Applied Portfolio Management. Bryan Lunzmann and Sam Olberding
 AAPL Analysts: Alexander Anguiano, Applied Portfolio Management Bryan Lunzmann and Sam Olberding Apple Inc. Sector: Information Technology HOLD Report Date: 4/4/215 Market Cap (mm) $671,725 Annual Dividend
Market vs Intrinsic Value
 Market vs Intrinsic Value Market Value Determined by the consensus of market participants Observed in the market Intrinsic value Present value of expected future cash flows Not observed Estimated using
DRAGON CROWN GROUP HOLDINGS (935.HK) 1H 2013 Review: Bucked the Trend. Company Profile. 1-Yr Price Performance vs. HSI. Basic Share Information
 1H 2013 Review: Bucked the Trend. Company Profile. 1-Yr Price Performance vs. HSI. Basic Share Information") 20 August 2013 LOGISTIC SERVICES DRAGON CROWN GROUP HOLDINGS (935.HK) BUY TARGET Maintain HK$1.30 Previous Target HK$1.30 Consensus Target N/A Current (19/8/2013) HK$0.98 Upside 33% Market Cap. HK$1,087.5M
20 August 2013 LOGISTIC SERVICES DRAGON CROWN GROUP HOLDINGS (935.HK) BUY TARGET Maintain HK$1.30 Previous Target HK$1.30 Consensus Target N/A Current (19/8/2013) HK$0.98 Upside 33% Market Cap. HK$1,087.5M
Results for Q2 Fiscal 2018
 Results for Q2 Fiscal 2018 Earnings Announcement: October 26, 2017 (Quarter Ending September 29, 2017) Risks and Non-GAAP Disclosures This presentation contains forward-looking statements, which are based
SUN TV Network NEUTRAL. Performance Highlights CMP. `369 Target Price - 2QFY2013 Result Update Media. Investment Period -
 2QFY2013 Result Update Media November 15, 2012 SUN TV Network Performance Highlights Quarterly data (Standalone) (` cr) 2QFY13 2QFY12 % yoy 1QFY13 %qoq Revenue 433 451 (4.0) 426 1.8 EBITDA 329 365 (10.0)