building trust. driving confidence.
|
|
|
- Ambrose Anderson
- 6 years ago
- Views:
Transcription
1 ~ building trust. driving confidence. January 29, British Columbia Utilities Commission Sixth Floor 900 Howe Street Vancouver, BC V6Z 2N3 Attention: Ms. Erica Hamilton, Commission Secretary and Director Re: Project No Information Requests No.2 on ICBC's Dear Ms. Hamilton: Attached are ICBC's responses to the following Information Requests on ICBC's 2015 Revenue Requirements Application: British Columbia Utilities Commission (BCUC), Information Request No. 2, January 12, (Exhibit A-10). British Columbia Pensioners' and Seniors' Organization (BCOAPO), Information Request No. 2, January 12, (Exhibit C4-3). Canadian Direct Insurance (CDI), Information Request No. 2, January 12,, (Exhibit C7-2). Movement of United Professionals (MoveUP), Information Request No. 2, January 12, (Exhibit C3-5).. Richard Landa le (RL), Information Request No. 2, January 7, (Exhibit Cl-4). Richard McCandless (RM), Information Request No. 2, January 10, (Exhibit C2-4). Toward Responsible Educated Attentive Driving (TREAD) Information Request No. 2, January 12, (Exhibit CS-4). In its information request responses, ICBC has bookmarked each group of issues where identified in the original information requests, in accordance with Rule of the Commission's Rules of Practice and Procedure. If the original information request did not provide such headings or groupings, ICBC did not add bookmarks. 151 West Esplanade I North Vancouver I British Columbia I V7M 3H9 I I regaffairs@icbc.com
2 - 2 - Please direct any enquiries regarding this submission to my attention. Yours truly, / 0, ~ ~~~ June Elder Manager, Corporate Regulatory Affairs Cc: Registered Interveners Steve Yendall, Vice President, Insurance and Driver Licensing, ICBC Attachment 151 West Esplanade I North Vancouver I British Columbia I V7M 3H9 I I regaffairs@icbc.com
3 British Columbia Utilities Commission Information Request No RR BCUC.67.1 Dated 12 January Page 1 of RR BCUC.67.1 Reference: ACTUARIAL RATE LEVEL INDICATION ANALYSIS Exhibit B-5, RR BCUC.6.1 Policy Year (PY) 2015 Loss Cost Forecast Variance In response to RR BCUC.6.1, ICBC provided Attachment A, in which ICBC compared its PY 2014 ultimate frequency, severity, and loss cost selections as presented in the 2014 Revenue Requirements Application with those presented in the 2015 Revenue Requirements Application. Question RR BCUC.6.1 intended for ICBC to provide a comparison of ICBC s original estimate of the ultimate frequency, severity, and loss cost for each of accident years 2010; 2011; 2012; 2013 and 2014 with its estimates as presented in the 2015 Revenue Requirements Application. In other words, the question sought information similar to the BC information that was provided by ICBC in its response to RR BCUC.29.1 Table 1, but for the information to show (a) ICBC s original estimates of future claim costs before any claims had occurred, (b) ICBC s current estimates as presented in the, (c) ICBC s original and current estimates for each of accident years 2010 through 2014, (d) ICBC s estimates for frequency, severity, and loss cost, and (d) actual values (as opposed to percentage changes) Please provide a table (as discussed above) that presents and compares ICBC s original estimate of the ultimate future frequency, severity, and loss cost for each of accident years 2005; 2006; 2007; 2008; 2009; 2010; 2011; 2012; 2013 and 2014 (note that the number of accident years has been expanded) with its current estimates as presented in the for Plate Owner Bodily Injury, Property Damage, and Medical Rehabilitation, separately for Personal and Commercial vehicles. In doing so, as applicable, please identify the particular Revenue Requirements Application in which ICBC presented its original estimates of future frequency, severity, and loss costs for each of the accident years In addition, please update the BC information presented in Tables 1, 2, 4 which were provided in response to RR BCUC.29.1, to show the % change from ICBC s original loss cost estimates to the estimates in the 2015 Revenue Requirements Application. In doing so, expand the tables to include accident years or policy years (as applicable) 2005 through Response: As per the phone call on January 18, between Commission staff, Oliver, Wyman Limited, and ICBC, it was agreed that the information request would be amended to provide the policy year estimates for bodily injury (BI) claims costs and the total for each historical policy year, starting from the 2006 Revenue Requirements Application (RRA) (note that ICBC did not have a Basic / Optional split at the coverage level prior to the 2006 RRA).
4 British Columbia Utilities Commission Information Request No RR BCUC.67.1 Dated 12 January Page 2 of Table 1 below provides the comparison of the BI frequency, severity, and loss costs underlying the original RRAs for policy years 2006 and 2007 to their most recent estimate as at the current Application. The results below combine personal and commercial lines of business, since this level of detail was not available at the time of the 2006 and 2007 RRAs. Table 1 Policy Year BI Estimates for 2006 and 2007 PY 2006 PY 2007 Original Current Original Current BI Basic Estimate Estimate Estimate Estimate Frequency* 1.78% 1.68% 1.68% 1.56% Severity ($)* 23,725 24,942 27,346 27,475 Loss Cost ($) *The original frequency and severity estimates for policy years 2006 and 2007 are not provided in their respective RRAs since they are based on an internal analysis to exclude trailer exposures in order to provide a similar comparison with the estimates as at the time of the current Application. Tables 2 and 3 below provide the comparison of the BI frequency, severity, and loss costs underlying the original RRA for policy years 2010, 2012, 2013, and 2014 to their most recent estimate as at the current Application, split by line of business. Table 2 Policy Year BI Estimates for 2010 to 2014 Personal PY 2010 PY 2012 PY 2013 PY 2014 Original Current Original Current Original Current Original Current BI Basic Estimate Estimate Estimate Estimate Estimate Estimate Estimate Estimate Frequency 1.33% 1.48% 1.35% 1.46% 1.44% 1.48% 1.39% 1.47% Severity ($) 32,331 32,539 35,036 34,970 38,312 38,090 39,959 40,439 Loss Cost ($)
5 British Columbia Utilities Commission Information Request No RR BCUC.67.1 Dated 12 January Page 3 of 4 Table 3 Policy Year Estimates for 2010 to 2014 Commercial BI Basic Original Estimate PY 2010 PY 2012 PY 2013 PY 2014 Current Estimate Original Estimate Current Estimate Original Estimate Current Estimate Original Estimate Current Estimate Frequency 1.80% 1.99% 1.88% 1.96% 1.93% 1.89% 1.88% 1.94% Severity ($) 38,178 40,352 40,637 42,466 44,567 47,954 48,036 49,464 Loss Cost ($) Tables 4 and 5 represent the expansion of Tables 2 and 4 provided in the response to information request RR BCUC.29.1, which summarizes the comparison of the total Basic and BI Basic loss costs underlying the original RRAs for policy years 2006 to 2014 to their most recent estimate as at the current Application (note that the expansion of Table 1 from the response to information request RR BCUC.29.1 is not provided, as agreed upon in the phone conversation discussed above). Table 4 Total Basic Bodily Injury Loss Cost Estimates (British Columbia) Policy Year* Original Estimate ($) Current Estimate ($) % Change -0.7% -6.5% 12.5% 7.8% 2.7% 7.4% *Note that the data provided in this table is on a policy year basis, whereas the data provided in Table 2 in the response to information request RR BCUC.29.1 was on an accident year basis.
6 British Columbia Utilities Commission Information Request No RR BCUC.67.1 Dated 12 January Page 4 of 4 Table 5 Total Basic Loss Cost Estimates (British Columbia)* Policy Year Original Estimate ($) Current Estimate ($) % Change -1.2% -5.2% 10.6% 7.6% 4.4% 6.1% *Note that the estimates in Table 5 are net of prospective adjustments and include manual coverages, whereas Tables 1 through 4 exclude both prospective adjustments and manual coverages. As noted in the response to information request RR BCUC.29.1 the original policy year estimates generally have more uncertainty associated with them than an unpaid loss estimate on claims occurring as of a certain date because they relate entirely to claims that have not yet occurred. The estimates of ultimate claims costs for accidents arising in a particular year are subject to re-estimation over time, as claims are paid and more information becomes known. Any estimate of future claim activity, particularly for bodily injury, is necessarily subject to a substantial amount of uncertainty due to the potential for changes in driving or claimant behaviour, inflation, the judicial/legislative/regulatory environment, technology, and claims initiatives, among other variables. In accepting that an actuarial estimate is reasonable, it is to be expected that the actual claim experience will differ from the original estimate and could turn out to be higher or lower than that estimate.
7 British Columbia Utilities Commission Information Request No RR BCUC.67.2 Dated 12 January Page 1 of RR BCUC.67.2 Reference: ACTUARIAL RATE LEVEL INDICATION ANALYSIS Exhibit B-5, RR BCUC.6.1 Policy Year (PY) 2015 Loss Cost Forecast Variance In response to RR BCUC.6.1, ICBC provided Attachment A, in which ICBC compared its PY 2014 ultimate frequency, severity, and loss cost selections as presented in the 2014 Revenue Requirements Application with those presented in the 2015 Revenue Requirements Application. Question RR BCUC.6.1 intended for ICBC to provide a comparison of ICBC s original estimate of the ultimate frequency, severity, and loss cost for each of accident years 2010; 2011; 2012; 2013 and 2014 with its estimates as presented in the 2015 Revenue Requirements Application. In other words, the question sought information similar to the BC information that was provided by ICBC in its response to RR BCUC.29.1 Table 1, but for the information to show (a) ICBC s original estimates of future claim costs before any claims had occurred, (b) ICBC s current estimates as presented in the, (c) ICBC s original and current estimates for each of accident years 2010 through 2014, (d) ICBC s estimates for frequency, severity, and loss cost, and (d) actual values (as opposed to percentage changes). Attachment A, which displays the 2014 Application and the current Application estimates, appear to show there to be a rather large variance in the Commercial Medical Rehabilitation severity. Please further explain the reasons for this variance. Response: The variance in the Commercial Medical Rehabilitation (MR) severity is mainly due to the emergence of one large claim in accident year Large claims are capped at the selected thresholds noted in the Application, Chapter 2, Exhibit D.1.2. The estimate provided in the response to information request RR BCUC.6.1-2, Attachment A Ultimate Frequency, Severity, and Loss Cost capped this large claim at $500,000. However, due to the small number of Commercial MR claims, even this capped large claim had a visible effect on the accident year 2014 severity.
8 British Columbia Utilities Commission Information Request No RR BCUC.68.1 Dated 12 January Page 1 of RR BCUC.68.1 Reference: ACTUARIAL RATE LEVEL INDICATION ANALYSIS Exhibit B-5, RR BCUC PY 2015 Loss Cost Forecast Variance In response to RR BCUC.6.1-2, ICBC provides Attachment B which references RR BCUC The question in 2013 asked whether the loss cost forecast variance should be within 5 percent for it to be reasonable, citing the August 2012 Ministry of Finance Review of ICBC. In RR BCUC.29.1, ICBC stated: The forecast variances cited in the 2012 Government Review of ICBC (2012 Government Review) relate to estimates of the ultimate amount that will be paid out (ultimate claims cost estimates) on past policies written. There is more uncertainty in the estimates of expected future claims cost, as none of those claims have occurred, whereas estimates of ultimate claims costs relate to claims that are for the most part known, although there is meaningful uncertainty as to the ultimate settlement value. For this reason, the 5 percent in the question is not an appropriate benchmark for the loss cost forecast variances. In light of the comparisons presented here, ICBC believes that an appropriate benchmark for forecast variances of future loss costs would be higher than 5%. ICBC believes that an appropriate benchmark for forecast variances of future loss costs would be higher than 5 percent. Please specify and provide rationale for the benchmark that ICBC believes is appropriate. Response: This information request refers to ICBC s statement that an appropriate benchmark for forecast variance of future loss costs would be higher than 5%. This statement was intended as a general comment rather than suggesting ICBC had a specific proposal for an appropriate benchmark for forecast variance. As ICBC noted, a range of 5% was suggested in the 2012 Government Review of ICBC as an appropriate benchmark for adverse development on ICBC s total loss reserve on all unpaid claims as at a given point of time. In that scenario, there is relative certainty about the number of claims that are unpaid with the greatest uncertainty around the average amount that will be paid on those claims. Compare this to setting a benchmark for the loss cost forecast variance in a rate application where both claim frequency and claim severity are projected forward by two years and four months (the difference between the average date of loss of June 30, 2014 for accident year 2014, which is the most recent year of known claims data, and the average date of loss of November 1, for policy year 2015). There is far more uncertainty in the latter situation than the former, and that was the basis for
9 British Columbia Utilities Commission Information Request No RR BCUC.68.1 Dated 12 January Page 2 of 3 ICBC s general comment that an appropriate benchmark for loss cost forecast variance must be higher than 5%. ICBC has not undertaken a study at this time, since obtaining a proper benchmark for loss cost forecast variance would require an in-depth analysis of current circumstances including the study of historical loss cost forecast variances both for BC and other relevant jurisdictions. This benchmark would also need to be re-calibrated on an ongoing basis in order to ensure that it would appropriately reflect the current circumstances when the forecast was made as well as when the measurement is applied, including the legal and regulatory environment, which could affect the measured level of volatility. There is no broad consensus among actuaries as to how an appropriate benchmark for loss cost forecast variance should be determined. Some possible approaches might rely on stochastic modelling, regulatory margins, or historical variability, but each of these entails certain deficiencies. A brief discussion of these is provided below. A stochastic modelling approach for determining a benchmark might involve a simulation of the individual losses that ICBC might suffer in the future policy year. Running this simulation many times under randomly varied inputs would provide a measure of the expected variability of the future claims, under certain assumptions. This method would require the specification and parameterization of multiple statistical distributions, as well as the uncertainty associated with the parameters. Although it can theoretically be calibrated to reflect current circumstances at any point in time, this can be challenging in practice due to the complexity of the models. In addition, the results of a simulation approach can be difficult to validate and are not expected to be duplicated. An approach based on regulatory margins might begin by considering the risk factors associated with unpaid claims and unearned premiums that are provided by the Office of the Superintendent of Financial Institutions (OSFI) in its MCT guideline. 1 For auto insurance lines of business, the risk factors for unearned premiums (the unexpired premiums on policies that have already been written) are 30 to 50% higher than the risk factors for unpaid claims. Since most of this risk is the uncertainty regarding the losses expected on those policies, the higher 1
10 British Columbia Utilities Commission Information Request No RR BCUC.68.1 Dated 12 January Page 3 of 3 risk factor needs to be divided by the typical loss ratio on auto policies (70 to 75% in other jurisdictions) to translate the OSFI guidance into an appropriate risk margin of 40 to 70% relative to the losses on those unexpired policies. This might be used to suggest that, in OSFI s view, the forecast risk associated with the estimated future claim costs for a policy year already in force is 40 to 70% greater than the risk associated with the estimated cost of claims that have already occurred. It cannot, however, be construed to provide any guidance as to how much greater the forecast risk associated with a future policy year might be, although it is clear that a longer forecast period carries more uncertainty with it. In addition, it is not clear how applicable the regulatory standard for federally-regulated insurance companies is with regard to reflecting current circumstances in BC, and there is no clear means by which to make an appropriate adjustment. ICBC s historical forecast variances could be examined, but do not provide the independence that would be necessary in order to determine an appropriate benchmark against which to measure ICBC s future forecast variances. Forecast variances from other jurisdictions or insurers could also be considered, to the extent they are available. For example, in the response to information request RR BCUC.29.1, ICBC provided the forecast variances for Alberta (shown below). In addition to acquiring additional historical forecast variances, it would be necessary to consider whether there were circumstances, such as legislative changes or court challenges, that might affect the appropriateness of using each of the data points in the development of a benchmark, or whether some adjustment may be necessary. Alberta Policy Year Forecast Variance (Table 5 from the response to information request RR BCUC.29.1) Policy Year % change from rate filing to 31-Dec % -3.8% -1.4% -10.6% 8.5% 11.3% 10.7% Given that there is no consensus on how to establish an appropriate benchmark to measure Basic loss cost forecast variance, ICBC is unable to provide a specific benchmark. It is important to note that, regardless of comparison to any benchmark, there may be circumstances in which the forecast variance may be larger than the normal range and still be reasonable.
11 British Columbia Utilities Commission Information Request No RR BCUC.69.1 Dated 12 January Page 1 of RR BCUC.69.1 Reference: ACTUARIAL RATE LEVEL INDICATION ANALYSIS Exhibit B-5, RR BCUC.7.3 Bodily Injury Frequency In response to RR BCUC.7.3, ICBC presents Figure 1 Bodily Injury Frequency Comparison Do the frequencies presented in Figure 1 represent combined Personal and Commercial Bodily Injury frequencies? If yes, then do the incurred frequencies for accident years 2009 through 2014 reconcile to a weighted average of the Personal and Commercial accident year frequencies presented in Exhibits D.1.1 and D.1.2 in the 2015 Revenue Requirements Application? If they do not, please re-state Figure 1 with incurred frequencies that are consistent with accident year frequencies presented in Exhibits D.1.1 and D.1.2 (i.e., on an adjusted historical basis). Response: 69.1 Yes, the frequencies presented in Figure 1 in the response to information request RR BCUC.7.3 represent combined Personal and Commercial Bodily Injury (BI) frequencies Incurred frequencies for accident years 2009 through 2013 reconcile to a weighted average of the Personal and Commercial accident year frequencies presented in the Application, Chapter 2, Exhibits D.1.1 and D.1.2. Incurred frequency for accident year 2014 does not reconcile because it is not adjusted to a normal level of BI claims with no financial transactions. After adjusting for BI claims with no financial transactions, accident year 2014 incurred frequency decreases from 1.54% to 1.52%. 1.52% reconciles to the weighted average of Personal and Commercial accident year frequencies presented in Exhibits D.1.1 and D.1.2. Table 1 below reflects the adjusted accident year 2014 incurred frequency; all other incurred frequency values are unchanged as compared to Figure 1 in the response to information request RR BCUC.7.3.
12 British Columbia Utilities Commission Information Request No RR BCUC.69.1 Dated 12 January Page 2 of 2 Table 1 - Bodily Injury Frequency Comparison Accident Year Reported as of May 31 of each year Reported as of October 31 of each year Incurred % 1.81% 2.06% % 1.81% 2.06% % 1.73% 1.96% % 1.69% 1.92% % 1.58% 1.83% % 1.52% 1.77% % 1.50% 1.72% % 1.46% 1.67% % 1.33% 1.54% % 1.24% 1.46% % 1.29% 1.49% % 1.32% 1.51% % 1.32% 1.54% % 1.27% 1.47% % 1.29% 1.52% % 1.30% 1.50%
13 British Columbia Utilities Commission Information Request No RR BCUC.70.1 Dated 12 January Page 1 of RR BCUC.70.1 Reference: ACTUARIAL RATE LEVEL INDICATION ANALYSIS Exhibit B-5, RR BCUC.34.1 Investment calculation In response to RR BCUC.34.1, ICBC states: Of the six financial institutions surveyed, only the Bank of Montreal publishes a 3-year Government of Canada bond yield forecast. However, in order to follow the proposal in the September 2009 Amended Application for a Streamlined Regulatory Process that was approved by the Commission in its April 6, 2010 Decision, the 3-year rate for the Bank of Montreal is also determined by interpolation. Does the September 2009 Amended Application for a Streamlined Regulatory Process proceeding or the Commission s April 6, 2010 Decision on the Streamlined Regulatory Process specifically require interpolation to calculate the 3-year bond yield forecast? What is the requirement (or practice, if not required) when a financial institution already provides a 3-year bond yield forecast? Please clarify. Response: The Commission s April 2010 Decision on the Streamlined Regulatory Process (the Decision) does not specifically require interpolation to calculate the 3-year bond yield forecast. The Decision approves the proposal in the September 2009 Amended Application for a Streamlined Regulatory Process (the Application) to use the surveyed financial institutions 2-year and 5-year bond yield forecasts to interpolate a 3-year yield. The Application states that: The yield of the bond selected for the proposed formula for the fixed income element of the investment portfolio in Figure 7 will be calculated by interpolation. For example, the yield for a 3-year Government of Canada bond used the formula: 2-year bond yield plus 1/3 of the difference between the 5-year and 2- year bond yields. The Application s proposal to interpolate reflected the reality that most financial institutions do not provide a 3-year bond yield forecast (in part because the Government of Canada does not auction bonds with that maturity). The Bank of Montreal is the only surveyed financial institution that provides a 3-year forecast. Neither the Application nor the Decision specifically require use of an actual 3-year bond yield forecast where available. In such cases, interpolation is still used in order to conform with the Decision, and to apply a consistent, transparent approach.
14 British Columbia Utilities Commission Information Request No RR BCUC.70.2 Dated 12 January Page 1 of RR BCUC.70.2 Reference: ACTUARIAL RATE LEVEL INDICATION ANALYSIS Exhibit B-5, RR BCUC.34.1 Investment calculation In response to RR BCUC.34.1, ICBC states: Of the six financial institutions surveyed, only the Bank of Montreal publishes a 3-year Government of Canada bond yield forecast. However, in order to follow the proposal in the September 2009 Amended Application for a Streamlined Regulatory Process that was approved by the Commission in its April 6, 2010 Decision, the 3-year rate for the Bank of Montreal is also determined by interpolation. Although there is no rate impact in this Application, please discuss the pros and cons of interpolation. For example, in terms of consistency and accuracy, are there any concerns with interpolating the Bank of Montreal s bond yield forecast instead of using its published 3-year Government of Canada bond yield forecast? Please indicate ICBC s preference going forward. Response: The pros of interpolating the 3-year Government of Canada bond yield are: Conformity with approved methodology: Interpolation applies the methodology that was proposed in the September 2009 Amended Application for a Streamlined Regulatory Process and subsequently approved in the Commission s April 2010 Decision on the Streamlined Regulatory Process. Practicality: The majority of surveyed financial institutions do not provide a 3-year bond yield forecast, requiring an alternative approach. Interpolation is a straightforward and transparent alternative. Consistency: Using the same calculation for all financial institutions is superior to a mixed approach that could be manipulated. The cons of interpolating the 3-year Government of Canada bond yield are: Interpolation assumes a linear relationship: The Government of Canada bond yield curve typically slopes in one direction, but the trajectory is not necessarily linear and it is possible to have twists in the yield curve that would not be captured if the rate is interpolated. Consequently, an interpolated 3-year forecast rate may differ slightly from
15 British Columbia Utilities Commission Information Request No RR BCUC.70.2 Dated 12 January Page 2 of 2 a 3-year rate forecast. However, as the 3-year rate is an average of four quarterly forecasts and also an average of the six financial institutions, it is unlikely that using interpolated rates for one forecast as opposed to 3-year market rates would have a material impact on the calculation of the New Money Rate. ICBC s preference going forward is to continue the existing practice of interpolating the 3-year Government of Canada bond yields. This aligns to the methodology proposed in the September 2009 Amended Application for a Streamlined Regulatory Process and subsequently approved in the Commission s April 2010 Decision on the Streamlined Regulatory Process.
16 British Columbia Utilities Commission Information Request No RR BCUC.71.1 Dated 12 January Page 1 of RR BCUC.71.1 Reference: ACTUARIAL RATE LEVEL INDICATION ANALYSIS Exhibit B-5, RR BCOAPO.32.1 Ultimate frequency, severity and loss cost In response to RR BCOAPO.32.1, ICBC states: The enhanced procedures to assign injured customers more quickly to Recovery Services are intended to better assist customers in their recovery. It was expected that this might put some upward pressure on Accident Benefit costs as a result of the increased utilization of medical benefits by liable customers, but this impact has not been measured. Why has the impact of increased utilization of medical benefits resulting in upward Accident Benefit costs not been measured when ICBC views the enhanced procedures as a benefit in dealing with its policyholders and potentially countering the trend to legal representation? Response: The impact of increased utilization of medical benefits has been reflected in the higher cost of Accident Benefits claims, as shown in the Application, Chapter 2, Exhibit D.0, paragraph 23. Although ICBC can measure the total utilization of accident benefits based on the number of claims advanced, it would be difficult to quantify the dollar amount of increased utilization and related costs that are attributable to these enhanced procedures. Since the enhancements were implemented for all claimants to allow customers to focus on their recovery, there is no control group available for comparison. In the absence of a control group, it would be challenging to isolate the difference in utilization before and after the implementation of the enhanced procedures. Together with the other initiatives discussed in the Application, Chapter 6, this initiative is intended to improve access to benefits, help customers have more control over the process, and help customers focus on their recovery. ICBC has observed increased utilization of medical benefits since the implementation of the enhanced procedures, which is consistent with these objectives. ICBC is working to address the key issues of concern to injured customers that are within its influence, but the factors exerting the most influence on customers decisions to become represented are external to ICBC. The ultimate measure of ICBC s efforts to influence legal representation is the rate at which bodily injury claims become represented on an ongoing basis, which ICBC continues to monitor. However, change in customer attitudes is a long-term objective, which may not be observable for several years.
17 British Columbia Utilities Commission Information Request No RR BCUC.72.1 Dated 12 January Page 1 of RR BCUC.72.1 Reference: CAPITAL MANAGEMENT PLAN Exhibit B-5, RR BCUC Minimum Capital Test (MCT) In response to RR BCUC , ICBC states that: ICBC did not seek any Minimum Capital Test (MCT) target changes as a result of past OSFI [the Office of the Superintendent of Financial Institutions] guideline changes because past changes did not have the breadth or scope to materially impact minimum capital required, which would impact ICBC s MCT targets. There have been four notable OSFI guideline changes that have affected the minimum capital required calculation since OSFI introduced the MCT Guideline on January 1, 2003: January 2007, December 2010 (introduction of International Financial Reporting Standards (IFRS)), January 2012, and January Compared to the January 2015 changes, the January 2007 changes had an impact on minimum capital required that was one quarter of the magnitude. The December 2010 (introduction of IFRS) changes had an impact that was one fifth of the magnitude of the January 2015 changes (the response to information request RR BCUC.36.7 provides additional details). The January 2012 changes had an impact that was less than one half of the magnitude of the January 2015 changes. Thus, ICBC did not make any MCT target changes as a result of the January 2007, December 2010, or January 2012 guideline changes due to the minor impact on the minimum capital required For each of the four changes to the OSFI guideline, please indicate the change to the original Commission determination of a 130% MCT target for adverse events if the OSFI guideline change had been incorporated into 130% MCT target as now proposed by ICBC for the 2015 guideline change Please calculate the same for the 145% MCT Capital Management Target, 160% MCT Customer Renewal Credit (CRC) trigger, and the 150% MCT CRC payout limit Would it be appropriate for the Commission to adjust the MCT thresholds based on all historical OSFI guideline changes? Please explain why or why not. Response: 72.1 Please see Table 1, which shows the impact on the 130% Risk Management Target (line g) from each of the four OSFI MCT guideline changes. For simplicity, ICBC used the 2014
18 British Columbia Utilities Commission Information Request No RR BCUC.72.1 Dated 12 January Page 2 of 3 year-end minimum capital required of $1,209 million (2013 OSFI MCT Guideline) as a starting point to calculate the impacts on the 130% Risk Management Target. Table 1 Impact of Each of the Four OSFI MCT Guideline Changes 2014 Year End (2013 Rules) January 2007 Changes December 2010 Changes January 2012 Changes January 2015 Changes MCT Margins a) Margin for adverse events 30% b) Minimum Capital Required $ 1,209M Dollar Values of the Margins (rounded) c) Margin for Adverse Events ( a x b ) $ 363M $ 363M $ 363M $ 363M $363M Minimum Capital Required d) Full Impact from Rule Change $ 28M -$ 23M -$ 46M -$ 112M e) Minimum Capital Required (b + d) $ 1,209M $ 1,237M $ 1,186M $ 1,163M $1,097M MCT Margins after MCT Rule Change* f) Margin for Adverse Events (c / e) 29% 31% 31% 33% MCT Target Level g) Risk Management Target (100% + f) 129% 131% 131% 133% * MCT margins are rounded to the nearest percentage point and MCT target levels are calculated from the rounded MCT margins The 145% MCT capital management target, the 160% MCT Customer Renewal Credit (CRC) trigger, and the 150% MCT CRC payout limit were approved by the Commission in the Decision on 2013 Revenue Requirements. The January 2007, December 2010 (introduction of IFRS) and January 2012 OSFI MCT guidelines changes were already incorporated into these targets when they were filed in the 2013 Revenue Requirements Application.
19 British Columbia Utilities Commission Information Request No RR BCUC.72.1 Dated 12 January Page 3 of ICBC believes that it is not necessary for the Commission to adjust the Risk Management Target as a result of the pre-2015 OSFI MCT Guideline changes given their relatively minor impact. As discussed in the response to information request RR BCUC above, the capital management target, the CRC trigger, and the CRC payout limit already incorporate the pre-2015 OSFI MCT Guideline changes.
20 British Columbia Utilities Commission Information Request No RR BCUC.72.2 Dated 12 January Page 1 of RR BCUC.72.2 Reference: CAPITAL MANAGEMENT PLAN Exhibit B-5, RR BCUC Minimum Capital Test (MCT) In response to RR BCUC , ICBC states that: ICBC did not seek any Minimum Capital Test (MCT) target changes as a result of past OSFI [the Office of the Superintendent of Financial Institutions] guideline changes because past changes did not have the breadth or scope to materially impact minimum capital required, which would impact ICBC s MCT targets. There have been four notable OSFI guideline changes that have affected the minimum capital required calculation since OSFI introduced the MCT Guideline on January 1, 2003: January 2007, December 2010 (introduction of International Financial Reporting Standards (IFRS)), January 2012, and January Compared to the January 2015 changes, the January 2007 changes had an impact on minimum capital required that was one quarter of the magnitude. The December 2010 (introduction of IFRS) changes had an impact that was one fifth of the magnitude of the January 2015 changes (the response to information request RR BCUC.36.7 provides additional details). The January 2012 changes had an impact that was less than one half of the magnitude of the January 2015 changes. Thus, ICBC did not make any MCT target changes as a result of the January 2007, December 2010, or January 2012 guideline changes due to the minor impact on the minimum capital required. Recognizing that the OSFI guideline may change from time to time, what triggers would warrant making adjustments to the MCT thresholds? Is there a need for an adjustment mechanism? Please explain. Response: ICBC does not see the need for a trigger or an adjustment mechanism for changing the MCT thresholds as a result of a change in the OSFI MCT guideline. ICBC will review and comment on the implications for the calculation of the MCT ratio of any changes to the OSFI MCT guideline in the revenue requirements application immediately following these changes, as part of its capital management plan content, allowing the Commission to review the impact of the changes. Specifically, if there is any change to the OSFI MCT guideline that results in a material impact on minimum capital required such as the January 2015 OSFI MCT Guideline change, ICBC will discuss the impacts of the OSFI MCT guideline change on the MCT thresholds.
21 British Columbia Utilities Commission Information Request No RR BCUC.73.1 Dated 12 January Page 1 of RR BCUC.73.1 Reference: CAPITAL MANAGEMENT PLAN Exhibit B-5, RR BCUC.36.9, 36.10, MCT risk adequacy In response to RR BCUC.36.9, ICBC states: ICBC did not provide updated 1 in 10 year information because ICBC is not making a change in the dollar margin for adverse events, as discussed in the response to information requests RR BCUC The results of the 2015 risk adequacy analysis indicate that the current dollar margin for adverse events is still appropriate, as discussed in the response to information request RR BCUC ICBC is simply making changes to the MCT targets (on a percentage basis) in order to maintain the dollar margin that is required to account for the adverse events ($363 million as at year-end 2014 under the 2013 OSFI MCT Guideline), and to follow the phase-in rules as outlined in the 2015 OSFI MCT Guideline. In response to RR BCUC.36.10, ICBC states: A 1 in 10 year event (10% probability level) is equivalent to a drop in MCT of 33 percentage points which will cause the MCT ratio to fall below the minimum capital requirement of 100% MCT (97% MCT ratio). This contravenes section 3(1)(b) of Special Direction IC2, which directs ICBC to maintain at least a 100% MCT ratio. In response to RR BCUC.36.12, ICBC states: The most recent risk adequacy analysis (Dynamic Capital Adequacy Testing (DCAT) analysis) is largely completed based on data as of Q However, the report is not yet finalized. For the most recent finalized risk adequacy analysis report (DCAT report), please see the response to information request RR RM.3.a, which provided the 2013 DCAT report. ICBC has provided a summary of the 2015 preliminary risk adequacy analysis results as they compare to the 2013 analysis in Figures 1 and 2 below. The results of the 2015 risk adequacy analysis indicate a risk management target of about 135% and a capital management target of about 150%, which are not significantly different from the results of the 2013 risk adequacy analysis.
22 British Columbia Utilities Commission Information Request No RR BCUC.73.1 Dated 12 January Page 2 of 2 Please provide the finalized 2015 risk adequacy report. If the report is not yet finalized, why and when will it become available? Response: The 2015 risk adequacy report is not yet finalized. ICBC expects the report to be finalized by the end of February once ICBC s year-end financial reporting work is complete. It will be filed as part of the Revenue Requirements Application. As discussed in the response to information request RR RM.1.6, ICBC believes that the Commission has sufficient information regarding the risk adequacy analysis that supports no change to the dollar margin for adverse events to enable it to make an informed decision on the policy year 2015 rate indication.
23 British Columbia Utilities Commission Information Request No RR BCUC.73.2 Dated 12 January Page 1 of RR BCUC.73.2 Reference: CAPITAL MANAGEMENT PLAN Exhibit B-5, RR BCUC.36.9, 36.10, MCT risk adequacy In response to RR BCUC.36.9, ICBC states: ICBC did not provide updated 1 in 10 year information because ICBC is not making a change in the dollar margin for adverse events, as discussed in the response to information requests RR BCUC The results of the 2015 risk adequacy analysis indicate that the current dollar margin for adverse events is still appropriate, as discussed in the response to information request RR BCUC ICBC is simply making changes to the MCT targets (on a percentage basis) in order to maintain the dollar margin that is required to account for the adverse events ($363 million as at year-end 2014 under the 2013 OSFI MCT Guideline), and to follow the phase-in rules as outlined in the 2015 OSFI MCT Guideline. In response to RR BCUC.36.10, ICBC states: A 1 in 10 year event (10% probability level) is equivalent to a drop in MCT of 33 percentage points which will cause the MCT ratio to fall below the minimum capital requirement of 100% MCT (97% MCT ratio). This contravenes section 3(1)(b) of Special Direction IC2, which directs ICBC to maintain at least a 100% MCT ratio. In response to RR BCUC.36.12, ICBC states: The most recent risk adequacy analysis (Dynamic Capital Adequacy Testing (DCAT) analysis) is largely completed based on data as of Q However, the report is not yet finalized. For the most recent finalized risk adequacy analysis report (DCAT report), please see the response to information request RR RM.3.a, which provided the 2013 DCAT report. ICBC has provided a summary of the 2015 preliminary risk adequacy analysis results as they compare to the 2013 analysis in Figures 1 and 2 below. The results of the 2015 risk adequacy analysis indicate a risk management target of about 135% and a capital management target of about 150%, which are not significantly different from the results of the 2013 risk adequacy analysis.
24 British Columbia Utilities Commission Information Request No RR BCUC.73.2 Dated 12 January Page 2 of 3 Please provide detailed information on the assumptions made and data used for each of the four adverse events asset decline, unanticipated inflation, adverse loss cost, and adverse unpaid claims. In particular, please fully explain the 1 in 10 year event assumed for the asset decline adverse event. Response: As stated in the response to information request RR BCUC.73.1, the 2015 risk adequacy analysis (RAA) report is not yet finalized. The complete information on the assumptions made and data used for each of the four adverse scenarios will be included and filed with the 2015 RAA report as part of the Revenue Requirements Application. To help the Commission with its decision on the current Application, ICBC has summarized the notable changes in assumptions since the 2013 RAA below, that have been used in the 2015 RAA. Please note that all other assumptions as well as the scenarios themselves have not changed since the 2013 RAA. 1. Asset Decline: In the 2013 RAA, this scenario was constructed assuming a significant decline in equity returns in year one, followed by a 0.0% return in year two, then a return to the base assumption in the years to follow. In 2014, high yield bonds were added to the investment portfolio; therefore, they were included in the updated scenario in the 2015 RAA. The 2015 RAA considers a sudden decline in both invested equities and high yield bonds in year one, followed by normal returns for the rest of the forecast period. In the 2015 RAA, ICBC changed from utilizing its internal analysis to using GEMS, a licensed economic scenario generator by Conning, licensed by its external actuary, Eckler Ltd. for construction of these assumptions.
25 British Columbia Utilities Commission Information Request No RR BCUC.73.2 Dated 12 January Page 3 of 3 The following graphs summarize the equity return assumptions and high yield bond return assumptions used in the 2015 RAA and how these assumptions compare to the 2013 RAA (note, ICBC did not include the high yield bonds in the 2013 RAA, so there is no comparison for those assumptions). 20% High-Yield Annual Returns in 2015 RAA 15% 10% 5% 0% -5% % -15% Base Adverse (90th) 2. Unanticipated Inflation: In the 2013 RAA, this adverse scenario models a significant, rapid, and sustained four years (2014 to 2017) increase in the rate of inflation. In the 2015 RAA, after consulting with ICBC s Investments department, it was concluded that a rapid, sustained 4-year increase in the rate of inflation was unlikely to occur in the forecast period ( to 2019). Therefore, ICBC updated this assumption to a sustained 3-year increase ( to 2018).

26 British Columbia Utilities Commission Information Request No RR BCUC.73.3 Dated 12 January Page 1 of RR BCUC.73.3 Reference: CAPITAL MANAGEMENT PLAN Exhibit B-5, RR BCUC.36.9, 36.10, MCT risk adequacy In response to RR BCUC.36.9, ICBC states: ICBC did not provide updated 1 in 10 year information because ICBC is not making a change in the dollar margin for adverse events, as discussed in the response to information requests RR BCUC The results of the 2015 risk adequacy analysis indicate that the current dollar margin for adverse events is still appropriate, as discussed in the response to information request RR BCUC ICBC is simply making changes to the MCT targets (on a percentage basis) in order to maintain the dollar margin that is required to account for the adverse events ($363 million as at year-end 2014 under the 2013 OSFI MCT Guideline), and to follow the phase-in rules as outlined in the 2015 OSFI MCT Guideline. In response to RR BCUC.36.10, ICBC states: A 1 in 10 year event (10% probability level) is equivalent to a drop in MCT of 33 percentage points which will cause the MCT ratio to fall below the minimum capital requirement of 100% MCT (97% MCT ratio). This contravenes section 3(1)(b) of Special Direction IC2, which directs ICBC to maintain at least a 100% MCT ratio. In response to RR BCUC.36.12, ICBC states: The most recent risk adequacy analysis (Dynamic Capital Adequacy Testing (DCAT) analysis) is largely completed based on data as of Q However, the report is not yet finalized. For the most recent finalized risk adequacy analysis report (DCAT report), please see the response to information request RR RM.3.a, which provided the 2013 DCAT report. ICBC has provided a summary of the 2015 preliminary risk adequacy analysis results as they compare to the 2013 analysis in Figures 1 and 2 below. The results of the 2015 risk adequacy analysis indicate a risk management target of about 135% and a capital management target of about 150%, which are not significantly different from the results of the 2013 risk adequacy analysis.

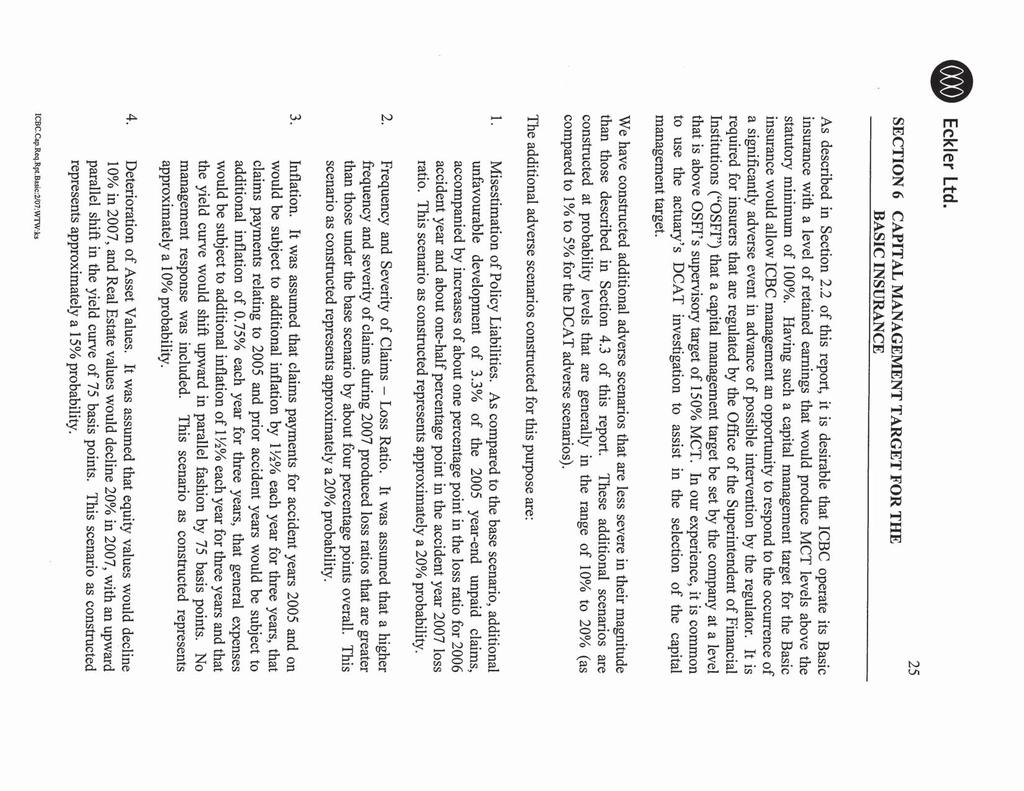
27 British Columbia Utilities Commission Information Request No RR BCUC.73.3 Dated 12 January Page 2 of 3 When the Commission originally set 130% MCT target for adverse events, it adjusted the requested risk management target proposed by ICBC. Please provide the original adverse scenario calculations made by ICBC and the determinations made by the Commission. Response: In the July 2006 Decision, the Commission directed ICBC to use industry financial stress testing to determine a suitable target in excess of the regulatory minimum, the analysis for which was provided in the 2007 Revenue Requirements Application, Chapter 6.2, Appendix 6.2 A. In the 2007 Revenue Requirements Application, Chapter 6.1, paragraph 13, ICBC introduced the analysis as follows: Eckler Ltd. was retained by ICBC to conduct an analysis of the capital requirements for ICBC s Basic insurance. A more thorough discussion of this topic is contained in the accompanying report entitled Analysis of Capital Requirements for the Basic Insurance (Appendix 6.2 A). As a supplement to its DCAT analysis, Eckler Ltd. constructed and modeled four plausible adverse scenarios, which have a greater likelihood of occurrence than the DCAT adverse scenarios. These plausible adverse scenarios were created for the specific purpose of providing ICBC management with guidance in its selection of capital management targets. Please see Attachment A Excerpt from the 2007 Revenue Requirements Application for the results of the adverse scenarios used in this analysis. In its January 2008 Decision on Revenue Requirements, page 17, the Commission decided that the Basic Insurance Capital Management Plan, as set out in Chapter 6.2 of the Application, is approved subject to the modifications set out in that Decision.
28 British Columbia Utilities Commission Information Request No RR BCUC.73.3 Dated 12 January Page 3 of 3 In that same decision, page 15, the Commission directed ICBC to provide additional evidence with respect to the adequacy of its choice of a management target MCT [Minimum Capital Test] ratio of 130 percent as part of its 2008 Revenue Requirements filing, or by June 30, 2008, whichever is earlier. As directed by the Commission, ICBC provided this further evidence on June 30, 2008 in a filing with the Commission. Please see Attachment B ICBC 2008 MCT Filing 1 for the further evidence submitted by ICBC in support of the 130% MCT risk management target. As discussed in the evidence provided in Attachment B, Section D, the adverse scenarios were reconstructed from those used in the original analysis filed in the 2007 Revenue Requirements Application, Appendix 6.2 A. The resultant adverse scenarios used for determining the 130% MCT risk management target are described in Attachment B, Exhibit 3 and include scenarios at varying levels of probability. On page 11 of Attachment B, ICBC concluded as follows: ICBC management believes the 130% management MCT target, which has a probability in the 10% to 5% range of falling below the regulatory minimum target, is appropriate, and that using the more severe adverse scenarios, which were originally created for the purpose of testing solvency, would result in a management MCT target that is overly protective. 1 The full title of the filing is Additional Evidence Respecting Adequacy of Capital Management Target MCT Ratio of 130% for Basic Insurance.
29 ICBC s Information Request Response RR BCUC 73.3 Attachment A Excerpt from the 2007 Revenue Requirements Application Insurance Corporation of British Columbia January 29,
30
31
32 ICBC s Information Request Response RR BCUC 73.3 Attachment B ICBC 2008 MCT Filing Insurance Corporation of British Columbia January 29,
33 ADDITIONAL EVIDENCE RESPECTING ADEQUACY OF CAPITAL MANAGEMENT TARGET MCT RATIO OF 130% FOR BASIC INSURANCE Insurance Corporation of British Columbia June 30, 2008
34 ICBC s June 30, 2008 Filing with the BC Utilities Commission Table of Contents A Introduction...1 B Background...2 C Developments since 2006 DCAT Analysis...3 D Explanation of Differences between 2006 Eckler and 2007 FFAM Results...4 D.1 Impact of Changes to the Canadian Generally Accepted Accounting Standards... 5 D.2 Impact of Transition from Eckler DCAT Model to FFAM DCAT Model... 5 D.3 Reflection of the Claims Volatility Specific to Basic Insurance... 6 D.4 Reconstruction of the Adverse Scenarios... 7 E Indicated Management Target MCT ratios Using Probabilities Ranging from 20% to 1%...9 F Summary...11 Insurance Corporation of British Columbia June 30, 2008 i
35 ICBC s June 30, 2008 Filing with the BC Utilities Commission Table of Figures Figure 1 Indicated Basic Insurance Management Target MCT Ratios for Plausible Adverse Scenarios... 9 Figure 2 Indicated Management Target MCT Ratios at Selected Probability Levels Insurance Corporation of British Columbia June 30, 2008 ii
36 ICBC s June 30, 2008 Filing with the BC Utilities Commission Table of Exhibits Exhibit 1 Bridging the Differences in the Results between the 2006 Eckler and 2007 FFAM DCAT Analyses...12 Exhibit 2 Adverse Scenarios Descriptions for 2006 ICBC Basic DCAT Analysis...13 Exhibit 3 Adverse Scenarios Descriptions for 2007 ICBC Basic DCAT Analysis...14 Insurance Corporation of British Columbia June 30, 2008 iii
37 ICBC s June 30, 2008 Filing with the BC Utilities Commission A INTRODUCTION 1. The British Columbia Utilities Commission (the Commission) in its January 9, 2008 Decision on ICBC s 2007 Revenue Requirements Application (the January 2008 Decision) directed ICBC to provide additional evidence with respect to the adequacy of its choice of management target Minimum Capital Test (MCT) ratio of 130% for Basic insurance. The Commission expressed the view that ICBC should explore further the scenarios it used to establish the basis for its capital management target MCT ratio to ensure that this target is adequate to achieve and maintain the regulatory minimum of 100% by and beyond The basis for the selected capital management target ratio of 130% for Basic insurance was analysis conducted in 2006 by the ICBC s Corporate Actuarial Department (CAD) and Eckler Ltd. (Eckler). This analysis used scenarios with probabilities that were in the 20% to 10% range. The Commission commented that the scenarios used by ICBC as the basis for the capital management target may not be severe enough to provide sufficient confidence that the MCT ratio for Basic insurance will not fall below the regulatory minimum of 100% in 2014 and subsequent years. 3. The Commission expressed the desire that ICBC submit evidence that would show the indicated capital management target MCT ratio resulting from use of scenarios that have probabilities in the range of 5% to 1%, so that the Commission can evaluate further the adequacy of the current capital management target MCT ratio. 4. As a result of the January 2008 Decision, CAD and Eckler undertook further analysis of the indicated management target MCT ratio within the 5% to 1% range. As discussed in Section C, ICBC s latest Dynamic Capital Adequacy Testing (DCAT) analysis, which was performed in November 2007, was used as a basis for the further analysis of the indicated target MCT ratio. 5. Accordingly, plausible adverse scenarios have been prepared at probability levels of 5%, 2½%, and 1%, reconstructed with management responses incorporated as described in Section D. Scenarios at a 20% probability were also prepared in order to provide a point of comparison to the 2006 Eckler DCAT analysis filed in the 2007 Revenue Requirements Application. The analysis of the indicated MCT target previously submitted to the Commission had some limitations in that the scenarios used had varying levels of probability but which were estimated to be in the range of 20% to 10%. Insurance Corporation of British Columbia June 30,
38 ICBC s June 30, 2008 Filing with the BC Utilities Commission 6. ICBC management has reviewed and considered the results of this work and is of the view that the current management target MCT ratio of 130% remains appropriate for Basic insurance. The Board of Directors of ICBC has reaffirmed the appropriateness of the current management target MCT ratio of 130% for the Basic insurance. The final section of this document, Section E, sets out the reasoning for management s recommendation to the ICBC Board that the MCT target for Basic insurance remain at 130%. B BACKGROUND 7. At regular intervals, actuaries investigate an insurer s financial condition as revealed by DCAT, which is the primary tool used by actuaries to test an insurer s financial condition. There are two distinct criteria of an insurer s financial condition that DCAT tests: 1) that the company does not become insolvent (i.e., is able to meet all of its obligations) under the base scenario and all plausible adverse scenarios, and 2) that the company meets its minimum regulatory capital requirement under the base scenario, which for ICBC s Basic insurance is 100% MCT as set out in Special Direction IC2 to the BC Utilities Commission, BC Regulation 307/2004. An insurer s financial condition is deemed satisfactory if both criteria are met throughout the forecast period of the insurer. 8. A plausible adverse scenario is a scenario of adverse, but plausible, assumptions about matters to which an insurer s financial condition is sensitive. Plausible adverse scenarios vary among insurers and may vary over time for a particular insurer. A plausible adverse scenario is one that has a probability of occurrence of between 5% to 1%, or in other words, is required to have probability of no more than 5% in order to be deemed adverse and no less than 1% in order to be deemed plausible. The application of plausible adverse scenarios to the base scenario tests the ability of the insurer to remain solvent throughout the forecast period. 9. In addition to testing for the satisfactory financial condition of a company, many regulators in Canada require that an insurer establish a target capital level that provides an additional margin above the minimum regulatory capital requirement. An adequate capital management target provides additional capacity to absorb unexpected losses above and beyond the provision already afforded by the minimum regulatory MCT level. 10. The information in the DCAT investigation is used to determine an appropriate amount of additional capital to build on top of the regulatory minimum capital requirement. For example, ICBC proposed a target MCT ratio of 130%, which was additional capital of Insurance Corporation of British Columbia June 30,
39 ICBC s June 30, 2008 Filing with the BC Utilities Commission 30% of MCT added to the minimum regulatory MCT ratio of 100%. The indicated capital management target MCT ratio is generally determined by using scenarios that are less severe (and hence have a higher probability) than the plausible adverse scenarios that are used to assess the risk of an insurer becoming insolvent. In this document these less severe scenarios are referred to as capital management scenarios. 11. Moreover, there is an important distinction to be made: The test of satisfactory financial condition assesses whether the company is at risk of insolvency, and because of the extreme undesirability of such an outcome, the stringent probability range of 5% to 1% is used. 12. A management target MCT ratio is meant to provide protection against falling below the regulatory minimum requirement. While falling below the regulatory minimum is not desirable, relative to insolvency, it is not as undesirable. This explains why less severe scenarios are generally used by industry to determine the management target MCT ratio. Fundamentally the capital management target MCT ratio is selected based on management s assessment of the risks that the insurer faces. The regulator (in this case, the Commission) then indicates if it does not approve of the management target MCT ratio elected by the insurer. C DEVELOPMENTS SINCE 2006 DCAT ANALYSIS 13. As a result of the January 2008 Decision, CAD and Eckler undertook further analysis of the indicated management target MCT ratio as set out below 14. Since the DCAT analysis performed during 2006 and documented in the Eckler report of February 12, 2007 titled Analysis of Capital Requirements for the Basic Insurance, which was included in the 2007 Revenue Requirements Application, there have been several meaningful developments affecting the MCT calculations and ICBC s further analysis of the indicated MCT target. These developments are: a. There were changes to Canadian accounting standards for financial instruments, as embodied in the Canadian Institute of Chartered Accountants (CICA) Handbook, Section These changes caused most financial instruments to be measured in the balance sheet at fair value rather than cost or amortized cost. Insurance Corporation of British Columbia June 30,
40 ICBC s June 30, 2008 Filing with the BC Utilities Commission b. During 2007 ICBC transitioned from using the Eckler DCAT software it had licensed to its own software, the Financial Forecasting and Analysis Model (FFAM) 1. ICBC performed its 2007 DCAT analysis with FFAM. c. Since the 2006 Eckler DCAT analysis was performed, a more accurate estimate of the volatility in the Basic insurance unpaid claims liabilities has been determined. Reflecting this more accurate estimate in ICBC s 2007 DCAT analysis has a significant influence on the results of the Reserve Misestimation scenario. d. In November 2007 the Canadian Institute of Actuaries (CIA) released an Educational Note (Document ) which affected the application of the CIA Standards of Practice to DCAT work by removing certain plausible adverse scenarios that previously were prescribed, and deemed to have probabilities in the 5% to 1% range, and thereby requiring actuaries to construct plausible adverse scenarios with probabilities in the 5% to 1% range. In response to this development, ICBC reconstructed certain plausible adverse scenarios and capital management scenarios to align the probabilities of occurrence. In reconstructing the capital management scenarios, ICBC reassessed the management response aspect of those scenarios. This reassessment was based on the experience ICBC has had with respect to the Commission granting interim rate relief when applied for by ICBC. 15. Each of the first three developments, on their own and in aggregate, has a minor effect on the indicated MCT target analysis. However, these changes are discussed in this document to demonstrate that their impact is not significant. Section D of this document focuses on the impact of the first three of these developments, showing step by step the individual impacts on the indicated management target MCT ratio. Section D also discusses in greater depth the reconstruction of the plausible adverse scenarios and the capital management scenarios, which is ICBC s response to the fourth development described above (the new Educational Note). D EXPLANATION OF DIFFERENCES BETWEEN 2006 ECKLER AND 2007 FFAM RESULTS 16. This section provides a step-by-step explanation of the impact on the indicated MCT 1 In ICBC s response to information request RR BCUC.73.3, ICBC updated the status of bringing DCAT modeling in-house by saying that it had completed the new FFAM, including a fully integrated DCAT analysis module, in early ICBC also stated that it planned to use this new model for its 2007 DCAT analysis. Insurance Corporation of British Columbia June 30,
41 ICBC s June 30, 2008 Filing with the BC Utilities Commission target for Basic insurance as a result of reflecting the first three of the four developments outlined in Section C, as well as ICBC s response to the fourth development. Exhibit 1 summarizes the steps that form a bridge between the results of the 2006 Eckler analysis, as they appeared in the 2007 Revenue Requirements Application, and the results restated for the four developments. The end result (step 4) then provides a reference point from which to compare the indicated MCT targets at the 5% to 1% probability levels. 17. Exhibit 1 begins with Step 0, which displays the results of analysis undertaken by Eckler in 2006 using 2005 year-end data that indicated an MCT target of 128% using four adverse scenarios with probabilities that ranged from 20% to 10%. Based on this analysis, ICBC management selected an MCT target of 130% for the Basic insurance. (Exhibit 2 provides the descriptions of the four adverse scenarios of Step 0). D.1 IMPACT OF CHANGES TO THE CANADIAN GENERALLY ACCEPTED ACCOUNTING STANDARDS 18. Step 1 of Exhibit 1 reflects the impact of the recent changes to Canadian generally accepted accounting principles. The 2006 Eckler DCAT analysis was completed before the changes to the valuation of financial instruments as set out in Section 3855 of the CICA Handbook came into effect on January 1, 2007, so that these accounting changes were not reflected in the 2006 Eckler DCAT analysis that was documented in the report of February 12, Also, the 2006 Eckler DCAT analysis did not recognize the concomitant revisions to the Minimum Capital Test Guideline as published by the Office of the Superintendent of Financial Institutions (OSFI) on November 24, Subsequent to its completion, the 2006 Eckler DCAT analysis and their analysis of the indicated MCT target was reworked to incorporate the new CICA and OSFI guidelines and produced an indicated MCT target of 126%. The details of these results are also discussed in the response to information request RR BCUC D.2 IMPACT OF TRANSITION FROM ECKLER DCAT MODEL TO FFAM DCAT MODEL 20. ICBC implemented its own in-house DCAT modeling capability in early 2007 (see response to information request RR BCUC.73.3). The new DCAT modelling capability is one component of a larger model, called the Financial Forecasting and Analysis Model (FFAM). The new DCAT model was subject to considerable testing and benchmarked against the Eckler model. The 2007 ICBC DCAT analysis was performed with the FFAM Insurance Corporation of British Columbia June 30,
42 model in November ICBC s June 30, 2008 Filing with the BC Utilities Commission 21. Step 2 demonstrates that the transition from the Eckler DCAT model to the FFAM model has very little impact on the indicated MCT target. Step 2 displays the transition from the restated 2006 Eckler DCAT analysis (Step 1) to the 2007 FFAM analysis results. The 2006 Eckler DCAT analysis was based on 2005 year-end data, while the 2007 FFAM DCAT analysis was based on 2006 year-end data. Step 2 demonstrates that very similar results are produced by the 2006 Eckler model and 2007 FFAM model, despite the timing difference of the input data. Step 2 results in an indicated MCT target is 128%, the same result as in Step 0 and only two points higher than the results in Step 1. In summary, the transition of the DCAT analysis from the Eckler model to ICBC s FFAM model alone has little impact on the indicated MCT target ratios. ICBC intends to use the FFAM model for analysis of its capital requirements and targets going forward. D.3 REFLECTION OF THE CLAIMS VOLATILITY SPECIFIC TO BASIC INSURANCE 22. As part of ICBC s 2007 DCAT analysis, a key assumption related to the Reserve Misestimation scenario was re-examined, namely the volatility (as measured by standard deviation) in the Basic insurance unpaid claims liabilities. At the time the 2006 Eckler DCAT analysis was performed, it had been only one year that ICBC had been analyzing Basic insurance and Optional insurance claims data. As a result, ICBC did not have a ready history from which to characterize the volatility of the unpaid claims liabilities for Basic insurance only. 23. The 2006 Eckler analysis consequently relied on the observed volatility in the total corporate unpaid claims liabilities to represent the volatility expected in the Basic insurance business. While the CAD undertook to derive a more accurate estimate of the volatility in the Basic insurance unpaid claims liabilities, that work was not completed in time to be reflected in the 2006 Eckler analysis. This more accurate estimate has been reflected in ICBC s 2007 DCAT analysis. 24. Step 3 shows the impact of updating the Reserve Misestimation parameter estimate related to unpaid claims liabilities. The Basic insurance claims history displays more yearto-year volatility than does the corporate data, which has a meaningful effect on the assumptions used for the Reserve Misestimation scenario: The MCT target indicated by the Reserve Misestimation scenario alone increased from Step 2 by 18 points from 122% to 140% and the overall indicated MCT target, found in the column labelled Average, Insurance Corporation of British Columbia June 30,
43 ICBC s June 30, 2008 Filing with the BC Utilities Commission increased by 5 percentage points from 128% to 133%. D.4 RECONSTRUCTION OF THE ADVERSE SCENARIOS 25. Two main factors gave impetus to the reconstruction of scenarios for determining the indicated MCT target. The first factor is the release in January 2007 of the CIA Educational Note which led to ICBC reconstructing certain of the plausible adverse scenarios and the capital management scenarios to align the probabilities of occurrence. More specifically, guidance from the CIA, as set out in the 1999 and the new Educational Notes regarding application of the Standards of Practice pertaining to DCAT indicate that a scenario is considered to be a plausible adverse scenario if its probability of occurrence is in the range of 5% to 1%. However, the scenarios relating to the risks of inflation, interest rate, and deterioration of asset values have been prescribed (until recently) and deemed to be plausible scenarios even though the probability of occurrence was not explicitly quantified. 26. In the analysis of its indicated MCT target as described in the Eckler report of February 12, 2007, ICBC has used scenarios with probabilities in the 20% to 10% range, with the prescribed scenarios being adjusted by CAD to make them less severe and hence more likely to occur. The CIA s 2007 Educational Note has removed reference to prescribed scenarios, thus requiring the reconstruction of plausible adverse scenarios and the capital management scenarios used to determine the indicated MCT target. 27. A second factor motivating the reconstruction of the scenarios for determining the indicated Basic insurance management MCT target is the Commission s history to date of granting approval of interim rate relief and, following the presentation of adequate evidence, making the interim increase permanent. At the time of the 2007 Revenue Requirements Application, ICBC had limited revenue requirements experience with the Commission with respect to the granting of interim rate increases. Because of this lack of experience, management responses were not contemplated in the capital management scenarios used in the 2006 Eckler DCAT analysis. 28. ICBC recognizes that it has been granted the interim rate relief in both instances that it has requested such relief from the Commission, and it is therefore appropriate to include a management response as part of each adverse scenario. Management response to the occurrence of an adverse scenario is assumed to include a rate increase at about 1½ years based on ICBC preparing an application, applying for, and the Commission granting interim rate relief following the onset of the adverse event. Insurance Corporation of British Columbia June 30,
44 ICBC s June 30, 2008 Filing with the BC Utilities Commission 29. Moreover, based on ICBC s history with the Commission, it is unrealistic to assume that, following the occurrence of an adverse event, management could not respond in timely fashion by applying for and receiving approval from the Commission for interim rate relief or that management would be without a response of some kind during the remainder of the five year forecast period. The reconstructed capital management scenarios and plausible adverse scenarios for determining the indicated MCT target are described in Exhibit Step 4 of Exhibit 1 shows the results of reconstructing the adverse scenarios at a 20% probability level. Especially noteworthy is the large reduction in the indicated management target MCT ratio of the Inflation scenario when the management response is added: The result is a 29 percentage points reduction from 150% MCT in Step 3 to 121% MCT in Step 4. This emphasizes the critical importance of seeking timely rate relief and of having the interim rate increases available. 31. Also noteworthy in Step 4 of Exhibit 1 about the addition of management responses is that the Inflation scenario is no longer the most adverse scenario. The Reserve Misestimation scenario is now the most adverse at an indicated management target of 137% MCT. 32. The overall indicated MCT target, found in the column labelled Average, is 120% MCT, which is a reduction of 13 percentage points from Step 3. The end result (Step 4) provides a reference point from which to compare the indicated MCT targets at the 5% to 1% probability levels. Insurance Corporation of British Columbia June 30,
45 ICBC s June 30, 2008 Filing with the BC Utilities Commission E INDICATED MANAGEMENT TARGET MCT RATIOS USING PROBABILITIES RANGING FROM 20% TO 1% 33. Figure 1, below, sets out the indicated Basic insurance management target MCT ratios for plausible adverse scenarios, at probability levels of 5%, 2½%, and 1%. The indicated management target for the capital management scenarios at the probability level of 20% from Exhibit 1, Step 4, is included in Figure 1 for comparison. Each of the scenarios contains a management response consisting of an application to the Commission for a Basic insurance premium increase (1½ years after the onset of the adverse event) based on the increased costs flowing from that adverse event. Figure 1 Indicated Basic Insurance Management Target MCT Ratios for Plausible Adverse Scenarios Probability Indicated of Adverse Reserve Unanticipated Asset Management Occurrence Loss Ratio Misestimation Inflation Decline Target 20% 109% 137% 121% 112% 120% 5% 117% 154% 133% 132% 134% 2.5% 120% 160% 155% 149% 146% 1% 123% 167% 165% 158% 153% Insurance Corporation of British Columbia June 30,
46 ICBC s June 30, 2008 Filing with the BC Utilities Commission 34. The 5% (or one year in twenty) probability scenarios indicate a management target MCT ratio of 134%, where the 20% (or one year in five) probability scenarios indicate a management target MCT ratio of 120%. By interpolating between the results of this analysis, as shown in Figure 2, below, the current MCT target of 130% would have a probability that is in the range of 10% to 5%. Figure 2 Indicated Management Target MCT Ratios at Selected Probability Levels Indicated Management Target MCT Ratios MCT Ratio Indicated Management Target Interpolated Management Target 110 0% 5% 10% 15% 20% Probability Level 35. In contrast, the Basic insurance management MCT target of 130% was described in the 2007 Revenue Requirements Application to have a probability of falling below the regulatory minimum MCT ratio of 100% in the range of 20% to 10%. The re-evaluation of the probability level associated with the Basic insurance management MCT target of 130% to a range of 10% to 5% is primarily a result of the inclusion of reasonable management responses in the adverse scenario reconstruction, as was described in Section D.4. It is especially noteworthy that with the addition of management responses the Inflation scenario is no longer the most adverse scenario and the Reserve Misestimation scenario is now the most adverse scenario. Insurance Corporation of British Columbia June 30,
47 ICBC s June 30, 2008 Filing with the BC Utilities Commission 36. ICBC management believes the 130% management MCT target, which has a probability in the 10% to 5% range of falling below the regulatory minimum target, is appropriate, and that using the more severe adverse scenarios, which were originally created for the purpose of testing solvency, would result in a management MCT target that is overly protective. Using the plausible adverse scenarios of 1% probability, DCAT (solvency) testing shows that the Basic insurance has a satisfactory financial condition, meaning that there is a low risk that ICBC Basic insurance will become insolvent in the foreseeable future. F SUMMARY 37. In summary, ICBC management is of the view that the current management target MCT ratio of 130% remains appropriate for Basic insurance and the Board of Directors of ICBC has reaffirmed the appropriateness of the current capital management MCT target of 130% for Basic insurance. Insurance Corporation of British Columbia June 30,
48 ICBC s June 30, 2008 Filing with the BC Utilities Commission EXHIBIT 1 BRIDGING THE DIFFERENCES IN THE RESULTS BETWEEN THE 2006 ECKLER AND 2007 FFAM DCAT ANALYSES Table 1 : Steps of the Bridging Step DCAT Analysis Description 0 Eckler Eckler FFAM FFAM FFAM 2007 Step 0 is the starting point, which is the result of the DCAT analysis presented in the 2007 Revenue Requirements Application, Appendix 6.2 A, p. 26. The results are based on data as at year end Step 1 restates Step 0 according to the changes to the CICA Handbook and revisions to the MCT Guideline. These figures match the response to information request RR BCUC.35.1, where further details can be found. Step 2 presents the shift to the FFAM model from the Eckler model. The FFAM model results are based on data valued as at year end In this step, however, the parameter related to reserve volatility in the Reserve Misestimation scenario is not updated. This is done separately in Step 3. Step 3 differs from Step 2 in that the Misestimation scenario assumption is updated using new information about the volatility about the Basic insurance only unpaid claims liabilities, where previously this assumption was based on total corporate unpaid claims liabilities. Step 4 reconstructs the scenarios of Step 3. All of the scenarios in Step 4 are stated at the 20% probability level, and may include an enhanced management response. Exhibit 3 provides the definitions of the adverse scenarios with 20% probability. Table 2: Indicated MCT Target Ratios (probability range from 10% to 20%) Step Scenarios Adverse Loss Ratio Reserve Misestimation Inflation Asset Deterioration Average 0 110% 122% 155% 125% 128% 1 109% 121% 147% 128% 126% 2 108% 122% 150% 133% 128% 3 108% 140% 150% 133% 133% 4 109% 137% 121% 112% 120% Insurance Corporation of British Columbia June 30,
49 ICBC s June 30, 2008 Filing with the BC Utilities Commission EXHIBIT 2 ADVERSE SCENARIOS DESCRIPTIONS For 2006 ICBC Basic DCAT Analysis ADVERSE LOSS RATIO SCENARIO: Adverse Loss Ratio 80: Loss ratio deterioration (occurs in 2007). The 2007 loss ratio deterioration varies by coverage and was set using a 20% probability. RESERVE MISESTIMATION SCENARIO: Reserve Misestimation - 80: The misestimation on prior years unpaid claims (2005 and prior) varies by coverage and was set using a 20% probability. Loss ratio deterioration (occurs in 2006 and 2007) varies by coverage. Result of the above misestimation. INFLATION SCENARIO: Unanticipated Inflation: Claims payments from prior years unpaid claims (2005 and prior) were increased by 0.75% each year for three years and then remained at that level. Claims payments for projected years (2006 and on) were increased by 1.5% each year for three years and then remained at that level. Base Scenario General Expenses were increased by 1.5% each year for three years and then remained at that level. Upward Yield Curve Shift of 75 basis points (parallel). ASSET DETERIORATION SCENARIO: Asset Decline: 10% decline in Common Stock Earnings Rate (occurs in 2007). 20% decline in Real Estate Earnings Rate (occurs in 2007). Upward Yield Curve Shift of 75 basis points (parallel). Insurance Corporation of British Columbia June 30,
50 ICBC s June 30, 2008 Filing with the BC Utilities Commission EXHIBIT 3 ADVERSE SCENARIOS DESCRIPTIONS For 2007 ICBC Basic DCAT Analysis ADVERSE LOSS RATIO SCENARIOS: 20% probability scenario: Description: Loss ratio deterioration (occurs in 2008). The 2008 Loss ratio deterioration varies by coverage and was set using probability level of 20%. Impact: 3.3% Loss ratio deterioration for Basic insurance business in year Management response 2 : Premium rate increases of 0.66% in excess of those previously planned for Basic insurance business effective in % probability scenario: Description: Loss ratio deterioration (occurs in 2008). The 2008 loss ratio deterioration varies by coverage and was set using probability level of 5%. Impact: 6.4% loss ratio deterioration for Basic insurance business in year Management response: Premium rate increases of 1.28% in excess of those previously planned for Basic insurance business effective in % probability scenario: Description: Loss ratio deterioration (occurs in 2008). The 2008 loss ratio deterioration varies by coverage and was set using probability level of 2.5%. Impact: 7.6% loss ratio deterioration for Basic insurance business in year Management response: Premium rate increases of 1.52% in excess of those previously planned for Basic insurance business effective in % probability scenario: Description: Loss ratio deterioration (occurs in 2008). The 2008 loss ratio deterioration varies by coverage and was set using probability level of 1%. Impact: 9.1% loss ratio deterioration for Basic insurance business in year Reasoning for the management response: Since this is a one time event and the rate indication analysis used the last five-year weighted average losses, the impact of 2008 adverse loss ratio deterioration can be spread into the next five years starting Insurance Corporation of British Columbia June 30,
51 ICBC s June 30, 2008 Filing with the BC Utilities Commission Management response: Premium rate increases of 1.82% in excess of those previously planned for Basic insurance business effective in RESERVE MISESTIMATION SCENARIOS: 20% probability scenario: Description: The misestimation on prior years unpaid claims (2006 and prior) varies by coverage and was set using a 20% probability. Loss ratio deterioration (occurs in 2007 and 2008) varies by coverage. Result of the above misestimation. Impact: 5.1% adverse development to unpaid claims as of year end % loss ratio deterioration in accident year 2007 and 2.1% loss ratio deterioration in accident year 2008 for Basic insurance business. Management response: Premium rate increases of 0.82% in excess of those previously planned for Basic insurance business effective in Premium rate increases of 0.42% in excess of those previously planned for Basic insurance business effective in These additional rate increases would be kept in the rates for five consecutive years and then withdrawn. 5% probability scenario: Description: The misestimation on prior years unpaid claims (2006 and prior) varies by coverage and was set using a 5% probability. Loss ratio deterioration (occurs in 2007 and 2008) varies by coverage. Result of the above misestimation. Impact: 7.6% adverse development to unpaid claims as of year end % loss ratio deterioration in accident year 2007 and 3.0% loss ratio deterioration in accident year 2008 for Basic insurance business. Management response: Premium rate increases of 1.22% in excess of those previously planned for Basic insurance business effective in Premium rate increases in excess of those previously planned of 0.60% for Basic insurance business effective in These additional rate increases would be kept in the rates for five consecutive years and then withdrawn. 2.5% probability scenario: Description: The misestimation on prior years unpaid claims (2006 and prior) varies by coverage and was set using a 2.5% probability. Loss ratio deterioration (occurs in 2007 and 2008) varies by coverage. Result of the above misestimation. Impact: 8.6% adverse development to unpaid claims as of year end % loss ratio deterioration in accident year 2007 and 3.4% loss ratio deterioration in accident year 2008 for Basic insurance business. Insurance Corporation of British Columbia June 30,
52 ICBC s June 30, 2008 Filing with the BC Utilities Commission Management response: Premium rate increases of 1.38% in excess of those previously planned for Basic insurance business effective in Premium rate increases in excess of those previously planned of 0.68% for Basic insurance business effective in These additional rate increases would be kept in the rates for five consecutive years and then withdrawn. 1% probability scenario: Description: The misestimation on prior years unpaid claims (2006 and prior) varies by coverage and was set using a 1% probability. Loss ratio deterioration (occurs in 2007 and 2008) varies by coverage. Result of the above misestimation. Impact: 9.8% adverse development to unpaid claims as of year end 2006, 7.8% loss ratio deterioration in accident year 2007 and 3.9% loss ratio deterioration in accident year 2008 for Basic insurance business. Management response: Premium rate increases of 1.56% in excess of those previously planned for Basic insurance business effective in Premium rate increases of 0.78% in excess of those previously planned for Basic insurance business effective in These additional rate increases would be kept in the rates for five consecutive years and then withdrawn. INFLATION SCENARIOS: 20% probability scenario: Description: Claims payments from prior years unpaid claims (2006 and prior) were increased by 0.25% each year for five years and then remained at that level. Claims payments for projected years (2007 and on) were increased by 0.5% each year for five years and then remained at that level. Base Scenario General Expenses were increased by 0.5% each year for five years and then remained at that level. Impact: Upward Yield Curve Shift of 20 basis points (parallel). Management response: Premium rate increases of 1% in excess of those previously planned for Basic insurance business effective in 2008, 0.5% effective in 2009, 0.5% effective in 2010, and 0.5% effective in % probability scenario: Description: Claims payments from prior years unpaid claims (2006 and prior) were increased by 0.75% each year for five years and then remained at that level. Claims payments for projected years (2007 and on) were increased by 1.5% each year for five years and then remained at that level. Insurance Corporation of British Columbia June 30,
53 ICBC s June 30, 2008 Filing with the BC Utilities Commission Base Scenario General Expenses were increased by 1.5% each year for five years and then remained at that level. Impact: Upward Yield Curve Shift of 75 basis points (parallel). Management response: Premium rate increases of 3% in excess of those previously planned for Basic insurance business effective in 2008, 1.5% effective in 2009, 1.5% effective in 2010, and 1.5% effective in % probability scenario: Description: Claims payments from prior years unpaid claims (2006 and prior) were increased by 1.125% each year for five years and then remained at that level. Claims payments for projected years (2007 and on) were increased by 2.25% each year for five years and then remained at that level. Base Scenario General Expenses were increased by 2.25% each year for five years and then remained at that level. Impact: Upward Yield Curve Shift of 100 basis points (parallel). Management response: Premium rate increases of 4.5% in excess of those previously planned for Basic insurance business effective in 2008, 2.25% effective in 2009, 2.25% effective in 2010, and 2.25% effective in % probability scenario: Description: Claims payments from prior years unpaid claims (2006 and prior) were increased by 1.5% each year for five years and then remained at that level. Claims payments for projected years (2007 and on) were increased by 3% each year for five years and then remained at that level. Base Scenario General Expenses were increased by 3% each year for five years and then remained at that level. Impact: Upward Yield Curve Shift of 150 basis points (parallel). Management response: Premium rate increases of 6% in excess of those previously planned for Basic insurance business effective in 2008, 3% effective in 2009, 3% effective in 2010, and 3% effective in ASSET DETERIORATION SCENARIOS: 20% probability scenario: Description: 0.15% decline in Equity Earnings Rate (occurs in 2008). Impact: Upward Yield Curve Shift of 20 basis points (parallel). Insurance Corporation of British Columbia June 30,
54 ICBC s June 30, 2008 Filing with the BC Utilities Commission 5% probability scenario: Description: 10% decline in Equity Earnings Rate (occurs in 2008). Impact: Upward Yield Curve Shift of 150 basis points (parallel). 2.5% probability scenario: Description: 20% decline in Equity Earnings Rate (occurs in 2008). Impact: Upward Yield Curve Shift of 150 basis points (parallel). 1% probability scenario: Description: 25% decline in Equity Earnings Rate (occurs in 2008). Impact: Upward Yield Curve Shift of 150 basis points (parallel). Management response: Where a capital deficiency results from these adverse scenarios, a premium rate increase of 1/5 the capital deficiency is sought in addition to those rate changes previously planned 3, with the rate change effective in the year following the occurrence of the capital deficiency. 3 According to the Commission s determination on the ICBC Basic Insurance Capital Management Plan, as set out in Chapter 6.2 of the 2007 Revenue Requirements Application, ICBC should implement a policy which reflects any deficiency in capital available to meet management target MCT ratios being recovered at the rate of 1/5 per year. Insurance Corporation of British Columbia June 30,
55 British Columbia Utilities Commission Information Request No RR BCUC.74.1 Dated 12 January Page 1 of RR BCUC.74.1 Reference: CAPITAL MANAGEMENT PLAN Exhibit B-5, RR BCUC MCT In response to RR BCUC , ICBC states: With the implementation of a high yield bond allocation, the asset decline plausible adverse scenario assumes poor returns or a decline in the value of both invested equities and high yield bonds. Previously, only invested equities were impacted by the asset decline scenario. This change in investment policy would slightly reduce the impact of the asset decline scenario, all else equal, because high yield bonds are assumed to be less risky as compared to invested equities in the risk adequacy analysis. Please quantify the impact that the shift in investment policy to high yield bonds and real estate has had in reducing the asset decline stress test adequacy. Response: Please see the calculation below for the high-level estimate of the impact on the adverse scenario from the shift in investment policy from equities to high yield bonds and real estate. The shift in investment policy has resulted in a slight reduction in the impact of the asset decline plausible adverse scenario by approximately $37 million, which is equivalent to about 3 percentage points of MCT. This is mainly due to the shift from equities to real estate ($31 million out of the $37 million) as real estate is not stressed in this adverse scenario. ICBC will consider stressing real estate and/or other asset classes, in addition to equities and high yield bonds, in its risk adequacy analysis, as discussed in the response to information request RR.BCUC.75.1.
56 British Columbia Utilities Commission Information Request No RR BCUC.74.1 Dated 12 January Page 2 of 2 Asset Mix a. Total Equities (2013 Analysis) 22.5% b. Total Equities (2015 Analysis) 15.9% c. High Yield Bonds (2015 Analysis) 5.0% d. Real Estate Re-Allocation (a - b - c) 1.6% Adverse Annual Return Assumptions (2015 Analysis) e. Equities -14.6% f. High Yield Bonds -13.4% Annual Return Assumption (2015 Analysis) g. Real Estate* 4.4% Basic Investment Portfolio in ($'000s) h. Total (2015 Analysis) 10,200,000 Impacts ($'000s) i. High Yield Bond (h x c x [f - e]) 6,000 j. Real Estate Re-Allocation (h x d x [g - e]) 31,000 Total 37,000 * Based on ICBC's 2015 Q1 investment forecast
57 British Columbia Utilities Commission Information Request No RR BCUC.75.1 Dated 12 January Page 1 of RR BCUC.75.1 Reference: CAPITAL MANAGEMENT PLAN Exhibit B-5, RR BCUC Target MCT margin In response to RR BCUC , ICBC states that The 1 in 10 year asset decline plausible adverse scenario assumes a 0.5% decline in the investment assets. Please confirm that this implies that ICBC assumes there is a one in ten chance that the investment assets will decline by up to 0.5% in a given year based on the stated market value. If not confirmed, please clarify. Response: Please note that the use of the phrase up to that was included in the information request is not correct, as the impact of the 1 in 10 year asset decline adverse scenario assumes a decline of 0.5% of ICBC s investment assets, not less. A decline of 0.5% in ICBC s investment assets may occur more frequently than once in a given 10-year period. The 1 in 10 year asset decline plausible adverse scenario in the 2015 risk adequacy analysis assumes a decline in the market value of equities and high yield bonds only, which together represent about 21% of ICBC s investment portfolio. Other investment assets such as government bonds, mortgages, and real estate are not expected to decline in this scenario, even though they do exhibit some volatility as discussed in the response to information request RR BCOAPO Please note that ICBC plans to revisit this assumption in the risk adequacy analysis.
58 British Columbia Utilities Commission Information Request No RR BCUC.75.2 Dated 12 January Page 1 of RR BCUC.75.2 Reference: CAPITAL MANAGEMENT PLAN Exhibit B-5, RR BCUC Target MCT margin In response to RR BCUC , ICBC states that The 1 in 10 year asset decline plausible adverse scenario assumes a 0.5% decline in the investment assets. What portion of the investment assets (as stated at market value each year) have essentially no volatility, and are therefore not subject to a market decline? Response: Theoretically, all asset classes have the potential for exhibiting some volatility as discussed in the response to information request RR BCOAPO However, the investment asset that exhibits the least amount of volatility is the cash/money market investments. Cash/money market investments represent less than 2% of ICBC s investment portfolio.
59 British Columbia Utilities Commission Information Request No RR BCUC.76.1 Dated 12 January Page 1 of RR BCUC.76.1 Reference: OPERATING EXPENSES AND ALLOCATION INFORMATION Exhibit B-1-1, Chapter 4, p. 4-15; 2013 RRA, Exhibit B-3-1, BCUC IR 115.2; 2014 RRA Decision, p. 18; Exhibit B-5, RR BCUC Savings associated with the Transformation Program (TP) During the 2013 RRA proceeding, ICBC submitted in its response to BCUC IR (Exhibit B-3-1) 1 that: The benefit of Claims Transformation is expected to be realized gradually over time, anticipated as follows: In its response to RR BCUC.39.1 ICBC provides a table with the latest benefits related to Claims Transformation and notes that [t]he full-time equivalent (FTE) reduction and corresponding savings are now presented in two categories: savings realized by year-end and cost avoidance. In its response to RR BCUC ICBC provides a table that demonstrates the format ICBC proposes to use in the 2017 Revenue Requirements Application to report on the savings associated with the Transformation Program With respect to the table provided in response to BCUC IR in the 2013 RRA proceeding, does the FTE Reductions Realized by Year End row and the Annual Compensation Savings Realized row include both savings realized by year-end and cost avoidance? Please explain why or why not If the answer to the aforementioned information request is yes, please provide a breakdown of the FTE Reductions Realized by Year End row and the Annual Compensation Savings Realized between savings realized by year-end and cost avoidance for each of 2013, 2014, 2015 and. 1

60 British Columbia Utilities Commission Information Request No RR BCUC.76.1 Dated 12 January Page 2 of 2 Response: The table provided in the response to information request RR BCUC reflects projected cumulative FTE savings expected to be realized if the claims volume-complexity mix remained the same as in As such, the benefits in the referenced table for 2013 through were assumed to be fully realizable (i.e., all FTEs allocated to savings realized), and does not include any cost avoidance. Please note that the table provided in the response to information request RR BCUC was revised and re-issued on February 12, 2014 (Exhibit B-21) during the 2013 Revenue Requirements Proceeding, as shown below.
61 British Columbia Utilities Commission Information Request No RR BCUC.76.2 Dated 12 January Page 1 of RR BCUC.76.2 Reference: OPERATING EXPENSES AND ALLOCATION INFORMATION Exhibit B-1-1, Chapter 4, p. 4-15; 2013 RRA, Exhibit B-3-1, BCUC IR 115.2; 2014 RRA Decision, p. 18; Exhibit B-5, RR BCUC Savings associated with the Transformation Program (TP) During the 2013 RRA proceeding, ICBC submitted in its response to BCUC IR (Exhibit B-3-1) 1 that: The benefit of Claims Transformation is expected to be realized gradually over time, anticipated as follows: In its response to RR BCUC.39.1 ICBC provides a table with the latest benefits related to Claims Transformation and notes that [t]he full-time equivalent (FTE) reduction and corresponding savings are now presented in two categories: savings realized by year-end and cost avoidance. In its response to RR BCUC ICBC provides a table that demonstrates the format ICBC proposes to use in the 2017 Revenue Requirements Application to report on the savings associated with the Transformation Program. For each of 2013, 2014, 2015 and, please explain the difference in the FTE reductions realized year year-end only (i.e. not including the FTE reductions due to cost avoidance) between the table provided in response to BCUC IR in the 2013 RRA proceeding and the table provided in response to RR BCUC.39.1 in the current proceeding. 1 Response: The cumulative benefits estimated in the table in the response to information request RR BCUC (the 2013 table), and updated as indicated in the response to information request RR BCUC.76.1, were based on 2012 project assumptions. These assumptions included
62 British Columbia Utilities Commission Information Request No RR BCUC.76.2 Dated 12 January Page 2 of 3 ClaimCenter go-live dates occurring in 2013, with steady state benefit realization occurring by the end of In comparison, the table in the response to information request RR BCUC.39.1, filed in the response to information request RR BCUC (the 2015 revised table) reflects the cumulative benefits based on the actual implementation of ClaimCenter (completed in Q2 2014), and revised estimate for the co-existence period. Because of the changes in the completion of Claims Transformation, it is now assumed that steady state benefit realization will occur by the end of 2018, as compared to the end of The comparison of FTE reductions in the 2013 table to the FTE reductions (realized) in the 2015 revised table by year is as follows: Year 2013 The cumulative FTE reductions in the 2013 table estimated no additional savings in 2013 as this was the original go-live date. The 10 FTE reduction shown in the table was realized in Q when the new Claims Division functional organizational model was implemented. In comparison, the 2015 revised table showed that, in addition to the 10 FTE reduction realized in Q4 2011, a further reduction of 43 FTEs could be attributed to Claims Transformation due to early productivity gains from greater work specialization introduced by the new Claims job hierarchy implemented in Q These savings were realized earlier than originally projected. Year 2014 In comparison to the 2013 table, the 2015 revised table shows that 2014 actuals were lower than projected. The lower FTE savings reflects the new ClaimCenter implementation completion date of April 2014, and the hiring of additional call centre staff to mitigate initial system implementation impacts as staff became accustomed to the new processes and system. These factors resulted in lower actual savings in comparison to those estimated in 2012.
63 British Columbia Utilities Commission Information Request No RR BCUC.76.2 Dated 12 January Page 3 of 3 Year 2015 and The estimated FTE reductions in the 2015 revised table reflect the revised steady state benefit realization timeframes resulting from the actual ClaimCenter implementation timeframes and coexistence of legacy and ClaimCenter beyond 2015.
64 British Columbia Utilities Commission Information Request No RR BCUC.76.3 Dated 12 January Page 1 of RR BCUC.76.3 Reference: OPERATING EXPENSES AND ALLOCATION INFORMATION Exhibit B-1-1, Chapter 4, p. 4-15; 2013 RRA, Exhibit B-3-1, BCUC IR 115.2; 2014 RRA Decision, p. 18; Exhibit B-5, RR BCUC Savings associated with the Transformation Program (TP) During the 2013 RRA proceeding, ICBC submitted in its response to BCUC IR (Exhibit B-3-1) 1 that: The benefit of Claims Transformation is expected to be realized gradually over time, anticipated as follows: In its response to RR BCUC.39.1 ICBC provides a table with the latest benefits related to Claims Transformation and notes that [t]he full-time equivalent (FTE) reduction and corresponding savings are now presented in two categories: savings realized by year-end and cost avoidance. In its response to RR BCUC ICBC provides a table that demonstrates the format ICBC proposes to use in the 2017 Revenue Requirements Application to report on the savings associated with the Transformation Program With respect to the table provided in response to RR BCUC , does ICBC consider it appropriate to include forecast and actual project savings for each year with an explanation for significant variances? If not, please explain why not Does ICBC consider it appropriate to provide a breakdown of row B (Operating Expenses Impacted by Claims Transformation Program) and row C (Claims Cost Savings) by expense category in table provided in response to RR BCUC ? If not, please explain why not. 1
65 British Columbia Utilities Commission Information Request No RR BCUC.76.3 Dated 12 January Page 2 of 2 Response: 76.3 Yes, ICBC considers it appropriate to include the forecast and actual project savings for each year with an explanation of the significant variances At an aggregate level, ICBC can provide the numbers for rows B and C. However, providing a breakdown of rows B and C by expense category as per the table provided in response to information request RR BCUC would be difficult. Getting precision on the numbers will be a challenge as there are a number of costs involved that ICBC currently does not track separately. In addition, conducting a breakdown of the costs would require subjective assessment of cost allocation. Overall, significant effort would be required to provide the breakdown by expense category.
66 British Columbia Utilities Commission Information Request No RR BCUC.77.1 Dated 12 January Page 1 of RR BCUC.77.1 Reference: OPERATING EXPENSES AND ALLOCATION INFORMATION Exhibit B-1-1, Chapter 4, pp. 4B-2, 4E-1-4E-3; 2014 RRA Decision, p. 19; Exhibit B-5, RR BCUC Costs outside the Transformation Program foundational scope In its response RR BCUC.40.1, ICBC provides an expanded table of costs shifted outside of the Transformation Program. In its response to RR BCUC , ICBC provides Attachment A - Response to Information Request RR BCUC On page 3 of 7 of Attachment A, ICBC lists a variety of factors that are considered in order to determine whether or not functions or elements are foundational to the Transformation Program, including: Are the work project elements essential to delivering the Claims and Insurance transformation?... Would the work need to be done regardless of whether TP existed. In its response to RR BCUC.40.4, ICBC submits that The parallel processing costs are the total costs of operating the legacy system With respect to the parallel processing costs, please provide an explanation for the variance between 2014 Outlook and 2014 Actual costs and provide the impact of this variance on both the 2015 policy year rate indication and Basic Capital, if any Please provide an explanation for the increase in Parallel Processing Costs in fiscal as compared to prior years. Response: 77.1 The planned parallel processing costs for 2014 were $4.2 million. This includes the incremental $1.2 million (Basic insurance and Optional insurance amounts combined, as provided in the 2014 Outlook in the response to information request RR BCUC.40.1) required to manage the claims legacy systems in parallel with the new claims management system. Total spend on managing claims legacy systems in 2014 was $3.7 million. Therefore, as at the end of 2014, there was a favourable variance of $0.5 million ($4.2 million minus $3.7 million). This is primarily due to lower than forecast external professional services costs for 2014.
67 British Columbia Utilities Commission Information Request No RR BCUC.77.1 Dated 12 January Page 2 of 2 As the $0.5 million favourable variance relates to calendar year 2014, and 2015 policy year relates to calendar years 2015 to 2017, the 2014 favourable variance has no impact on the 2015 policy year rate indication Parallel processing costs represent the cost of operating the legacy system once a new system is implemented until legacy systems are decommissioned. The anticipated increase in parallel processing costs in fiscal year as compared to prior years, is due to the addition of parallel processing costs related to the new Policy Administration System, which is planned for implementation in.
68 British Columbia Utilities Commission Information Request No RR BCUC.77.2 Dated 12 January Page 1 of RR BCUC.77.2 Reference: OPERATING EXPENSES AND ALLOCATION INFORMATION Exhibit B-1-1, Chapter 4, pp. 4B-2, 4E-1-4E-3; 2014 RRA Decision, p. 19; Exhibit B-5, RR BCUC Costs outside the Transformation Program foundational scope In its response RR BCUC.40.1, ICBC provides an expanded table of costs shifted outside of the Transformation Program. In its response to RR BCUC , ICBC provides Attachment A - Response to Information Request RR BCUC On page 3 of 7 of Attachment A, ICBC lists a variety of factors that are considered in order to determine whether or not functions or elements are foundational to the Transformation Program, including: Are the work project elements essential to delivering the Claims and Insurance transformation?... Would the work need to be done regardless of whether TP existed. In its response to RR BCUC.40.4, ICBC submits that The parallel processing costs are the total costs of operating the legacy system Given that the parallel processing costs are the total costs of operating the legacy system will there be a corresponding decrease in operating costs once the legacy system is decommissioned? Please explain why or why not Please indicate the year in which ICBC anticipates that the legacy system will be fully decommissioned and the forecast reduction in operating expenses at that time, by cost category. Response: 77.2 There will be a decrease in parallel processing costs once the legacy systems are decommissioned. However, many factors add upward pressures on operating costs, including inflation, and parallel processing costs are only 1% or less of the total operating costs. Overall, ICBC is committed to keeping controllable costs flat to As Insurance Transformation is currently underway and scheduled to complete in Q4, planning for the decommissioning of legacy systems is not expected to be completed before Q At that time, it can be determined when and how much parallel processing costs will reduce over time and the resulting impact to operating expenses.
69 British Columbia Utilities Commission Information Request No RR BCUC.77.3 Dated 12 January Page 1 of RR BCUC.77.3 Reference: OPERATING EXPENSES AND ALLOCATION INFORMATION Exhibit B-1-1, Chapter 4, pp. 4B-2, 4E-1-4E-3; 2014 RRA Decision, p. 19; Exhibit B-5, RR BCUC Costs outside the Transformation Program foundational scope In its response RR BCUC.40.1, ICBC provides an expanded table of costs shifted outside of the Transformation Program. In its response to RR BCUC , ICBC provides Attachment A - Response to Information Request RR BCUC On page 3 of 7 of Attachment A, ICBC lists a variety of factors that are considered in order to determine whether or not functions or elements are foundational to the Transformation Program, including: Are the work project elements essential to delivering the Claims and Insurance transformation?... Would the work need to be done regardless of whether TP existed. In its response to RR BCUC.40.4, ICBC submits that The parallel processing costs are the total costs of operating the legacy system With respect to the Claims Data Migration, please explain if these costs would be incurred regardless of whether the Transformation Program existed Would the complete Claims and Insurance transformation be possible in the absence of Claims Data Migration? Please explain why or why not. Response: 77.3 If ICBC had not undertaken the Transformation Program (TP), there would likely have been some other initiative to address the challenges of ICBC s legacy systems reaching end of life. Therefore, ICBC cannot confirm whether claims data migration costs would be incurred regardless of TP. Further, the Government Directive regarding TP does not provide any specific direction to include claims data migration within TP scope and directs that [p]ostimplementation costs and ongoing operating costs associated with the systems and processes implemented as part of the Transformation Program are out of scope of TP. ICBC sought guidance on common practices of large scale transformation programs on components considered to be project costs versus ongoing business/operations costs. Based on the input received and the Government Directive, ICBC s management determined that claims data migration costs are not core to TP, and should be incurred operationally.
70 British Columbia Utilities Commission Information Request No RR BCUC.77.3 Dated 12 January Page 2 of Migration of data from the old systems to the new systems is not essential to complete the transformation. Claims and Insurance Transformation complete when these divisions move over to the new systems and business processes developed under TP. Currently, all new claims at ICBC are managed in the new claims management system, however some long-tail claims continue to be managed in legacy systems. Claims that remain open in legacy systems will reduce over time as they are resolved, and eventually very few, or no claims, will be left in these legacy systems. This could result in completion of Claims Transformation without migration of claims data.
71 British Columbia Utilities Commission Information Request No RR BCUC.78.1 Dated 12 January Page 1 of RR BCUC.78.1 Reference: OPERATING EXPENSES AND ALLOCATION INFORMATION Exhibit B-1-1, Chapter 4, p. 4B-2; Exhibit B-5, RR BCUC.40.1 Costs outside the Transformation Program foundational scope On page 4B-2 of Exhibit B-1-1, ICBC submits the following: Projects expense in 2014 was $20 million, $8 million higher than forecast ($12 million). This variance is due to the incorporation in corporate operating expense of projects that were determined not to be foundational to TP and thus outside of the scope of costs to be funded by Optional insurance set out by the Government Directive regarding TP, but with which ICBC has decided to proceed. Figure 4.4 on page 4-12 of Exhibit B-1-1 includes a table of operating expenses by expense category. The Project category costs are $20 million in 2014 Actual and $17 million in 2013 Actual, a reduction of $3 million. In its response to RR BCUC.40.1, ICBC provides a summary of the costs shifted out of the Transformation Program. Claim data migration project costs are $8.410 million in 2014 Actual and $1.241 million in 2015, a reduction of $7.169 million. The claim data migration project costs are reduced by $7.169 million in fiscal 2015 as compared to actual 2014 and the total project costs are only reduced by $3 million over the same time period, a difference of $4.169 million. Please explain why the total project costs have not been reduced to reflect the reduction in claim data migration project costs. Response: Each year, total project costs are based on a large number of factors, including ICBC s corporate strategy, business requirements, financial and resource planning assumptions, timing, and capital (expense allocation of projects planned). Due to the large number of factors, project costs vary from year to year. In 2015, while the Claims Data Migration Project costs were reduced by about $7 million from 2014, other projects costs have partially offset this decrease (for reasons described above) resulting in a net 2015 project cost reduction of $3 million from 2014.
72 British Columbia Utilities Commission Information Request No RR BCUC Dated 12 January Page 1 of RR BCUC Reference: OPERATING EXPENSES AND ALLOCATION INFORMATION Exhibit B-1-1, Chapter 4, p. 4-21; Exhibit B-5, RR BCUC Other operating expenses In its response to RR BCUC , ICBC submits that the 2015 Outlook reflects a negative value of $6 million as a corporate budget adjustment. ICBC has challenged its divisions to better manage costs within their own respective divisional operating budget targets in order to achieve the corporate controllable cost target Please discuss why ICBC has included a negative corporate budget adjustment of $6 million rather than reducing divisional operating budgets by $6 million What is the impact on the policy year 2015 rate indication of including the negative corporate budget adjustment of $6 million? 79.3 Does ICBC know which operating expense cost categories are expected to reflect the $6 million reduction for fiscal 2015? If so, please provide a breakdown of the $6 million by cost category. If not, please explain why not In the event that the $6 million cost reduction is not achieved, please explain the impact on Basic insurance policy holders. Response: 79.1 ICBC was trending to be on target with the 2015 Outlook when it was developed in Q2. When financial challenges emerged in Q3 2015, ICBC management did a deeper and more aggressive review of cost savings, and was able to identify an additional one-time, high-level estimated savings of $6 million. However, details at the divisional level could not be established before ICBC s filing on October 15, As outlined below, the impact of the adjustment on the 2015 rate indication is nil. However, the cost savings will improve Basic net income and will contribute positively to the Basic Minimum Capital Test ratio in the future because, as discussed in the response to information request RR BCOAPO.20.1, ICBC operates in a closed system.
73 British Columbia Utilities Commission Information Request No RR BCUC Dated 12 January Page 2 of 2 The $6 million reduction is unique to As calendar year 2015 expenses contribute 1.4% to policy year 2015 (from the Application, Chapter 2, Exhibit H.1, row (a)), and using an approximate allocation of 60% to Basic insurance, the 2015 policy year impact is $50,400 ($6 million x 1.4% x 60% Basic) divided by the Basic projected premium of $2.7 billion (from the Application, Chapter 2, Exhibit A.0.1, row (x)), the impact has less than a 0.01% impact on the 2015 rate indication and is considered to have a nil rate indication impact ICBC expects most of the $6 million reduction will be from compensation based on vacancy management to date Based on preliminary 2015 results, it is likely that the $6 million saving was achieved. The impact on the 2015 rate indication is nil, as explained in the response to information request RR BCUC.79.2 above.
74 British Columbia Utilities Commission Information Request No RR BCUC.80.1 Dated 12 January Page 1 of RR BCUC.80.1 Reference: Operating Expenses and Allocation Information Exhibit B-1, Chapter 4, Appendix 4 D, pp. 4D-4 to 4D-5; Exhibit B-5, RR BCUC.51.2; RR BCUC.51.3 Detailed Work Effort Study and Allocation Information Regarding the 2014 Customer and Injury Services Operations Detailed Work Effort Study (2014 Detailed WES), on pages 4D-4 and 4D-5 of Exhibit B-1, ICBC states: Where it becomes aware of future operating changes having a significant impact on the allocation methodology, ICBC will advise the Commission of the impacts and bring forward proposals for any changes that it believes are required. In response to RR BCUC.51.2, ICBC states: ICBC will monitor and assess the impact of operating changes on allocators and include any proposed alterations to allocators in future revenue requirements applications as it has done with respect to the Claims Division as directed by the Commission. In response to RR BCUC.51.3, ICBC states: As discussed in the 2013 Revenue Requirements Proceeding, once the Transformation Program is completed and there is a period of stability, ICBC will bring forward an application to simplify the allocation methodology, including a more efficient allocator for CISO operational costs Is it ICBC s position that the Commission should accept the 2014 Detailed WES and make no further directives regarding any future reporting of the work effort study until ICBC informs the Commission otherwise? Please clarify If the Commission in this Decision sets a timeline for an update of the 2014 Customer and Injury Services Operations Detailed Work Effort Study, when does ICBC suggest that it be filed? Response: 80.1 ICBC believes the results of the 2014 Detailed WES should be accepted by the Commission without further direction. As encouraged by the Commission in Letter L-7-15, ICBC has already incorporated the 2014 Detailed WES in the. Regarding future reporting of the WES, ICBC is of the view that, in the absence of any Claims business change that would significantly affect the underlying transaction costing methodology,
75 British Columbia Utilities Commission Information Request No RR BCUC.80.1 Dated 12 January Page 2 of 2 the 2014 work effort percentages (WEPs) should continue to be used at least until ICBC files an application to simplify the allocation methodology. ICBC believes that updating the 2014 WEPs is not required in the short to intermediate term, since the organizational and business process changes that have been implemented under Claims Transformation should result in less variability in claims file handling and adjuster caseloads than would have been the case prior to Claims Transformation (under the regionally based organizational model). Post Claims Transformation, the new functional organizational model and new claims management system better enables workload (claims volume) balancing and uniform claim file handling - through automated distribution of claim files by claim type, risk and complexity (as discussed in paragraph 33 of the 2014 Detailed WES filing) and through organization of Claims Division staff under either the injury or non-injury work streams. As a result, the 2014 WEPs should be less variable than was the case prior to Claims Transformation, and the need to update the WEP s should not be required in the short to intermediate term. Should significant Claims business change occur (that would significantly affect the underlying transaction costing methodology) prior to the allocation filing, ICBC would notify the Commission and, if required, bring forward a proposed approach to update the 2014 WEPs ICBC proposes that any update to the WES, if required, should take place after ICBC brings forward an application to simplify the allocation methodology. This timeline is consistent with the five-year timeline discussed in Commission Order G
76 British Columbia Utilities Commission Information Request No RR BCUC.80.2 Dated 12 January Page 1 of RR BCUC.80.2 Reference: Operating Expenses and Allocation Information Exhibit B-1, Chapter 4, Appendix 4 D, pp. 4D-4 to 4D-5; Exhibit B-5, RR BCUC.51.2; RR BCUC.51.3 Detailed Work Effort Study and Allocation Information Regarding the 2014 Customer and Injury Services Operations Detailed Work Effort Study (2014 Detailed WES), on pages 4D-4 and 4D-5 of Exhibit B-1, ICBC states: Where it becomes aware of future operating changes having a significant impact on the allocation methodology, ICBC will advise the Commission of the impacts and bring forward proposals for any changes that it believes are required. In response to RR BCUC.51.2, ICBC states: ICBC will monitor and assess the impact of operating changes on allocators and include any proposed alterations to allocators in future revenue requirements applications as it has done with respect to the Claims Division as directed by the Commission. In response to RR BCUC.51.3, ICBC states: As discussed in the 2013 Revenue Requirements Proceeding, once the Transformation Program is completed and there is a period of stability, ICBC will bring forward an application to simplify the allocation methodology, including a more efficient allocator for CISO operational costs. Please specify the timeframe as to when the Commission would expect ICBC to bring forward an application to simplify the allocation methodology. Response: The Transformation Program (TP) is expected to be completed by Q4. The Claims Transformation Project stabilization period was approximately 18 months in duration (completed in 2015) post implementation of the new claims management system. The Insurance Transformation Project, which involves replacement of ICBC s policy administration system, is considered to be even more complex due to interface with external users (brokers) and more system integration points. The stabilization period for Insurance Transformation is expected to be about 24 months. With the completion of TP in Q4 and a 2-year stabilization period, a realistic timeframe to bring forward an application to simplify the allocation methodology is 2019 or later.
77 British Columbia Utilities Commission Information Request No RR BCUC.81.1 Dated 12 January Page 1 of RR BCUC.81.1 Reference: PERFORMANCE MEASURES Exhibit B-5, RR BCUC.55.1 Basic Loss Ratio With respect to the deterioration in the Basic Loss Ratio, in RR BCUC.55.1 ICBC states that ICBC will continue to work with the provincial government to explore options to further help alleviate the challenge of increasing claims costs and the impact on insurance rates. What options are available to the government to help moderate the large increases in claims costs and which of those options are being supported by ICBC? Response: ICBC can comment generally on approaches available to the provincial government, but cannot respond on behalf of the provincial government and cannot discuss its own interactions with the provincial government for reasons of Cabinet confidentiality. 1 The provincial government does support the items outlined in ICBC s response to information request RR BCUC These include Claims Transformation, the fraud strategy, improving claim segmentation, strategies to address legal representation, investing in road safety, and exploring supplier strategies to improve customer access to treatments, streamline processes for ICBC s business partners, and provide predictability to claims costs. The provincial government also has the ability to legislate changes to the insurance products themselves. This Application is predicated on the existing legislative framework. 1 The principle is recognized in the provincial Freedom of Information and Protection of Privacy Act, which prevents the disclosure of information that would reveal the substance of deliberations of Cabinet and its committees, including any advice, recommendations, policy considerations, or draft legislation or regulations.
78 British Columbia Utilities Commission Information Request No RR BCUC.82.1 Dated 12 January Page 1 of RR BCUC.82.1 Reference: PERFORMANCE MEASURES Exhibit B-5, RR BCUC.56.1; RR BCUC ; RR BCUC Real Estate In response to RR BCUC.56.1, ICBC states: In the case of real estate, a benchmark equivalent to the consumer price index % aligns with the targeted return of the asset class and the expected return profile of real estate assets being sourced for investment. This is also consistent with the approach of several other large Canadian real estate investors. In response to RR BCUC.58.2, ICBC states: The real estate portfolio has performed below the benchmark primarily due to two factors. First, the benchmark distortions inflated benchmark returns over what was achievable in the ICBC portfolio. Second, the portfolio experienced several leasing challenges. Overall portfolio vacancy peaked in 2014 at close to 10% as a result of several tenant bankruptcies and lease terminations. This negatively impacted income returns as well as capital returns of the real estate portfolio. Since then, aggressive releasing efforts have restored portfolio occupancy to 98%. In response to RR BCUC , ICBC states: ICBC is forgoing the Customized IPD Index in favour of the Canadian consumer price index (CPI) % in response to unexpected distortions in returns of the Customized IPD Index that are associated with the benchmark construction Given the struggles associated with using market indexes to benchmark real estate performance, ICBC transitioned to an absolute return performance benchmark set as the CPI plus a hurdle rate of 4.25% before costs, or 4.0% after costs. This benchmark aligns with ICBC s targeted rate of return for the asset class. The approach aligns with the absolute return benchmark used by other plans and aligns with the performance benchmarks used by other institutional real estate investment managers. However, in the ICBC 2014 Revenue Requirements, Exhibit B-13, RR BCUC.46.2, ICBC states 2 : ICBC invests in real estate for the income yield of CPI % and this income stream closely mirrors the annual income return on the REAL/pac IPD Canadian Property Index. With respect to RR BCUC.56.1, please confirm that ICBC is referring to the list of Canadian real estate investors provided in the ICBC 2014 Revenue Requirements, Exhibit B-13, RR BCUC If not confirmed, please update. 2
79 British Columbia Utilities Commission Information Request No RR BCUC.82.1 Dated 12 January Page 2 of 2 Response: With respect to the response to information request RR BCUC.56.1, please refer to the list of Canadian real estate investors provided in the response to information request RR BCUC.82.5.
80 British Columbia Utilities Commission Information Request No RR BCUC.82.2 Dated 12 January Page 1 of RR BCUC.82.2 Reference: PERFORMANCE MEASURES Exhibit B-5, RR BCUC.56.1; RR BCUC ; RR BCUC Real Estate In response to RR BCUC.56.1, ICBC states: In the case of real estate, a benchmark equivalent to the consumer price index % aligns with the targeted return of the asset class and the expected return profile of real estate assets being sourced for investment. This is also consistent with the approach of several other large Canadian real estate investors. In response to RR BCUC.58.2, ICBC states: The real estate portfolio has performed below the benchmark primarily due to two factors. First, the benchmark distortions inflated benchmark returns over what was achievable in the ICBC portfolio. Second, the portfolio experienced several leasing challenges. Overall portfolio vacancy peaked in 2014 at close to 10% as a result of several tenant bankruptcies and lease terminations. This negatively impacted income returns as well as capital returns of the real estate portfolio. Since then, aggressive releasing efforts have restored portfolio occupancy to 98%. In response to RR BCUC , ICBC states: ICBC is forgoing the Customized IPD Index in favour of the Canadian consumer price index (CPI) % in response to unexpected distortions in returns of the Customized IPD Index that are associated with the benchmark construction Given the struggles associated with using market indexes to benchmark real estate performance, ICBC transitioned to an absolute return performance benchmark set as the CPI plus a hurdle rate of 4.25% before costs, or 4.0% after costs. This benchmark aligns with ICBC s targeted rate of return for the asset class. The approach aligns with the absolute return benchmark used by other plans and aligns with the performance benchmarks used by other institutional real estate investment managers. However, in the ICBC 2014 Revenue Requirements, Exhibit B-13, RR BCUC.46.2, ICBC states 2 : ICBC invests in real estate for the income yield of CPI % and this income stream closely mirrors the annual income return on the REAL/pac IPD Canadian Property Index. Are there merits to have the real estate benchmark in the Statement of Investment Policy and Procedures (SIPP) be consistent with the New Money Rate formula for asset yield? Please explain why or why not. 2
81 British Columbia Utilities Commission Information Request No RR BCUC.82.2 Dated 12 January Page 2 of 2 Response: The real estate benchmark in the SIPP is designed to be a retrospective performance measure based on a targeted risk premium of 4.25% over a historic level of the CPI. In the New Money Rate formula, the return component for real estate is a prospective return expectation based on a targeted risk premium of 4.25% over an expected level of CPI. Each return is calculated for a distinct purpose and there is no particular merit to aligning the two.
82 British Columbia Utilities Commission Information Request No RR BCUC.82.3 Dated 12 January Page 1 of RR BCUC.82.3 Reference: PERFORMANCE MEASURES Exhibit B-5, RR BCUC.56.1; RR BCUC ; RR BCUC Real Estate In response to RR BCUC.56.1, ICBC states: In the case of real estate, a benchmark equivalent to the consumer price index % aligns with the targeted return of the asset class and the expected return profile of real estate assets being sourced for investment. This is also consistent with the approach of several other large Canadian real estate investors. In response to RR BCUC.58.2, ICBC states: The real estate portfolio has performed below the benchmark primarily due to two factors. First, the benchmark distortions inflated benchmark returns over what was achievable in the ICBC portfolio. Second, the portfolio experienced several leasing challenges. Overall portfolio vacancy peaked in 2014 at close to 10% as a result of several tenant bankruptcies and lease terminations. This negatively impacted income returns as well as capital returns of the real estate portfolio. Since then, aggressive releasing efforts have restored portfolio occupancy to 98%. In response to RR BCUC , ICBC states: ICBC is forgoing the Customized IPD Index in favour of the Canadian consumer price index (CPI) % in response to unexpected distortions in returns of the Customized IPD Index that are associated with the benchmark construction Given the struggles associated with using market indexes to benchmark real estate performance, ICBC transitioned to an absolute return performance benchmark set as the CPI plus a hurdle rate of 4.25% before costs, or 4.0% after costs. This benchmark aligns with ICBC s targeted rate of return for the asset class. The approach aligns with the absolute return benchmark used by other plans and aligns with the performance benchmarks used by other institutional real estate investment managers. However, in the ICBC 2014 Revenue Requirements, Exhibit B-13, RR BCUC.46.2, ICBC states 2 : ICBC invests in real estate for the income yield of CPI % and this income stream closely mirrors the annual income return on the REAL/pac IPD Canadian Property Index In November 2014 when ICBC filed the information request response, ICBC indicated that the income stream between the REAL/pac IPD Canadian Property Index closely mirrors CPI %. However, in this August, ICBC struggles using market indexes to benchmark real estate performance. Were there significant changes in the nine months (e.g. investment managers, strategies, and/or
83 British Columbia Utilities Commission Information Request No RR BCUC.82.3 Dated 12 January Page 2 of 3 market conditions) that led ICBC to move away from a market index? Please clarify ICBC s statements Would the change in the real estate benchmark now result in the investment managers achieving their targets easier? Should the real estate benchmark be transparent, investible, offer availability of pricing, and represent the targeted risk and return profile of the asset class? Please evaluate the CPI % against these criteria, if appropriate Please confirm that the transition to CPI % was made by ICBC Investment management to the ICBC Investment Committee of the Board and approved by the ICBC Board of Directors. If not confirmed, please explain the decision making process. 2 Response: 82.3 No, there were no material changes in the real estate investment strategy, managers, or market conditions that led ICBC to move away from the market index. ICBC continues to manage a real estate portfolio that aligns with the core strategy that is detailed in the ICBC SIPP. ICBC has not changed its position that the income stream from its real estate assets closely mirrors the annual income return on the REAL/pac IPD Canadian Property Index (the IPD Index). However, the IPD Index return is comprised of both capital return and income return components. As indicated in the response to information request RR BCUC , filed in the response to information request RR BCUC.56.8, there were capital return distortions in the IPD Index that made it less valuable as a benchmark. ICBC did consider using the income return component of the IPD Index as a benchmark, but did not recommend it because it suffered from reporting delays of two to three months following the quarter end close The change in the real estate benchmark will not result in the investment managers achieving their targets any more easily than they would have otherwise. The long-term total return objective of the real estate portfolio has always been CPI %. The change was simply to
84 British Columbia Utilities Commission Information Request No RR BCUC.82.3 Dated 12 January Page 3 of 3 move away from a benchmark that was not reflective of the assigned strategy, not to lower benchmark expectations Ideally, an investment performance benchmark should be transparent, investible, offer availability of pricing, and represent the targeted risk and return profile of the asset class. Establishing a performance benchmark for real estate that meets all of these criteria is challenging because real estate assets, unlike bonds or equities, trade infrequently, there is limited asset supply, and assets are not homogeneous. The benchmark of CPI % meets the following criteria: 1. It represents the targeted return profile of the asset class. All real estate transactions are underwritten with this return target in mind. 2. It is transparent, timely, and readily available. The calculation is based on a CPI measure published monthly by Statistics Canada The recommendation to transition to the CPI % benchmark for real estate was presented by ICBC Investments management to the ICBC Investment Committee of the Board on April 29, 2015 and approved by the ICBC Board of Directors on May 1, 2015.
85 British Columbia Utilities Commission Information Request No RR BCUC.82.4 Dated 12 January Page 1 of RR BCUC.82.4 Reference: PERFORMANCE MEASURES Exhibit B-5, RR BCUC.56.1; RR BCUC ; RR BCUC Real Estate In response to RR BCUC.56.1, ICBC states: In the case of real estate, a benchmark equivalent to the consumer price index % aligns with the targeted return of the asset class and the expected return profile of real estate assets being sourced for investment. This is also consistent with the approach of several other large Canadian real estate investors. In response to RR BCUC.58.2, ICBC states: The real estate portfolio has performed below the benchmark primarily due to two factors. First, the benchmark distortions inflated benchmark returns over what was achievable in the ICBC portfolio. Second, the portfolio experienced several leasing challenges. Overall portfolio vacancy peaked in 2014 at close to 10% as a result of several tenant bankruptcies and lease terminations. This negatively impacted income returns as well as capital returns of the real estate portfolio. Since then, aggressive releasing efforts have restored portfolio occupancy to 98%. In response to RR BCUC , ICBC states: ICBC is forgoing the Customized IPD Index in favour of the Canadian consumer price index (CPI) % in response to unexpected distortions in returns of the Customized IPD Index that are associated with the benchmark construction Given the struggles associated with using market indexes to benchmark real estate performance, ICBC transitioned to an absolute return performance benchmark set as the CPI plus a hurdle rate of 4.25% before costs, or 4.0% after costs. This benchmark aligns with ICBC s targeted rate of return for the asset class. The approach aligns with the absolute return benchmark used by other plans and aligns with the performance benchmarks used by other institutional real estate investment managers. However, in the ICBC 2014 Revenue Requirements, Exhibit B-13, RR BCUC.46.2, ICBC states 2 : ICBC invests in real estate for the income yield of CPI % and this income stream closely mirrors the annual income return on the REAL/pac IPD Canadian Property Index. Please indicate what companies use the customized REAL/pac IPD Canadian Property Index as a performance benchmark to evaluate performance of institutional real estate investment managers. 2
86 British Columbia Utilities Commission Information Request No RR BCUC.82.4 Dated 12 January Page 2 of 2 Response: Examples of companies that use versions of the REAL/pac IPD Canadian Property Index as a performance benchmark to evaluate performance of institutional real estate investment managers include: The Healthcare of Ontario Pension Plan, which uses the IPD Canadian Property Index. Ontario Public Service Employees Union Pension Trust, which uses a custom IPD Index. Alberta Investment Management Corporation, which uses the REAL/pac IPD Canadian All Property Index Large Institutional Subset.
87 British Columbia Utilities Commission Information Request No RR BCUC.82.5 Dated 12 January Page 1 of RR BCUC.82.5 Reference: PERFORMANCE MEASURES Exhibit B-5, RR BCUC.56.1; RR BCUC ; RR BCUC Real Estate In response to RR BCUC.56.1, ICBC states: In the case of real estate, a benchmark equivalent to the consumer price index % aligns with the targeted return of the asset class and the expected return profile of real estate assets being sourced for investment. This is also consistent with the approach of several other large Canadian real estate investors. In response to RR BCUC.58.2, ICBC states: The real estate portfolio has performed below the benchmark primarily due to two factors. First, the benchmark distortions inflated benchmark returns over what was achievable in the ICBC portfolio. Second, the portfolio experienced several leasing challenges. Overall portfolio vacancy peaked in 2014 at close to 10% as a result of several tenant bankruptcies and lease terminations. This negatively impacted income returns as well as capital returns of the real estate portfolio. Since then, aggressive releasing efforts have restored portfolio occupancy to 98%. In response to RR BCUC , ICBC states: ICBC is forgoing the Customized IPD Index in favour of the Canadian consumer price index (CPI) % in response to unexpected distortions in returns of the Customized IPD Index that are associated with the benchmark construction Given the struggles associated with using market indexes to benchmark real estate performance, ICBC transitioned to an absolute return performance benchmark set as the CPI plus a hurdle rate of 4.25% before costs, or 4.0% after costs. This benchmark aligns with ICBC s targeted rate of return for the asset class. The approach aligns with the absolute return benchmark used by other plans and aligns with the performance benchmarks used by other institutional real estate investment managers. However, in the ICBC 2014 Revenue Requirements, Exhibit B-13, RR BCUC.46.2, ICBC states 2 : ICBC invests in real estate for the income yield of CPI % and this income stream closely mirrors the annual income return on the REAL/pac IPD Canadian Property Index. Please indicate what companies use an absolute return benchmark, such as CPI %, to evaluate performance of institutional real estate investment managers. 2
88 British Columbia Utilities Commission Information Request No RR BCUC.82.5 Dated 12 January Page 2 of 2 Response: Organizations using an absolute return benchmark, such as CPI %, to evaluate the performance of institutional real estate investment managers are listed below: Ontario Teachers Pension Plan CPI + 4% + country risk premium Alberta Teachers Retirement Fund CPI % University of Ottawa Pension Plan CPI + 5% New Brunswick Public Service Shared Risk Plan CPI + 4% BC Pension Corporation CPI + 4% WorkSafe BC CPI + 4%
89 British Columbia Utilities Commission Information Request No RR BCUC.82.6 Dated 12 January Page 1 of RR BCUC.82.6 Reference: PERFORMANCE MEASURES Exhibit B-5, RR BCUC.56.1; RR BCUC ; RR BCUC Real Estate In response to RR BCUC.56.1, ICBC states: In the case of real estate, a benchmark equivalent to the consumer price index % aligns with the targeted return of the asset class and the expected return profile of real estate assets being sourced for investment. This is also consistent with the approach of several other large Canadian real estate investors. In response to RR BCUC.58.2, ICBC states: The real estate portfolio has performed below the benchmark primarily due to two factors. First, the benchmark distortions inflated benchmark returns over what was achievable in the ICBC portfolio. Second, the portfolio experienced several leasing challenges. Overall portfolio vacancy peaked in 2014 at close to 10% as a result of several tenant bankruptcies and lease terminations. This negatively impacted income returns as well as capital returns of the real estate portfolio. Since then, aggressive releasing efforts have restored portfolio occupancy to 98%. In response to RR BCUC , ICBC states: ICBC is forgoing the Customized IPD Index in favour of the Canadian consumer price index (CPI) % in response to unexpected distortions in returns of the Customized IPD Index that are associated with the benchmark construction Given the struggles associated with using market indexes to benchmark real estate performance, ICBC transitioned to an absolute return performance benchmark set as the CPI plus a hurdle rate of 4.25% before costs, or 4.0% after costs. This benchmark aligns with ICBC s targeted rate of return for the asset class. The approach aligns with the absolute return benchmark used by other plans and aligns with the performance benchmarks used by other institutional real estate investment managers. However, in the ICBC 2014 Revenue Requirements, Exhibit B-13, RR BCUC.46.2, ICBC states 2 : ICBC invests in real estate for the income yield of CPI % and this income stream closely mirrors the annual income return on the REAL/pac IPD Canadian Property Index. With respect to RR BCUC.58.2, how have the improved occupancy levels been incorporated into the forecast investment portfolio returns? 2
90 British Columbia Utilities Commission Information Request No RR BCUC.82.6 Dated 12 January Page 2 of 2 Response: Fluctuations in real estate portfolio occupancy rates do not impact the forecasted return on real estate assets that is included in the New Money Rate (NMR) formula. The forecasted return on real estate assets in the NMR formula is equivalent to forecasted growth in the Canadian consumer price index plus a risk premium of 4.25%. ICBC believes this is a reasonable longterm return expectation for a portfolio of Canadian real estate assets exhibiting a risk profile similar to what ICBC targets, which includes an occupancy rate of 95%. Fluctuations in real estate portfolio occupancy rates are incorporated into ICBC s property budgets.
91 British Columbia Utilities Commission Information Request No RR BCUC.83.1 Dated 12 January Page 1 of RR BCUC.83.1 Reference: PERFORMANCE MEASURES Exhibit B-1, Chapter 5, p. 5B-3; Exhibit B-5, RR BCUC.56.6 SIPP and investment performance ICBC in Figure 5B.3 on page 5B-3 of Exhibit B-1 shows: In response to RR BCUC.56.6, ICBC states: The decision to follow passive management of the Global Equity allocation will result in a reduction in management fees. ICBC s active US and EAFE equity allocations had a Management Expense Ratio (MER) of approximately 40 basis points (bps). The MER for the Global Equity passive allocation will be approximately 2 bps. In response to RR BCUC.56.7, ICBC explains two reasons for the decline in added value objectives. ICBC states: First, there is a small reallocation in the period from Canadian equity (which has an added value objective of 75 basis points (bps)) to real estate (which has an added value objective of 0 bps). Management fee savings associated with this move are estimated to be $90,000. Second, an active US equity allocation with an added value objective of 50 bps and an active EAFE equity allocation with a value add objective of 100 bps were transitioned to a passive global equity allocation with an added value objective of 0 bps. Management fee savings associated with this asset mix change are estimated at $2.36 million. According to Figure 5B.3, the Europe, Australasia, and Far East (EAFE) equities and US equities annual management expense ratios are 37 bps and 2 bps respectively. Please confirm that Global Equity, which is EAFE and US equities combined, will be approximately 2 bps beginning in 2015 due to passive management. If not confirmed, please clarify.
92 British Columbia Utilities Commission Information Request No RR BCUC.83.1 Dated 12 January Page 2 of 2 Response: ICBC confirms that the management expense ratio for the Global Equity mandate will be approximately two basis points due to passive management. This began in late 2015, after the transition to the Global Equity mandate was completed.

93 British Columbia Utilities Commission Information Request No RR BCUC.83.2 Dated 12 January Page 1 of RR BCUC.83.2 Reference: PERFORMANCE MEASURES Exhibit B-1, Chapter 5, p. 5B-3; Exhibit B-5, RR BCUC.56.6 SIPP and investment performance ICBC in Figure 5B.3 on page 5B-3 of Exhibit B-1 shows: In response to RR BCUC.56.6, ICBC states: The decision to follow passive management of the Global Equity allocation will result in a reduction in management fees. ICBC s active US and EAFE equity allocations had a Management Expense Ratio (MER) of approximately 40 basis points (bps). The MER for the Global Equity passive allocation will be approximately 2 bps. In response to RR BCUC.56.7, ICBC explains two reasons for the decline in added value objectives. ICBC states: First, there is a small reallocation in the period from Canadian equity (which has an added value objective of 75 basis points (bps)) to real estate (which has an added value objective of 0 bps). Management fee savings associated with this move are estimated to be $90,000. Second, an active US equity allocation with an added value objective of 50 bps and an active EAFE equity allocation with a value add objective of 100 bps were transitioned to a passive global equity allocation with an added value objective of 0 bps. Management fee savings associated with this asset mix change are estimated at $2.36 million Has ICBC conducted any analysis when it considered forgoing active return in favour of passive management resulting in management fee savings? If so, please provide a brief summary of such analysis. If not, why not? Please confirm that the transition to the passive management recommendation was made by ICBC Investment management to the ICBC Investment Committee of the
94 British Columbia Utilities Commission Information Request No RR BCUC.83.2 Dated 12 January Page 2 of 2 Board and approved by the ICBC Board of Directors. If not confirmed, please explain the decision making process. Response: 83.2 Yes. ICBC considered active management of the Global Equity allocation. ICBC evaluated historical performance data from a universe of global equity managers. The analysis found little support for active management of a Global Equity allocation. After adjusting for fees, the median manager was unable to outperform the Global Equity benchmark over multi-year periods. Given ICBC s requirement that active managers demonstrate an ability to generate added value sufficient to compensate for the active risk assumed, it was determined that an active management recommendation was not justified Confirmed. The written recommendation to substitute a Global Equity allocation for the existing US and Europe, Australasia, and Far East (EAFE) equity allocations, and to follow passive management of the Global Equity allocation, was submitted by ICBC Investments management for consideration by the ICBC Investment Committee of the Board at its May 26, 2015 meeting. The ICBC Board of Directors approved related changes to the ICBC Statement of Investment Policy and Procedures at its meeting on July 30, 2015.
95 British Columbia Utilities Commission Information Request No RR BCUC.84.1 Dated 12 January Page 1 of RR BCUC.84.1 Reference: PERFORMANCE MEASURES Exhibit B-5, RR BCUC.59.5; RR BCUC.59.6 BC Coroners Service Child Death Review Panel A Review of Young Driver Deaths , dated February 2015 New Driver Comparative Crash Rate (NDCCR) In response to RR BCUC.59.5, ICBC states: ICBC will be reviewing GLP in /2017 as part of its response to the BC Coroner s Report of 2014 and will review metrics for the program at that time. Given the limited value of the metric as well as the cost of generating this report ICBC proposes that the reporting of the NDCCR be discontinued in advance of the overall performance measures review, which will be filed as part of the 2017 Revenue Requirements Application. In response to RR BCUC.59.6, ICBC states: It should be noted that, at the time when ICBC filed the 2015 Revenue Requirements Application in August 2015, the cost to produce the NDCCR data was thought to be greater than what has been outlined above. This is because it was not yet certain whether the required driver license data would be included in ICBC s new Enterprise Data Warehouse. Most of this data is now expected to be available in. According to the BC Coroners Service Child Death Review Panel, A Review of Young Driver Deaths , dated February 2015, on page 39, it states: By February : The BC Coroners Service contribute to the knowledge base of young driver behaviour and road safety by obtaining and reviewing driver abstracts in all BCCS investigations of young driver fatal crashes. ICBC and its partner agencies contribute to the knowledge base of distracted driving of young drivers by: ο Reviewing and clarifying the criteria used by law enforcement to identify distracted driving in police-attended crashes; and ο Publicly reporting on distracted driving. Please provide the scope of the Graduated Licensing Program (GLP) review in /2017. Will this review involve a BCUC process? Why or why not? Response: The scope of the /2017 GLP review is planned to include a review of other Canadian new driver licensing programs, road safety research, and consultation with BC new drivers and their
96 British Columbia Utilities Commission Information Request No RR BCUC.84.1 Dated 12 January Page 2 of 2 parents. The review will focus on identifying opportunities for further improving the crash reduction benefits of BC s GLP. The GLP review process will inform the design of any new metrics to monitor GLP effectiveness. New metrics are yet to be developed as the GLP program review has not commenced. As the nature of the GLP review is to inform program enhancements, ICBC does not anticipate the /2017 review itself will involve a regulatory process as it has not traditionally reported to the Commission on these types of driver licensing program reviews. However, changes to the GLP, if made, would likely involve changes to the Motor Vehicle Act Regulations. It is anticipated that changes to GLP metrics will be an outcome of the /2017 GLP review and, if appropriate, new measures will be developed. It is not known at this time whether any new GLP metrics or other potential driver licensing related metrics will be part of the 2017 performance measures review, which will be included in the 2017 Revenue Requirements Application.
97 British Columbia Utilities Commission Information Request No RR BCUC.84.2 Dated 12 January Page 1 of RR BCUC.84.2 Reference: PERFORMANCE MEASURES Exhibit B-5, RR BCUC.59.5; RR BCUC.59.6 BC Coroners Service Child Death Review Panel A Review of Young Driver Deaths , dated February 2015 New Driver Comparative Crash Rate (NDCCR) In response to RR BCUC.59.5, ICBC states: ICBC will be reviewing GLP in /2017 as part of its response to the BC Coroner s Report of 2014 and will review metrics for the program at that time. Given the limited value of the metric as well as the cost of generating this report ICBC proposes that the reporting of the NDCCR be discontinued in advance of the overall performance measures review, which will be filed as part of the 2017 Revenue Requirements Application. In response to RR BCUC.59.6, ICBC states: It should be noted that, at the time when ICBC filed the 2015 Revenue Requirements Application in August 2015, the cost to produce the NDCCR data was thought to be greater than what has been outlined above. This is because it was not yet certain whether the required driver license data would be included in ICBC s new Enterprise Data Warehouse. Most of this data is now expected to be available in. According to the BC Coroners Service Child Death Review Panel, A Review of Young Driver Deaths , dated February 2015, on page 39, it states: By February : The BC Coroners Service contribute to the knowledge base of young driver behaviour and road safety by obtaining and reviewing driver abstracts in all BCCS investigations of young driver fatal crashes. ICBC and its partner agencies contribute to the knowledge base of distracted driving of young drivers by: ο Reviewing and clarifying the criteria used by law enforcement to identify distracted driving in police-attended crashes; and ο Publicly reporting on distracted driving Please confirm that ICBC is referring to the following BC Coroner s Report of 2014, titled BC Coroners Service Child Death Review Panel A Review of Young Driver Deaths : Please file a copy of the BC Coroner s Report of According to the February 2015 report, please explain what enhanced data ICBC will be providing to contribute to the knowledge base of young drivers. Is ICBC following
98 British Columbia Utilities Commission Information Request No RR BCUC.84.2 Dated 12 January Page 2 of 3 the recommended timeline of February to provide such data? If so, please provide the data when/if available ICBC considers that the NDCCR is of limited value. Does ICBC not believe that the NDCCR data would be helpful to assist BC Coroners Service? Please explain if BC Coroners Service has commented on the NDCCR data. Response: 84.2 and ICBC confirms that it is referring to the 2014 BC Coroners Service Report, which is provided in Attachment A BC Coroners Service Child Death Review Panel: A Review of Young Driver Deaths As noted in the reference to this information request, the BC Coroners Service Report makes two recommendations for ICBC and partner agencies for contributing to the knowledge base of distracted driving by young drivers. ICBC is currently fulfilling these recommendations as follows: ICBC continues to work with partner agencies to clarify the criteria used by law enforcement to identify distracted driving in police-attended crashes. The primary responsibility for the criteria for selecting contributing factors for crashes belongs with the police. However, ICBC is leading a working group at the Canadian Council of Motor Transport Administrators, working with provincial and territorial representatives from across Canada to develop a national action plan on distracted driving. Part of that work aims to better understand the role of personal electronic devices, like smartphones, in crashes. ICBC invests in education and awareness campaigns that are reflective of its road safety priorities and to support enforcement. This includes two distracted driving awareness campaigns that occur in March and September, which utilize a variety of mediums including television and other media advertising, and community outreach activities.
99 British Columbia Utilities Commission Information Request No RR BCUC.84.2 Dated 12 January Page 3 of 3 ICBC uses information gathered from its road safety tracking studies on distracted driving in its distracted driving campaign communications. For example, statistics gathered from the Ipsos Survey ICBC Road Safety Tracking Study 2014: Distracted Driving, which is included in the Application, Appendix 8 E, were used in key messages in the March 2015 Distracted Driving Campaign ICBC does not believe that the NDCCR provides a useful metric for the BC Coroners Service. The NDCCR metric was implemented in 2004 to determine whether the Graduated Licensing Program (GLP) was effective at reducing crash rates for new drivers, compared to drivers who received their driver s licence before the GLP was introduced. After 12 years, this metric has clearly revealed that the GLP has been effective in reducing the crash rate of new drivers (i.e., the ratio is trending toward 1), and the ratio has remained stable for the last several years. Since the GLP was introduced in 1998 (with enhancements in 2003 and 2007), a significant proportion of drivers on the road today participated in the GLP. The NDCCR metric, originally designed to compare non-glp drivers to GLP drivers, has therefore become outdated since the comparison group of non-glp drivers has been substantially changed. The BC Coroners Service Report confirms that new drivers continue to be at increased risk of crashes. The NDCCR is limited in the value it provides as it is unable to differentiate the underlying variables that contribute to crash differences between new and experienced driver populations. As such, it could potentially lead to a misinterpretation of crash risk among the new driver population. Significant factors contributing to new driver crashes will be considered during the /2017 GLP review, and if appropriate, new measures will be developed. ICBC is unaware of any commentary from the BC Coroners Service concerning the NDCCR data.
100 ICBC s Information Request Response RR BCUC.84.2 Attachment A BC Coroners Service Child Death Review Panel: A Review of Young Driver Deaths Insurance Corporation of British Columbia January 29,

101 BC Coroners Service Child Death Review Panel A Review of Young Driver Deaths REPORT TO THE CHIEF CORONER OF BRITISH COLUMBIA February 2015
102 PREFACE On June 24, 2014, the British Columbia Coroners Service (BCCS) held a child death review panel focused on youth driver deaths in British Columbia between 2004 and Over this time period, 106 young people died while they were driving. The loss of these young people deeply affected their parents, brothers and sisters, extended family, friends and the greater community. The review of their lives and the vehicle crashes that resulted in their tragic deaths was crucial in helping the panel members identify actions that could prevent the future deaths of young drivers. Panel support was provided by the BCCS Child Death Review Unit (CDRU). Adele Lambert, Will Speechley and Holli Ward compiled aggregate case reviews and a review of the research and statistics which formed the basis of the panel discussions. Dr. Ian Pike and staff at the BC Injury Prevention Unit (BCIRPU) were instrumental in placing the findings from the case reviews in the context of existing literature and research, assisting in identifying additional research, identifying areas where provincial legislation may have contributed to observed trends and providing thoughtful interpretation of overall findings. I would like to express my deepest appreciation to the members of this panel for their dedication towards keeping young drivers safe during those initial years of learning to drive. The process of sharing their expertise, participating in discussion and bringing the support of their respective organizations generated action oriented recommendations that I am confident will contribute to reducing deaths of young drivers. Dr. Evan Adams Neil Arason Denis Boucher Dr. Jeff Brubacher Bob Downie Brendan Fitzpatrick Jason Luchies Sherri Mohoruk Marilyn Ota Dr. Ian Pike Alex Scheiber Sonny Senghera Office of the Provincial Heath Officer RoadSafetyBC RCMP E Division Emergency Physician, Vancouver General Hospital Saanich Police Department RCMP E Division Insurance Corporation of BC Ministry of Education First Nations Health Authority BC Injury Research and Prevention Unit Ministry of Children and Family Development Insurance Corporation of BC On behalf of the panel, I submit this report and recommendations around reducing the deaths of young drivers to the Chief Coroner of BC for consideration. Michael Egilson Chair, Child Death Review Panel 1
103 EXECUTIVE SUMMARY For teens who obtain a driver s licence, driving provides new freedom and independence as part of a transition to adulthood. It is an exciting time for both the teen and their family. In addition to helping free parents from providing taxi service, driving independently opens new possibilities for young people, such as employment. Most teens navigate this transition to adulthood successfully; however, motor vehicle crashes are still the leading cause of death among teens. This report looks at how and why young drivers die, what is currently in place to try to keep them safe and finally, considers what more can be done to prevent these tragic deaths from happening. 106 young drivers died in crashes that occurred between 2004 and To further understand the issues related to young driver deaths and identify opportunities for prevention, this death review panel examined these deaths in aggregate. Additionally, the panel reviewed research literature and statistics related to young drivers and road safety. Panel members included professionals with expertise in Aboriginal health and child welfare, injury prevention, public health, medicine, law enforcement, education, child welfare, licensing and road safety. The young drivers who died were primarily male youth who were 17 and 18 years old. Speed, impairment, lack of seatbelt use and inexperience were common contributing factors. Although most of the vehicles involved were cars, pick-up trucks, mini vans and sport utility vehicles (SUVs), some drivers were operating motorcycles and all-terrain vehicles (ATVs). A much greater proportion of youth operating motorcycles died. Since the introduction of British Columbia s Graduated Licensing Program (GLP) in 1998, there has been a reduction in the number of young driver deaths; especially those within their first year of licensure. Nevertheless, motor vehicle crashes remain the leading cause of death for young people between the ages of 15 and 18. From 2004 to 2013, approximately 60% of youth between 16 and 18 years old had a driver s licence 1 in BC. During this 10 year period, approximately 10 of these young drivers were killed each year in a motor vehicle crash. A number of approaches are currently used to support young drivers as they develop the complex skills needed to drive safely and defensively. In addition to these, the panel identified opportunities that could contribute to reducing young driver crashes and crash related fatalities. Specifically, a review of the GLP process, enhanced data collection related to young driver crashes and road safety, and a focus on reducing speed. Based on the panel review, the following recommendations are put forth to the Chief Coroner for consideration: Recommendation 1: Review of the Graduated Licencing Program That the Insurance Corporation of B.C. (ICBC) conduct a review of B.C. s Graduated Licencing Program to identify potential opportunities to improve its effectiveness. The review should include a consultation with young drivers and the parents and guardians that support young drivers. 1 This includes all licence types. 2
104 Recommendation 2: Enhanced Data Collection The BC Coroners Service contribute to the knowledge base of young driver fatalities by obtaining and utilizing driver abstracts in all fatal crashes of young drivers as part of the BCCS investigation process; and ICBC and its partner agencies contribute to the knowledge base of distracted driving of young drivers by reviewing and clarifying the criteria used to identify distracted driving in policeattended crashes and publically reporting out on distracted driving. Recommendation 3: Reduce Speed Related Injury and Death The Ministry of Transportation and Infrastructure ensure that road safety and injury prevention are the paramount criteria used in the course of monitoring and reviewing existing speed limits and setting new speed limits on BC s provincial road system; and The Ministry of Justice conduct a pilot project of automated speed enforcement strategies such as time and distance and speed on green in areas identified as high risk for serious crashes. 3
105 YOUNG DRIVER FATALITIES For a young person, the inherent risk of a crash while driving is often overshadowed by the excitement of obtaining their licence and becoming more independent. Driving safely and defensively to reduce the risk of a crash requires a complex set of skills that take years to develop. During this critical period of time, there are factors placing young drivers at a higher risk of a crash that may result in their death or a serious injury. Many British Columbians have experienced the tragic loss of a young driver who was part of their family or a friend. The following accounts underscore two of the most common factors contributing to the deaths of young drivers. They are composite accounts of the young driver deaths reviewed in this report. SPEEDING On an early evening in August, a 17 year old young man was driving a sports car on a stretch of highway. In the course of turning right at a set of lights, his vehicle hit gravel. It spun 180 degrees, flipped several times down a slope and came to rest on its roof in a shallow ditch. The 17 year old was ejected from the vehicle and found a few metres away. He died at the scene as a result of traumatic injuries to his head and chest. Several drivers witnessed the crash and the events leading up to the crash and pulled over to assist before emergency personnel arrived on scene. Witnesses indicated that shortly before the crash, they had seen the sports car weave through traffic at a rate well over the posted speed limit of 70 km/hr. As the car approached the set of lights, it suddenly crossed over two lanes of traffic, causing another driver to slam their brakes to avoid crashing. The sports car had tried to turn right without slowing down but at the last moment, its brakes were engaged. When the coroner interviewed the teen s parents, his father explained that his son was three months into the Novice driver stage of the Graduated Licensing Program (GLP). His son had recently purchased a used sports car with money he had earned from his after school job. Before this, the 17 year old had driven the family van and had never been in a crash. In the course of further investigation, the coroner learned that the teen had received a ticket for speeding a month before the crash, which was unknown to the teen s parents. Toxicological testing showed the 17 year old had not been using substances at the time of the crash. DRIVING WHILE IMPAIRED After leaving a party in the early morning hours, an 18 year old young man offered two friends a ride home in his parent s 4-door sedan. About 3 km from the party, people in an apartment were awakened by a loud bang. The crash was not witnessed. When emergency personnel attended, they observed the driver s side of the vehicle had hit a hydro pole with enough force that it snapped the vehicle in half. All three young men were still in the vehicle with their seatbelts on. The driver s seat was pushed directly into the hydro pole. It was determined that both the driver and the backseat passenger had died instantly on impact. The front seat passenger was treated for minor injuries. Beer cans and half a bottle of whiskey were noted to be in the back seat. During the coroner s investigation, toxicological analysis showed that the driver had consumed enough alcohol and marijuana to cause a high level of impairment. The surviving passenger said that he and the driver had shared a marijuana joint early in the evening and that he d seen 4
106 the driver consume a few beers over the course of the evening. The passenger commented when we decided to leave, he wasn t stumbling or slurring his words. He told me it had been a couple of hours since he d last had a beer. At the time of the crash, the driver had held a GLP Novice stage licence for seven months. The Novice stage restricts the driver from consumption of any alcohol (zero blood alcohol concentration) and from having more than one passenger in the vehicle. The teen s driving record indicated he had previously received violation tickets on two separate occasions; one for speeding and another for having too many people in the car. The teen s parents told the coroner their son regularly used the family vehicle, especially on weekend evenings. 5
107 CONTENTS PREFACE... 1 EXECUTIVE SUMMARY... 2 YOUNG DRIVER FATALITIES... 4 SPEEDING... 4 DRIVING WHILE IMPAIRED... 4 PART 1: INTRODUCTION... 8 DEATH REVIEW PANEL... 8 LIMITATIONS AND CONFIDENTIALITY... 9 PART 2: TEEN DRIVER DEATHS INTERNATIONAL CANADA BRITISH COLUMBIA (BC) BC CORONER SERVICE CASE REVIEW FINDINGS A. THE YOUNG DRIVER B. THE FATAL CRASH C. FACTORS CONTRIBUTING TO FATAL CRASHES D. WHERE CRASHES OCCURRED E. WHEN CRASHES OCCURRED F. VEHICLES INVOLVED IN FATAL CRASHES PART 3: CURRENT STRATEGIES TO INCREASE ROAD SAFETY FOR YOUNG DRIVERS. 29 A. GRADUATED LICENCING PROGRAM IN BC PASSENGER VEHICLE GLP MOTORCYCLE GLP B. PARENTAL INFLUENCE C. ROAD SAFETY ROAD SAFETY STRATEGIES ROAD INFRASTRUCTURE AND TRAFFIC ENGINEERING ROAD SAFETY ENFORCEMENT PART 4: SUPPORTING YOUNG DRIVERS GOING FORWARD: RECOMMENDATIONS REVIEW OF THE GRADUATED LICENCE PROGRAM ENHANCED DATA COLLECTION
108 REDUCE SPEED RELATED INJURY AND DEATH PART 5 RESOURCES AND REFERENCES RESOURCES ICBC RoadSafetyBC REFERENCES APPENDIX 1: BC CORONERS SERVICE REGIONS
109 PART 1: INTRODUCTION For teens who obtain a driver s licence, driving provides new freedom and independence as part of a transition into adulthood. In addition to helping free parents from providing taxi service, being able to drive independently can open new possibilities for young people, including employment. Most teens navigate this transition to adulthood successfully; however, motor vehicle crashes are still the leading cause of death among teens. This report looks at how and why young drivers die, what is currently in place to try to keep them safe and finally considers what more can be done to prevent these types of tragic deaths in the future 2. Losing a young driver to a vehicle crash has a profound effect on their families, friends and communities. Furthermore, these crashes sometimes take the lives or seriously injure passengers and other drivers. These losses are often compounded by the fact that the crash could have been prevented. For young drivers, the risk of being killed or seriously injured in a motor vehicle crash during the period of time they are learning to drive is increased for a number of reasons. Driving safely and defensively requires learning a complex set of skills, many hours of driving experience and a level of maturity that demonstrates a responsible attitude about driving. Additionally, vehicle safety and road hazards can impact a young driver s safety. Given these factors and the amount of risk associated with learning to drive, young driver safety is an ongoing priority. Between 2004 and 2013, approximately 60% of youth in BC between 16 and 18 years old had a driver s licence 3. To further understand what places young drivers at risk and identify opportunities to prevent future deaths, a death review panel was held in June The panel reviewed 106 young driver deaths 4 that occurred between 2004 and 2013 as well as the research literature and statistics related to young drivers and road safety. The young drivers who died were primarily male youth who were 17 and 18 years old. Speed, impairment, lack of seatbelt use and inexperience were common contributing factors. Although most of the vehicles involved were cars, pick-up trucks, mini vans and sports utility vehicles (SUVs), some drivers were operating a motorcycle and all-terrain vehicles (ATVs). A much greater proportion of youth operating motorcycles died. DEATH REVIEW PANEL A death review panel is mandated 5 to review and analyse the facts and circumstances of deaths to provide the Chief Coroner with advice on medical, legal, social welfare and other matters concerning public health and safety, and the prevention of deaths. A death review panel can review one or more cases before, during or after a coroner s investigation, an inquest or a review by the BCCS Child Death Review Unit (CDRU), and regardless of any decision made by a coroner or member of the CDRU. The Chief Coroner established a child death review panel to meet on specific occasions throughout the year to provide recommendations on the prevention of child and youth deaths. 2 Other road users such as: other drivers, cyclists and pedestrians who were either injured or died in a vehicle crash involving a young driver were not included in this review. 3 This includes all licence types young driver deaths were reviewed in aggregate. 5 Under the Coroners Act 8
110 This process is consistent with the child death review principles laid out by the Honourable Ted Hughes in his 2006 report 6. The Chair of the CDRU was appointed chair of the child death review panel whose membership includes: a child death coroner, a CDRU coroner and professionals with expertise relating to children including: professionals with expertise in Aboriginal health and child welfare, injury prevention, public health, medicine, law enforcement, education, child welfare, licensing and road safety. In the course of reviewing the young driver deaths that occurred between 2004 and 2013, the panel reviewed: BCCS investigative findings; Academic and research literature; Information provided by panel members; Environmental, social and medical factors associated with the deaths; Possible patterns, trends or themes; The current state of related public policy and strategies; and Existing challenges. Each panel member shared their professional perspective and collectively identified actions to prevent the deaths of young drivers. LIMITATIONS AND CONFIDENTIALITY Provisions under the Coroners Act and Freedom of Information and Protection of Privacy Act allow for the BCCS to disclose information to meet its legislative mandate and support the findings and recommendations generated by the review process. For the purposes of this report, information about these youth is presented in aggregate form. The BCCS is sensitive to the privacy of the youth and the families that we serve and proceeds with caution when reporting case review findings. In general, the statistical results are based on a limited number of cases and should be interpreted with caution given the potential for random variation. 6 BC Children and Youth Review,
111 PART 2: TEEN DRIVER DEATHS Comparing young driver death rates across jurisdictions is challenging due to variances in data collection and in variables such as licensing issuance, licensing restrictions, road safety and enforcement measures. INTERNATIONAL Information about driving and road safety, including young drivers, is collected and reported on by the World Health Organization (WHO) and its partner agencies, the Organization for Economic Co-operation and Development (OECD) and the United Nations (UN). The data used by these organizations is based on consultation with national stakeholders, non-governmental organizations and academics. The WHO reports that (World Health Organization, 2013): Young male drivers (under the age of 25 years) are 3 times more likely to be killed than females 91% of the world s fatalities on roads happen in low and middle income countries. Specific to young drivers between 15 and 24 years old, the OECD reports (Organization for Economic Co-operation and Development, 2006): Over 8,500 die in the 30 OECD countries every year Death rates are approximately double that of older drivers Males are 3 times more likely to die than females. CANADA Young drivers between 16 and 24 years old are overrepresented as victims of fatalities and serious injuries involving vehicle crashes (Transport Canada, 2011). Specifically, 13% of licensed drivers in Canada are between the ages of 16 to 24 years old but this group accounts for 24% of driving fatalities and 26% of serious injuries (Transport Canada 2011). Specific to young drivers between 16 and 19 years old (Traffic Injury Research Foundation, 2013): From 2000 to 2010, there has been a decrease in the number of driver fatalities from a rate of 10.3 in 2000 to 7.3 per 100,000 in 2010; All Canadian provinces and territories have a GLP for new drivers of any age. The most common minimum age in which a person is eligible to apply for a licence is age 16 years old. BRITISH COLUMBIA (BC) Between 2004 and 2013, there were on average, 103,000 youth between the ages of 16 and 18 years old who were active licensed drivers 7 of which fewer than 150 were for motorcycles. This age group accounted for approximately 3% of the driver s licences in BC, and 5% of all driver fatalities between 2009 and Based on statistics provided by ICBC, Based on statistics provided by ICBC and BCCS,

112 There has been a decrease in the rate of youth driver deaths, especially since 2008 (figure 1). This is consistent with the decreases in numbers of injury hospitalizations for occupants of passenger vehicles 9 and motorcyclists between 15 and 19 years old over the same period of time (BC Injury Research and Prevention Unit, Injury Data Online Tool (idot), 2014). Figure 1: Source: BC Coroners Service BC CORONER SERVICE CASE REVIEW FINDINGS This section presents an aggregate case overview of the demographics and circumstances of the deaths 106 young drivers who died between 2004 and Findings from the case review are presented in conjunction with what is known from the current national and international research literature on young drivers. BC s graduated licence program (GLP) for all new drivers is referenced throughout this area of the report. This program is described in greater detail in Part 3 of this document. A. THE YOUNG DRIVER The young drivers who died were primarily male youth who were 17 and 18 years old with a valid Novice passenger vehicle licence. Some were driving contrary to one or more of their licence restrictions at the time of their fatal crash. Additionally, some of these drivers also had a history of receiving one or more violation tickets for unsafe driving practices. AGE The majority of the driver deaths in this review occurred in older youth between 17 and 18 years old (n=94, 89%) (figure 2). This age group was more likely to be driving with a Novice or full licence, which have limited or no restrictions, respectively. 9 This includes both drivers and passengers in passenger vehicles. 11

.")
113 Overall, the young drivers who died ranged in age from 12 to 18 years old. Licensed 16 year olds were driving with a Learners licence, with a number of imposed restrictions. Drivers younger than 16 years old were unlicensed. These findings are consistent with those found by the Traffic Injury Research Foundation of Canada (TIRF) looking at driver fatalities of 16 to 19 year olds from 2000 and 2010 (2013). Research has shown that young drivers, who are generally less experienced than older drivers, are at greater risk for being involved in a crash (Mayhew, Simpson, Singhal and Desmond, 2006). Driving safely and defensively requires learning a complex set of skills, many hours of driving experience and a level of maturity that demonstrates a responsible attitude about driving. This all needs to happen during a period of time when the adolescent brain is still developing functions that will contribute to establishing lifelong safe driving habits such as: planning, impulse control, reasoning and perception (Organisation for Economic Co-Operation and Development (OECD), 2006; Traffic Injury Research Foundation, n.d.). Put another way, younger drivers are at stage of maturity where they are likelier to engage in risk taking or thrill seeking behaviours and be more influenced by their peers, and they are also less experienced with using judgement, making decisions and perceiving hazards while driving (Mayhew, et.al, 2006). Figure 2: Number of Driver Deaths by Age Age Groups Source: BC Coroners Service SEX The majority of the young drivers who died were males (74%, n=78). Twenty-six (n=28) percent of the drivers who died were female (see figure 3). These findings are consistent with the research which found that young men are overrepresented in driver fatalities of youth between 16 to 19 years old (Traffic Injury Research Foundation, 2013). Young male drivers are more likely to overestimate driving skill, hazard recognition and underestimate potential causes of a crash than young female drivers. 12

 from the U.S.")
. For example, 17 year old male drivers were more likely to be involved in a fatal crash at night compared to 16 year old males, which is likely due to GLP restrictions.")
.")


114 Figure 3: Number of Driver Deaths by Sex 2004 to Males Females Source: BC Coroners Service A review of young driver data (ages 15 to 19 years old) from the U.S. based National Highway Traffic Safety Administration (NHTSA) also found that males appear to be at higher risk of fatal crashes; however, this risk is not homogenous across all ages (Swedler, Bowman and Baker, 2012). For example, 17 year old male drivers were more likely to be involved in a fatal crash at night compared to 16 year old males, which is likely due to GLP restrictions. Research has also suggested that male drivers are more likely than their female counterparts to overestimate driving skill and hazard recognition, and underestimate the potential consequences of a crash (Rodes and Pivik, 2011; OECD, 2006). LICENCE STATUS At the time of their death, most of the young drivers held a valid licence; however, some of the youth were not complying with the restrictions of their licence type. At the time of their deaths, the licence status of the drivers was noted to be as follows: 68 Novice stage passenger vehicle licences; 14 Learners stage passenger vehicle licenses; 4 Class 5 full passenger vehicle licenses; 3 Learners stage motorcycle licence; and 2 Class 6 full motorcycle licences. Nineteen (18%) of the youth were driving without a valid licence at the time of the crash. Fifteen of these drivers did not have a licence and 4 of these drivers had a licence that was invalid. Licences were considered to be invalid if the driver was driving with the wrong class licence (e.g. a driver with a Class 7 licence who is driving a motorcycle) or driving while prohibited. Research findings focused on unlicensed drivers 10 indicate that there is an increased risk of crashing compared to licensed drivers which may be due to factors such as driving without supervision and limited driving practice (Traffic Injury Research Foundation (TIRF), The Issues- Unlicensed Driving, n.d.). Further, research indicates that unlicensed drivers are more likely to be driving an older passenger vehicle that may be unsafe (TIRF, The Issues-Unlicensed 10 Unlicensed drivers include those drivers who had a licence that was then invalid because it was suspended, revoked, inappropriate, expired or cancelled or drivers who have never obtained a licence (Traffic Injury Research Foundation, The Issues-Unlicensed Driving, n.d.) 13
115 Driving, n.d.). Research indicates that unlicensed drivers are likelier to be males who take risks such as speeding and alcohol use, and do not use a helmet or a seatbelt (TIRF, The Issues- Unlicensed Driving, n.d.). DRIVING CONTRARY TO GLP LEARNER AND NOVICE RESTRICTIONS GLP driving restrictions are intended to reduce risks that could lead to death or serious injury in young drivers. As mentioned in Part 3 of this report, driving restrictions are imposed in the Learner and Novice stages of the GLP. If drivers with Learner or Novice stage licences drive contrary to the restrictions of their licence type, they could receive fines or penalty points that are recorded on their driving record. Thirtyfour (32%) of the drivers were driving contrary to one or more of their licence restrictions at the time of the crash. In addition to driving contrary to licence restrictions, it is also possible that a driver was driving with an invalid Learner or Novice stage licence. Of the drivers known to have a Learner s licence: 11 were driving with no supervisor; 10 consumed alcohol; 3 were driving during restricted hours; and 2 had more than one passenger (other than a supervisor) in the vehicle. Of those drivers known to have a Novice licence: 18 consumed alcohol; and 7 were driving with too many passengers (who were not family members and without a supervisor). Research indicates that non-compliance with GLP restrictions may increase the risk of a crash (Mayhew, et.al, 2006). For the GLP program to be fully effective, young drivers need to follow the restrictions imposed as these are in place to reduce the crash risk. To this end, opportunities to encourage parents to reinforce compliance with the GLP restrictions and to engage young drivers in a dialogue about the purpose to these restrictions should be considered. PENALTIES FOR UNSAFE DRIVING In addition to penalties for driving contrary to GLP restrictions (as discussed in the previous section), drivers with a Learners or Novice stage licence are also subject to the unsafe driving penalties that may be imposed on drivers with full licences. These include receiving a warning letter, probation or prohibition from driving. All drivers may be subject to penalties for unsafe driving (i.e. speeding) and impaired driving. About one third of the drivers (n=36, 34%) had a history of one or more penalties (see figure 4) 14

 were witnessed either by a passenger in the vehicle or someone else (i.e. bystander, other driver).")
116 Figure 4: 70 Number of Drivers with Violations 2004 to No Violations 1 to 2 3 to 4 5 to 12 Source: BC Coroners Service B. THE FATAL CRASH Of the 106 fatal crashes, 91 of the youth were driving passenger vehicles, 13 were driving motorcycles and 2 were driving ATVs on a public roadway. Over half of the crashes were single vehicle with the majority of these witnessed by someone (55%, n=58). Forty-five percent (n=48) were multi-vehicle crashes. Overall, the majority of the crashes (71%, n=75) were witnessed either by a passenger in the vehicle or someone else (i.e. bystander, other driver). In 16% (n=17) of the crashes, one or more people died in addition to the youth driver (e.g. passengers in the youth driver s vehicle or the driver or passengers of another vehicle involved in the crash). Of the single vehicle crashes, the most common crash involved the driver hitting a stationary object The fatal driver crashes involving speed left the vehicles severely damaged and unrecognizable. 15

117 (i.e. hydro pole, tree) (43%, n=25) (see figure 5). Seventeen of these crashes involved a rollover (29%, n=17) (see figure 5). Other crashes involved things such as: hitting another type of object or entering water. Figure 5: Number of Driver Deaths in Single Vehicle Collisions Details 2004 to Stationary Object Rollover with Ejection Rollover Other Source: BC Coroners Service C. FACTORS CONTRIBUTING TO FATAL CRASHES Overall, these fatal crashes involved a combination of the factors presented as opposed to just a single one. Speed, impairment, lack of seatbelt use and inexperience were common contributing factors identified. It is important to note, however, that other contributing factors presented in this section may be underreported as a result of limitations with the ability to collect data. SPEED Speeding is a leading cause of death and serious injury in BC and is a common behaviour across all driver age groups, including young drivers. Between 2009 and 2013, the rate of speeding tickets issued to young drivers (16 to 18 years old) was 64.1 per 1,000 drivers in comparison to 64.9 per 1,000 drivers over the age of 18 years. Due to the incidence of speeding behaviour and its potential consequences, enforcement measures are used to target those who speed. In BC, RoadSafetyBC has identified excessive speed (driving greater than 40 km/hr over the speed limit) as one of the top high risk driving behaviours to target. Driving at higher speed increases a driver s risk of being involved in a fatal crash. While driving at high speed, a driver must observe, interpret and respond to what is happening on the road at a faster rate. If the driver is overwhelmed by a complex driving environment, they may not recognize or respond to hazards (Engstrom, Johansson and Ostlund, 2005). Even when a driver is able to drive in a complex environment at a higher speed, if the brakes are applied, a much greater distance is required to stop in comparison to applying the brakes at a lower rate of speed (Navon, 2003). Higher speeds also make it more difficult for a driver to negotiate curves and manoeuvre around road hazards in addition to making it more difficult for other drivers to avoid a speeding vehicle. 16


118 If a crash occurs at high speed, the vehicle s ability to protect the driver and passenger or other road users from death or serious injury is decreased (Ferguson, 2013). The risk of fatality for drivers and passengers who are wearing seatbelts is greatly increased at speeds over 50 km in side impact crashes and at speeds over 70 km in frontal crashes (Howard, Cameron, Langford, 2008; Richards and Cuerden, 2009). The risks associated with speeding may be compounded by factors that include but are not limited to: weather conditions, distractions, impairment and fatigue (Scott-Parker, Watson, King and Hyde, 2014). Where speed was identified as a contributing factor in the young driver deaths, most of the vehicles had sustained severe damage. 17
119 Speed was identified as a contributing factor by the coroner in 30 (28%) of the young driver deaths. Of the 90 cases where a police traffic analyst report was available for review 11 : 12 drivers were speeding in excess of 40 km over the posted speed limit; 8 drivers were driving too fast for the road conditions; 7 drivers were either going the speed limit or driving under it; and Speed could not be determined in 39 of the crashes. ALCOHOL AND SUBSTANCE USE Alcohol and drug impairment while driving is a leading cause of death and serious injury in young drivers. Compared to older drivers, young drivers not only have a higher risk of crashing when sober, but also, for all blood alcohol content (BAC), their relative risk of crashing is higher (i.e. compared to the risk when the BAC equals 0) (Peck, Gebers, Voas and Romano, 2008; Christoforou, Karlaftis, Yannis, 2013). This is possibly due to inexperience both with driving and with drinking, and the increased impulsivity and risk-taking behaviour associated with youth (Christoforou, et.al, 2013). In terms of drug use, there are a wide variety of illegal, prescription, and over-the-counter drugs that impair driving performance. Next to alcohol, marijuana has been reported as the most commonly detected recreational drug in fatal motor vehicle crashes (Asbridge, Poulin and Donato, 2005; Beasley and Beirness, 2011). With respect to driving while under the influence of marijuana, research suggests the risk of crashing is approximately double compared to driving sober (Asbridge, Hayden and Cartwright, 2012). Impaired driving is a serious issue on its own; however, like other road safety factors contributing to young driver fatalities, it may be associated with speed. Research suggests that young drivers who crash while impaired are also more likely to be speeding (Scott- Parker,Watson, King and Hyde, 2014; Williams, West and Shults 2012). In addition to speeding, impaired young drivers are more likely to engage in other risky driving behaviours (e.g. tailgating by driving too close to the vehicle in front) (Scott-Parker, et.al, 2014). Substance use was noted as a contributing factor in the coroner s report in 43% (n=46) of the deaths. Toxicology analysis was completed on 102 of the youth and one or more substances were detected in just over half (56%, n=58) of these youth: 22 (22%) consumed alcohol. Of these youth, 20 had an alcohol blood level that exceeded.08; 16 (16%) consumed drugs; 20 (20%) consumed a combination of drugs and alcohol. The most common drugs detected were: marijuana (n=28), cocaine (n=10) and amphetamine/mdma/ecstasy (n=6). Drug use results were not mutually exclusive and some results were noted as either being recent use, past use or unknown when use occurred. RoadSafetyBC has identified impaired driving as a priority high risk driving behaviour to target because of the serious risks and possible consequences of having impaired drivers on the road. 11 The categories are not mutually exclusive. 18
 was 8.8 per 1,000 drivers in comparison to 9.")
 reviewed a number of provincial surveys and found that 14% to 21% of grade 12 respondents admitted to driving within an hour of having taken drugs.")
120 Although driving after any alcohol consumption is prohibited for both Learner and Novice GLP stages, some young drivers disregard it. Between 2009 and 2013, the rate of tickets issued for alcohol impaired 12 driving to young drivers (16 to 18 years old) was 8.8 per 1,000 drivers in comparison to 9.1 per 1,000 drivers over the age of 18 years. The Canadian Centre on Substance Abuse (2011) reviewed a number of provincial surveys and found that 14% to 21% of grade 12 respondents admitted to driving within an hour of having taken drugs. The McCreary Centre s 2013 BC Adolescent Health Survey was completed by 30,000 students living in BC in grades 7 to 12 and found that 3% of students reported driving after using alcohol or marijuana (Smith, Stewart, Poon, Peled, Saewyc and McCreary Centre Society, 2014). SEATBELT USE A properly worn seatbelt can reduce the risk of serious injury and death. Ninety-one of the youth were driving in a vehicle where a seatbelt could have been worn (15 youth were operating a motorcycle or ATV where a seatbelt would not have been a factor). Of these 91 youth, 66% (n=60) were properly wearing a seatbelt. Four percent (n=4) of the youth were wearing a seatbelt improperly and 24% (n=22) were not wearing a seatbelt. In 5% of these cases (n=5) it was unknown if the youth was wearing a seatbelt at the time of the crash. Wearing a seatbelt properly can reduce the risk of serious injury or death. Based on Transport Canada s (2010) survey of seatbelt use in Canada between 2009 and 2010, seatbelt use in BC was 96.9%, which was higher than the overall Canadian use of 95.3%. This suggests an overrepresentation of non-seatbelt wearers in the fatal crashes reviewed by the panel. DRIVER EXPERIENCE To drive safely and defensively, a driver has to learn a complex set of skills acquired through knowledge, development and experience (Shope and Bingham, 2008). Examples include: recognition of possible hazards and essential vehicle manoeuvring. An inexperienced driver may be deficient in skills such as: anticipating hazards, controlling a vehicle during a skid, and reacting quickly (Mayhew, Simpson, Singhal, Desmond, 2006). Inexperienced drivers may also commit unintentional driving errors such as: not yielding to traffic, failing to check the rear view mirror and underestimating an oncoming vehicle s speed (Mayhew, et.al, 2006). Young drivers require a minimum of 60 hours of driving experience before applying for a motor cycle or car licence. Driving inexperience was noted in the coroner s report as a contributing factor in 21% (n= 22) of the cases. 12 Alcohol contraventions include 24 hour, 12 hour and immediate roadside program. 19
121 Driving experience is difficult to identify as there is no uniform measurement used. At the time of the crash, the length of time a youth had been licensed was known in some cases; however, the number of driving hours completed by any of the youth was unknown. It is known that 51 of the young drivers had their licence for a year or less and 18 youth had their licence for over a year. One measure that may be used to acquire driving experience is a driving course. In BC, drivers may opt to take an ICBC-approved driver training course at their own cost. This course is administered by various driving schools across the province. The course focuses on skills for safe driving, road test preparation and developing a responsible attitude when driving. Its primary purpose is to prepare drivers for the skills and knowledge based Class 7 road test. The learning requirements are based on industry 13 and educational best practices. In each year between 2008 and 2013, 9% of Class 7 road test applicants completed this course. The number of youth who took any type of driving lesson(s) other than the ICBC-approved course is unknown. Research findings on the effectiveness of driver training in the reduction of young driver crashes appear to indicate that driving lessons alone are not effective in reducing crashes and, in some cases, may lead young drivers to be overconfident in their skill levels (Committee on Injury, Violence and Poison Prevention and Committee on Adolescence, 2006). It is suggested that driver experience, supplemented with driving lessons can encourage safe driving among young drivers (Committee on Injury, Violence and Poison Prevention and Committee on Adolescence, 2006). The GLP course was last evaluated in 2006 at which time it was found that drivers who had taken an ICBC-approved driver training course had a 26% higher crash rate during their first year at the Novice stage (Wiggins, 2006). A possible explanation for this finding was that drivers who completed the course during the Learners stage were offered a time incentive meaning they could obtain their Novice stage licence sooner. In 2007, the time incentive at the Learners stage was removed and transferred to the Novice stage. Since this time, the course has not been re-evaluated. DISTRACTION In this review of young driver deaths, cell phone use was noted by the coroner as a contributing factor in 1 death. Distracted driving is an emerging issue that requires further exploration to fully understand its impacts in relation to young drivers. Research suggests distractions greatly increase the risk of young drivers crashing because they are still learning the complex skills required to develop the same level of reflexive driving that experienced drivers have generally developed (Klauer, Guo, Simons-Morton, Ouimet, Lee and Dingus, 2014; Mayhew, Robertson, Brown and Vanlaar, 2013). Distraction occurs when a driver s attention is averted to something other than the task of driving (Mayhew, et.al, 2013). Distractions can range from minimal to significant and cause impairment of a person s ability to focus on their driving (Mayhew, et.al, 2013). Sources of distraction within the vehicle include other passengers, and behaviours like eating and the use of electronic devices; distractions outside of the vehicle include billboards and road signs (Mayhew, et.al, 2013). 13 Industry in this context includes driving schools that offer Class 5 instructor training and driving schools that offer the 32 hour ICBC-approved course. 20
122 Although there are numerous potential causes of distraction while driving, the term distracted driving is often considered synonymous with use of handheld electronic devices while driving. Media and public surveys report increases in this type of distracted driving. In BC, RoadSafetyBC has identified distracted driving (use of handheld electronic devices while driving) as a top high risk driving behaviour to target. In a Road Safety Monitor (RSM) poll conducted in 2011 by the Traffic Injury Research Foundation (TIRF), 36.3% of all Canadian drivers admitted to using their cell phones while behind the wheel in the 7 days previous, up from 20.5% in 2001 (Marcoux, Vanlaar and Robertson, 2012). Research suggests cell phone use is especially problematic for young drivers because of their driving inexperience and susceptibility to distractions (Mayhew, Robertson, Brown and Vanlaar, 2013). In BC, amendments were made to BC s Motor Vehicle Act in 2010 prohibiting the use of handheld electronic devices while driving. The use of all electronic devices is also a restriction imposed for both Learner and Novice GLP stages; however, like substance use, some young drivers disregard it. Between 2010 and 2013, the rate of tickets issued for distracted driving to young drivers (16 to 18 years old) was 4.39 per 1,000 drivers in comparison to per 1,000 drivers over the age of 18 years 14. Another distraction noted in research is the presence of passengers. Research suggests that teen passengers pose a distraction because of their interactions with the young driver (Traffic Injury Research Foundation, Passenger, n.d.). This may be in the form of conversation or by contributing to an environment that promotes riskier and more aggressive driving, particularly among young male drivers (Curry, Mirman, Kallan, Winston, Durbin, 2011; Traffic Injury Research Foundation, Passengers, n.d.). BC s GLP imposes passenger restrictions which are intended to reduce the risk of passenger distraction (refer to part 3). Thirty-six percent (n=38) of the youth who died had one or more passengers in their vehicle 15, although distractions related to passenger presence were not noted as a contributing factor in any of these deaths. A possible reason that distracted driving was not identified in more of the deaths may have been that it is difficult to determine unless the actions of the driver at the time of the accident were witnessed. This limitation makes it difficult to gather accurate information about the overall prevalence and types of driver distractions that may have contributed to the death of a driver. Collecting data through routine road safety enforcement and non-fatal crashes would provide a more accurate picture of the prevalence and types of driver distractions that place young drivers at risk. FATIGUE A driver who is fatigued may be overly tired or irritated which impacts their ability to safely operate a vehicle. Being overly tired or drowsy may cause a person to drive without full awareness (Traffic Injury Research Foundation, Fatigue, n.d.). As a result, the driver may make driving errors (i.e. braking in time, staying on the road) they would not otherwise make (Traffic Injury Research Foundation, Fatigue, n.d.). An irritated driver may be overloaded ; feeling mentally overwhelmed which may result in aggressive driving behaviour or multi-tasking which takes data was unavailable as prohibition of electronic device use was legislated in November It is possible a passenger could have been a GLP supervisor. 21
123 away from being fully aware of the task of driving (Traffic Injury Research Foundation, Fatigue, n.d.). Fatigue was noted as a contributing factor in 2% (n=2) of the deaths. Research indicates that young drivers, particularly males, are one of the most at risk groups for driving while in a fatigued state (Traffic Injury Research Foundation, Fatigue, n.d.). Typical reasons for a young driver to experience fatigue include not making sleep a priority and undergoing a decrease in alertness due to changes during puberty (Traffic Injury Research Foundation, Fatigue, n.d.). Reasons young drivers may drive while fatigued include peer approval, perceiving the risk as minimal and overestimating their ability to drive in this state (Fernandes, Hatfield and Job Soames, 2010). HELMET USE Fifteen (14%) of the youth were operating a motorcycle or ATV. Most of these drivers (73%, n=11) were wearing a helmet. Four (27%) drivers were either not wearing a helmet or not properly wearing one. Helmet use is widely understood to decrease the risk of death or serious brain injury in motorcycle or ATV riders (Vanlaar, Marcoux and Robertson, 2009, Liu, Ivers, Norton, Boufous, Blows and Lo, 2008). All Canadian provinces have helmet laws requiring a helmet to be worn while operating a motorcycle. In early 2014, BC law was introduced requiring ATV drivers to wear a helmet. In BC, motorcycle operators and passengers are required by law to wear a helmet that meets a specific safety standard and displays certification. STREET RACING The prevalence of street racing in young drivers is not clearly identified in research. Street racing is a dangerous activity and is a criminal code offence. Two (2%) of the drivers had been street racing prior to their crash. In one case, the driver was riding a motorcycle and racing on a rural road. The other case involved two vehicles racing on a city street. Neither of these cases involved high performance vehicles. POLICE PURSUIT In BC, police pursuits are regulated under the Motor Vehicle Act, Emergency Vehicle Driving Regulation. Police had been either following or pursuing 4% (n=4) of the youth prior to the crash occurring. Some of the vehicles driven were reported stolen. The outcomes of any investigations related to police actions were not noted in the coroners files. Research focused on the effects of police pursuit of young drivers appears to be very limited. However, research looking at active attempts of young drivers to avoid police enforcement indicates these drivers do so when they are generally engaging in risky driving behaviours such as speeding or driving while impaired (Scott-Parker, Watson, King and Hyde, 2014). An example of avoidance includes attempts to drive around areas known to have police enforcement such as a roadside check. 22
124 D. WHERE CRASHES OCCURRED The majority of the crashes (97%, n=103) occurred on asphalt road surfaces. This includes, highway, municipal, residential and rural areas. In 3% (n=3) of the crashes, the road surface was noted to be gravel or dirt. Of the 52 crashes where the number and type of lanes were noted in the coroner s file, the majority (79%, n=41) occurred on a 2 lane undivided roadway where there is one lane going in each direction, with no barriers to separate them. Eight percent (n=4) occurred on a 4 lane undivided where two lanes each go in either direction and there are no separation barriers. Eight percent (n=4) occurred on a 4 lane divided roadway where two lanes each go in either direction and there are separation barriers (i.e. cement). Six percent (n=3) occurred on a 3 lane undivided roadway where two lanes are going in one direction and only one lane is going the opposite direction, with no separation barriers. Twenty one percent (n=11) of these crashes occurred at an intersection exchange. With respect to crash location, 33% (n=33) of the deaths occurred in the Interior region of BC (as defined by the BCCS regional areas-see Appendix 1) (figure 6). Eight percent (n=9) of the crashes occurred in an area outside where the youth was residing. For example, a youth living on Vancouver Island has a crash in Surrey. Figure 6: 33 Collision Location by BC Coroners Service Regions 2004 to Interior North Fraser Island Metro Source: BC Coroners Service In 62 of the crashes, the speed limit was noted in the coroner s file (see figure 7). Where the speed limit was noted, just over a quarter of the crashes occurred in a speed zone of 50 km (27%, n=17). Another quarter (24%, n=15) of these 62 crashes occurred in intermediate speed zones of 60 or 70 km. Almost half of the 62 crashes (48%, n=30) occurred on a high speed road of 80 to 100 km. Evidence from other jurisdictions indicates that higher speed limits usually result in higher numbers of crashes resulting in serious injury or death (Richter, Berman, Friedman, Ben-David, 2006; Letty and van Schagen, 2006). 23
125 Figure 7: Number of Driver Deaths by Posted Speed Limit Zone 2004 to Speed Unknown 50 km 60 km 70 km 80 km 90 km 100 km Source: BC Coroners Service E. WHEN CRASHES OCCURRED Most of these fatal crashes happened in the summer or fall months. SEASONS AND WEATHER Summer was when young driver deaths most frequently occurred with the fewest deaths occurring in the spring (see figure 8). Summer months often see an increase in vacation related road travel to recreational destinations/events, likely resulting in an increase of drivers on the road, more time spent travelling on roads and at increasing distances. Additionally, motorcycle use has a seasonal component, with greater popularity during fair weather. Rain, ice and snow can also increase the risk a crash will occur. If a driver is speeding in these conditions, the risk of a crash is further increased. As previously mentioned in the section on speeding, driving too fast for road conditions was noted as a factor in 8 of the young driver deaths. Figure 8: Number of Driver Deaths by Season Summer Fall Winter Spring Source: BC Coroners Service Seasons Apart from driving too fast for weather conditions, weather or road conditions were noted as factors related to the cause of the crash in 27% (n=29) of the young driver deaths. The most 24
126 noted road conditions included: ice, snow, frost and wet. Fog, gusty winds and heavy rainfall were also noted. With less experience than older drivers, young drivers are likelier to overestimate their ability to drive in certain types of weather and/or drive too fast for the road conditions (Gonzales, Dickinson, DiGuiseppi and Lowenstein, 2005). TIME OF DAY Driving at night poses an increased risk of crashing in young drivers. Young drivers have less experience driving at night and the darkness may make it difficult to identify hazards. Additionally, night driving is often associated with one or more other factors such as: fatigue, the presence of passengers (which may pose a distraction), impairment and speeding (Williams, et.al, 2012). Where time of day was noted (104 cases) (see figure 9), 60% of the crashes (n=62) occurred in the late afternoon and into the late evening and early morning hours (4 p.m. to 4 a.m.). The highest number (n=24) of these crashes were in the early morning hours between midnight and 4 a.m. Although it is unknown if illumination was a contributing factor, 15% (n=16) of the youth were driving on a dark road with no lighting. Figure 9: Number of Driver Deaths by Time of Day Source: BC Coroners Service Time of Day The GLP Learner stage restricts drivers from driving between midnight and 5 a.m. At the Novice stage, there are no restrictions on the time of day a driver can drive. While the Novice stage driver can drive at night, there is a 1 passenger (immediate family exempt) limit restriction imposed unless there is supervisor of 25+ years old present. DAY OF THE WEEK The number of crashes varied throughout the week with the fewest crashes occurring mid- week (see figure 10). There were 39 crashes that occurred over the weekend between Saturday and Sunday and 67 that occurred across the weekdays between Monday and Friday. 25
127 Figure 10: Number of Driver Deaths by Day of Week Mon Tues Wed Thurs Fri Sat Sun Source: BC Coroners Service Day of the Week Research indicates that the risk of a crash is increased on weekends across all age groups of drivers but especially for young drivers, on Fridays and Saturdays in particular, especially at night (Organisation for Economic Co-operation and Development, 2006). The research suggests this may be due to weekend evenings being a particularly social time for young drivers with a higher likelihood they are driving with passengers and possibly using alcohol and/or substances (Organisation for Economic Co-operation and Development, 2006). The OECD sample size was much larger than this review which may account for the variation in findings. F. VEHICLES INVOLVED IN FATAL CRASHES The majority of the drivers were driving either 2 or 4 doors cars. Fewer motorcycles and ATVs were driven; however, these generally have a higher crash risk because the offer less stability and less safety features compared to vehicles. Research indicates that young drivers are likelier than older drivers to be driving small vehicles with fewer safety features, placing them at greater risk of serious injury or death (Insurance Institute for Highway Safety, 2014). In this review, over half of the young drivers (58%, n=58) were driving either 2 or 4 door cars (see figure 11). 26
128 Figure 11: 58 Number of Driver Deaths by Vehicle Type Source: BC Coroners Service Depending on the age of a vehicle, lack of safety features could be a concern. For example, older vehicles are less likely to have safety features such as: electronic stability control and side airbags (Insurance Institute for Highway Safety, 2014). Where the age of the vehicle was known (n=99) approximately half of the vehicles were less than 10 years old and half more than 10 years old. No defects were found on 56% (n=59) of the 106 vehicles. In 9% (n=10) of cases, a vehicle inspection was not completed and in 22% (n=23) cases, it was unknown whether a vehicle inspection was completed. Eleven percent (n=12) of vehicles were noted to have defects including such things as tires, rust and brake malfunction. Of 28 crashes where airbag use was documented, 23 of the vehicles had airbags deploy and 5 vehicles did not have airbags deploy. Four vehicles were not equipped with airbags. The Insurance Institute for Highway Safety (IIHS) is a U.S. based independent, non-profit scientific and educational organization focused on reducing deaths, injuries and property damage as a result of vehicle crashes. To mitigate the risks associated with a young driver driving an unsafe vehicle, IIHS suggests: Young drivers should avoid high horsepower vehicles because this can tempt a young driver to drive beyond their limits; Midsize or larger size vehicles are a better choice compared to driving a small or mini vehicle as these offer the driver greater protection in the event of a crash; A vehicle equipped with electronic stability control (ESC) will help drivers maintain vehicle control on curves and slippery roads; and Ideally, vehicles driven by young drivers should have good safety ratings. 27
129 It should be noted that the risk of a rollover is higher in SUV s and pickup trucks than in cars (IIHS, 2014). A rollover is when a vehicle tips onto its side or roof during a crash which can sometimes cause partial or full ejection of the occupants and increase the likelihood of serious injury or death (IIHS, 2014). The IIHS (2013) reports that rollovers in the U.S. occur in about 2% of all vehicle crashes. Additionally, the size and weight of a vehicle influences the outcome of a crash. If a larger and/or heavier vehicle collides with a smaller and/or lighter vehicle, the smaller/lighter vehicle will be impacted by greater force (IIHS, 2009). Twelve of the young drivers were operating a motorcycle and three were operating an ATV. The ATV driver deaths in this review occurred on a public roadway and involved another vehicle. Motorcyclists are at higher risk for being involved in a crash causing death or serious injury compared to drivers of a passenger vehicle (Vanlaar, Marcoux and Robertson, 2009). Motorcycles are not enclosed the way a passenger vehicle is and do not have safety features that a vehicle has such as: airbags, seatbelts (Vanlaar, et.al, 2009). Furthermore, in events that require emergency braking, motorcycles are less stable than passenger vehicles (Insurance Institute for Highway Safety (IIHS), 2013). Other drivers may also find it difficult to see a motorcycle on the roadway (Vanlaar,et.al, 2009). To drive an ATV on a public roadway in BC, the driver must hold a valid BC licence (either a Class 5/6 full licence or a Class 7/8 GLP licence) and the ATV must be licenced and insured. One of the drivers had a class 7 licence and the other two had no licence. None of the ATV s were licenced and insured for use on public roadways. The IIHS (2013) notes that many ATVs have the ability to reach highway speeds and have low pressure tires that are not intended to be used on paved surfaces. There are also ATV models that are more likely to roll over (IIHS, 2013). The IIHS (2013) indicates that despite this, many ATV fatalities occur on roads. 28
130 PART 3: CURRENT STRATEGIES TO INCREASE ROAD SAFETY FOR YOUNG DRIVERS There are a number of initiatives used to promote young driver safety in BC The most notable of these strategies is the Graduated Licensing Program (GLP) which is intended to help new drivers develop the skills and attitudes to become safe and competent drivers. Related to the GLP are resources to support parents and guardians in guiding young people through the licensing process. Additionally broader road safety strategies and road safety enforcement contribute to the safety of young drivers. A. GRADUATED LICENCING PROGRAM IN BC BC s GLP greatly contributes to reducing the risks associated with death and serious injury in new drivers, which is its overall purpose. To this end, it supports young and new drivers during their most vulnerable driving years. Young drivers are learning complex skills and developing attitudes and approaches that will impact how they drive and interact with other road users (e.g. pedestrians, cyclists, other drivers). BC s Graduated Licensing Program reduces crashes GLPs allow young drivers to gain the skills and experience needed to become safe drivers by providing them with a formal period of learning that includes imposed restrictions (Vanlaar, Mayhew, Marcoux, Wets, Brijs and Shope, 2009). GLPs have generally been shown to reduce the crash risk of young drivers (Fell, Jones, Romano, Voas, 2011; Masten, Foss and Marshall, 2001, Wiggins, 2006). In BC, to obtain a vehicle or motorcycle licence, a new driver of any age is required to enter the GLP. The GLP is administered by the Insurance Corporation of BC (ICBC). It has two stages (a Learners and a Novice) that a driver must complete before becoming eligible to be fully licensed. The initial Learner stage is a 12 month period that once completed, makes the driver eligible to graduate to the Novice stage. The following Novice stage is for a 24 month period and after successful completion, the driver is eligible to graduate to a full licence. Individuals are only required to complete the GLP one time, allowing full-privilege BC licence holders (e.g. class 5 passenger vehicle) to access a secondary licence (e.g. class 6L motorcycle) through a more streamlined process. 29

131 Source: Insurance Corporation of BC (ICBC) 30
132 PASSENGER VEHICLE GLP The current GLP for passenger vehicles has two stages; the Class 7 Learner (7L) stage followed with the Class 7 Novice (7N) stage. At the Learner stage, the minimum entry age is 16 years old and the minimum exit age is 17 years old. Parents must provide consent for youth under age 19 years. A driver at the Learner stage must: Not consume alcohol (zero BAC) Display an L sign Not drive between midnight and 5 a.m. Not use handheld or hands free electronic devices; and Have a maximum of 2 passengers, including a supervisor. The supervisor must be 25 years of age or older and hold a valid class 1-5 licence. To move into the Novice stage, the driver must pass a Class 7 road test and have held a Class 7L for 12 months. At the Novice Stage, the minimum entry age is 17 years old and the minimum exit age is 18 years and 6 months old, if the driver successfully completed a GLP approved driver education course and remained at-fault crash free and violation free during the first 18 months of the Novice stage. A driver at the Novice stage must: Not consume alcohol Display an N sign Not use handheld or hands free electronic devices Have a maximum of 1 passenger unless accompanied by a supervisor who is 25 years old or older with a valid class 1-5 licence (immediate family are allowed with no supervisor). To graduate from the GLP, the Novice stage driver must successfully pass a Class 5 road test and have held a Class 7N for 24 consecutive months without a driving prohibition directly leading up to the road test. The amount of time required before being eligible to take the Class 5 road test may be reduced by 6 months if an ICBC approved driver education course is successfully completed in the Learner stage and the driver has no violation tickets or at-fault crashes during the first 18 months of the Novice stage. This driver education course is not mandatory and the driver may complete it at their own cost. MOTORCYCLE GLP The current GLP for new road users wanting to drive a motorcycle 16 has two stages: a Class 8 Learners (8L) stage and a Class 8 Novice (8N) stage. New riders that already hold a fullprivilege BC licence for another class of vehicle are licensed through a substantially streamlined process. At the Learners stage, the minimum age for entry is 16 years old and the minimum exit age is 17 years old. Parental consent is required for youth under 19 years old. 16 Driving an ATV on a public road requires a motorcycle licence. 31
133 A driver at the Learner stage must: Always ride within the sight of a supervisor who is 25 years old or older with a valid Class 6 licence. Not consume alcohol Display an L Only driving between sunrise and sunset Not use handheld or hands free electronic devices Not carry passengers Not exceed 60 km/h. After passing a motorcycle skills test (a minimum of 30 days after obtaining a learners license), the 60 km/h speed restriction is removed and a supervisor is no longer required. Before moving to the Novice stage, the driver must successfully pass a motorcycle skills test (MST) and Class 8 road test and have held a Class 8L for 12 months. At the Novice stage, the minimum age of entry is 17 years old and the minimum exit age is 18 years and 6 months if the driver successfully completed a GLP approved driver education course and remained at-fault crash free and violation free during the first 18 months of the Novice stage. A driver at the Novice stage must: Not consume alcohol Display an N Not use handheld or hands free electronic devices To graduate from the GLP, the Novice driver must successfully pass a Class 6 road test and have held a Class 8N for 24 consecutive months without a driving prohibition directly leading up to the road test. The amount of time required before being eligible to take the Class 6 road test may be reduced by 6 months if an ICBC approved driver education course is successfully completed in the Learner stage and driver has no violation tickets or at-fault crashes during the first 18 months of the Novice stage. This driver education course is not mandatory and the driver may complete it at their own cost. The GLP for both vehicles and motorcycles was initially introduced through a phased process between 1998 and Since this time; modifications to enhance its effectiveness have been made. In 2003, the vehicle GLP was lengthened from 2 to 3 years and a Novice stage passenger restriction and a demonstrated safe driving requirement were imposed. In 2010, an electronic device (i.e. cell phone use) restriction was imposed for both GLPs. 32


134 B. PARENTAL 17 INFLUENCE Parents play an integral role in the development of a young person s driving skills and behaviours. At the point where a youth is ready to apply for a licence, parental input into this process starts with consent for their son or daughter to obtain a GLP licence which includes a commitment to ensure their new driver receives a minimum of 60 hours of on-road practice. Once a young driver obtains a Learners licence, they will likely be using a parent s vehicle to learn to drive. Parents are in a position to set additional restrictions to the ones already imposed by the GLP process. Additionally, parents have the ability to reinforce the GLP restrictions. Research indicates that long before a young person is eligible to drive; they are influenced by their parents attitudes and actions relative to driving (Morrish, Kennedy and Groff, 2011). Research also suggests that generally, parents recognize there are risks associated with a young person driving and they are concerned about their son or daughter driving in risky situations (Williams, Leaf, Simons- Morton, Hartos, 2006). Often times, parents show a willingness to be involved in reducing these risks (Williams, et.al, 2006). Teens are watching and listening: Young driver behaviours are greatly influenced by parents attitudes about driving and actions when driving. Related to the GLP are a number of resources to help support parents and guardians guide young people through the licensing process. These include ICBC new driver study guides which contain sample driving sessions that parents can work through with their young driver (i.e. Tune Up for Drivers/Riders) as well as family contracts to help establish safe and responsible vehicle use. C. ROAD SAFETY Young driver safety is also addressed within broader initiatives of road safety and road safety enforcement. ROAD SAFETY STRATEGIES Road safety strategies are high level plans that are generally initiated and led by either a government or a partner agency. They are time sensitive and articulate overall goals, approaches to achieve these goals and a measurement process to determine if and when the goals are met. All of these strategies focus on the primary goal of reducing risks that lead to death and serious injury for all people using the roads. This includes pedestrians, cyclists, drivers and passengers. Generally, road safety includes factors such as: behaviours exhibited while using the road, vehicle safety, road maintenance, speed limits, traffic engineering and enforcement. Young driver safety is a road safety priority internationally, nationally and provincially. INTERNATIONALLY A Decade of Action for Road Safety is an initiative focused on improvements to road safety, vehicles, driver behaviour and emergency services. The World Health Organization 17 The terms parental and parents are intended to include parents and guardians responsible for the well-being of a young person. 33
135 (WHO) has taken the lead advocate role and is working with stakeholder nations to gather and share best practices for prevention and reduction of risks and share information with the public. CANADA Canada s 5 year road safety strategy ( ) is focused on public awareness and commitment to road safety; improving cooperation, communication and collaboration among stakeholders; improving enforcement; and supporting research and evaluation through improvements to road safety information. It was developed by a national non-profit organization, the Canadian Council of Motor Transport Administrators (CCMTA). The CCMTA is comprised of representatives from federal, provincial and territorial governments and uses a consultative process to collect information and make decisions about matters such as: licensing, registration and control of motor vehicle transportation and highway safety. BRITISH COLUMBIA (BC) The British Columbia Road Safety Strategy 2015 and Beyond is a provincial initiative focused on targeting areas of concern, implementing a governance structure for road safety, enhancing road safety research, improving communication with British Columbians and partner agencies, and sustaining and increasing engagement with local communities and First Nations to encourage and support road safety initiatives at the local level. This strategy is based on the following guiding principles: Adopt a Safe System Approach that is focused on factors contributing to protecting all road users, including ensuring the speeds on roadways are safe. Collaborate among stakeholders involved in the road traffic system and in the prevention of serious injuries and fatalities and collectively focus on results to achieve declines in serious injuries and fatalities. Sustain existing successful initiatives while focusing on new areas or issues that are identified as requiring attention through analysis of motor vehicle crash trends and stakeholder consultations. Encourage new ideas and best practices towards increasing road safety. RoadSafetyBC is the lead agency of this strategy. Stakeholders from the insurance sector, crown corporations, enforcement agencies, research, health and local governments are involved in developing a framework for action to achieve the overall vision that BC will have the safest roads in North America and ultimately, have zero fatalities and serious injuries. ROAD INFRASTRUCTURE AND TRAFFIC ENGINEERING An important factor in reducing the risk of crashes is the safety performance of a roadway. Road infrastructure and traffic engineering relates to highways, freeways, roads and streets and takes into account variables such as location (i.e. rural areas), speed limits, lighting, intersections, stop lights, maintenance and traffic patterns. Jurisdictions identified as having the safest roads approach road safety from a safe systems perspective where speed limits are set and enforced based on the type of crashes that could occur and the potential injury to road users (Howard, Cameron et al. 2008). For example, speed limits are 30 km/h in areas where pedestrians or other vulnerable road users may be struck by motor vehicles, 50 km/h in intersections where side impacts may occur, 70 km/h on undivided 34
136 highways where head-on crashes may occur, and above 70 km/h on divided highways where a median or guard rail provides protection from head-on crashes (Tingval and Haworth 1999; Richter, Berman et al. 2006; United Nations Road Safety Collaboration 2008). In BC, the Ministry of Transportation and Infrastructure (MoTI) is responsible for setting speed limits on provincial highways, including areas within municipal boundaries. Each municipality is responsible for setting speeding limits within its municipal boundaries. Federally, Transport Canada promotes safe, secure, efficient and environmentally responsible transportation system within Canada. In October 2013, the MoTI completed a review focused on rural highway speed and safety and made recommendations to enhance safety in relation to winter tire requirements and use, wildlife hazards and the management of slow moving vehicles that can cause aggressive driving or driver frustration (Ministry of Transportation and Infrastructure, 2014). In 2014, speed limits on a number of highways throughout BC were increased. The maximum speed limit on some BC highways is now 120 km per hour. The MoTI website TranBC explains that the traffic engineers who set the speed limits on BC s provincial road system take into account the following factors: Local land use indicating the driving environment; Road classification; Highway geometry (i.e. how much sight distance is available to stop in time for an object ahead); Shoulder width, number of intersections and highway entrances; A highway s history including the number and types of incidents; and Traffic volume, and types of vehicles and other road users (i.e. cyclists, pedestrians). The last broad review of speed limits in BC was completed in This 2003 review was limited to an engineering review and did not include consultation with law enforcement or assessment of public information (Parker, et.al, 2003). Road safety, injury prevention and public health agencies all have important evidence based perspectives to contribute in the course of monitoring and reviewing existing speed limits and setting new speed limits on BC with respect to road safety and the prevention of serious injuries and fatalities. ROAD SAFETY ENFORCEMENT The enforcement of road safety in BC is shared by a number of authorities including government, partner agencies and law enforcement. Each of these authorities has a specific mandate to address various aspects of road safety including: vehicle safety, road users (i.e. pedestrians, cyclists, and vehicles) and speed limits. Additionally, federal and provincial legislation and regulations provide law enforcement with the authority to enforce penalties associated with road user behaviours that may increase the risk of a crash. LEGISLATION AND REGULATION Road safety is addressed both in federal and provincial legislation. The Criminal Code of Canada addresses issues such as the dangerous operation of motor vehicles and impaired driving. 35
137 The Motor Vehicle Act is provincial legislation that oversees the registration, licensing and operations of motor vehicles in BC This includes issues such as speeding, seatbelt use, roadside prohibitions, licencing and licence suspensions and rules of the road. Additional acts and regulations relating to motor vehicles include but are not limited to the: Offence Act, Judicial Review Procedures Act, Civil Forfeiture Act and Insurance (vehicle) Act. ROAD SAFETY AUTHORITIES The overarching authority of road safety and enforcement in BC is the Ministry of Justice which includes the Police Service Division and Road Safety BC. The Police Services Division is responsible for ensuring adequate and effective levels of police and law enforcement. RoadSafetyBC is the provincial lead agency responsible for road safety. The Superintendent of Motor Vehicles (supported by RoadSafetyBC) is the administrative authority, appointed under the Motor Vehicles Act, which governs drivers in BC. The Superintendent works closely with partners to ensure the development and implementation of effective road safety policies. Currently, the top priorities of RoadSafetyBC include reducing or eliminating: drinking and driving; distracted driving; and excessive speeding. Law enforcement agencies generally enforce road safety. A primary example are the police agencies who engage in road safety campaigning, messaging and programming related to road safety measures and consult on issues relating to road safety in partnership with other agencies such as ICBC and RoadSafetyBC. The RCMP and municipal police enforce violations under the Motor Vehicle Act. In terms of speed enforcement, police in BC issue violation tickets that result in fines or penalty points. Higher fines and in some cases, vehicle impoundment can occur if a driver is excessively speeding. Police resources do not have the capacity to provide 24 hour speed enforcement, 7 days a week. Considering police officer safety, it may not be feasible to enforce speed in some areas that may be considered high risk for crashes (e.g. a roadway with no shoulder area). In addition to police enforcement, an automated intersection safety camera program is in place to manage drivers who run red lights at intersections. This type of enforcement is located at various intersections that have been identified as high risk locations for crashes. As a result of these enforcement measures, drivers are subject to receiving fines or penalties. Research focused on the effectiveness of both police and automated enforcement indicates both can have a deterrent effect on drivers (Tay, 2009). In addition to the current speed enforcement measures used in BC, other forms of automated speed enforcement exist and are being used in other jurisdictions with positive results (Wilson, et.al, 2010; Thomas, Srinivasan, Decina and Staplin, 2008). Specific examples include, time and distance automated speed enforcement and speed on green automated enforcement. Time and distance automated speed enforcement is measuring the average speed of a vehicle between two locations, usually a set number of kilometres apart. A camera takes a picture of the vehicle when it enters the speed enforcement area and again, as it leaves and the average speed between these points is calculated to determine if the driver was travelling significantly over the maximum posted speed limit. Speed on green automated speed enforcement uses an automated intersection camera to manage drivers who are travelling significantly over the posted speed limit when entering an intersection on a green light. The photographic evidence is reviewed by enforcement and a ticket is issued to the registered vehicle owner. 36
138 ICBC partners with government to promote road safety and service delivery on behalf of the Superintendent of Motor Vehicles. Services include but are not limited to: licensing, driver training and testing, maintaining driving records and the application of penalty points. Transport Canada governs the manufacture and importation of vehicles in Canada. This includes setting and enforcing of vehicle safety standards related brake systems, airbags etc. GLP RESTRICTIONS In addition to rules set out under the Motor Vehicle Act and its Regulations, and the other above named Acts that apply to all drivers, new drivers have a lower penalty point threshold than non- GLP drivers (who are more experienced) before being subject to the consequences of RoadSafety BC s Driver Improvement Program (DIP). That could mean a warning letter, probation or prohibition from driving from a minimum of one month and up to a year, depending on the offence and the individual s driving record. Any driving prohibition as a Learner will extend the learner stage. A driving prohibition in the novice stage will result in the loss of any time accumulated and require an additional 24 consecutive prohibition-free months in the novice stage to be eligible to graduate from GLP once the licence has been reinstated. The GLP imposes a zero tolerance restriction on alcohol consumption which carries a fine and 3 driver penalty points towards the DIP threshold as well as an immediate 12 hour licence suspension. GLP stage drivers are also subject to the same impaired driving penalties that all drivers are subject to. New vehicle and motorcycle drivers are subject to lower penalty point thresholds than experienced drivers. After 2 average violation tickets, a new driver may receive a 30 day driving prohibition. 37
139 PART 4: SUPPORTING YOUNG DRIVERS GOING FORWARD: RECOMMENDATIONS Motor vehicle crashes remain the leading cause of death in young people and continue to pose a significant risk of death for young drivers. A number of areas have been identified through the panel that can further strengthen young driver development and help prevent future crashes and young driver fatalities. Specifically: A review of the BC s GLP and other jurisdictional best practices; Enhanced data collection; and A focus on reducing speed which would further support young driver safety and help reduce crashes and fatalities. The recommendations arising from the death review panel were developed in a manner that was: Collaborative; Attributable to the deaths being reviewed; Focused on identifying opportunities for improving public safety and prevention of future deaths; Targeted to specific parties; Realistically and reasonably implementable; and Measurable. REVIEW OF THE GRADUATED LICENCE PROGRAM Since BC s last GLP evaluation in 2006, further program changes have occurred including moving the driving course time incentive from the Learners stage to the Novice stage and the restriction of electronic devices in For many parents or guardians, the GLP process is not something they had to complete before getting their licence. They may be unfamiliar with GLP stages and restrictions, skill development expectations and recommended hours of driving experience. Some parents and guardians may also be unsure of how to best support young drivers through the GLP process. ICBC has resources for parents to help them learn about the GLP process and what they can do to encourage and support new drivers to drive safely and responsibly. Recommendation 1 By December 2017: That ICBC complete a review of BC s Graduated Licencing Program (Class 7 & 8). The review should focus on three areas: A review of GLP and the higher risk Novice licence stage to determine if there are opportunities for improving the crash reduction benefits of the program, including a review of research-based new driver best practices from other jurisdictions; A review of how parents and guardians are engaged in the process of supporting young drivers. ICBC currently has a variety of educational materials and a family contract to 38
140 help guide parents and guardians in supporting young drivers learn competent and safe driving practices. Specifically, the review would focus on: o Identification of the current approaches used to engage parents; o Determining the effectiveness of these approaches; and o Identifying any gaps within these approaches and addressing them Engage young drivers and soon- to-be drivers in a dialogue about the strengths of the GLP and how it could further support the learning and implementation of safe driving skills and practices, including the input of young people on how to reduce fatal crashes, reduce speeding, and ensure compliance with GLP restrictions. ENHANCED DATA COLLECTION The following areas emerged as priorities for enhanced data collection. The first area involves obtaining driver abstracts in all BC Coroners Service investigations for teen drivers who die in a crash to better understand driving behaviour, driving history and the correlations to fatal crashes. The driver abstract is a history of the young person s driving record which can be helpful in understanding and determining possible contributing factors to the death. Another area involves distracted driving. Distracted driving is an emerging issue that requires further exploration to fully understand its impacts in relation to young drivers. The more recent focus on distracted driving is due to the perceived common use of electronic devices. Handheld electronic device use has become synonymous with the term distracted driving. Media and public surveys report increases in this type of distracted driving, however, there are other types of distractions that can also increase the risk of a crash such as additional passengers, eating, billboards and electronics beyond handheld devices. In a crash that results in a driver fatality, it is difficult to identify whether a driver was distracted when a crash is not witnessed or the type distraction is not obviously apparent. In this review of driver deaths between 2004 and 2013, cell phone use was noted as a contributing factor in one death. It does not appear that reviewing fatal crashes provides accurate information about the overall prevalence and types of driver distractions that exist for young drivers. It would be beneficial to review and clarify the criteria used to identify distracted driving in police-attended crashes so the impact of distraction as a result of the use of electronic devices could be estimated. Collecting information through direct observation, surveys, and non-fatal crashes would help further our understanding the prevalence and rates of contribution to crashes. Recommendation 2 By February : The BC Coroners Service contribute to the knowledge base of young driver behaviour and road safety by obtaining and reviewing driver abstracts in all BCCS investigations of young driver fatal crashes. 39
141 ICBC and its partner agencies contribute to the knowledge base of distracted driving of young drivers by: o o Reviewing and clarifying the criteria used by law enforcement to identify distracted driving in police-attended crashes; and Publicly reporting on distracted driving. REDUCE SPEED RELATED INJURY AND DEATH As identified in the body of this report, road safety infrastructure, traffic engineering and road safety enforcement are key components in reducing the number of serious injuries and fatalities due to vehicle crashes. In BC, the setting of speed limits on provincial highways, including areas within municipal boundaries, is the responsibility of the Ministry of Transportation and Infrastructure (MoTI). The most recent speed review conducted by the Ministry of Transportation and Infrastructure (MoTI) was completed in October 2013 and focused on rural highway speed and safety. This review included technical analysis conducted by the MoTI s engineers and public consultation via online surveys and open houses throughout the province (MoTi, 2014). The last broad review of speed limits in BC was completed in This 2003 review was limited to an engineering review and did not include consultation with law enforcement or assessment of public information (Parker, et.al, 2003). To ensure an emphasis on serious injury and fatality prevention, professionals with road safety, injury prevention and public health expertise should be consulted on an ongoing basis in the course of monitoring and reviewing existing and proposed speed limits. Enforcement is an essential element of road safety. In BC, the Ministry of Justice is responsible for speed enforcement. With the goal of reducing crash related serious injuries and fatalities, focusing on the most high risk crash areas needs to be the enforcement priority. Recognizing that police personnel do not have the capacity to provide 24 hour speed enforcement, 7 days a weeks there are automated speed control strategies that can assist in reducing the number of deaths and serious injuries. Although it is not possible to target automated speed enforcement to a particular age or driver s licence class, the driving practices of parents and other adults also influences the driving behaviour of new drivers. Recommendation 3 By February : The Ministry of Transportation and Infrastructure consult with road safety, injury prevention and public health agencies to ensure that road safety and injury prevention are the paramount criteria used in the course of monitoring and reviewing existing speed limits and setting new speed limits on BC provincial road system. The Ministry of Justice review the requirements for conducting a pilot project of automated speed enforcement measures, such as time and distance and/or speed on green, in areas identified as high risk for crashes including those involving young drivers. 40
142 By February 2017 The Ministry of Justice develops and implements a pilot automated speed enforcement project that would be: o o o For a specified period of time; Located at a limited number of sites identified as having a high prevalence of speed related crashes; and Evaluated to monitor whether these specific automated speed enforcement measures result in a reduction in the number and severity of crashes. 41
143 PART 5 RESOURCES AND REFERENCES RESOURCES ICBC RoadSafetyBC REFERENCES Asbridge, M., Hayden, J.A. and Cartwright, J.L. (2012). Acute cannabis consumption and motor vehicle collision risk: systematic review of observational studies and meta-analysis. BMJ, 344:e536 doi: Asbridge, M., Poulin, C., & Donato, A. (2005). Motor vehicle collision risk and driving under the influence of cannabis: Evidence from adolescents in Atlantic Canada. Accident Analysis & Prevention, 37(6), Baker, S.P., Chen, L-H. and Li, G. (February 2007). Nationwide review of graduated driver licensing. Prepared for AAA Foundation for Traffic Safety. Johns Hopkins Bloomberg School of Public Health, Centre for Injury Research and Policy. BC Injury Research and Prevention Unit, injury Data Online Tool (idot). Retrieved from, on November 11, Beasley, E. and Beirness, D. (2011). Drug use by fatally injured drivers in canada ( ). Prepared for: Canadian Council of Motor Transport Administrators and Transport Canada. Canadian Centre on Substance Abuse. Canadian Centre on Substance Abuse (2011). Cross Canada report on Student alcohol and drug use. Retrieved on August 27, 2014 from, Christoforou, Z., Karlaftis, M.G. and Yannis, G. (2013). Reaction times of young alcoholimpaired drivers. Accident Analysis and Prevention, 61, p Committee on Injury, Violence and Poison Prevention and Committee on Adolesence (2006). The teen driver. Pediatrics, 118, Curry, A.E., Mirman, J.H., Kallan, M.J., Winston, F.K. and Durbin, D.R. (2011). Peer passengers: how do they affect teen crashes? The Journal of Adolescent Health: Official Publication of the Society For Adolescent Medicine, Vol 50 (6), p Decina, L.E., Thomas, L., Srinivasan, R. and Staplin, L. (September 2007). Automated enforcement: compendium of worldwide evaluations of results. National Highway Traffic Safety Administration. 42
144 Engström,, J., Johansson, E., Östlund, J. (2005). Effects of visual and cognitive load in real and simulated motorway driving. Transportation Research Part F, 8, p Fell, J.C., Jones, K., Romano, E. and Voas, R. (2011). An evaluation of graduated licensing effects on fatal crash involvements of young drivers in the United States. Traffic Injury Prevention, 12, p Ferguson, S.A. (2013). Speeding-related fatal crashes among teen drivers and opportunities for reducing the risks. Governors Highway Association. Fernandes, R., Hatfield, J. and Job Soames, R.F. (2010). A systematic review of the differential predictors for speeding, drinking-driving, driving while fatigued, and not wearing a seat-belt among young drivers. Transportation Research, Part F., 13(3), p Gonzales, M.M., Dickinson, L.M., DiGuiseppi, C. and Lowenstein, S.R.(2005). Student drivers: a study of fatal motor vehicle crashes involving 16 year old drivers. Annals of Emergency Medicine, Vol 45, no.2, p Howard, E.I., Cameron, J., Langford, et.al (2008). Towards zero: ambitious road safety targets and the safe system approach. Paris, France, Organization for Economic Co-operation and Development, International Transportation Forum. Insurance Corporation of British Columbia website: Insurance Institute for Highway Safety (2013). Status Report: Hundreds dies in ATV crashes on public roads. Vol 48, No 9. December. Retrieved on August 25, 2014 from, Insurance Institute for Highway Safety (2013). Status Report: new research adds to the evidence that motorcycle ABS prevents crashes. Vol 48, No 4. May. Retrieved on August 25, 2014 from, Insurance Institute for Highway Safety (2014). Status Report: safety rides shotgun. The best used vehicles for teen drivers. Vol, 29, No 5. July. Retrieved on July 16, 2014 from, Insurance Institute for Highway Safety (2014). Rollover Crashes: Q&A s. March. Retrieved on November 12, 2014 from, Insurance Institute for Highway Safety (2009). New crash tests demonstrate the influence of vehicle size and weight on safety in crashes; results are relevant to fuel economy policies. April. Retrieved on November 12, 2014 from, Klauer, S.G., Guo, F., Simons-Morton, B.G., Ouimet, M.C., Lee, S.E. and Dingus, T.A. (2014). Distracted driving and risk of road crashes among novice and experienced drivers. The New England Journal of Medicine, 370:1, p. 54 to
145 Lawpoolsri, S., Li, J. and Braver, E.R. (2007). Do speeding tickets reduce the likelihood of receiving subsequent speeding tickets? a longitudinal study of violators in Maryland. Traffic Injury Prevention, 8, p. 26 to 34. Liu, B.C., Ivers, R., Norton, R. Boufous, S., Blows, S. and Lo, S.K. (2008). Helmuts for preventing injury in motorcycle riders (review). Cochrane Database of Systematic Reviews, Issue 1, Art. No.: CD Marcoux, K.D., Vanlaar, W.G.M. and Robertson, R.D. (February 2012). The road safety monitor 2011, distracted driving trends. Traffic Injury Research Foundation. Retrieved on July 3, 2014 from, Masten, S.V., Foss, R.D. and Marshall, S.W. (2011). Graduated driver licensing and fatal crashes involving 16 to 19 year olds. Journal of American Medical Association, Vol 306, No. 10, Mayhew, D.R., Simpson, H.M. and Singhal, D. (2005). Best practices for graduated driver licensing in Canada. Traffic Injury Research Foundation. Mayhew, D.R., Simpson, H.M., Singhal, D. and Desmond, K. (June 2006). Reducing the crash risk for young drivers. Traffic Injury Research Foundation. Mayhew, D., Robertson, R., Brown, S. and Vanlaar, W. (April 2013). Driver distraction and hands-free texting while driving. Traffic Injury Research Foundation. Morrish, J., Kennedy, P. and Groff, P. (2011). Parental influence over teen risk-taking: A review of the literature. SMARTRISK: Toronto, ON. Navon, D. (2003). The paradox of driving speed: two adverse effects on highway accident rate. Accident Analysis and Prevention, 35, p Nyland, D. and Miska, E. (2014) Rural highway safety and speed review. Ministry of Transportation and Infrastructure. Province of British Columbia. Retrieved on August 26, 2014 from, National Highway Traffic Safety Administration (2013). Traffic safety facts, Report no. DOT HS Washington, D.C.: U.S. Department of Transportation. Organisation for Economic Co-operation and Development (October 2006). Young drivers: the road to safety. Policy Brief. OECD Observer. Organisation for Economic Co-operation and Development (2006). Young drivers: the road to safety. Transport Research Centre. European Conference of Ministers of Transport (ECMT). OECD Publishing. Retrieved on December 9, 2014 from, Parker, M.R., Sung, H.-Y. and Dereniewski, L.J. (2003). Review and analysis of posted speed limits and speed limit setting practices in British Columbia. Final Report. Ministry of Transportation. Province of British Columbia. Retrieved on December 8, 2014 from, 44
146 Peck, R.C., Gebers, M.A., Voas, R.B. and Romano, E. (2008). The relationship between blood alcohol concentration (BAC), age, and crash risk. Journal of Safety Research, 39, p Richter, E.D., Berman, T., Friedman, L. and Ben-David, G. (2006). Speed, road injury, and public health. Annual Reviews Public Health, 27, p Rodes, N. and Pivik, K. (2011). Age and gender differences in risky driving: the roles of positive affect and risk perception. Accident Analysis and Prevention, 43, p Russell, K.F., Vandermeer, B. and Hartling L. (2011). Graduated driver licensing for reducing motor vehicle crashes among young drivers (review). Cochrane Database of Systematic Reviews, Issue 10, Art. No.: CD Letty, A. and van Schagen, I. (2006). Driving speed and the risk of road crashes: a review. Accident Analysis and Prevention, Vol 38(2), March, p Scott-Parker, B., Watson, B., King, M.J. and Hyde, M. K. (2014). I drove after drinking alcohol and other risky driving behaviours reported by young novice drivers. Accident Analysis and Prevention, 70, p Shope, J.T. and Bingham, C.R. (2008). Teen driving: motor-vehicle crashes and factors that contribute. American Journal of Preventative Medicine, 35 (3S). Smith, A., Stewart, D., Poon, C., Peled, M., Saewyc, E. and McCreary Centre Society (2014). from Hastings to Haida Gwaii: provincial results of the 2013 adolescent health survey. Vancouver, BC: McCreary Centre Society. Swedler, D.I., Bowman, S.M. and Baker, S.P. (October 2012).Gender and age differences among teen drivers in fatal crashes. Center for Injury Research and Policy, Bloomberg School of Public Health, Johns Hopkins University, Vol 56, p Tay, R. (2009). The effectiveness of automated and manned traffic enforcement. International Journal of Sustainable Transportation, 3, p. 178 to 186. Thomas, L.J., Srinivasan, R., Decina, L. and Staplin, L. (2008). Safety effects of automated speed enforcement programs, critical review of international literature. Journal of the Transportation Research Board, No. 2078, p Traffic Injury Research Foundation (October 2013). Trends among fatally injured teen drivers, Traffic Injury Research Foundation. Traffic Injury Research Foundation (n.d.) Brain Development. Young and New Driver Centre. Retrieved on December 9, 2014 from, Traffic Injury Research Foundation (n.d.) Fatigue. Young and New Driver Resource Centre. Retrieved on July 2, 2014 from, 45
147 Traffic Injury Research Foundation (n.d.) Unlicenced driving. Young and New Driver Resource Centre. Retrieved on July 2, 2014 from, Traffic Injury Research Foundation (n.d.) Passengers. Young and New Driver Resource Centre. Retrieved on July 2, 2014 from, Traffic Injury Research Foundation (n.d.) Speeding. Young and New Driver Resource Centre. Retrieved on July 2, 2014 from, Transport Canada. Road safety in Canada. Retrieved on August 26, 2014 from, Transport Canada (March 2011). Road safety in Canada, rethink road safety. Government of Canada. TP 15145E. Transport Canada (2010). Results of transport Canada s rural and urban surveys of seat belt use in Canada Fact Sheet. Road Safety and Motor Vehicle Regulation Directorate. TP 2436E. Vanlaar, W., Marcoux, K. and Robertson, R. (2008). Road Safety Monitor, 2007, Excessive speeding. Traffic Injury Research Foundation. September. Retrieved on December 8, 2014 from, Vanlaar, W., Marcoux, K. and Robertson, R. (2009). Road Safety Monitor, Motorcycles. Traffic Injury Research Foundation, June. Retrieved on August 25, 2014 from, Vanlaar, W., Mayhew, D., Marcoux, K., Wets, G., Brijs, T. and Shope, J. (2009). An evaluation of graduated driver licensing programs in North America using a metaanalytic approach. Accident Analysis and Prevention, 41, p Williams, A.F., Leaf, W.A., Simons-Morton, B.G. and Hartos, J.L. (2006). Parent s views of teen driving risks, the role of parents, and how they plan to manage risks. Journal of Safety Research, 37, p Williams, A.F., West, B.A. and Shults, R.A. (2012). Fatal crashes of 16 to 17 year old drivers involving alcohol, nighttime driving, and passengers. Traffic Injury Prevention, 13:1-6. Wilson, C., Willis, C., Henrikz, J.K., Le Brocquel, R. and Bellamy, N. (2010) Speed cameras for the prevention of road traffic injuries and deaths. Cochrane Database of Systematic Reviews, Issue 11, Art. No.: CD Wiggins, S. (2006). Graduated licensing: year six evaluation report. Insurance Corporation of BC Retrieved on August 18, 2014 from, 46
148 Wiggins, S. (2004). Graduated licensing program: interim evaluation report-year 3. Insurance Corporation of BC Retrieved on June 5, 2014 from, World Health Organization (March 2013). Road traffic injuries. Fact Sheet No

149 APPENDIX 1: BC CORONERS SERVICE REGIONS 48
150 British Columbia Utilities Commission Information Request No RR BCUC.84.3 Dated 12 January Page 1 of RR BCUC.84.3 Reference: PERFORMANCE MEASURES Exhibit B-5, RR BCUC.59.5; RR BCUC.59.6 BC Coroners Service Child Death Review Panel A Review of Young Driver Deaths , dated February 2015 New Driver Comparative Crash Rate (NDCCR) In response to RR BCUC.59.5, ICBC states: ICBC will be reviewing GLP in /2017 as part of its response to the BC Coroner s Report of 2014 and will review metrics for the program at that time. Given the limited value of the metric as well as the cost of generating this report ICBC proposes that the reporting of the NDCCR be discontinued in advance of the overall performance measures review, which will be filed as part of the 2017 Revenue Requirements Application. In response to RR BCUC.59.6, ICBC states: It should be noted that, at the time when ICBC filed the 2015 Revenue Requirements Application in August 2015, the cost to produce the NDCCR data was thought to be greater than what has been outlined above. This is because it was not yet certain whether the required driver license data would be included in ICBC s new Enterprise Data Warehouse. Most of this data is now expected to be available in. According to the BC Coroners Service Child Death Review Panel, A Review of Young Driver Deaths , dated February 2015, on page 39, it states: By February : The BC Coroners Service contribute to the knowledge base of young driver behaviour and road safety by obtaining and reviewing driver abstracts in all BCCS investigations of young driver fatal crashes. ICBC and its partner agencies contribute to the knowledge base of distracted driving of young drivers by: ο Reviewing and clarifying the criteria used by law enforcement to identify distracted driving in police-attended crashes; and ο Publicly reporting on distracted driving. Please provide the original cost estimate to produce the NDCCR data. Response: The original cost estimate to produce the NDCCR data included the anticipated requirement to acquire the new driver data in ICBC s Enterprise Data Warehouse (EDW) in order to build a report for the NDCCR calculation. Therefore, the original cost estimate would have been
151 British Columbia Utilities Commission Information Request No RR BCUC.84.3 Dated 12 January Page 2 of 2 $67,000, which includes an approximate cost of $35,000 to acquire the new driver data in addition to the $32,000 estimate provided in the response to information request RR BCUC In addition, the resources needed to develop these reports would have to be redeployed from other higher priority data initiatives that are focused on the rising bodily injury claims cost issues. In the case of the $32,000 estimate, there would be approximately 40 days of work required; for the $67,000 estimate, there would be approximately 84 days of work required. In both instances (i.e., with or without the need to acquire the new driver data in the EDW), from the perspective of the Information Services business area that would be involved in producing the report, the resource requirement is considered to be significant.
152 British Columbia Utilities Commission Information Request No RR BCUC.84.4 Dated 12 January Page 1 of RR BCUC.84.4 Reference: PERFORMANCE MEASURES Exhibit B-5, RR BCUC.59.5; RR BCUC.59.6 BC Coroners Service Child Death Review Panel A Review of Young Driver Deaths , dated February 2015 New Driver Comparative Crash Rate (NDCCR) In response to RR BCUC.59.5, ICBC states: ICBC will be reviewing GLP in /2017 as part of its response to the BC Coroner s Report of 2014 and will review metrics for the program at that time. Given the limited value of the metric as well as the cost of generating this report ICBC proposes that the reporting of the NDCCR be discontinued in advance of the overall performance measures review, which will be filed as part of the 2017 Revenue Requirements Application. In response to RR BCUC.59.6, ICBC states: It should be noted that, at the time when ICBC filed the 2015 Revenue Requirements Application in August 2015, the cost to produce the NDCCR data was thought to be greater than what has been outlined above. This is because it was not yet certain whether the required driver license data would be included in ICBC s new Enterprise Data Warehouse. Most of this data is now expected to be available in. According to the BC Coroners Service Child Death Review Panel, A Review of Young Driver Deaths , dated February 2015, on page 39, it states: By February : The BC Coroners Service contribute to the knowledge base of young driver behaviour and road safety by obtaining and reviewing driver abstracts in all BCCS investigations of young driver fatal crashes. ICBC and its partner agencies contribute to the knowledge base of distracted driving of young drivers by: ο Reviewing and clarifying the criteria used by law enforcement to identify distracted driving in police-attended crashes; and ο Publicly reporting on distracted driving Given the reduced annual cost of $32,000, is ICBC still of the view that data collection costs outweigh the value in tracking the NDCCR? Please explain How much time is required to build the new claims management system to track NDCCR data? Based on an incremental cost of $32,000, please confirm that this would have minimal to no impact on Basic insurance rates.
153 British Columbia Utilities Commission Information Request No RR BCUC.84.4 Dated 12 January Page 2 of Are there further cost reductions if ICBC only collects and reports on crash rates for learners, novice, and experienced drivers and not have to calculate the NDCCR? Response: 84.4 Yes, ICBC is still of the view that data collection costs outweigh the value in tracking the NDCCR, since the ratio is no longer informative for understanding changes in the crash rates of new drivers and may lead to a misinterpretation of important underlying collision trends. For further information, please see the response to RR BCUC filed in the response to information request RR BCUC To provide reports for 2014 and 2015, an estimated 6.5 days, or 52 hours would be required for each year. For onward, it is estimated that a maximum of 40 days of work, or 320 hours would be required to build the recurring permanent solution. From 2017 onward, since the report will have been built in, it would be less than 5 days of effort. As described in the response to information request RR BCUC.84.3, resources needed to develop these reports would have to be redeployed from other higher priority data initiatives that are focused on the rising bodily injury claims cost issues ICBC confirms a cost of $32,000 would have minimal to no impact on Basic insurance rates; however, the use of resources to develop NDCCR tracking takes away resources that are focused on analysis and solutions to support tactics to manage rising bodily injury claims costs There are no further cost reductions if ICBC only collects and reports on crash rates for learners, novice, and experienced drivers and not have to calculate the NDCCR.
154 British Columbia Utilities Commission Information Request No RR BCUC.85.1 Dated 12 January Page 1 of RR BCUC.85.1 Reference: PERFORMANCE MEASURES Exhibit B-5, RR BCUC.60.5 Legal Representation and BI Frequency and Severity In response to RR BCUC.60.5, ICBC states: The success of these caps and deductibles in mitigating increasing Bodily Injury (BI) severity is difficult to ascertain, in large part due to other insurance reforms, such as rate reductions, being adopted at the same time. Two studies conducted by Oliver, Wyman Limited (Oliver Wyman) found that the caps on general damages for minor injury claims of $2,500 in New Brunswick and $2,500 in Nova Scotia have significantly reduced BI claims costs. In the study on Minor Injury Regulation (MIR) in New Brunswick (New Brunswick study), Oliver Wyman stated, Based on our analysis, we estimate that the 2003 minor injury cap as it was currently applied reduced the private passenger automobile BI coverage average cost per claim by approximately 37%. The impact of Nova Scotia s MIR was smaller than New Brunswick s MIR. In the study on Nova Scotia s MIR (Nova Scotia study), Oliver Wyman noted, we estimate the average cost per BI claim to have declined by 21% as a result of the MIR. Alberta introduced a cap in October The cap was briefly suspended for the last half of 2008 and the first half of 2009 due to a court decision. ICBC stated in the response to information request RR BCUC.103.1, ICBC's BI severity has been rising steadily at about 6% whereas Alberta s BI severity trend has moderated due to Alberta's minor injury cap. Alberta s selected trend for BI severity was 0.9%. New Brunswick s 2003 MIR was not expected to have an impact on BI frequency. However, in the New Brunswick study, Oliver Wyman noted, Based on our analysis, we estimate the introduction of the MIR may have reduced the Bodily Injury coverage frequency rate by approximately 20% at the time of its introduction in the second half of There was no impact on BI claim frequency in Nova Scotia. In the Nova Scotia study, Oliver Wyman noted, We, therefore, take the position that the MIR has not had a material effect on the Bodily Injury claim frequency rate in Nova Scotia. Based on the Oliver Wyman BI frequency findings above, does ICBC believe that the full tort system in BC may in part lead to exaggerated claims or fraudulent claims driving up insurance premiums to all policyholders? If so, does ICBC estimate the impact to be as large as in New Brunswick? Response: Yes, ICBC does believe that the full tort system in BC may, in part, lead to exaggerated or fraudulent claims driving up insurance premiums to all policyholders, although the study of this
155 British Columbia Utilities Commission Information Request No RR BCUC.85.1 Dated 12 January Page 2 of 3 was not a focus of the Oliver Wyman reports. ICBC believes it would be surprising not to find exaggerated claims in a system like BC s full tort environment for auto insurance claims where the amount of non-economic damages is generally correlated to the cost of treatments and other economic damages. The US is the nearest jurisdiction with full tort compensation systems for auto insurance. In a 2015 study by the Insurance Research Council (IRC) titled Fraud and Buildup in Auto Injury Insurance Claims, 1 the IRC studied over 35,000 auto injury claims closed with payment in 2012 in the US. After completing a detailed survey regarding the facts of each claim, file reviewers were asked to rate the claim with respect to their degree of suspicion of fraud and buildup and to indicate what elements of each might be present. From this significant sample size, the IRC drew several conclusions. In its Executive Summary on page 3 of this report, 2 IRC noted that The rate of attorney involvement among claims with the appearance of fraud and buildup was double that of other claims. On page 37 of this report, the IRC provided more detail, stating, The appearance of claim abuse was associated with higher rates of attorney involvement. More than eight in 10 BI claims with the appearance of buildup involved attorneys, nearly double the 42 percent among BI claims without the appearance of fraud or buildup. Also of note is the finding that Claims with the appearance of fraud and/or buildup were more likely than other claims to involve chiropractic treatment, physical therapy, alternative medicine, and the use of pain clinics. In the New Brunswick study, referred to in the preamble to this information request, Oliver Wyman does not address fraudulent or exaggerated claims. The New Brunswick study acknowledges that the causes of the decline in BI frequency in New Brunswick from 1999 through to 2012 is unclear. The New Brunswick study states: It is also our opinion, based on the statistical analysis we performed on the New Brunswick aggregate Industry data, that the MIR contributed to the sharp decline in the frequency rate that occurred in the second half of 2003 when the MIR was 1 For more information on the study, please see IRC, Insurance Research Council Finds That Fraud and Buildup Add Up to $7.7 Billion in Excess Payments for Auto Injury Claims, February 3, 2015, 2 Excerpts from the IRC report provided with permission.
156 British Columbia Utilities Commission Information Request No RR BCUC.85.1 Dated 12 January Page 3 of 3 introduced - a decline that is likely due to a reduction in the propensity to file Bodily Injury claims. ICBC cannot comment on whether this view extends to fraud or exaggeration and, therefore, cannot make any conclusions regarding the comparison of the impact from fraud between New Brunswick and BC.
157 British Columbia Utilities Commission Information Request No RR BCUC.85.2 Dated 12 January Page 1 of RR BCUC.85.2 Reference: PERFORMANCE MEASURES Exhibit B-5, RR BCUC.60.5 Legal Representation and BI Frequency and Severity In response to RR BCUC.60.5, ICBC states: The success of these caps and deductibles in mitigating increasing Bodily Injury (BI) severity is difficult to ascertain, in large part due to other insurance reforms, such as rate reductions, being adopted at the same time. Two studies conducted by Oliver, Wyman Limited (Oliver Wyman) found that the caps on general damages for minor injury claims of $2,500 in New Brunswick and $2,500 in Nova Scotia have significantly reduced BI claims costs. In the study on Minor Injury Regulation (MIR) in New Brunswick (New Brunswick study), Oliver Wyman stated, Based on our analysis, we estimate that the 2003 minor injury cap as it was currently applied reduced the private passenger automobile BI coverage average cost per claim by approximately 37%. The impact of Nova Scotia s MIR was smaller than New Brunswick s MIR. In the study on Nova Scotia s MIR (Nova Scotia study), Oliver Wyman noted, we estimate the average cost per BI claim to have declined by 21% as a result of the MIR. Alberta introduced a cap in October The cap was briefly suspended for the last half of 2008 and the first half of 2009 due to a court decision. ICBC stated in the response to information request RR BCUC.103.1, ICBC's BI severity has been rising steadily at about 6% whereas Alberta s BI severity trend has moderated due to Alberta's minor injury cap. Alberta s selected trend for BI severity was 0.9%. New Brunswick s 2003 MIR was not expected to have an impact on BI frequency. However, in the New Brunswick study, Oliver Wyman noted, Based on our analysis, we estimate the introduction of the MIR may have reduced the Bodily Injury coverage frequency rate by approximately 20% at the time of its introduction in the second half of There was no impact on BI claim frequency in Nova Scotia. In the Nova Scotia study, Oliver Wyman noted, We, therefore, take the position that the MIR has not had a material effect on the Bodily Injury claim frequency rate in Nova Scotia. With respect to BI Severity for minor injury claims, how do ICBC s costs compare to the $2,500 in New Brunswick and Nova Scotia? Response: Since the MIR in New Brunswick and Nova Scotia impose a $2,500 cap specifically on the general damages portion of minor injury claims, ICBC is likewise providing a severity amount specific to general damages. ICBC is providing the severity for BI claimants with soft tissue
158 British Columbia Utilities Commission Information Request No RR BCUC.85.2 Dated 12 January Page 2 of 2 injuries only and an injury severity rated as mild, as ICBC does not track claims based on the criteria set out in the New Brunswick or Nova Scotia MIR. The BI severity of general damages for mild soft tissue injury BI claimants is approximately $XXXXX per claimant, which is higher than the $2,500 cap referred to above. The redacted information is provided in a response to this information request filed confidentially with the Commission. Each claim handled by ICBC is based upon the individual circumstances and characteristics of such claim; thus, providing an average severity to the public may influence settlement negotiations with claimants and prejudice ICBC and Basic insurance policyholders, thereby harming both ICBC s and Basic insurance policyholders financial interests.
159 British Columbia Utilities Commission Information Request No RR BCUC Dated 12 January Page 1 of RR BCUC Reference: PERFORMANCE MEASURES Exhibit B-5, RR BCUC.62.1, TREAD RR Fraud In response to RR BCUC.62.1, ICBC states: SIU s authority to recommend criminal charges is an important tool in deterring future fraudulent activity. SIU continues to investigate and recommend criminal charges focused on targeted areas, such as premeditated and organized fraud, and repeat offenders. There has been upward growth in criminal charges for Claims SIU since In response to RR TREAD , ICBC indicates that the number of criminal convictions that resulted from ICBC proceeding with criminal charges fell from 106 in 2011 to 26 in Please expand the table in RR BCUC.62.1 to include 2015 data if available Please expand the table in RR TREAD.20.1 to include 2015 data if available The tables seem to indicate a reduced focus and success rate on fraud by ICBC. Please discuss the apparent decline in charges laid and convictions with the claims by ICBC that it puts a priority on fraud investigations. Response: 86.1 The information for 2015 has been added to the table provided in RR BCUC.62.1 on the number of charges laid and the number of instances that were approved for initiating civil recovery by ICBC. 2010* Charges Laid Civil Recoveries** * Data for 2010 includes both Claims and Driver Licensing charges laid; the remaining years reflect Claims investigation charges only. ** It is not necessary to initiate a legal action in civil court in order to recover money from a claimant who has committed a breach of their contract of insurance. Note: Data may vary over time due to changes in the timing of criminal charge reporting. Estimates are refreshed periodically in order to account for current information.
160 British Columbia Utilities Commission Information Request No RR BCUC Dated 12 January Page 2 of The information for 2015 has been added to the table provided in the response to RR TREAD.20.1, filed in the response to information request RR TREAD , on the number of convictions that resulted from proceeding with charges. A new footnote has been provided which indicates that the 2010, 2011, and 2012 data include both Claims and Driver Licensing related convictions. As indicated in the footnote to the table in the response to RR BCUC.86.1 above, data for 2010 includes both Claims and Driver Licensing charges laid. In some cases, it make take a few years for charges to be resolved. 2010* 2011* 2012* Number of convictions * Data for 2010, 2011, and 2012 includes both Claims and Driver Licensing related convictions; the remaining years reflect Claims Investigation convictions only There has been an increase in the number of charges laid since As discussed in the response to information request RR BCUC.62.1, resources for ICBC related criminal investigations were reallocated to help support adjusters with addressing bodily injury claims costs. Focusing investigations on bodily injury claims may result in fewer criminal charges being laid; however, it is expected that there will be savings to claims costs. ICBC will also seek civil recoveries where opportunities are present. As deemed necessary by the merits of the case, criminal charges will continue to be pursued in both injury and non-injury investigations. ICBC recommends charges, but it does not determine which charges are approved by Crown Counsel or whether the matters actually proceed to trial in any given year. The total number of convictions depends on the number of ICBC cases that Crown Counsel elects to prosecute, and on the determination by a judge or jury as to whether the charge has been proven. There may be a number of legitimate reasons for not proceeding with charges, which is not reflective of the merits of the case. As a result, the number of convictions is not a reliable measure of the success of ICBC s anti-fraud programs.
161 British Columbia Utilities Commission Information Request No RR BCUC.87.1 Dated 12 January Page 1 of RR BCUC.87.1 Reference: Road Safety Exhibit B-5, RR BCUC.65.1 Attachment A Basic Loss Ratio In response to RR BCUC.65.1, Expanded Figure 8.2, ICBC indicates a declining number of FTEs in Road Safety. Footnote 4 explains the numbers. Do the FTE numbers in Expanded Figure 8.2 represent the average number of employees dedicated to Road Safety over the years on some comparable basis? If yes, why have they declined by 1/3? If no, please provide the number of employees dedicated to Road Safety on a comparable basis over the years. Response: Yes, the full-time equivalent (FTE) numbers in the response to information request RR BCUC.65.1, Attachment A Expanded Figure 8.2 were adjusted to reflect Integrated Traffic Camera Unit staff moving to the Insurance Division in There were, however, other changes that occurred due to corporate restructuring in 2013 and In 2012, the FTE number planned was 44.6 and then decreased to 35.3 in 2013 primarily due to the centralization of planning and research functions. In 2014, the FTE number planned was 34.6 and then decreased to 29.8 in 2015 primarily due to ICBC refining its operating model and organizational structure to support the corporate strategy and improve business processes.
162 BC Pensioners' and Seniors' Organization Information Request No RR BCOAPO Dated 12 January Insurance Corporation of British Columbia Response Issued 29 January Page 1 of RR BCOAPO Reference: Exhibit B-5, BCOAPO IR#1, 2.1 Preamble: The response to BCOAPO IR#1, 2.1 stated that ICBC does not currently analyze the Legal Representation Rate based on a breakdown between Personal and Commercial policies. 1.1 Does this mean that ICBC has chosen not to research differences between Personal and Commercial lines, or that it is unable to do such an analysis for technical reasons? 1.2 If technical reasons have prevented a differential analysis of legal representation rates between Personal and Commercial, will recent ICBC systems upgrades now allow for such analysis to be undertaken? If not, what additional facilities (systems, software, personnel) would be required in order to do so? Response: ICBC s reporting and analysis resources are directed based on business priorities. The analysis of legal representation rates across all types of policyholders provides valuable insight, but understanding it more within separate policy types would not clearly add significant value. This is particularly true because the claimant, who must decide to obtain legal representation (or not to), will frequently not be aware of whether the at-fault party is insured under a Personal or Commercial policy. In terms of the impact on forecasts and pricing analyses, the cost of claims may be directly observed for each line of business separately; therefore, the level of legal representation by line of business does not need to be further analyzed at this level and would not have a material impact on the rate indication analysis.
163 BC Pensioners' and Seniors' Organization Information Request No RR BCOAPO.2.1 Dated 12 January Page 1 of RR BCOAPO.2.1 Reference: Exhibit B-5, BCOAPO IR#1, 3.2 Preamble: The quoted excerpt from the Application in BCOAPO 3.2 stated as follows: Many customers perceive that lawyers reduce the hassle of dealing with ICBC, offer a chance for a higher settlement, provide access to more treatment, and enable customers to focus on their recovery. In addition, many customers feel hiring a lawyer gives customers a greater sense of control by having an expert fully on their side. [Emphasis added] The response to BCOAPO 3.2 stated that Customers may provide comments about hassles they have experienced, however, these are received intermittently and are not used for trending. [Emphasis added] Please clarify what was intended by the term many customers in the quotation from the Application, and how that is consistent with the statement that such feedback is received intermittently in the response. Response: ICBC employs different mechanisms, such as customer surveying and focus groups, to attain customer feedback and an understanding of customer attitudes. The Customer Attitudes Survey was developed specifically to gain customer feedback to help ICBC understand the factors that may influence a customer s decision to seek legal representation. Through the analysis conducted specific to the Customer Attitudes Survey, it was deemed that cumulatively many customers perceive a variety of benefits to hiring a lawyer. Some of the perceived lawyer benefits included less hassle of dealing with ICBC, chance for a higher settlement, access to more treatment, and more focus on the customer s recovery. Some of the themes garnered through the Customer Attitudes Survey have been reinforced through solicited and unsolicited feedback received from customers through multiple mechanisms.

164 BC Pensioners' and Seniors' Organization Information Request No RR BCOAPO.3.1 Dated 12 January Page 1 of RR BCOAPO.3.1 Reference: Exhibit B-5, BCOAPO IR#1, 3.1, 32.2, and BCUC IR# Preamble: The response to BCOAPO 3.1 refers to BCUC 60.2, which provides the following table: The response to BCUC 32.2, which requested the utilization rate for AB for the years from 2000 to 2014, said as follows: ICBC cannot quantify the underlying utilization rate. While the number of claims actually advanced is known, the number of claims that would constitute a full utilization rate cannot be observed. Please clarify how the utilization rate cannot be observed (per BCOAPO 32.2), yet is listed as a measurable outcome in BCUC 60.2.
165 BC Pensioners' and Seniors' Organization Information Request No RR BCOAPO.3.1 Dated 12 January Page 2 of 2 Response: In the response to information request RR BCUC.60.2, ICBC did not list a utilization rate as a measurable outcome. The measurable outcome listed is Utilization of Accident Benefits, which can be observed based on the number of claims advanced. As discussed in the response to information request RR BCOAPO.32.2, ICBC cannot calculate a utilization rate based on the claims advanced relative to the number of total potential claimants who would be eligible for medical benefits since ICBC is not generally aware of, and therefore cannot quantify, potential claimants who choose not to advance a claim for these benefits.

166 BC Pensioners' and Seniors' Organization Information Request No RR BCOAPO Dated 12 January Insurance Corporation of British Columbia Response Issued 29 January Page 1 of RR BCOAPO Reference: Exhibit B-5, BCOAPO IR#1, 8.1, and BCUC IR# Preamble: BCUC 60.1 notes that "...there were some delays observed in 2014 in the coding of representation, as a transitional impact of the new claims management system." In response to BCOAPO 8.1, ICBC provided figures per the following table: 4.1 The table provided in response to BCOAPO 8.1 appears to show the rate of increase in most of the series leveling off through 2013, but increasing again in Please comment whether ICBC agrees with that general characterisation. 4.2 Is it possible that the coding of representation affected the above-tabled data, and other related figures for 2014, presented in the Application? Please comment. Response: 4.1 The general characterization that the rate of increase levelled off in 2013 is too broad, and does not accurately reflect the range of data shown across the various line items. Furthermore, as described in the Application, Chapter 5, paragraph 62, and Chapter 6, paragraph 44, bodily injury (BI) claims costs on closed claims is dependent on both the volume and mix of litigated claims closed, which varies from year to year. These paragraphs explain that the 2014 increase in BI Paid Severity was an expected consequence of ICBC s plan to target the closure of a greater proportion of aging and represented claims. As this example demonstrates, characterizations on the trending in the table in the reference above, in the absence of details regarding the complexity and volume of claims settled for each of the years, has minimal value.
167 BC Pensioners' and Seniors' Organization Information Request No RR BCOAPO Dated 12 January Insurance Corporation of British Columbia Response Issued 29 January Page 2 of No, the data in the table in the reference above is not impacted by delays in the coding of a representation indicator on the files. The represented and litigated indicators would have been added by the time of claim closure, and the figures in this table represent payments on closed litigated claims.

168 BC Pensioners' and Seniors' Organization Information Request No RR BCOAPO.5.1 Dated 12 January Page 1 of RR BCOAPO.5.1 Reference: Exhibit B-5, BCOAPO IR#1, 10.3 What Target Downside Deviation was used in calculating the figures presented in the tabled figures for the Stortino Ratio? Response: Risk statistics for the ICBC investments portfolio are calculated by ICBC s custodian, State Street. State Street calculates downside deviation (i.e., the denominator of the Sortino Ratio) as the standard deviation of monthly negative excess returns between the investment portfolio and its policy benchmark over rolling 4-year periods.
169 BC Pensioners' and Seniors' Organization Information Request No RR BCOAPO.6.1 Dated 12 January Page 1 of RR BCOAPO.6.1 Reference: Exhibit B-5, BCOAPO IR#1, 11.1 Preamble: The response to BCOAPO 11.1 states as follows: ICBC is not aware of any rationale provided by the Office of the Superintendent of Financial Institution (OSFI) for requiring the phase-in approach. OSFI s 2015 Minimum Capital Test (MCT) Guideline does not explain the rationale for the phase-in but simply states: P&C insurers are required to phase-in the capital impact of the revised MCT framework. The phase-in should be done on a straight-line basis, over twelve quarters, starting with the first quarter ending in The 2015 MCT Guideline also states the phase-in is mandatory for all insurers, whether the impacts are favourable or unfavourable per below: In order to ensure that all companies are treated equally, the phase-in is mandatory for all insurers whether they are affected positively or negatively. OSFI appears to have anticipated that insurers in competitive market structures could, absent this requirement, have taken advantage of opportune MCT situations to predate prices against other insurers whose capital situation was transitively less favourable -- or, alternatively, that temporarily MCT-disadvantaged insurers could lose market share. Please comment as to this characterisation of the reason for the phase-in. Response: As stated in the response to information request RR BCOAPO.11.1, ICBC is not aware of any rationale provided by OSFI for requiring the phase-in approach beyond a statement of fair treatment. Commenting on the intervener s characterization of the reason for the phase-in would be pure speculation and, therefore, would be inappropriate.
170 BC Pensioners' and Seniors' Organization Information Request No RR BCOAPO.6.2 Dated 12 January Page 1 of RR BCOAPO.6.2 Reference: Exhibit B-5, BCOAPO IR#1, 11.1 Preamble: The response to BCOAPO 11.1 states as follows: ICBC is not aware of any rationale provided by the Office of the Superintendent of Financial Institution (OSFI) for requiring the phase-in approach. OSFI s 2015 Minimum Capital Test (MCT) Guideline does not explain the rationale for the phase-in but simply states: P&C insurers are required to phase-in the capital impact of the revised MCT framework. The phase-in should be done on a straight-line basis, over twelve quarters, starting with the first quarter ending in The 2015 MCT Guideline also states the phase-in is mandatory for all insurers, whether the impacts are favourable or unfavourable per below: In order to ensure that all companies are treated equally, the phase-in is mandatory for all insurers whether they are affected positively or negatively. Are OSFI Guidelines generally premised on insurers having to incorporate marketing considerations into their eventual ratemaking? Please comment, and in particular, regarding the extent to which 'conjectural variation' (i.e., competitor reaction) factors into auto insurer ratemaking. Response: ICBC is not aware of any rationale provided by OSFI for the 2015 MCT Guideline that incorporates conjectural variation or other marketing considerations in auto insurer ratemaking and is, therefore, unable to speculate on behalf of OSFI as to its reasons behind the OSFI guidelines. Please refer to the response to information request RR BCOAPO.6.4 for further discussion on how marketing considerations can influence ratemaking for insurers.
171 BC Pensioners' and Seniors' Organization Information Request No RR BCOAPO.6.3 Dated 12 January Page 1 of RR BCOAPO.6.3 Reference: Exhibit B-5, BCOAPO IR#1, 11.1 Preamble: The response to BCOAPO 11.1 states as follows: ICBC is not aware of any rationale provided by the Office of the Superintendent of Financial Institution (OSFI) for requiring the phase-in approach. OSFI s 2015 Minimum Capital Test (MCT) Guideline does not explain the rationale for the phase-in but simply states: P&C insurers are required to phase-in the capital impact of the revised MCT framework. The phase-in should be done on a straight-line basis, over twelve quarters, starting with the first quarter ending in The 2015 MCT Guideline also states the phase-in is mandatory for all insurers, whether the impacts are favourable or unfavourable per below: In order to ensure that all companies are treated equally, the phase-in is mandatory for all insurers whether they are affected positively or negatively. As ICBC faces no competition for Basic, are there any reasons why the Commission should not establish a phase-in period specifically appropriate to ICBC? Please comment. Response: The Commission is required, by Special Direction IC2, to calculate the Basic MCT ratio using the current OSFI MCT guideline. Therefore, the Commission does not have the discretion or authority to establish a phase-in period that is different from the mandatory approach prescribed in the 2015 OSFI MCT Guideline.
172 BC Pensioners' and Seniors' Organization Information Request No RR BCOAPO.6.4 Dated 12 January Page 1 of RR BCOAPO.6.4 Reference: Exhibit B-5, BCOAPO IR#1, 11.1 Preamble: The response to BCOAPO 11.1 states as follows: ICBC is not aware of any rationale provided by the Office of the Superintendent of Financial Institution (OSFI) for requiring the phase-in approach. OSFI s 2015 Minimum Capital Test (MCT) Guideline does not explain the rationale for the phase-in but simply states: P&C insurers are required to phase-in the capital impact of the revised MCT framework. The phase-in should be done on a straight-line basis, over twelve quarters, starting with the first quarter ending in The 2015 MCT Guideline also states the phase-in is mandatory for all insurers, whether the impacts are favourable or unfavourable per below: In order to ensure that all companies are treated equally, the phase-in is mandatory for all insurers whether they are affected positively or negatively. Is it standard actuarial practice to incorporate marketing considerations into account for ratemaking? Please comment, and in particular, with regard to retention considerations. Response: While marketing considerations are not relevant to ratemaking for ICBC s Basic insurance, ICBC can provide the following comments in response to this information request. An indicated rate under accepted actuarial practice is the best estimate of the premium required to provide for the corresponding expected claims costs, expenses, and provision for profit. Where expected changes in marketing plans or market conditions, including expected retention levels, are relevant to the estimation of future claims costs or expenses, they must be considered under accepted actuarial practice. Marketing considerations, such as the intended competitive position of an insurer within the market, may also be considered by the insurer in determining the profit provision, which commonly is specified to the actuary by the insurer s board of directors or management.
173 BC Pensioners' and Seniors' Organization Information Request No RR BCOAPO.6.5 Dated 12 January Page 1 of RR BCOAPO.6.5 Reference: Exhibit B-5, BCOAPO IR#1, 11.1 Preamble: The response to BCOAPO 11.1 states as follows: ICBC is not aware of any rationale provided by the Office of the Superintendent of Financial Institution (OSFI) for requiring the phase-in approach. OSFI s 2015 Minimum Capital Test (MCT) Guideline does not explain the rationale for the phase-in but simply states: P&C insurers are required to phase-in the capital impact of the revised MCT framework. The phase-in should be done on a straight-line basis, over twelve quarters, starting with the first quarter ending in The 2015 MCT Guideline also states the phase-in is mandatory for all insurers, whether the impacts are favourable or unfavourable per below: In order to ensure that all companies are treated equally, the phase-in is mandatory for all insurers whether they are affected positively or negatively. What is the farthest from actuarially indicated rates insurers would be expected to deviate before correcting actual rates to align with actuarially indicated rates? Response: As discussed in the Application, Chapter 1, ICBC s proposed Basic insurance rate was determined in accordance with accepted actuarial practice. ICBC understands that this is expected by the Commission, which regulates Basic insurance rates in BC, and is required under section 3(c) of Special Direction IC2 to fix rates on the basis of accepted actuarial practice. One component of rates that must be included under accepted actuarial practice is the capital provision, which for ICBC s Basic insurance rates is determined according to the Basic Capital Management Plan (CMP) that the Commission has approved. Consistent with the provisions of Special Direction IC2, ICBC s Basic CMP takes into account government directives issued to ICBC under section 3(c.1) and the rate smoothing framework under section 3(c.2). The expectations for insurers regulated by different regulators may differ in regard to what is required or permitted with respect to rate setting. ICBC does not set Basic insurance rates under any other regulator, and is not able to speculate in this regard.
174 BC Pensioners' and Seniors' Organization Information Request No RR BCOAPO.7.1 Dated 12 January Page 1 of RR BCOAPO.7.1 Reference: Exhibit B-5, BCOAPO IR#1, 18.1 Has ICBC observed any tendency for the number of claimants per claim to change with the age of the claim? Please comment, and in particular, whether the number tends to increase, decrease (or simply remains steady) with claim age. Response: The number of claimants per claim will generally tend to increase with the age of the claim, particularly in the first few months after a claim is reported. In the context of the ratio for a given accident year in aggregate (represented as a point in the figure reproduced in this information request), most of the development in the number of claimants per claim occurs during the first 15 months from the start of an accident year (e.g., the number of claimants per claim for accident year 2014 would have become relatively stable beyond March 31, 2015). In the case of a claim with multiple claimants, each claimant may wait a different amount of time to report his or her bodily injury (BI) claim against the same at-fault driver. When the first BI claimant reports, the BI claim will be opened. As any additional BI claimants report claims against the same at-fault driver, the number of claimants on the claim will increase and, therefore, the ratio of claimants to claims in the claim population as a whole will also rise.
175 BC Pensioners' and Seniors' Organization Information Request No RR BCOAPO.7.2 Dated 12 January Page 1 of RR BCOAPO.7.2 Reference: Exhibit B-5, BCOAPO IR#1, 18.1 What is the difference in the average number of claimants per claim for Represented versus Unrepresented BI claims, and has any trend in that ratio been observed since 2007? Please comment. Response: The number of claimants per claim shown in Figure 1 below is based on the recorded number of bodily injury (BI) claim exposures as of December 31, 2015, divided by the recorded number of BI claims as of the same date. When splitting the recorded BI claims into represented and unrepresented categories, a claim with both represented and unrepresented claimants is considered to be a represented claim.
176 BC Pensioners' and Seniors' Organization Information Request No RR BCOAPO.7.2 Dated 12 January Page 2 of 2 Figure 1 Number of Claimants per BI Claim, Split by Representation Status 1.60 Represented Unrepresented Claim Exposure to Claim Ratio Accident Year As seen in Figure 1, the number of BI claimants per BI claim in both the represented and unrepresented categories are relatively flat from accident year 2007 to The number of unrepresented BI claimants per unrepresented BI claim rises for accident years 2013 and 2014, while the number of represented BI claimants per represented BI claim remains flat in accident year 2013 and drops in accident year However, the figures for claims incurred in 2014 are still immature, because not all BI claimants that will eventually become represented have been identified as represented claimants as of December 31, Therefore, it would be speculative to draw any conclusions on whether or not the trend in each of these categories is changing from the flat trend observed since 2007.
177 BC Pensioners' and Seniors' Organization Information Request No RR BCOAPO.7.3 Dated 12 January Page 1 of RR BCOAPO.7.3 Reference: Exhibit B-5, BCOAPO IR#1, 18.1 Has ICBC observed any relationship between the report date / accident date interval and the number of claimants per claim? Please comment. Response: As discussed in the response to information request RR BCOAPO.7.1, the report date for a BI claim is the date on which a first BI claimant reports the claim. Subsequent to that, other BI claimants may be added to the claim for the same at-fault driver, but that is after the report date. Therefore, the length of the accident date to report date interval for a BI claim is not considered to bear a meaningful relationship with the number of claimants per claim, and has not been analyzed.
178 BC Pensioners' and Seniors' Organization Information Request No RR BCOAPO.8.1 Dated 12 January Page 1 of RR BCOAPO.8.1 Reference: Exhibit B-5, BCOAPO IR#1, 16.4 Preamble: Per Figure 1, Crash Frequency has a reasonably consistent, downward trend through In contrast, Figure 2.6 shows that the BI Frequency has flattened since Please comment on what factors could explain the contrasting trends.
179 BC Pensioners' and Seniors' Organization Information Request No RR BCOAPO.8.1 Dated 12 January Page 2 of 2 Response: The crash statistic data shown in the response to information request RR BCOAPO.16.4 is based on the number of crashes for both first party and third party liability claims. Since bodily injury (BI) frequency includes only third party injury claims, the crash frequency and BI frequency data are not directly comparable. The Application, Chapter 2, Figure 2.8 shows a consistent comparison of injury and crash frequency trends by combining BI frequency and property damage (PD) frequency as a ratio. Through 2009, this ratio exhibited a declining trend for over 10 years, which is in line with the expectation that the addition of safer vehicles and improvements in road infrastructure should result in fewer injury claims relative to the number of crashes over time. Since 2009, this trend has reversed. ICBC does not have a definitive conclusion about the reason for the divergence between the BI and the PD frequency trends that has been observed in more recent years. While the incidence of both BI and PD claims coverages are influenced by many factors that affect crashes in general, the BI and PD coverages provide protection for different kinds of loss, where each is influenced by factors specific to that kind of loss. Factors that would influence the occurrence of BI claims differently than PD claims are typically those that can affect the likelihood of an injury claim arising from a given crash. Examples include vehicle occupancy rates, risk factors involving pedestrians and cyclists, occupant protection technologies, and changes in the awareness and motivation of claimants in making BI claims.
180 BC Pensioners' and Seniors' Organization Information Request No RR BCOAPO.9.1 Dated 12 January Page 1 of RR BCOAPO.9.1 Reference: Exhibit B-5, BCOAPO IR#1, 25.1 and 25.2 Preamble: The response to BCOAPO 25.1 stated as follows: Since lower Basic insurance premiums are charged for the senior rate class, all else equal, an increase in the proportion in the senior rate class means that a higher proportion of the overall customer population is receiving a 25% discounted Basic insurance premium. The result is a decrease in ICBC s average premium. On balance, what impact has the increasing proportion of Seniors had on overall Loss Costs? Please explain. Response: The proportion of policies in the senior rate class grew from about 12.9% in 2009 to about 14.6% in Analysis carried out in 2007 indicated that the loss experience for senior rate class policies is typically lower than that for customers in other rate classes. 1 Assuming that the loss experience for seniors is still favourable in 2015 compared to similar customers, the increasing proportion of policies in the senior rate class could be seen as having put downward pressure on overall loss costs. To quantify the impact on loss cost would require an update to the estimation of loss cost relativities; this would be part of rate design and, therefore, is not part of this Revenue Requirements Application. As described in the response to information request RR BCOAPO.25.2, filed in the response to information request RR BCOAPO , the impact of the growth in the senior rate class is reflected in the overall loss trends. In particular, since bodily injury (BI) claim frequency is lower for the senior rate class compared to other pleasure use rate classes, the downward pressure on loss costs would be observed as a slightly lower trend in BI frequency compared to the trend that would have been observed if there were no increase in the proportion of senior rate class policies since Partially offsetting this, a higher trend in BI severity would be observed compared to the same hypothetical baseline, since BI severity is higher for the senior rate class compared to other pleasure use rate classes. 1 Please see the response to information request RD BCUC.2.3.
181 BC Pensioners' and Seniors' Organization Information Request No RR BCOAPO.9.2 Dated 12 January Page 1 of RR BCOAPO.9.2 Reference: Exhibit B-5, BCOAPO IR#1, 25.1 and 25.2 Preamble: The response to BCOAPO 25.1 stated as follows: Since lower Basic insurance premiums are charged for the senior rate class, all else equal, an increase in the proportion in the senior rate class means that a higher proportion of the overall customer population is receiving a 25% discounted Basic insurance premium. The result is a decrease in ICBC s average premium. Please provide a table showing the number of Seniors policies associated with each CRS Level for each of 2008, 2011, and (Use one summary count for Levels -9 through -20) Response: Please see Figure 1 below for the number of policies in the seniors rate class with effective dates in 2008, 2011, and 2014, broken down by Claim-Rated Scale (CRS) levels. Figure 1 Number of Policies in the Seniors Rate Class Policy Effective Year CRS Level and Higher , , ,615 1,220 1, ,901 1,585 1, ,963 2,894 3,720-9 to , , ,627
182 BC Pensioners' and Seniors' Organization Information Request No RR BCOAPO.9.3 Dated 12 January Page 1 of RR BCOAPO.9.3 Reference: Exhibit B-5, BCOAPO IR#1, 25.1 and 25.2 Preamble: The response to BCOAPO 25.2 stated as follows: Based on a comparison between the senior rate class and other pleasure use rate classes, the following observations can be made: a) BI frequency is lower for the senior rate class. b) BI severity is higher for the senior rate class. Is there any differential between the Legal Representation rate for Seniors versus other insurees? Please comment. Response: As discussed in the 2013 Revenue Requirements Proceeding, claimants over the age of 65 tend to seek legal representation less often, relative to younger age groups. This continues to be the case.
183 BC Pensioners' and Seniors' Organization Information Request No RR BCOAPO.9.4 Dated 12 January Page 1 of RR BCOAPO.9.4 Reference: Exhibit B-5, BCOAPO IR#1, 25.1 and 25.2 Preamble: The response to BCOAPO 25.2 stated as follows: Based on a comparison between the senior rate class and other pleasure use rate classes, the following observations can be made: a) BI frequency is lower for the senior rate class. b) BI severity is higher for the senior rate class. Is the differential between the BI Frequencies and Severities for Seniors versus other pleasure rate classes remaining constant over time (e.g., since 2009), or is it diverging? Please explain. Response: The differential of BI frequency for seniors versus other pleasure use rate classes has been increasing slightly from accident year 2009 to The differential of BI severity for seniors versus other pleasure use rate classes has not significantly changed from accident year 2009 to 2014.
184 BC Pensioners' and Seniors' Organization Information Request No RR BCOAPO Dated 12 January Insurance Corporation of British Columbia Response Issued 29 January Page 1 of RR BCOAPO Reference: Exhibit B-5, BCOAPO IR#1, 40.2 Preamble: The response to BCOAPO 40.2 stated as follows: The increase in the PfAD amount from 2013 to 2014 is about 6% and is due to growth in claim costs. The increase in the PfAD amount from 2014 to 2015 is about 18% and is due to both growth in claims costs and an increase to the selected claims PfAD margins. As recommended by ICBC s external actuary, the claims PfAD margins were increased in 2014 in order to reflect uncertainty related to the integration of claims data from the new claims management system with existing legacy claims data What was the rate indication impact of the PfAD increase for 2014? 10.2 What is the rate indication impact of the PfAD increase for 2015? Response: The increases in ICBC s provision for adverse deviations (PfAD) have no impact on either the policy year 2014 or 2015 rate indications. The PfAD reflects the degree of uncertainty of a best estimate assumption. It is a provision put in place for financial statement purposes to reflect the amount of uncertainty in the claims liability estimate. Please note that the claims costs used to calculate the rate indication do not include a PfAD. The only instance where the PfAD is used in the Application is in the calculation of the Investment Income on Basic Equity in Chapter 2, Exhibit G.1, row (l). This calculation is based on the Adjusted Basic Equity, which is Basic Equity excluding the impact of discounting and the PfAD to ensure that policyholders receive the full benefit of ICBC s expected return on investments. The Adjusted Basic Equity is higher than the Basic Equity, which means that the investment income is higher, benefitting Basic insurance policyholders. In addition, the actual amount of PfAD has no impact on the rate indication because the Basic Equity provided in the Application, Chapter 2, Exhibit G.1, row (e) included a PfAD and the adjustment simply removes it.
185 BC Pensioners' and Seniors' Organization Information Request No RR BCOAPO.10.3 Dated 12 January Insurance Corporation of British Columbia Response Issued 29 January Page 1 of RR BCOAPO.10.3 Reference: Exhibit B-5, BCOAPO IR#1, 40.2 Preamble: The response to BCOAPO 40.2 stated as follows: The increase in the PfAD amount from 2013 to 2014 is about 6% and is due to growth in claim costs. The increase in the PfAD amount from 2014 to 2015 is about 18% and is due to both growth in claims costs and an increase to the selected claims PfAD margins. As recommended by ICBC s external actuary, the claims PfAD margins were increased in 2014 in order to reflect uncertainty related to the integration of claims data from the new claims management system with existing legacy claims data. Please explain why an expense increase caused by uncertainty related to an administrative systems change should be fully incident upon ratepayers rather than being also distributed partially to shareholders (or the shareholder, in this case). Response: As discussed in the response to information request BCOAPO , the increases in the PfAD have no impact on the rate indication or to ratepayers.

186 BC Pensioners' and Seniors' Organization Information Request No RR BCOAPO.10.4 Dated 12 January Insurance Corporation of British Columbia Response Issued 29 January Page 1 of RR BCOAPO.10.4 Reference: Exhibit B-5, BCOAPO IR#1, 40.2 Preamble: The response to BCOAPO 40.2 stated as follows: The increase in the PfAD amount from 2013 to 2014 is about 6% and is due to growth in claim costs. The increase in the PfAD amount from 2014 to 2015 is about 18% and is due to both growth in claims costs and an increase to the selected claims PfAD margins. As recommended by ICBC s external actuary, the claims PfAD margins were increased in 2014 in order to reflect uncertainty related to the integration of claims data from the new claims management system with existing legacy claims data. How will ICBC determine whether the estimated uncertainty realistically reflected the potential actual cost of integrating data into the new system? Response: The amount of PfAD is revisited annually by ICBC s actuaries, as well as ICBC s external actuary, to ensure that the PfAD is still a reasonable assumption of the uncertainty within the claims liability estimate for financial statement purposes. Please refer to the response to information request RR BCOAPO , which provides an explanation as to why PfAD does not have an impact on the rate indication.
187 BC Pensioners' and Seniors' Organization Information Request No RR BCOAPO.11.1 Dated 12 January Insurance Corporation of British Columbia Response Issued 29 January Page 1 of RR BCOAPO.11.1 Reference: Reference: Exhibit B-5, BCOAPO IR#1, 41.1 What factors does ICBC believe have had the greatest impact in reducing the number of drivers subject to DPP and DRP -- in particular, are there ICBC-specific policies/practices that have contributed to the trend since 2011? Please comment. Response: ICBC is not able to directly attribute any of ICBC s specific policies or practices to the reduction since 2011 in the number of drivers subject to Driver Penalty Points (DPP) and Driver Risk Premium (DRP). As stated in the Application, Chapter 8, ICBC has numerous initiatives focusing on containing claims frequencies and costs, some of which may have had an impact on the recent decline in the number of drivers subject to DPP and DRP. ICBC also believes that external factors such as driver behaviour, police enforcement, and court decisions on disputed convictions contribute to the impact. However, ICBC is unable to quantify the impacts from these external or internal influences.
188 BC Pensioners' and Seniors' Organization Information Request No RR BCOAPO.12.1 Dated 12 January Insurance Corporation of British Columbia Response Issued 29 January Page 1 of RR BCOAPO.12.1 Reference: Reference: Exhibit B-5, BCOAPO IR#1, 44.1, Attachment A Of the investments listed, which have the potential for negative returns, and what are the potential magnitudes of each of those negative returns? Please explain Response: Theoretically, all asset classes have the potential for delivering negative returns in the short run. The asset classes that demonstrate the higher standard deviation in return, such as equities, high yield bonds, and to a lesser degree, real estate, have the potential of delivering a greater negative return in the short run. The potential magnitude of these negative returns is best represented by the asset class performance during the 2008 global financial crisis, which was the worst episode for financial markets since the Great Depression. In 2008, public market indexes of Canadian equities, Canadian real estate, and US high yield bonds fell between 20% and 40%.
189 BC Pensioners' and Seniors' Organization Information Request No RR BCOAPO.12.1 Dated 12 January Insurance Corporation of British Columbia Response Issued 29 January Page 2 of 2 For fixed income bond and mortgage portfolios, any significant upward shift in interest rates will create a negative return. ICBC invests in short-term bonds and mortgages to limit the negative return impact associated with rising interest rates. For every 1% increase in interest rates, the value of ICBC s fixed income investments will decrease by approximately 2.5%. Over the longer term holding period, a negative return on bond and mortgage investments is not likely given the high quality of ICBC s investments and the associated likelihood of principal and interest repayment. There is also the potential for a small negative return on short-term money market investments. This is unlikely, but would occur if the Bank of Canada followed the actions of several European central banks and cut its key deposit rate to just below zero. Although all asset classes theoretically can generate a negative return, asset class returns are not necessarily correlated. This allows ICBC to utilize the prudent practice of asset class diversification to buffer the overall portfolio from short-term declines in any one asset class. The benefits of diversification were evident in 2008, when very strong returns in the portfolio s fixed income assets lifted the overall portfolio return to +0.9% despite double-digit declines in the portfolio s Canadian and international equity holdings.

190 BC Pensioners' and Seniors' Organization Information Request No RR BCOAPO.13.1 Dated 12 January Insurance Corporation of British Columbia Response Issued 29 January Page 1 of RR BCOAPO.13.1 Reference: Reference: Exhibit B-5, BCOAPO IR#1, 46.1 Preamble: The response to BCOAPO 46.1 notes that In all cases, Basic operating expenses include controllable operating expenses and pension and post-retirement benefit expenses. As indicated in the Application, Chapter 4, the increase from 2014 ($131 per policy) to 2015 ($137 per policy) is attributed to an increase in pension and post-retirement benefit expenses primarily due to a decrease in the market-based discount rate. What market-based discount rates were used in calculating each of the years in the table preceding 2015? Response: The market-based discount rates used in calculating each of the years in the above table are as follows: % 6.6% 5.2% 4.5% 4.8% 4.0% In the response to information request RR BCOAPO.46.1, ICBC stated that the increase to Basic operating expenses is attributed to an increase in pension and post-retirement benefit expenses, primarily due to a decrease in the market-based discount rate. This statement specifically refers to the increase from 2014 to For years prior to 2014, the change in Basic operating expenses was not necessarily attributable primarily to the change in the marketbased discount rate used in calculating the pension and post-retirement benefit expenses.

191 BC Pensioners' and Seniors' Organization Information Request No RR BCOAPO Dated 12 January Insurance Corporation of British Columbia Response Issued 29 January Page 1 of RR BCOAPO Reference: Reference: Exhibit B-5, BCOAPO IR#1, 49.1, and Exhibit B-1-1, Application, p Please list in descending order the 20 largest quarter-on-quarter MCT decreases since 2004 Q Associated with each listed decrease, please show the MCT formula variable that most contributed to the decrease, and what the specific contributing factor affecting that variable was. Response: The Basic MCT ratio is Basic Capital Available (CA) divided by the minimum Basic Capital Required (CR). CA is the Basic equity, which is the sum of Retained Earnings (RE) and Other Components of Equity (OCE), minus regulatory adjustments to CA specified in the Office of the Superintendent of Financial Institution s (OSFI) 2015 Minimum Capital Test (MCT) Guideline. RE is the accumulated net income that is retained by ICBC.
192 BC Pensioners' and Seniors' Organization Information Request No RR BCOAPO Dated 12 January Insurance Corporation of British Columbia Response Issued 29 January Page 2 of 3 Since 2013, OCE is comprised of the net change in available for sale financial assets and the pension and post-retirement benefit re-measurements. Net changes in available for sale financial assets can be due to either reclassifications to investment income or net unrealized gains/losses arising on the available for sale financial assets. CR is a risk-based formula which is the sum of items on the balance sheet, including balance sheet assets, premium liabilities, and unpaid claims after OSFI-prescribed risk factors have been applied. Comparative Period Change Over Prior Quarter in Percentage Points Explanation (ppt) 1 Q Q ppt See note 1 2 Q Q ppt See notes 1 and 2 3 Q Q ppt See note 1 4 Q Q ppt See note 1 5 Q Q ppt See notes 1 and 2 6 Q Q ppt See notes 1 and 2 7 Q Q ppt See note 1 8 Q Q ppt See note 2 9 Q Q ppt See note 1 10 Q Q ppt See note 2 11 Q Q ppt See notes 1 and 2 12 Q Q ppt See note 3 13 Q Q ppt See note 4 14 Q Q ppt See note 5 15 Q Q ppt 16 Q Q ppt 17 Q Q ppt 18 Q Q ppt See note 6 19 Q Q ppt 20 Q Q ppt
193 BC Pensioners' and Seniors' Organization Information Request No RR BCOAPO Dated 12 January Insurance Corporation of British Columbia Response Issued 29 January Page 3 of 3 Note 1: CA decreased due to a decrease in RE, which was mainly due to a net loss during the quarter. Note 2: CA decreased due to a decrease in OCE, which was mainly due to a decrease in fair value of available for sale financial assets. Note 3: The decrease in Basic MCT ratio was the result of both a decrease in CA and an increase in CR. CA decreased due to a decrease in RE (mainly due to a net loss during the quarter); this was coupled by an increase in CR (due mainly to an increase in unpaid claims, which has a risk factor of 10%). Note 4: CA decreased due to a decrease in RE, which was the result of the conversion to International Financial Reporting Standards from Canadian Generally Accepted Accounting Principles. This conversion changed the way a number of assets and liabilities were reported. More specifically, pension and post-retirement benefit re-measurement losses could no longer be deferred and had to be recognized immediately in RE. Note 5: MCT decreased due to both a decrease in CA and an increase in CR. CA decreased due to a decrease in OCE (mainly due to a decrease in fair value of available for sale financial assets); this was coupled by an increase in CR (mainly due to an increase in equity investments). Note 6: These relatively small percentage point decreases were made up of multiple factors that offset one another to result in an overall decrease.
194 BC Pensioners' and Seniors' Organization Information Request No RR BCOAPO.15.1 Dated 12 January Insurance Corporation of British Columbia Response Issued 29 January Page 1 of RR BCOAPO.15.1 Reference: Reference: Exhibit B-5, BCUC IR#1, 5.1-3, Attachment A Why do the components of the 'Weekly Benefit' Loss Cost differ so much between the two Applications? Response: As discussed in the Application, Chapter 2, paragraph 44, workflow changes for Accident Benefits claims have resulted in a significant increase in Weekly Benefits (WB) claims starting in May 2014, with most of the additional claims being closed without payment. This increase is captured in the WB loss cost data within the current Application and is the reason for the difference between the two Applications. Please see the Application, Chapter 2, Exhibit D.0, page 2 and the response to the information request RR BCUC.28.1, which provides additional information regarding the adjustments that ICBC made to the historical WB data in order to properly forecast future years WB claim frequencies and severities. This adjustment has no net impact to the loss cost.
195 BC Pensioners' and Seniors' Organization Information Request No RR BCOAPO Dated 12 January Insurance Corporation of British Columbia Response Issued 29 January Page 1 of RR BCOAPO Reference: Reference: Exhibit B-5, BCUC IR#1, Please provide a table showing the dollar value of estimated total ultimate loss costs for BI for each of Personal and Commercial lines as estimated and filed at the time of each of the following RRAs: 2010, 2012, 2013, Please provide a table showing the dollar value of estimated total ultimate loss costs for MR for each of Personal and Commercial lines as estimated and filed at the time of each of the following RRAs: 2010, 2012, 2013, Response: 16.1 Table 1 below provides the total policy year ultimate loss costs for Bodily Injury (BI) Basic Personal and Commercial lines of business that were provided in the 2010, 2012, 2013, and 2014 revenue requirements applications. Table 1 BI Basic Loss Cost ($) Policy Year Personal Commercial These numbers do not include any prospective adjustments or bulk loadings Table 2 below provides the total policy year ultimate loss costs for Medical Rehabilitation (MR) Personal and Commercial lines of business that were provided in the 2010, 2012, 2013, and 2014 revenue requirements applications. Table 2 MR Loss Cost ($) Policy Year Personal Commercial These numbers do not include any prospective adjustments or bulk loadings.
196 BC Pensioners' and Seniors' Organization Information Request No RR BCOAPO.17.1 Dated 12 January Insurance Corporation of British Columbia Response Issued 29 January Page 1 of RR BCOAPO.17.1 Reference: Reference: Exhibit B-5, BCUC IR#1, 6.1-2, Attachment B Preamble: The response to 2013 RRA BCUC 29.1 stated as follows: The forecast variances cited in the 2012 Government Review of ICBC (2012 Government Review) relate to estimates of the ultimate amount that will be paid out (ultimate claims cost estimates) on past policies written. There is more uncertainty in the estimates of expected future claims cost, as none of those claims have occurred, whereas estimates of ultimate claims costs relate to claims that are for the most part known, although there is meaningful uncertainty as to the ultimate settlement value. For this reason, the 5 percent in the question is not an appropriate benchmark for the loss cost forecast variances. Given the pattern of ICBC payouts (tails), at how many months could the performance of estimated versus actual loss costs reasonably evaluated with respect to whether it appears to be within the 5% described in the Finance Review? Please comment. (For example, if the remaining tail at month 84 has historically contained 5% of costs, would 84 months represent a reasonable time for determining forecast performance)? Response: To determine whether, based on a selected level of confidence, the loss cost for a particular policy year will ultimately fall within or beyond a specified range (5% from the original estimate), depends on a number of factors, which will differ for each Basic insurance coverage. These include the paid amounts for claims from the policy year up to a point in time and an estimate of the variability of claim payments beyond that point in time. The variability in outstanding claim payments is not directly related to the amount of outstanding payments, although both will tend to decline in dollar value over time. As it would be a significant undertaking, ICBC has not performed an analysis of reserve variability that would be required to provide the answer to this information request, at a particular level of confidence.
197 BC Pensioners' and Seniors' Organization Information Request No RR BCOAPO.18.1 Dated 12 January Insurance Corporation of British Columbia Response Issued 29 January Page 1 of RR BCOAPO.18.1 Reference: Reference: Exhibit B-5, BCUC IR#1, 7.1, Figure 2 Does ICBC believe a BI Frequency of approximately 1.5% represents a lower bound (asymptote)? Please comment. Response: ICBC does not believe that a bodily injury (BI) frequency of approximately 1.5% represents a lower bound or asymptote because there is a possibility that the BI frequency could fall below this level. Please see the response to information request RR BCOAPO.16.1, which posed a similar question.
198 BC Pensioners' and Seniors' Organization Information Request No RR BCOAPO.19.1 Dated 12 January Insurance Corporation of British Columbia Response Issued 29 January Page 1 of RR BCOAPO.19.1 Reference: Reference: Exhibit B-5, BCUC IR#1, 12.1, and BCOAPO IR#1, 16.3 How have 'normal NFT' levels changed over the past 10 years? Please describe. Response: As discussed in the Application, Chapter 2, paragraph 43, the legacy claims management system required initial case reserves to be set when a claim exposure was created. Since setting reserves is the first financial transaction, BI claims with no financial transactions (NFT) did not exist prior to the phased launch of the new claims management system, which started in November Therefore, there are no normal NFT levels for years earlier than shown in Figure 1 above.
199 BC Pensioners' and Seniors' Organization Information Request No RR BCOAPO.19.2 Dated 12 January Insurance Corporation of British Columbia Response Issued 29 January Page 1 of RR BCOAPO.19.2 Reference: Reference: Exhibit B-5, BCUC IR#1, 12.1, and BCOAPO IR#1, 16.3 What correlation has ICBC observed between NFT ratio and the legal representation rate? Please comment. Response: ICBC has not investigated the correlation between the NFT ratio and the legal representation rate because there is no reason to expect a correlation between them. BI NFT claims are the result of adjuster interaction with the claims management system, which has no impact on claimants. Claimant behavior, such as the decision of a claimant to obtain legal representation is, therefore, not suspected to be a consequence of the creation of NFT claims. If there is no causal relationship between the NFT ratio and the legal representation rate, the analysis of any correlation between the two would not provide any meaningful business value.
200 BC Pensioners' and Seniors' Organization Information Request No RR BCOAPO.20.1 Dated 12 January Insurance Corporation of British Columbia Response Issued 29 January Page 1 of RR BCOAPO.20.1 Reference: Reference: Exhibit B-5, BCUC IR#1, 13.1 Preamble: The standard of materiality associated with the actuarial work is one element that ensures meaningful items are reported. It represents an amount that would reasonably affect either the user s decision making or the user s reasonable expectations. Based on discussions with ICBC s external actuary and consideration of what the users might deem significant, 0.5 percentage points of rate was selected as a reasonable standard, which is equivalent to about $13 million or $4 per policy. How did ICBC determine 'what the users might deem significant'? Please explain, and in particular, with regard to whether the users considered were average customers or whether the company took into account those with household budget challenges (e.g., seniors, others on fixed incomes). Response: The Standards of Practice of the Canadian Institute of Actuaries, Section , states that an omission, understatement, or overstatement is material if the actuary expects it materially to affect either the user s decision making or the user s reasonable expectations. With respect to decision making, ICBC believes that a key user is the BC Utilities Commission, who is required to issue a decision regarding the Basic rate change. With regard to reasonable expectations, ICBC believes that users reasonably expect that the rate they will ultimately be charged (consistent with the decision) will only differ from that proposed in the Application if the Commission identifies significant adjustments. For context on how errors or omissions would affect decisions, ICBC considered the amount of variability already inherent within the actuarial rate level analysis, of which the users are aware or ought reasonably to be aware. ICBC also considered evidence as to relevant positions of the key users who make decisions relating to the Application. The paragraphs below provide further information on how each of these elements were considered. Since actuarial forecasts represent estimates of the value of uncertain events whose outcome is uncertain, it is understood by users that information may change over time as further information emerges. Decision makers who rely on actuarial estimates are aware that the use of estimates means that a certain amount of variability in results must be accepted, and therefore a similar, relatively minor amount of understatement, overstatement, or omissions from the original estimates would not be reasonably expected to affect the decisions that rely on the actuarial
201 BC Pensioners' and Seniors' Organization Information Request No RR BCOAPO.20.1 Dated 12 January Insurance Corporation of British Columbia Response Issued 29 January Page 2 of 2 work product. The selected standard of one half of one percent of rate is small relative to the amount of variability inherent in the estimation of claims costs associated with a future policy year. For further information regarding the underlying variability, please refer to the response to information request RR BCUC ICBC operates in a closed system where any forecast variance, including one generated by an error or omission, flows through the capital account triggering a correction to future premium rates. This ensures that any profit or loss that may result from an understatement or overstatement of the rate requirement does not leave the system, but remains and contributes over time in the calculation of required rate levels. ICBC s selected materiality standard of one half of one percentage point of rate, equivalent to approximately $4 per policy, is appropriate in this context based on its use in decision making and setting reasonable expectations by users including ICBC s management and Board of Directors, the Commission, and individual customers.
202 BC Pensioners' and Seniors' Organization Information Request No RR BCOAPO.20.2 Dated 12 January Insurance Corporation of British Columbia Response Issued 29 January Page 1 of RR BCOAPO.20.2 Reference: Reference: Exhibit B-5, BCUC IR#1, 13.1 Preamble: The standard of materiality associated with the actuarial work is one element that ensures meaningful items are reported. It represents an amount that would reasonably affect either the user s decision making or the user s reasonable expectations. Based on discussions with ICBC s external actuary and consideration of what the users might deem significant, 0.5 percentage points of rate was selected as a reasonable standard, which is equivalent to about $13 million or $4 per policy. Does this statement mean an overall change affecting 0.5 percentage points of rate is deemed significant, or in the examination of particular elements a change of 0.5 percent is deemed significant? Please explain. Response: The quoted statement does not mean that a change or element within the rate analysis is deemed to be either significant or insignificant based on a 0.5 percentage point impact on the rate indication. The standard of materiality does not affect the required rate change that is estimated, nor the elements of it that are considered to be significant and highlighted for further discussion in the Application. As discussed in the response to information request RR BCUC.13.1, filed in the response to information request RR BCUC , the standard of materiality is applied to ensure that approximations used in the course of the actuarial rate indication analysis are appropriate, and to determine the treatment of errors or omissions that are found after the completion of the work.
203 BC Pensioners' and Seniors' Organization Information Request No RR BCOAPO.20.3 Dated 12 January Insurance Corporation of British Columbia Response Issued 29 January Page 1 of RR BCOAPO.20.3 Reference: Reference: Exhibit B-5, BCUC IR#1, 13.1 Preamble: The standard of materiality associated with the actuarial work is one element that ensures meaningful items are reported. It represents an amount that would reasonably affect either the user s decision making or the user s reasonable expectations. Based on discussions with ICBC s external actuary and consideration of what the users might deem significant, 0.5 percentage points of rate was selected as a reasonable standard, which is equivalent to about $13 million or $4 per policy. If these changes, administrative in nature rather than customer-caused, result in indication 'discontinuities,' is it ICBC's position that there should be an instantaneous rate change for actuarial conformity, or a levelised adjustment? Please explain. Response: ICBC requested clarification from BCOAPO regarding this information request. It was clarified on January 22, that the reference in the preamble should be to a latter portion of the response to the information request RR BCUC.13.1, filed in the response to information request RR BCUC , which states: In the case where a material error relating to the rate indication analysis underlying the Application is discovered, there is a range of responses that ICBC could undertake depending on the number of exhibits that the error has impacted. In the case where the error is confined to one or two exhibits, ICBC could file an errata and provide the impact on the rate change to cover costs; however, if the impact is more pervasive throughout, ICBC may refile the entire actuarial analysis. In addition, BCOAPO provided written clarification to the actual information request as follows: Were ICBC to discover any error/omission/etc that proved material, and after a rate indication had been proposed, would the company expect regulatory approval to remedy that as an adder (i.e., on top of the proposed rate change), or would it be rolled into the next rate submission. From a consumer viewpoint, the former would be a discontinuity (a sudden step up); the latter treatment would be more akin to normal/typical rate progression, potentially recovered over more than one rate submission. We wanted to know which would be deemed actuarially correct. If a material error or omission were discovered subsequent to the filing of the rate proposal in the Application, ICBC would recalculate the rate change to cover costs in accordance with
204 BC Pensioners' and Seniors' Organization Information Request No RR BCOAPO.20.3 Dated 12 January Insurance Corporation of British Columbia Response Issued 29 January Page 2 of 2 accepted actuarial practice, and disclose the error and its impact to the Commission and other participants in this proceeding. In particular, not only would ICBC disclose the impact on the rate change to cover costs, but ICBC would apply the rate smoothing framework and provide the impact on the indicated rate change, which could be either a negative, positive, or no change depending on how the rate smoothing framework had originally been applied in that particular policy year. The timing of the implementation of the updated rate change is not a matter of accepted actuarial practice. Ultimately the decision of how and when to treat the impact would be a matter for the Commission to decide. ICBC would likely recommend an approach, which might be either to reflect the lower or higher indicated rate immediately, or to defer it until the next revenue requirements application, depending on the timing of the discovery. If a material error or omission were discovered shortly after the filing of a revenue requirements application and before an interim rate was implemented, it would be easier for ICBC to implement a corrected rate, reduce the impact to customers of revising the rate, and reduce the extent of duplication in regulatory processes. All of these benefits would tend to decline over time; in addition to which a refund or additional billing might become necessary if there were a revision subsequent to the implementation of an approved interim rate. Specifically relating to the policy year 2015 rate change, no material error has been identified. However, in the event a material error were to be identified, ICBC believes that the deferral of any rate difference relating to a material error or omission would be necessary in order to mitigate the project implementation risks associated with the new Policy Administration System. These risks were discussed in the response to information request RR BCUC.2.1.1, filed in the response to information request RR BCUC
205 BC Pensioners' and Seniors' Organization Information Request No RR BCOAPO.21.1 Dated 12 January Insurance Corporation of British Columbia Response Issued 29 January Page 1 of RR BCOAPO.21.1 Reference: Reference: Exhibit B-5, BCUC IR#1, 22.1 What minimum and maximum forecast values for Accident Year Incurred Loss (Basic Bodily Injury - Personal), were produced by the Paid Development and the Hindsight Outstanding Severity Methods, and over the various historical trend measurement periods examined? (In other words, of all the methods tried, and over the range of possible experience periods considered, what were the highest-high and the lowest-low estimates?) Response: ICBC s selected best estimate forecasts for accident year (Basic Bodily Injury (BI) Personal) are provided in the Application, Chapter 2, Exhibit D.1.1. The frequency and severity forecasts are 1.47% and $41,883 respectively, which are based on a 5-year flat frequency model and a 5-year regression severity model as described in the Application, Chapter 2, Exhibit D.0. This frequency and severity combination produces an accident year loss and allocated loss adjustment expense (ALAE) forecast of $1.78 billion. ICBC does not produce any alternative forecasts. However, it is possible to calculate other forecasts based on the results of applying different actuarial reserving methods, as appears to be contemplated in this information request. In order to derive the illustrative highest and lowest forecasts for frequency and severity shown below, exponential trends over experience periods of 5, 10, and 15 years of annual estimates were considered. It should be noted that not all possible frequency and severity trend combinations would necessarily produce reasonable forecasts under accepted actuarial practice, which also require the consideration of other known factors affecting ICBC s Basic insurance experience. It should also be noted that these forecasts do not include any adjustments for bulk claim payments or the prospective adjustments that are shown in the Application, Chapter 2, Exhibit Set E. The illustrative lowest and highest loss and ALAE forecasts are summarized in Figure 1 below. Figure 1 Personal Basic BI Illustrative Forecasts Frequency Severity ($) Loss & ALAE ($000's) Lowest 1.30% 35,141 1,323,210 Lowest (Excluding Paid Development) 1.30% 41,204 1,551,523 Highest 1.50% 43,137 1,870,514
206 BC Pensioners' and Seniors' Organization Information Request No RR BCOAPO.21.1 Dated 12 January Insurance Corporation of British Columbia Response Issued 29 January Page 2 of 4 The illustrative lowest and highest accident year forecasted BI frequencies are shown in Figure 2 below. The lowest forecasted frequency is 1.30%, and is based on a 15-year exponential trend, which is least responsive to the flattening of the BI frequency seen in recent years. The highest forecasted frequency is 1.50%, and is based on a 5-year exponential trend, which is most responsive to the flatter BI frequency seen in recent years. Figure 2 Personal Basic BI Frequency with Illustrative Forecasts 2.5% 2.0% Incurred Frequency 1.5% 1.0% 0.5% 0.0% Accident Year Selected Incurred Exponential Exponential The calculation of the historical BI frequencies shown in Figure 2 is provided in Attachment A Personal Bodily Injury Historical Frequencies and Severities. The illustrative lowest and highest accident year forecasted severities are shown in Figure 3 below. The results of all five methods shown in the Application, Chapter 2, Exhibit C.1.3.1, combined with the selected incurred ALAE from the Application, Chapter 2, Exhibit C.1.1.1, column (3), were considered in response to this information request. The lowest forecasted severity is $35,141, which is based on a 10-year exponential trend of the Paid Development Method severities. Since the Paid Development Method relies on an assumption that claims closure patterns are stable over time, which does not hold true as discussed in the Application, Chapter 2, Exhibit C.0.5, an alternative lowest forecasted severity has also been provided.
207 BC Pensioners' and Seniors' Organization Information Request No RR BCOAPO.21.1 Dated 12 January Insurance Corporation of British Columbia Response Issued 29 January Page 3 of 4 Excluding the Paid Development Method, the lowest forecasted severity is $41,204, and is based on a 5-year exponential trend of the Hindsight Outstanding Severity Method severities. The highest forecasted severity is $43,137, and is based on a 15-year exponential trend of the Paid Bornhuetter-Ferguson Method severities. Figure 3 Personal Basic BI Severity with Illustrative Forecasts Incurred Severity $50,000 $45,000 $40,000 $35,000 $30,000 $25,000 $20,000 $15,000 $10,000 $5,000 $ Accident Year Paid Development Paid Bornhuetter-Ferguson Hindsight O/S Severity Exponential Hindsight Outstanding Severity Paid Development Exponential Paid BF Exponential The historical severities based on each of the five methods considered are provided in Attachment A - Personal Bodily Injury Historical Frequencies and Severities. The highest and lowest illustrative accident year incurred loss and ALAE forecasts are derived from the highest and lowest forecasted frequencies and severities discussed above. The lowest accident year incurred loss and ALAE forecast is based on the lowest frequency forecast of 1.30% and the lowest severity forecast of $35,141, which amounts to $1.32 billion. Excluding the Paid Development Method, the lowest accident year incurred loss and ALAE forecast is $1.55 billion, and is based on the 5-year exponential trend of the Hindsight Outstanding Severity Method severity ($41,204) and the lowest frequency forecast
208 BC Pensioners' and Seniors' Organization Information Request No RR BCOAPO.21.1 Dated 12 January Insurance Corporation of British Columbia Response Issued 29 January Page 4 of 4 discussed above. The highest accident year incurred loss and ALAE forecast is $1.87 billion, and is based on the highest frequency forecast of 1.50% and the highest severity forecast of $43,137. For comparison, ICBC s best estimate forecast for accident year loss and ALAE (before adjustment for bulk claim payments and prospective adjustments) is $1.78 billion, and is based on the expectation of a flat frequency trend (more comparable to the higher illustrative frequency forecast) and a 5-year regression severity trend (more comparable to the lower illustrative severity forecast, excluding the Paid Development Method).
209 ICBC s Information Request Response RR BCOAPO.21.1 Attachment A Personal Bodily Injury Historical Frequencies and Severities Insurance Corporation of British Columbia January 29,
210 Insurance Corporation of British Columbia RR BCOAPO Attachment A Personal Bodily Injury Historical Frequencies and Severities (A) Personal Bodily Injury Frequency (1) (2) Selected Accident Year Earned Exposure Incurred Frequency ,070, % ,092, % ,124, % ,162, % ,199, % ,239, % ,292, % ,349, % ,413, % ,479, % ,539, % ,563, % ,606, % ,637, % ,673, % ,715, % ,763, % (1) From internal ICBC database (2) = Exhibit C Col. (1) of the 2015 Application / Col. (1) (B) Personal Bodily Injury Severity Accident Year (1) (2) (3) (4) (5) Hindsight Incurred Paid Outstanding Bornhuetter- Development Severity Ferguson Paid Bornhuetter- Ferguson Incurred Development ,657 15,628 15,628 15,657 15, ,037 16,016 16,016 16,037 16, ,087 17,053 17,053 17,087 17, ,955 16,953 16,953 16,955 16, ,155 18,140 18,140 18,155 18, ,963 19,940 19,940 19,963 19, ,564 21,572 21,572 21,564 21, ,293 23,318 23,318 23,294 23, ,505 23,477 23,477 23,504 23, ,918 24,985 24,985 24,918 24, ,191 26,750 27,426 27,188 27, ,803 28,096 28,988 28,794 28, ,807 28,340 30,632 29,815 30, ,600 27,677 32,453 30,737 32, ,741 28,922 32,775 33,685 33, ,630 32,882 36,554 37,023 36, ,856 32,545 36,985 36,644 37,837 (1) = (Exhibit C Col. (1) + Exhibit C Col. (3)) / Exhibit C Col. (1) of the 2015 Application (2) = (Exhibit C Col. (2) + Exhibit C Col. (3)) / Exhibit C Col. (1) of the 2015 Application (3) = (Exhibit C Col. (3) + Exhibit C Col. (3)) / Exhibit C Col. (1) of the 2015 Application (4) = (Exhibit C Col. (4) + Exhibit C Col. (3)) / Exhibit C Col. (1) of the 2015 Application (5) = (Exhibit C Col. (5) + Exhibit C Col. (3)) / Exhibit C Col. (1) of the 2015 Application Actuarial, Pricing Performance Department
211 BC Pensioners' and Seniors' Organization Information Request No RR BCOAPO.22.1 Dated 12 January Insurance Corporation of British Columbia Response Issued 29 January Page 1 of RR BCOAPO.22.1 Reference: Reference: Exhibit B-5, BCUC IR#1, 33.1 Preamble: The expected increase in investment income on policyholder premiums comes from the proposed policy year 2015 rate change to cover costs of 11.2%. Before the consideration of the capital provision, ICBC would expect to collect an additional 11.2% of premium from policyholders compared to the last policy year, and therefore would expect to earn additional investment income on this revenue. This projected future cash flow has a favourable rate impact of 1.3 percentage points on the rate change to cover costs. What is the present value of the expected additional investment income referred to? Please state the discount rate is used in the estimate. Response: The additional investment income refers to the change in the investment income on policyholder supplied funds for policy year 2015 compared to the amount of investment income on policyholder supplied funds for policy year The present value of the policy year 2015 investment income on policyholder supplied funds is approximately $300 million, as shown in the Application, Chapter 2, Exhibit A.0.1, row (u), column (1). The present value of the policy year 2014 investment income on policyholder supplied funds, based on the same discount rate as used in the policy year 2015 calculation, is approximately $260 million. The difference is $40 million of additional investment income, which translates to a favourable 1.3 percentage point impact on the policy year 2015 rate change to cover costs. The discount rate used to calculate these amounts is 3.82% (i.e., the New Money Rate). As described in the Application, Chapter 2, Exhibit A.1.0, the New Money Rate is a forecast of the yield on new investment assets that ICBC will be purchasing with Basic insurance premiums related to the 2015 policy year.
212 BC Pensioners' and Seniors' Organization Information Request No RR BCOAPO Dated 12 January Insurance Corporation of British Columbia Response Issued 29 January Page 1 of RR BCOAPO Reference: Reference: Exhibit B-5, BCUC IR#1, 33.2 Preamble: The remaining 0.2 favourable impact in the Other category of the investment income component of the indicated rate change is due to an increase of $6.5 million in service fees for financing plans compared to PY These are part of the miscellaneous revenues shown in the Application, Chapter 2, Exhibit H.2, column Why should changing service fees not be viewed as a form of rate design? Please explain Please explain the extent to which the increase in service fees revenues is due to a) increased transactions volumes and b) increased fees per transaction If there is a component due to increased fees, how much is due to a) fees being a function of premiums, and b) interest rate changes. Response: ICBC does not consider service fees as a form of rate design since service fees have no impact on any of ICBC s current rating variables. Further, payment plans are available as a convenience to customers and are not required by customers paying their full premium at the point of sale. ICBC has not changed the structure or any of the assumptions related to the financing plan. The primary reason that service fees in the current Application are higher than in the last Application is a result of the additional premium expected to be collected over the 2015 policy year. Since the servicing fee is a percent of premium, as the premium base is increased, the amount of service fees that ICBC collects also increases. The interest rate assumption used to calculate service fees for financing plans has not changed.
213 BC Pensioners' and Seniors' Organization Information Request No RR BCOAPO.24.1 Dated 12 January Insurance Corporation of British Columbia Response Issued 29 January Page 1 of RR BCOAPO.24.1 Reference: Reference: Exhibit B-5, BCUC IR#1, 36.6 Preamble: Per the 2015 MCT Guideline, all P&C insurers are required to meet the MCT capital requirements at all times. Consequently, any changes to the minimum and supervisory MCT target ratios must be adopted by these companies. ICBC does not have any knowledge of other P&C insurers internal management MCT target ratios beyond the OSFI minimum and supervisory target ratios. In light of this statement, why would it be consistent for OSFI to permit a phase-in of the revised MCT framework, rather than simply directing that it be complied with immediately--as would seem necessary, according to the phrase 'at all times'? Please comment. Response: All federally regulated property and casualty (P&C) insurance companies are required to phase in the revised Minimum Capital Test (MCT) framework as prescribed in the 2015 Office of the Superintendent of Financial Institutions (OSFI) MCT Guideline. The phase-in will not necessarily result in federally regulated companies MCT ratio falling below the internal management MCT target. If a P&C insurance company anticipates its MCT ratio falling below its internal management target, then the company must inform OSFI of its plans to raise the MCT ratio back to target. Therefore, ICBC does not believe there is an inconsistency in this regard.


214 BC Pensioners' and Seniors' Organization Information Request No RR BCOAPO Dated 12 January Insurance Corporation of British Columbia Response Issued 29 January Page 1 of RR BCOAPO Reference: Reference: Exhibit B-5, BCUC IR#1, Please explain the rationale for the Unanticipated Inflation estimate being so much higher now than in the 2013 edition What maximum inflation value is assumed for the coming 84 months? 25.3 What external information is relied on in determining the outlook for inflation? Response: 25.1 It should be noted that the plausible adverse scenario producing the highest indicated target among the four scenarios is used to assess each respective target. The unanticipated inflation
215 BC Pensioners' and Seniors' Organization Information Request No RR BCOAPO Dated 12 January Insurance Corporation of British Columbia Response Issued 29 January Page 2 of 2 plausible adverse scenario does not produce the highest indicated risk management target and does not produce the highest indicated capital management target. Thus, the unanticipated inflation scenario was not used to assess each respective target. It should also be noted that the unanticipated inflation scenario assumes a sustained increase in the rate of inflation coupled with an upward yield curve shift. The indicated risk management target from the unanticipated inflation plausible adverse scenario has increased from the 2013 result due to ICBC s high yield bond allocation. ICBC implemented a high yield bond allocation offset by a reduction in equities, in accordance with its stated strategic asset mix, as specified in the 2014 Revenue Requirements Application, Chapter 5. The implementation of a high yield bond allocation has increased the severity of the unanticipated inflation scenario because the market value of high yield bonds is assumed to decrease when the upward yield curve shift occurs The maximum inflation value assumed in the unanticipated inflation scenario for the 2015 risk adequacy analysis is 3.8% For the 1 in 10 year unanticipated inflation scenario, ICBC considers the results provided by GEMS, an economic scenario generator from Conning as an initial starting point. In addition, ICBC also considered the Bank of Canada s inflationary target of 2% to develop the assumption for this scenario.
216 BC Pensioners' and Seniors' Organization Information Request No RR BCOAPO.26.1 Dated 12 January Insurance Corporation of British Columbia Response Issued 29 January Page 1 of RR BCOAPO.26.1 Reference: Reference: Exhibit B-5, BCUC IR#1, 38.1 Preamble: In the interest of rate stability, a long-term growth rate is preferred in the calculation of the capital maintenance provision because a short-term expected growth, such as that based on one year, can fluctuate greatly from year to year and add to the volatility in the rates. In the long term, each component of required capital (unpaid claims liabilities, unearned premium, and investment assets) should grow in line with the growth in claims costs. Growth in claims costs is the combination of the long-term growth in claims severity, claims frequency, and the number of policies. What annual rate increase would, if applied in perpetuity, accommodate expected longterm capital growth requirements and expected operations expenses (and expected shareholder return, if applicable)? Response: Assuming there are no changes in the annual loss trending assumptions and the capital maintenance impact on the rate change reflects the full capital management target (i.e., there is no longer the need for a transient target as discussed in the Application, Chapter 3), the annual rate change needed to accommodate the expected long-term capital growth requirement would be 0.0%. There is only a rate impact when there is a change in the expected long-term growth assumptions. Controllable operating expenses are expected to remain flat through calendar year 2017 as discussed in the Application, Chapter 4. Based on the current expectation that controllable operating expenses will remain flat and, assuming there is no change in the pension and post-retirement benefit expenses (i.e., no change in the market-based discount rate used to determine the pension and post-retirement benefits obligation), the annual rate change needed for expected operating expenses is 0.0%.
217 BC Pensioners' and Seniors' Organization Information Request No RR BCOAPO.27.1 Dated 12 January Insurance Corporation of British Columbia Response Issued 29 January Page 1 of RR BCOAPO.27.1 Reference: Reference: Exhibit B-5, BCUC IR#1, 40.1, Attachment A Preamble: The attached response to 2014 RRA, BCUC IR#2, stated as follows: The Driving Record Model, a new pricing model for Basic insurance rate design to make rates more reflective of risk, has been put on hold due to the significant changes that ICBC is undergoing, particularly those related to its insurance systems. This was reported to the Commission in ICBC s letter to the Commission dated December 21, 2012 and in the 2014 IT Strategic Plan and discussed in the Oral Hearing on 2013 Revenue Requirements. As directed by the Commission, ICBC will put forward an update on its plan for rate design in next revenue requirements application or by way of separate filing by December 31, By what date will ICBC file its next Rate Design Application? Response: ICBC submits that the timing of ICBC s next rate design application has no bearing on the 2015 Revenue Requirements Application and is outside the scope of this Application and proceeding. Please see the Commission s letter dated November 25, 2015 (Exhibit A-5).
218 BC Pensioners' and Seniors' Organization Information Request No RR BCOAPO.28.1 Dated 12 January Insurance Corporation of British Columbia Response Issued 29 January Page 1 of RR BCOAPO.28.1 Reference: Reference: Exhibit B-5, BCUC IR#1, Preamble: The Transformation Program (TP) was established in 2009 based on a high level conceptual plan, estimates, and scope. TP scope has evolved over the years as each component gets underway and more detailed planning takes place; this is a normal part of any large and complex multi-year and multi-system renewal. In the context of the quoted response to BCUC , please comment whether and how it relates to the following notion, advanced by PriceWaterhouseCoopers: "...large PAS transformation programs are often delivered late or over budget if at all as a result of the magnitude, complexity, and above all, poor upfront planning and alignment with key business drivers." [from: PWC, Fire, Ready, Aim Don t Miss the Point of a Policy Administration Transformation. ] Response: The implementation of a policy administration system (PAS) is a large and complex undertaking. This is as true for ICBC as it is for any property and casualty insurance company. ICBC recognized this fact in its decision to select the leading PAS software vendor (Guidewire) and engage one of the most experienced system integrators specializing in Guidewire implementations (Ernst & Young). ICBC has also partnered with other proven vendors on this project to ensure delivery success. Throughout the project, ICBC has followed a proven methodology to design, build, and now test the new PAS, and is planning to go-live later in. PwC serves as an independent risk advisor to the ICBC Board of Directors on the Transformation Program, and has had extensive involvement at every stage of the PAS implementation project.
219 BC Pensioners' and Seniors' Organization Information Request No RR BCOAPO Dated 12 January Insurance Corporation of British Columbia Response Issued 29 January Page 1 of RR BCOAPO Reference: Reference: Exhibit B-5, BCUC IR#1, Preamble: The Transformation Program (TP) was established in 2009 based on a high level conceptual plan, estimates, and scope. TP scope has evolved over the years as each component gets underway and more detailed planning takes place; this is a normal part of any large and complex multi-year and multi-system renewal When was the business case for TP finalised? 28.3 How do the TP results to date compare with its business case expectations? Response: 28.2 The initial estimate of TP costs/benefits with project level details was developed in 2010 following the Government Directive regarding TP which sets out TP funding and scope. TP costs/benefits are revised annually as more details on individual TP projects and scope become available, with any changes taken to ICBC s Board of Directors for approval ICBC s estimate of steady state TP benefits has increased from the initial estimate; however, it will take longer to attain the full steady-state benefits than had originally been projected. In accordance with the Decision on 2014 Revenue Requirements, ICBC will report on TP benefits starting in the 2017 Revenue Requirements Application.

220 BC Pensioners' and Seniors' Organization Information Request No RR BCOAPO.29.1 Dated 12 January Insurance Corporation of British Columbia Response Issued 29 January Page 1 of RR BCOAPO.29.1 Reference: Reference: Exhibit B-5, BCUC IR#1, 54.2 Preamble: The kept informed result for 2014 is comparable to prior years, as shown in the figure below. The 2014 result is based on the volume of completed surveys between January and May. The proportionately lower number of completed surveys in the first part of the year increased the variability of the result. However, the result is within a consistent range when compared to prior years. Please show the results for the period June 2013 through May Response: The Kept informed result for the period from June 2013 to May 2014 is 71%.
221 BC Pensioners' and Seniors' Organization Information Request No RR BCOAPO.30.1 Dated 12 January Insurance Corporation of British Columbia Response Issued 29 January Page 1 of RR BCOAPO.30.1 Reference: Reference: Exhibit B-5, BCUC IR#1, 55.1 Preamble: Claim Transformation: ICBC expects a $34 million net savings on Basic insurance claims for PY 2015 due to the implementation of the new claims management system, business processes, and organizational hierarchy changes. In terms of its impact on the Loss Ratio, what revenue increase would be equivalent to a $34M cost saving? (Assuming the current financial situation for Basic.) Response: If the Basic insurance claims and claims-related costs are adjusted to remove the $34 million claims cost savings, then additional premium of $30 million must be earned to maintain the equivalent Basic Loss Ratio of 111.8%. The calculation is outlined in the table below: $ millions 2015 Outlook 2015 Outlook (Adjusted to Remove Cost Savings) 2015 Outlook (Adjusted to Maintain Basic Loss Ratio) Basic insurance claims and claims-related costs $ 2,938 $ 2,938 Add: Adjustment to remove $34 million claims cost savings 34 Total Basic Insurance Claims and Claims-Related Costs (A) $ 2,938 $ 2,972 $ 2,972 Basic Premiums Earned $ 2,628 $ 2,628 $ 2,628 Add: Adjustment to Premiums Earned 30 Total Basic Premiums Earned (B) $ 2,628 $ 2,628 $ 2,658 Basic Loss Ratio (A / B) 111.8% 113.1% 111.8%
222 BC Pensioners' and Seniors' Organization Information Request No RR BCOAPO.31.1 Dated 12 January Insurance Corporation of British Columbia Response Issued 29 January Page 1 of RR BCOAPO.31.1 Reference: Reference: Exhibit B-5, BCUC IR#1, 56.1 and 56.8 Preamble: ICBC utilizes benchmarks for its investment strategies that are consistent with industry best practices. Benchmarks are aligned with the targeted investment strategy as set by the ICBC Investment Committee and Board. Ideally, they should also be transparent, investible, offer availability of pricing, and represent the targeted risk and return profile of the asset class. In the case of the Global Equity allocation, the MSCI World Index is one of the most popular benchmarks for an international developed market equity strategy, covering 85% of market capitalization across 23 developed market countries. (Canada has been removed from both the allocation and the benchmark because ICBC has Canadian equity exposure via its Canadian equity allocation). In the case of real estate, a benchmark equivalent to the consumer price index % aligns with the targeted return of the asset class and the expected return profile of real estate assets being sourced for investment. This is also consistent with the approach of several other large Canadian real estate investors. Please show and describe the spread between real estate investment yields and the 10 Year Treasury yield, over the past 20 years. Response: Real estate income yields have consistently been higher than Government of Canada 10-year yields over the long term by 200 to 450 basis points with similar volatility.
223 BC Pensioners' and Seniors' Organization Information Request No RR BCOAPO.31.2 Dated 12 January Insurance Corporation of British Columbia Response Issued 29 January Page 1 of RR BCOAPO.31.2 Reference: Reference: Exhibit B-5, BCUC IR#1, 56.1 and 56.8 Preamble: ICBC utilizes benchmarks for its investment strategies that are consistent with industry best practices. Benchmarks are aligned with the targeted investment strategy as set by the ICBC Investment Committee and Board. Ideally, they should also be transparent, investible, offer availability of pricing, and represent the targeted risk and return profile of the asset class. In the case of the Global Equity allocation, the MSCI World Index is one of the most popular benchmarks for an international developed market equity strategy, covering 85% of market capitalization across 23 developed market countries. (Canada has been removed from both the allocation and the benchmark because ICBC has Canadian equity exposure via its Canadian equity allocation). In the case of real estate, a benchmark equivalent to the consumer price index % aligns with the targeted return of the asset class and the expected return profile of real estate assets being sourced for investment. This is also consistent with the approach of several other large Canadian real estate investors. Please show and describe the investment portfolio versus the allowable BCUC base ROE rates, over the period from March 2009 until the most recent available data month. Response: ICBC assumes that the information request is referring to the allowable Return on Equity (BCUC base ROE rate) determined as part of the May 10, 2013 Decision on the Commission s Generic Cost of Capital Proceeding. The allowable BCUC base ROE rate is determined for a utility and ICBC simply uses the market equity risk premium underlying the BCUC base ROE rate to estimate the equity return in the formulae for the New Money Rate (NMR) and the Yield on Basic Equity (YBE). The Commission approved the formulae for the NMR and YBE in the Decision on 2014 Revenue Requirements. The chart below tracks the estimated equity return in the NMR formula relative to the annual return on ICBC s equity assets and the overall ICBC investment portfolio from 2009 to 2014.
224 BC Pensioners' and Seniors' Organization Information Request No RR BCOAPO.31.2 Dated 12 January Insurance Corporation of British Columbia Response Issued 29 January Page 2 of 2 30% NMR Estimated Equity Return (EER) & ICBC Portfolio Returns 25% 20% 15% 10% 5% 0% NMR EER -5% -10% GoC 30yr Equity Risk Premium ICBC Equity Portfolio Total ICBC Portfolio The chart highlights the annual return volatility of ICBC s equity investments relative to a more stable estimated equity return calculated using the market equity risk premium. The chart also highlights the lower return achieved on ICBC s overall investment portfolio. This lower return is associated with the large allocation to lower yielding bonds within its investment portfolio.
225 Canadian Direct Insurance Information Request No RR CDI.1.1 Dated 12 January Page 1 of RR CDI.1.1 Reference: Actuarial Rate Indication Analysis Exhibit B-1-1, Chapter 2, pp. 2.8 to 2.12, paras. 28 to 31 B. Factors Influencing the Required Rate Change At paragraph 28, page 2-8, ICBC indicates that of the largest component of the PY 2015 rate change to cover costs is the updated estimate of loss costs for PY This has an impact of +5.8%. That rate change is shown in Figure Basic Loss Cost. Please advise, in percentage terms, what portion of this percentage represents Bl claims. Response: As provided in the Application, Chapter 2, Figure 2.5, Bodily Injury loss costs account for 81% (4.7 percentage points) of the 5.8 percentage point impact on the policy year (PY) 2015 rate change to cover costs, which is the difference between the estimate of PY 2014 loss costs as at this Application and the PY 2014 loss costs as at the 2014 Revenue Requirements Application.
226 Canadian Direct Insurance Information Request No RR CDI.2.1 Dated 12 January Page 1 of RR CDI.2.1 Reference: Actuarial Rate Indication Analysis Exhibit B-1-1, Chapter 2, pp. 2.8 to 2.12, paras. 28 to 31 At paragraph 30, page 2-10, ICBC compares the Bl frequency forecast shown in the 2014 Revenue Requirements Application with ICBC's current expectation for the trajectory which that frequency will take. The frequency trend is depicted in Figure 2.6. While the trend of Bl frequency has been relatively flat since 2010, at a frequency level of ±1.5%, it had previously shown a downward trend to 2010 from ±2.0% in Can ICBC indicate what programs it may be considering in an effort to reduce the level of Bl claims, thus allowing the historical downward trend trajectory of Bl frequency to continue? Response: ICBC will focus on its Road Safety program with two key objectives: to reduce crashes overall, and to reduce the frequency of bodily injury (BI) claims, in particular. ICBC has identified the likely key causal factors of crashes as well as areas of opportunity to maximize the investment in reducing the frequency of BI claims. For 2015, the key focus is on the priorities of distracted driving, high-risk driving, commercial vehicles, and vulnerable road users. Each of these priorities is being addressed by a suite of activities, including public awareness campaigns and education initiatives, and tactics such as support for community volunteers. ICBC works in close partnership with enforcement, government, and other stakeholders to maximize its investments. Even with the additional efforts from ICBC to attempt to influence the injury frequency trend, there are factors that are beyond its control. Such factors include vehicle occupancy, occupant protection technologies, and changes in the awareness and motivation of claimants in making BI claims.
227 Canadian Direct Insurance Information Request No RR CDI.2.2 Dated 12 January Page 1 of RR CDI.2.2 Reference: Actuarial Rate Indication Analysis Exhibit B-1-1, Chapter 2, pp. 2.8 to 2.12, paras. 28 to 31 At paragraph 30, page 2-10, ICBC compares the Bl frequency forecast shown in the 2014 Revenue Requirements Application with ICBC's current expectation for the trajectory which that frequency will take. The frequency trend is depicted in Figure 2.6. While the trend of Bl frequency has been relatively flat since 2010, at a frequency level of ±1.5%, it had previously shown a downward trend to 2010 from ±2.0% in In past applications, ICBC has referred to indirect factors impacting Bl frequency such as the proliferation of personal electronic devices (PEDs). ICBC indicates in this application that with continued awareness of the dangers of such devices, there will be long term benefits but cannot provide credible evidence to support a lower forecast. What sort of evidence would ICBC require to observe a downward trend in injury occurrence? Response: There are two ways by which changing expectations of future claims costs are reflected in rate indications. The first is by observing an actual change in the claim frequency or severity data that varies from past assumptions, and adjusting the projected trend to reflect that data. The second is through a prospective adjustment. It is now well established, through six years of recent data that the downward trend in BI claims frequency has changed. Various suppositions that this was only a short-term change in trend because of factors, such as the proliferation of personal electronic devices, have not panned out. Given this now six-year trend, ICBC would require 12 to 18 months of actual results deviating from this more recent trend to support a shift to a new trend, be it upward or downward. As previously mentioned, the second way by which a changing expectation of BI claim frequency could be incorporated into the rate indication would be through a prospective adjustment. If there were a current or future event that is expected to influence the number of BI claims and it is not accounted for within the loss trend models, a prospective adjustment would be considered based on the criteria summarized in the Application, Chapter 2, Exhibit E.0, pages 2-3, and reproduced below:
228 Canadian Direct Insurance Information Request No RR CDI.2.2 Dated 12 January Page 2 of 2 1. Timing The implementation/completion of the project or initiative is highly probable and the impact on costs or savings is expected within the prospective policy year. 2. Causal Relationship to Claims Costs or Savings The project or initiative is expected to impact claims costs, directly or indirectly. 3. Estimable Costs or Savings A credible estimation of the project or initiative s impact on ICBC claims costs is available, or can be produced based on BC data or generalizable results from other jurisdictions. 4. Significant Impact i. The costs or savings to be realized within the prospective policy year are significant. ii. A prospective adjustment may still be included for a candidate event, which does not produce a significant impact, if a credible estimate is readily available. It should be noted that, at this time, there is no actual evidence or knowledge of a future event meeting all of the above stated criteria that would support a change to the BI frequency trend.
229 Canadian Direct Insurance Information Request No RR CDI Dated 12 January Page 1 of RR CDI Reference: Capital Management Plan Exhibit B-1-1, Chapter 3, p. 3-1, para. 3 Introduction On page 3-1, para. 3, ICBC suggests that the most significant impact of the 2015 OSFI Guideline is a reduction of capital required. As a result of the 2013 BCUC decision, ICBC's MC target was set at 145%. However, when applying the three year phase in using the 2015 OSFI Guideline, the end result is that the MCT ratio increases from 145% to 150% by Explain how this end result is arrived at given that ICBC indicates that the result of the 2015 OSFI Guideline change has actually been to reduce required capital. 3.2 The OSFI Guidelines state that ICBC must apply the reduction in capital from the new MCT levels over a three year period. Please explain how this has been calculated in Figure 3.2 and in the revenue requirements application. 3.3 Further, please explain why the MCT in Figure 3.2 is projected to be 150% in 2017 when it should be 145%, and explain how the reduction in capital will be utilized to smooth rates over time. Response: 3.1 As CDI is aware, the 2015 Office of the Superintendent of Financial Institutions (OSFI) Minimum Capital Test (MCT) Guideline has the impact of increasing required capital for most property and casualty insurers with a corresponding decline in MCT ratios. As noted in OSFI s September 24, 2014 press release, The new risk-based capital framework results in a slight 2.8 percentage point decline in the capital ratio (MCT/BAAT combined ratio) on average across the entire industry. 1 ICBC s Basic insurance is an exception to the industry averages. As stated in the Application, Chapter 3, the introduction of the 2015 OSFI MCT Guideline change has resulted in a decrease of $112 million in minimum capital required from $1.209 billion to $1.097 billion based on ICBC s 2014 year-end financial results. This is largely because, for the purpose of calculating the minimum capital required, the new guideline decreased the capital factor for unpaid claims on automobile insurance liability and automobile personal accident from 10% to 6.7% (6.7% is 1
230 Canadian Direct Insurance Information Request No RR CDI Dated 12 January Page 2 of 2 equal to the factor of 10% divided by 1.5), which represents the majority of ICBC s Basic insurance business (the factor for other automobile liabilities increased from 5% to 10%; i.e., collision, comprehensive, windshield, etc.). Because the minimum capital required is the comparison point for MCT ratios (the denominator of the MCT calculation), MCT target levels in the current Basic Capital Management Plan correspondingly must increase to account for the reduced minimum capital required in order to maintain the amount of risk margin in dollars. 3.2 The introduction of the 2015 OSFI MCT Guideline has resulted in a decrease of $112 million in minimum capital required from $1.209 billion to $1.097 billion. The reduction of the minimum capital required ($112 million) is spread equally over three years as shown on lines j) and k) of the Application, Chapter 3, Figure The MCT level for the Capital Management Target in the Application, Chapter 3, Figure 3.2, row q) is projected to be 150% in 2017 because ICBC is preserving the dollar values of the margin for adverse events and the margin for rate smoothing as described in the response to information request RR BCUC The OSFI MCT guideline changes only apply to the calculation of MCT ratios. The guidelines do not address how a company should react to a change in capital position. ICBC operates within the rate smoothing framework defined in Special Direction IC2 and its approved Capital Management Plan. A reduction in capital required, all other things being equal, would mean a higher actual MCT level for ICBC. The result of a higher actual MCT level in a future revenue requirements application would be governed by the rate smoothing framework, Special Direction IC2, the Basic Capital Management Plan, and the level of ICBC s rate indication to cover costs at the time of the revenue requirements application.
231 Canadian Direct Insurance Information Request No RR CDI.4.1 Dated 12 January Page 1 of RR CDI.4.1 Reference: Capital Management Plan Exhibit B-1-1, Chapter 3, p. 3-1, para. 4 Introduction On page 3.1, para. 4, ICBC refers to its use of a "risk adequacy analysis to determine the dollar amount of capital needed to respond to a plausible (1 in 10 year) adverse event" in arriving at the MCT ratio. It appears such a risk analysis determining the dollar amount of capital needed to guard against adverse events was not used in the New Capital Management Plan approved in What is the reason for now introducing the concept of requiring the maintenance of a dollar margin to account for adverse events using the 2015 OSFI Guideline? Response: The concept of a risk margin measured in dollars is not something new, it is implicit in the Office of the Superintendent of Financial Institutions (OSFI) Minimum Capital Test (MCT) guideline. All measures of MCT ratios begin with an amount of capital that is compared to the Base Required Capital to determine a ratio. This is true whether that amount is actual available capital, the minimum target level, an internal target level, or a capital management target (CMT) as contained in ICBC s Capital Management Plan (CMP). With respect to the Capital Management Plan approved in 2013, please refer to the Decision on the 2013 Revenue Requirements which states the following: ICBC s proposed 130% MCT Solvency Target [referred to as the risk management target in this Application] existed in the current CMP as the CMT, and ICBC confirmed that it has worked well and is consistent with past and current DCAT testing to maintain MCT above the minimum 100%... The evidence provided in this hearing, both written and oral, indicates continued support of the 130% MCT target. The Panel is persuaded that ICBC should continue to use the existing capital management target MCT ratio of 130% as the initial level of the MCT ratio, as it seems to continue to reflect ICBC s risk profile in Basic Insurance. The Panel also believes that the 130% MCT ratio would allow ICBC to respond to adverse events that arise from Basic Insurance. This was based on evidence provided from the 2013 risk adequacy analysis, the results of which were provided in the response to information request RR BCUC (revised and re-issued on February 12, 2014 in Exhibit B-18). The full report was provided in the response to information request RR RM.3.a, Attachment A 2013 Management Target
232 Canadian Direct Insurance Information Request No RR CDI.4.1 Dated 12 January Page 2 of 2 Analysis for ICBC s Basic Insurance. The dollar amounts of capital needed to respond to the adverse events in this analysis were based on the minimum capital required calculated using the 2013 OSFI MCT Guideline and were expressed as percentages in that report. Since, under the 2015 OSFI MCT Guideline, the minimum capital required is reduced, ICBC must adjust the percentage value of the minimum capital required to ensure that the dollar amount of the margin for adverse events is preserved. Similarly, the margin for relatively smooth and predictable rates and the margin for excess capital must be adjusted to ensure the preservation of the dollar amounts of the margins. ICBC is not changing the amount of capital needed to withstand a 1 in 10 year plausible event since the risk profile of ICBC s Basic insurance business has not changed. ICBC is simply making changes to the MCT targets (on a percentage basis) in order to maintain the same level of protection against adverse events as was previously approved by the Commission.
233 Canadian Direct Insurance Information Request No RR CDI.5.1 Dated 12 January Page 1 of RR CDI.5.1 Reference: Capital Management Plan Exhibit B-1-1, Chapter 3, p. 3B-1, Figure 3B OSFI Guideline, BCUC Information Request No RRBCUC.37.1 dated 16 November, 2015, Insurance Corporation of British Columbia Response issued 08 December 2015 In its Information Request 37.1, the BCUC asked for an explanation on the adjusted Outlook MCT ratio for determining the rate indication pursuant to Special Direction IC2, sections 1.1 and 1.2. In its response to this request, in which it refers to the 2015 year end Outlook MCT, ICBC indicates this reflects business activity which has already occurred and then generally "what is expected to occur based on emerging trends and economic conditions". Could ICBC be more specific on what trends and economic conditions it expects to emerge during the phase-in period ( ). Response: Policy year 2015, for the purposes of this Application, includes polices written between November 1, 2015 (the effective date of the interim rates) and October 31,. The policies written on the last day of policy year 2015 will cover claims occurring through October 30, 2017, the expiration date of those policies. In other words, policy year 2015 will include activity for calendar years 2015,, and This means the phase-in period for the 2015 OSFI MCT Guideline, 2015 through 2017, largely encompasses the same period as the policy year Therefore, ICBC s expectation on trends, which refer to the claims frequency, claims severity, average premium, and written exposure trends, can be found in the Application, Chapter 2, Exhibit Sets B and D. Economic conditions refer to the investment yields, which can be found in the Application, Chapter 2, Appendix 2 A.
234 Canadian Direct Insurance Information Request No RR CDI.6.1 Dated 12 January Page 1 of RR CDI.6.1 Reference: Capital Management Plan Exhibit B-1-1, Chapter 3, p. 3B-1, Figure 3B OSFI Guideline, BCUC Information Request No RRBCUC.37.1 dated 16 November, 2015, Insurance Corporation of British Columbia Response issued 08 December 2015 In its Information Request 37.1, the BCUC asked for an explanation on the adjusted Outlook MCT ratio for determining the rate indication pursuant to Special Direction IC2, sections 1.1 and 1.2. ICBC also indicates in its response to this request that capital has been on a downward trend since 2014 year end, citing such factors as increases in claims costs, deferred premium acquisition cost adjustment and the actuarial re-measurement of the pension and post-retirement benefit (loss) which is only recorded at year end, all exceeding premium revenue and investment returns. Can ICBC advise whether some of these items listed - deferred premium acquisition cost adjustment and actuarial re-measurement of the pension and post-retirement benefits - are one-time issues or whether those adjustments would need to continue to be made throughout the phase in timeframe? Response: The deferred premium acquisition cost adjustment and actuarial re-measurement of the pension and post-retirement benefit adjustments are accounting entries/adjustments that are typically made every year. These adjustments are made regardless of the phase-in timeframe.
235 Canadian Direct Insurance Information Request No RR CDI.7.1 Dated 12 January Page 1 of RR CDI.7.1 Reference: Operating Expenses and Allocation Information Exhibit B-1, Chapter 4 Appendix 4D Detailed Work Effort Study and Allocation Information Attachment 4DI Customer and Injury Services Operations Detailed Work Study Effort Proposed Changes to Allocation Methodologies Section F 2014 CISO Financial Allocation for Future Revenue Requirements Application, pps , Figure 9 MD Files - Collision Property Damage and Figure 10 MD Files - Customer Care In both Figures 9 and 10 relating to the allocation split between Basic and Optional insurance, the MD Files for collision/property damage and customer care show a large percentage of these transaction types allocated to Optional and a smaller percentage allocated to Basic. Please provide a further explanation as to the methodology used to assess the allocation of costs between Basic and Optional, and supporting information used in the revised allocation calculation. Response: The methodology for allocating between Basic insurance and Optional insurance for the transaction types of MD Files Collision/Property Damage and MD Files Customer Care is outlined in ICBC s March 2005 Allocation Submission. For more information please see Attachment A MD Files Collision and Property Damage Allocation and Attachment B MD Files Customer Care Allocation, which are excerpted appendices from ICBC s March 2005 Allocation Submission. The allocation for MD Files Collision/Property Damage uses closed exposure data. The allocation for MD Files Customer Care uses closed file data. The allocation to Basic insurance or Optional insurance is largely based on the type of coverage, which by definition, is either Basic insurance or Optional insurance. For multi-vehicle collision claims that are transferred from Collision to Property Damage based on liability assessment, there is equal weighting between Basic insurance and Optional insurance to reflect that there is work performed on the Collision claim as well as the Property Damage claim. Figure 9 from the 2014 Detailed WES provides a historical perspective of the allocation percentages that were approved by the Commission in the April 2008 Decision, which were
236 Canadian Direct Insurance Information Request No RR CDI.7.1 Dated 12 January Page 2 of 3 based on 2007 claims data. percentages were updated using 2013 claims data. In Figure 10 from the 2014 Detailed WES, the allocation The four figures below set out the calculations of the allocation percentages for the MD Files Collision/Property Damage and MD Files Customer Care transaction types using 2007 and 2013 claims data. Figure 1 MD Files Collision / Property Damage (calculation of the allocation percentages based on 2007 closed exposures) Coverage Basic Optional Collision Single Transfer Vehicle No Transfer 17,898 17,898 Multi Vehicle Transfer 37,373 37,373 37,373 No Transfer 65,577 65,577 No Collision No Coverage Transfer 9,395 9,395 No Transfer 17,657 17,657 Total 64, ,253 35% 65% Figure 2 MD Files Collision / Property Damage (calculation of the allocation percentages based on 2013 closed exposures) Coverage Basic Optional Collision Single Transfer Vehicle No Transfer 12,829 12,829 Multi Vehicle Transfer 24,546 24,546 24,546 No Transfer 53,229 53,229 No Collision No Coverage Transfer 4,989 4,989 No Transfer 10,998 10,998 Total 40,533 90, % 69.1%
237 Canadian Direct Insurance Information Request No RR CDI.7.1 Dated 12 January Page 3 of 3 Figure 3 MD Files Customer Care (calculation of the allocation percentages based on 2007 closed files) Coverage Basic Optional Collision 28,489 28,489 Collision with Transfer 24,052 24,052 24,052 Glass Comprehensive 29,766 29,766 Hit & Run 14,296 1,506 12,790 Property Damage (Vehicle Damage only) Payment Property Damage (Vehicle Damage only) No Payment 1,020 1,020 Total 27,301 95,244 22% 78% Figure 4 MD Files Customer Care (calculation of the allocation percentages based on 2013 closed files) Coverage Basic Optional Collision 24,016 24,016 Collision with Transfer 20,540 20,540 20,540 Glass Comprehensive 16,784 16,784 Hit & Run 15,044 2,330 12,714 Property Damage (Vehicle Damage only) Payment Property Damage (Vehicle Damage only) No Payment Total 24,029 74, % 75.5%
238 ICBC s Information Request Response RR CDI.7.1 Attachment A MD Files Collision and Property Damage Allocation Insurance Corporation of British Columbia January 29,
239 ICBC s Regional Claim Centres Work Effort Allocation Supplemental Filing APPENDIX 6 MD Files Collision/ Property Damage Allocation The Basic/Optional insurance allocation for MD Files Collision/Property Damage in the July 2004 Application and the March 2005 Filing was calculated based on 2003 closed exposure data, grouped by those specific Kind of Loss (KOL) comprising Collision/ Property Damage. The 3 KOL s used are: KOL 01 - Single Vehicle MVA KOL 02 - Multiple Vehicle MVA KOL 37 - No Collision coverage. The process used to calculate the 36.6% Basic insurance and 63.4% Optional insurance allocation is described below. Coverage Basic Optional Collision KOL 1 Transfer KOL 1 No Transfer 31,385 31,385 No Collision KOL 2 Transfer 95,676 95,676 95,676 KOL 2 No Transfer 95,311 95,311 KOL 37 Transfer 17,272 17,272 KOL 37 No Transfer 15,929 15,929 Total 128, , % 63.4% The first step was to determine the number of closed exposures in 2003 for single vehicle MVA (KOL 01), multiple vehicle MVA (KOL 02) and no Collision coverage (KOL 37), each broken down further to indicate exposures where transfer from Collision to Property Damage occurred ( Transfer ) and those where it did not ( No Transfer ). The exposures for each exposure type were allocated to Basic insurance or Optional insurance on the following basis: KOL 01: All exposures for both transferred and non-transferred are Optional coverage claims. Insurance Corporation of British Columbia March 31,
240 ICBC s Regional Claim Centres Work Effort Allocation Supplemental Filing KOL 02 (No Transfer): Exposures with No Transfer (to a Property Damage coverage) are Optional coverage claims where the claimant has been assessed at fault and the claim is processed as a Collision claim. KOL 02 (Transfer): Exposures with Transfer (to a Property Damage coverage) are Collision files (KOL 02) that have been transferred to a Property Damage (KOL 22) because the claimant is not at fault for the accident. Equal weighting is applied to Basic insurance and to Optional insurance. KOL 37: All exposures are allocated to Basic insurance on the basis that there is no purchased Optional Collision coverage and that ICBC has determined that the loss will be paid from the liable party s Property Damage coverage. An example of this exposure is a rear-end type collision where the striking (and liable) vehicle is insured by ICBC and the non-liable vehicle either has no Collision coverage or is insured with another insurer. ICBC would open a KOL 37 in order to record the exposure. The allocated exposures were then aggregated and a ratio to total exposures was calculated. In the above table, the total number of exposures is 351,685 and of this total, 128,877 or 36.6% are allocated to Basic insurance and 222,808 or 63.4% are allocated to Optional insurance. Exposures Closed in 2004 Coverage Transfer Total Basic Optional Collision KOL 1 Transfer No Transfer 32,812 32,812 KOL 2 Transfer 85,948 85,948 85,948 No Transfer 114, ,030 No Collision KOL37 KOL 37 Transfer 15,950 15,950 No Transfer 19,567 19,567 Grand Total 121, , % 65.7% Insurance Corporation of British Columbia March 31,
241 ICBC s Information Request Response RR CDI.7.1 Attachment B MD Files Customer Care Allocation Insurance Corporation of British Columbia January 29,
242 ICBC s Regional Claim Centres Work Effort Allocation Supplemental Filing APPENDIX 7 MD Files Customer Care Allocation The revised calculation of the MD Files Customer Care transaction type, using closed file data and the same methodology used for MD Files Collision/Property Damage for files with transfer from Collision to Property Damage is as follows: A B C 2003 (Dec) Basic Optional Coll 30,170 30,170 Coll with Transf 32,249 32,249 32,249 Glass Comp 46,503 46,503 Hit & Run 11,817 4,371 7,446 KOL 22 pmt KOL22 no pmt Total count 37, , % 75.6% The revised methodology also incorporates the methodology for hit and run claims described in section for the hit and run claims included in this transaction types. Column A As a first step, the data was grouped by coverage type and then further subdivided into those coverage types that had a transfer indicator. All the following claims have had estimates performed by a Regional Claim Centre: Coll refers to a purchased Optional Collision coverage file, and includes KOL s (Kind of Loss) 01 (single vehicle), 02 (multi vehicle), 06 (replacement cost policy), and 19 (Loss of Use). If the insured has a straight-forward claim and is not liable, the Telephone Claims Department (TCD) would retain the file and send the customer to a claim centre for a vehicle estimate. Coll with Transf refers to a Collision file (KOL 02) that has been transferred to a Property Damage file (KOL 22) because the insured is not at fault for the accident. Insurance Corporation of British Columbia March 31,
243 ICBC s Regional Claim Centres Work Effort Allocation Supplemental Filing Glass refers to purchased Optional glass (windshield) coverage and includes KOL 13 only. Comp refers to all other purchased Optional comprehensive coverage types and includes coverage for theft, fire, animal collision, theft from the vehicle as well as others. Hit and Run refers to those claims involving an unidentified motorist that are paid under Collision coverage or Basic insurance Unidentified Motorist coverage, as applicable (see section 3.4.4). KOL 22 pmt refers to a Basic Property Damage coverage in which the payment was made directly on this coverage type as opposed to being transferred over from a Collision coverage (as the insured had no Optional Collision coverage with ICBC). KOL 22 no pmt refers to a Basic Property Damage coverage in which no payment has been made, however, an estimate has been completed in a Regional Claim Centre (and therefore work effort should be recognized). Column B Column B show the number of MD files closed in the year and allocated to both Basic insurance and Optional insurance. All MD files closed in the year are counted in order to correctly determine work effort performed in Regional Claim Centres on behalf of Telephone Claims Department. Column C Once the file count is validated, the respective count by coverage type is allocated to either Basic insurance or Optional insurance, as follows; Collision: Allocate all to Optional insurance. Collision (with Transfer): Apply an equal weighting to Basic insurance and Optional insurance. Glass: Allocate all to Optional insurance. Comprehensive: Allocate all to Optional insurance. Insurance Corporation of British Columbia March 31,
244 ICBC s Regional Claim Centres Work Effort Allocation Supplemental Filing Hit and Run: Allocate 37% to Basic insurance and 63% to Optional insurance on the same basis as that used for the claims transaction type MD Files Other. KOL 22 Payment: Allocate all to Basic insurance as a direct Property Damage coverage. KOL 22 with No Payment: Allocate all to Basic insurance. After the respective counts have been allocated by coverage type, a check is made to ensure the total count on which a work effort was performed in a Regional Claim Centre has been accounted for. As an example, the file count for both Roadside Plus and RoadStar coverage types are excluded as no estimate is required in a Regional Claim Centre. When the MD files are allocated between Basic insurance and Optional insurance, the respective columns are summed and a ratio to total MD files calculated. As an example, for 2003, the total number of MD files requiring an estimate in a Regional Claim Centre was 154,161. Of this total, 37,593 are allocated to Basic insurance (by coverage type) which represents 24.39% (or 24% rounded) of the total. Those allocated to Optional insurance account for the remainder (116,568 or 76% rounded). For 2004, 25% is allocated to Basic insurance and 75% to Optional insurance. The underlying methodology described above has not changed; the only thing that did change was the MD file counts. See the chart below for details. A B C 2004 (Dec) Basic Optional Coll 29,300 29,300 Coll with Transf 29,433 29,433 29,433 Glass Comp 39,898 39,898 Hit & Run 11,693 4,325 7,368 KOL 22 pmt KOL22 no pmt Total count 34, , % 75.3% Insurance Corporation of British Columbia March 31,
245 Movement of United Professionals Information Request No RR MoveUP.1.1 Dated 12 January Page 1 of RR MoveUP.1.1 Reference: Exhibit B-5, RR BCUC.18.1, page 1: The new patterns will be observed period by period such that, beginning in 2017, it is expected that data as of a given development period will be similar to data as seen at the same period of development. For example, it is expected that the percentage of incurred claims recorded, closed, and the level of case reserving on open claims for 2017 claims as of May 2017 will be similar to what is observed for claims as of May, and likewise that the development of 2017 claims to May 2018 will be similar to the development of claims to May Please provide in a summary table the percentage of incurred claims recorded, closed, and the level of case reserving on open claims that the Corporation expects as of May. Response: The information requested is not available at this time. ICBC sets a budget each year for monthly levels of claims recorded, payments made, and case reserves set. This budget for recorded claims and amounts is developed in the first quarter of the year, following the completion of work relating to the financial year-end. This timing ensures that the assumptions underlying the claims recording budget can be made consistent with the assumptions underlying the actuarially estimated claims liabilities in ICBC s audited financial statements.
246 Movement of United Professionals Information Request No RR MoveUP.1.2 Dated 12 January Page 1 of RR MoveUP.1.2 Reference: ibid. page 2: It should be noted that, even though the instability associated with the transition from the legacy to the new claims management system, business processes, and data capture will be completed by, there will continue to be some variability in patterns for claim recording, case reserving, and closure as a result of changes in other factors as discussed in Exhibit C.0.5. These factors may include, but are not limited to, changing representation rates, a shifting mix of injury complexities, and future operational improvements. In addition, the claim data for older years will continue to reflect a mix of legacy and new business processes and system coding for the duration of coexistence. Directionally and quantitatively, how with the listed factors affect the listed patterns (i.e., for claim recording, case reserving, and closure)? Response: Each of the listed factors may impact each of the listed patterns in different ways, depending on the change in the factor. The quantitative impact cannot be predicted at this time as it will depend on both the magnitude and the direction of each factor. The impacts of both the legal representation rate and the high injury complexity were discussed in some detail during the 2013 Revenue Requirements Proceeding. Please refer to Attachment A Response to Information Request RR BCUC.154.4, Attachment A Legal Representation Rate, Section B. As discussed in the attachment, claimants with serious injuries may need the help of legal counsel; therefore, one consequence of increasing injury complexity may be an increase in the legal representation rate. In general, an increase in either claim complexity or legal representation would be expected to have the following effects: Claim recording would take longer, on average. A proportion of claimants with represented claims do not notify ICBC of the bodily injury claim until after they have obtained legal representation. Case reserve development would be longer, on average. Claims with more complex injuries, or that become represented or litigated, are subject to ongoing case reserve adjustment as information relating to the injury emerges or as litigation proceeds.
247 Movement of United Professionals Information Request No RR MoveUP.1.2 Dated 12 January Page 2 of 2 Time to closure would be longer, on average. More time is generally required to understand the impact of more complex injuries, and the legal processes associated with litigation also result in additional time, in most cases, before a claim can be settled. A decrease in the level of claim complexity or legal representation would be expected to have the opposite effect, shortening the patterns for each of claim recording, case reserve development, and time to closure. Future operational improvements may impact the listed patterns in different ways depending on the nature of the improvement. For example, an operational improvement relating to the negotiation of represented claims might shorten or lengthen the closure pattern, but have no impact on claim recording or case reserving. An improvement relating to initial call handling might affect the pattern of claim recording, but have no impact on the closure pattern or case reserving. Future impacts to the claims patterns from process improvements will, therefore, depend on the changes being implemented.
248 ICBC s Information Request Response RR MoveUP.1.2 Attachment A Response to Information Request RR BCUC Insurance Corporation of British Columbia January 29,
249 British Columbia Utilities Commission Information Request No RR BCUC Dated 07 October 2013 Insurance Corporation of British Columbia Response Issued 08 November August 2013 Insurance Corporation of British Columbia Revenue Requirements Application for the Policy Year Commencing November 1, 2013 Page 1 of RR BCUC Reference: PERFORMANCE MEASURES Exhibit B-1, Chapter 9, p. 9-8 Service Measures - Legal Representation Rate On page 9-8, ICBC states: The Legal Representation Rate may provide some indication of service satisfaction related to bodily injury claims, but claimants may have reasons unconnected to service for retaining counsel. There are a variety of reasons why claimants seek legal representation. Some claimants may seek representation due to complex medical or legal issues, or the amount involved in the claim. Some claimants may seek representation as the claims and settlement process can appear complex, due to factors such as lack of familiarity and language barriers. On page 9-8, ICBC also states: The 2012 Legal Representation Rate of 45% has increased from the 2011 actual of 40%. The increase is due to a rising trend of legal representation combined with earlier identification of represented files due to more consistent claims file handling. The 2013 Legal Representation Rate forecast is set at 46%, recognizing the increasing representation trend. This issue is of concern to ICBC and further analysis is being undertaken. Of the variety of factors which cause claimants to seek legal representation, which of these does ICBC have some control or influence over? Response: British Columbia s tort system is an adversarial system whereby the injured party must prove both negligence and damages against another person or persons. There can be many reasons why someone may seek representation. Claimants who are injured and may not have the time or wherewithal to prove their injuries or quantify their damages may simply wish to have a lawyer advance their claim for them. ICBC can control or influence some but not all of the factors that may cause a claimant to seek representation. ICBC has control over operational factors such as the claims organizational structure, staffing, and training. ICBC can control the experience of first notice of loss when an injured claimant is reporting their injury claim. ICBC can control the amount of information a claimant receives, explanations of the claims process, and how the claim is initiated with treatment providers.
250 British Columbia Utilities Commission Information Request No RR BCUC Dated 07 October 2013 Insurance Corporation of British Columbia Response Issued 08 November August 2013 Insurance Corporation of British Columbia Revenue Requirements Application for the Policy Year Commencing November 1, 2013 Page 2 of 2 Through operational factors such as properly trained staff, appropriate claims process, and organizational structure ICBC can influence the customer experience and control the claims process which ultimately may influence a claimant s decision to seek representation. As well, ICBC has an ability to influence the customer experience through effective and efficient claims handling practices, and through effective communications both at the individual level and through making more comprehensive information more broadly accessible to ICBC customers and claimants, such as the recently launched informational campaign. This helps to improve customer understanding of the claims process, and provide improved access to benefits and quicker claims resolution. When claims come to ICBC as a represented claim, adjusters have little opportunity to work with the customer and help them understand the claim process, and there is much less of an opportunity to settle less complex claims earlier in the process. Once a represented injury claim becomes litigated, ICBC can look at ways to manage the increasing costs of litigation, but cannot control them, as ICBC is obligated to pay plaintiff legal costs on behalf of the insured defendant. Likewise, ICBC cannot control the decisions of judges in making court awards. ICBC is currently undertaking further work to understand the key factors that influence the rising legal representation rate. This work will help inform ICBC on ways to adapt and modify existing initiatives, or establish new ones, to help address the legal representation rate. Please see Attachment A Legal Representation Rate for a more comprehensive analysis, which includes information on: How the tort system influences the decision to hire a lawyer. The increase in the legal representation rate and why it is important to try to address it. Drivers of legal representation generally. ICBC s ability to influence the rate of legal representation. More detail on the initiatives discussed in the Application, Chapter 6 intended to reduce the need for some claimants to retain legal representation.
251 ICBC s Information Request Response RR BCUC Attachment A Legal Representation Rate Insurance Corporation of British Columbia November 8, 2013
252 LEGAL REPRESENTATION RATE This response addresses the specific question posed, but also provides important background for other information requests and similar questions posed at the Workshop on the subject of the legal representation rate. Chapter 3 of the Application explains how there are increasing cost pressures associated with higher rates of legal representation. ICBC is seeing more bodily injury claimants who have obtained legal representation prior to reporting their claim to ICBC or obtaining legal representation earlier in the Claims process. ICBC has sought to better understand what is causing these changes with the objective of taking steps to make it easier for individuals to represent themselves in reporting a claim and guiding the claim to its ultimate resolution. This response provides: (a) explanation of how the tort system influences the decision to hire a lawyer; (b) information on the increase in the legal representation rate and why it is important to try to address it; (c) discussion of the drivers of legal representation generally; (d) discussion of ICBC s ability to influence the rate of legal representation; and (e) more detail on the initiatives discussed in Chapter 6 of the Application and how they are intended to reduce the need for some claimants to retain legal representation. A. The Tort System and ICBC s Role in the System In the Province of British Columbia, if a driver operates their motor vehicle negligently and through that negligence causes injury or property damage to another person, the person that suffered the injury or property damage is entitled to redress. In seeking redress a person who has sustained injuries must prove on the balance of probabilities (the standard in civil litigation) that the other party was at fault, that they in fact suffered damages and, as best as possible, quantify those damages. In some cases proving fault and or damages can be quite simple while in other cases providing proof can be quite difficult and costly. If the two parties cannot agree on the value of the damages or the degree of fault of the wrongdoer, the injured party has the legal right within British Columbia s full tort system to have the matter heard at a trial. The ultimate resolution between two parties in this adversarial system is a judgment which is a legally binding on both parties. When an insured purchases ICBC Basic insurance coverage, one of the major components of the coverage is third party liability which indemnifies the insured for liability imposed by law for injury or 1
253 property damage they cause due to the negligent operation of a motor vehicle. ICBC s role, as set out in the Insurance (Vehicle) Regulation, is to receive tort claims on behalf of the at-fault motorist, investigate the claim and resolve the claim on behalf of the at-fault motorist. 1 This is also referred to as the duty to defend which is a standard provision in most liability insurance coverage. Payments are made under the at-fault driver s third party legal liability policy and will affect the Basic premium payable by the at-fault driver. When an automobile accident in British Columbia involves two or more parties, in most cases both parties will have ICBC Basic insurance but the relationship between the two parties and ICBC is altered. In a straight forward case, the at-fault motorist is the insured and ICBC has a duty to defend that insured for claims made against them for the negligent operation of their motor vehicle. The other party, even though they may have ICBC Basic insurance (and often times optional material damage coverage as well) for the purposes of assessing damages now becomes the claimant; often referred to as the third party. Such a dichotomy can be difficult at times for people to reconcile. In one instance they are a customer and in the same transaction they are a claimant. In trying to balance the needs of the injured party (and fairly compensate them for their damages) with the management of all Basic policyholder s premiums ICBC at times can be seen to have competing interests. With these competing interests at play the management of bodily injury claims within British Columbia can be at times a confusing and often misunderstood process. There is no other jurisdiction in Canada that operates under both a full tort system and a Crown Corporation monopoly on Basic insurance. B. The Trend in the Legal Representation Rate Two of the basic tenets of British Columbia s tort environment are that injured parties have the right to obtain counsel and the right to sue. In the case of catastrophic and severe permanently disabling injuries, injured parties often need the help of legal counsel to assist them when they cannot manage the civil process themselves. Another factor which influences legal representation is that, except in very few circumstances, there is a two year time limit in which to settle a claim for damages against another party or the claim is statute barred. The only way to preserve that time limit is to commence a legal action which extends the time period in which to conclude the claim. Commencing a legal action in almost all cases (save and except perhaps Small Claims Court) requires legal expertise. 1 Section 74 of the Insurance (Vehicle) Regulation, Revised Regulation (1984) re-enacted from the Revised Regulation (1984) under the Insurance (Motor Vehicle) Act on June 1, 2007) provides: Duties of corporation 74 On receipt of notice of a claim for damages brought against an insured for which indemnity is provided under this Part and subject to an act or omission by the insured entitling the corporation to raise any question as to whether or not the insured is entitled to indemnity, the corporation, at its expense, shall (a) assist the insured by investigating and negotiating a settlement, where in the corporation's opinion its assistance is necessary, and (b) subject to an application and directions given by the court under section 79 of the Act, defend in the name of the insured any action for damages brought against the insured. 2

254 Because of the aforementioned factors, ICBC expects that a proportion of the injury claims received annually will either become represented or are initiated with legal counsel. Traditionally, ICBC has seen the rate of representation increase marginally year over year. As noted in Chapter 3 of the Application, while there are increases in the rate of representation across all lengths of duration of claims there are more bodily injury claimants who have obtained legal representation prior to reporting their claim or obtaining legal representation earlier in the claim process. The chart below illustrates the growth in claims that become represented during the first 14 days from being reported to ICBC. ICBC characterizes claims where representation is identified within the first 14 days as obtaining representation prior to initiating a claim. Claims that become represented and or litigated take longer to close, are more costly to process and settle, are more labour intensive to adjudicate, and are subject to ongoing case reserve adjustment. (For further discussion on the relationship between bodily injury (BI) claims costs and time see the response to RR BCUC 105.2). It is obvious then, why increasing representation is a concern to ICBC and 3
255 its policyholders; increased legal representation drives increases in BI claims costs that must be provided for in Basic rates. C. Drivers of Legal Representation There are a myriad of reasons why someone injured in a motor vehicle accident would seek representation, some which are within and others that are beyond ICBC s control. As previously mentioned, the tort system by its very nature is adversarial. Claimants who are injured and may not have the time or wherewithal to prove their injuries or quantify their damages may simply wish to have a lawyer advance the claim for them. As stated in the Application, ICBC is concerned over the increased representation rates and is currently investigating the accelerating rise in represented bodily injury claims. This is a high priority corporate project which employs both quantitative and qualitative data analysis to identify and understand the key drivers of legal representation. 2 For instance: Analysis of ICBC claimant and claims data is being carried out to identify characteristics of represented bodily injury claims compared to non-represented claims. Interviews with claims subject matter experts provided initial insights into customers decisions to seek representation. A comprehensive Claimant Attitude Survey is currently underway that will compare perceptions of individuals who have had and have not had a claim, and who chose to be, or not to be, legally represented. The survey is being administered to a large sample of ICBC policy holders, and is offered in English, Punjabi, and Chinese. In-depth interviews will also be conducted with claimants and other stakeholders to develop a deeper understanding of the many factors that contribute to legal representation. ICBC expects to have the benefit of further analysis on this topic in mid While not an exhaustive list, the table below highlights some of the more common drivers of legal representation that ICBC has identified based on past work and some initial new analysis. No risk/cost to pursue litigation Active lawyer messaging, negative Plaintiff counsel acting on contingency fee basis, no fee for no recovery Limited risk in litigating a claim and most times disbursements paid by ICBC Using powerful messaging extoling the need to engage plaintiff counsel while citing the dangers of ICBC cannot control or influence ICBC cannot control and has little 2 There are limits on the ability to derive information from customer research. One cannot, for instance, ask a specific claimant why they have (or have not) chosen legal representation. Under the tort system in BC, ICBC is in an adversarial relationship with the claimant once the claim has been filed, charged with defending the policyholder against whose policy a claim is being made. It would be highly inappropriate for ICBC to ask questions of that nature, given the relationship and given the existence of solicitor-client privilege between the claimant and his or her counsel. 4
256 portrayal of ICBC in advertising Hassle of dealing with claim Lack of familiarity of process Do not trust ICBC or their adjusters Perception litigation equals greater compensation Language barriers, misconceptions dealing with ICBC Actively seeking plaintiffs through websites, social media such as twitter accounts, Facebook Targeting campaigns specific to ethnic or, occupational groups Individuals do not have the time and or wherewithal to participate in the process, Negotiations are seen as daunting, Proof of general damages difficult to ascertain Injured parties have to deal with a sometimes complicated and bureaucratic process 5 influence ICBC has some control and ability to influence ICBC has some control and ability to influence ICBC has some control and ability to influence Negative reports regarding ICBC in media Previous personal negative past experience in dealing with ICBC Poor service from ICBC Significant influence of family, friends, co-workers. Some injured parties view the injury compensation ICBC has only limited scheme as a potential windfall. control and ability to Frequent news accounts of massive court awards influence both locally and in the United States Not comfortable with English language ICBC has some compounds the difficulty in processing claims control and ability to Need to reach out to other parties to assist them influence due to cultural issues It is not possible to ascribe an amount that each driver listed above contributes to the rising legal representation rates. D. ICBC and the Legal Representation Rate ICBC, like automobile insurance providers in every other jurisdiction in Canada, has always faced pressures on BI claims costs. Strategies and initiatives have been introduced over the years in order to address these ongoing BI claims costs issues. However, not every strategy or initiative implemented in the past has been as successful as expected while others may only be effective for a short period of time. Where approaches have not had or no longer have the desired effect ICBC either ceased doing them or modified them in order to achieve better outcomes. The Low Velocity Impact program is one example. Originally launched in 1992 as an approach to reduce escalating BI claims costs, it has been modified over the years. However, ICBC concluded more recently that this program was now causing more claimants to seek representation and was no longer saving claims costs. ICBC ended the LVI program in February In previous applications ICBC referenced the need to provide claimants with better and more comprehensive information combined with better customer service. Based on some of the initial feedback, ICBC was having some success but was not yet fully hitting the mark. More importantly, it has become evident that ICBC s initiatives have not had the same favourable impact among British Columbia s growing multicultural population. While it is early days into the analysis, ICBC has seen
257 significant increases in representation in the Indo Canadian and Asian communities. It has become clear that there are many misconceptions about the ICBC process within these communities that ICBC was not addressing when it attempted to provide a more transparent process. With respect to customer service, ICBC s appointment process, which made the claimant wait to see an adjuster at a scheduled appointment time, was not addressing enough of the injured claimant s immediate needs. While ICBC was having success with the Centralized Claims Injury Centre (CCIC) model it has become clear ICBC needs to continue to expand that approach and make it available to more injured claimants. Another area that was a point of friction for claimants was the approval of medical rehabilitation benefits. After the delisting of chiropractic, physiotherapy and massage treatments, claimants injured in motor vehicle accidents were often left with inconsistent payment approaches that resulted in having to incur out of pocket expenses causing additional financial hardships. ICBC s approval process for these treatments was often inconsistent and confusing for claimants and practitioners alike. Finally, with the pressing need to overhaul its end of life claim system, ICBC realized that it needed to change the way injury claims are processed. The Application references the change from a geographic based model to a functional one in Further changes in the organizational structure in early 2013 have allowed ICBC to better match expanded BI adjuster job profiles to the functional organizational model. These changes were precursors to the roll out of the new claims system and are still being refined. Consequently, until the complete implementation of the new claims system, ICBC will not reap the full benefits of these profound changes. While difficult to measure, it is reasonable to expect that in the short term some of these processing and personnel changes may have or have had some negative impact on representation rates. (For further discussion on transitional impacts see the response to RR BCUC ) E. ICBC s Response to Rising Representation Rates As stated previously, under the tort system there will always be the need for representation and there are factors that drive representation rates that ICBC simply has no control or influence over. However, ICBC needs to continue working on factors within its control or influence and attempt to respond to the rising representation rate. Chapter 6 of the Application describes initiatives being undertaken to influence bodily injury claims costs generally. A number of those initiatives have been designed with a particular focus on reducing the representation rate trend by improving the claimant s dealings with ICBC. Initiatives relevant to the legal representation rate include those listed below. Functional organization model: In 2011 ICBC reorganized the claims division from a geographic, regional based model to a functional model. In the previous organizational structure, newly initiated unrepresented claims were overseen by two different vice-presidents and six different directors. Over time, it became apparent that the organizational structure was an obstacle to achieving consistency in claims handling, customer experience and approaches to settlement. It tended to take longer to implement changes to address representation rates or general improvements in BI claims handling because management had multiple areas of responsibility (non-injury, material damage and administration) in addition to bodily injury. 6
258 The intent behind moving towards a more function-based organizational model was to have a singularity of focus based on types of claims. With the reorganization, all unrepresented claims and new claims initiation is overseen by one director who reports through to one vice president. This more focused organizational structure allows ICBC to set performance and accountability standards specifically on managing the unrepresented claimant and on representation rates. Improved analytics allow management to identify and focus on both positive and negative performance outliers, providing effective feedback where needed. Furthermore, the sharing of best practices and adopting of new and improved claims processes can be implemented more consistently and faster under this type of structure. Training and job aids specific to managing unrepresented claimants are more easily directed at the right level of manager and adjuster under such a structure. Finally, ICBC believes that under this type of organizational structure greater consistency will be achieved in the way in which it initiates, sets and updates reserves, adjudicates and negotiates with unrepresented claimants. As referenced earlier, there continue to be transitional issues, as one might expect from such a significant structural reorganization. However, ICBC believes that, over time, the adoption of the functional model with the attendant benefits outlined above will lead to a more consistent claims experience and timelier claims resolution for unrepresented claimants. Claims hierarchy: The claims hierarchy, like the aforementioned functional model, is one of the major components of ICBC s Transformation Program. The claims hierarchy very simply is an initiative to improve the claims handling process by streaming claims to more specialized adjusters. Previously, ICBC only had two types of BI adjuster job profiles; one that dealt with high risk catastrophic injuries and one that dealt with all the remaining types of injury claims. One of ICBC s responses to escalating injury claims costs was to segment injury claims by risk and complexity. The next logical step in the progression was to match the segmented injury files to an adjuster with the appropriate skills, knowledge and ability. The ability to match a BI claim risk profile with the right set of skills of an adjuster makes good business sense and is the keystone of the new claims system. Having an adjuster who is better trained to address the immediate needs of an injured customer and is managing a case load of only unrepresented claims, will allow them to better interact with unrepresented claimants and provide more consistent and timely service. ICBC could not implement these changes without modifications to the existing collective bargaining agreement. The renegotiation of the collective bargaining agreement in 2012 provided the opportunity to address this impediment. The changes required to stream files to specialized adjusters were implemented in spring of Expansion of Centralized Claims Injury Centre (CCIC): When ICBC first piloted the CCIC model, the intent was to process minor, non-contentious bodily injury claims in a call center team environment. Under the CCIC model, claims adjusters would deal immediately with a BI claimant when they reported their claim at the first notice of loss. Over the years it has proven to be a successful model with low representation rates and high settlement rates. While not all injury claims are appropriately managed in this manner, ICBC felt that more injury claims could be processed through this call center, team-based approach. Expansion of the CCIC model was hampered by technology restrictions (identification and ability to 7
259 forward the call to the CCIC trained adjuster at the first notice of loss) as well as space limitations of the call center itself. While some of those technology limitations will be eliminated with the roll out of the new claim system, ICBC has been able to secure more floor space at the call center facility and has now placed more BI adjusters into the call center to expand the CCIC model. The intent is to better address an injured claimant s immediate needs when they first report their claim. ICBC has also recently expanded the type of claim that would qualify for CCIC handling. By referring more claims through the CCIC model ICBC believes there will be greater claims handling efficiencies, improved consistency and ease of transaction for ICBC s customers and claimants. Minor damage claim program: For a number of years, ICBC had maintained the Low Velocity Impact (LVI) program. The Program involved having a committee review claims with minor or no material damage against a specific set of criteria. If the criteria were satisfied, then ICBC would not consider injury compensation. The original Program was very successful in helping to reduce bodily injury claims costs. However, the effect of the committee-based process was often to delay the determination of whether a claimant s injury claim would be accepted by ICBC. It also was creating friction between the claimant and their adjuster because it took the decision making and accountability away from the adjuster and shifted it to someone that was not in direct contact with the claimant. These shortcomings could intuitively have a negative effect on representation rates. ICBC has abandoned the LVI program, based on the concern that the friction associated with the LVI program was a potential contributor to the growing representation rates, and the cost of the program was now exceeding the benefits that were the original impetus for the program. The claims will be managed by the customer s adjuster, who will be able to make a quicker assessment of their situation to help meet their needs faster. Improvement in First Contact (BI First Notice of Loss): In early 2013 ICBC enhanced the initial injury claim reporting process to provide much more comprehensive information to a claimant when they first reported their claim. Previously, the call centre experience was such that only nominal claim related information was obtained from the claimant and an appointment with an injury adjuster was booked for later follow up. This left customers with potentially unanswered questions and a possible delay in starting medical treatment if they weren t sure what to do between the time of their first call to ICBC and their appointment with an injury adjuster. ICBC recognized this could be frustrating for claimants if they weren t getting answers to their immediate questions and concerns. ICBC s analysis also identified a significant gap in the amount of information that was conveyed between reporting a new claim and having it assigned to an injury adjuster which could potentially lead to increased legal representation. ICBC now spends more time on the phone with the injured party when they first report their claims. The telephone adjuster makes sure the claimant understands they have access to treatment right away, how to go about initiating that treatment and how it will be paid for. The telephone adjuster will discuss vehicle damages, ICBC s Express Repair program and look after alternative transportation needs (rental car). This is a more fulsome approach than before. The intent of this approach is to address the injured claimant s needs up front and provide peace of mind and less hassle. The goal of providing a more 8
260 quality discussion at first notice of loss was to mitigate those potentially unanswered questions that can arise before an injured claimant meets an injury adjuster, and that could cause some people to seek out the assistance of a lawyer. These changes also reduced the time frame between the claimant s first call to ICBC and when the file was assigned to an injury adjuster for follow up. Enhancing the BI first notice of loss interaction and with the implementation of a new claim system, ICBC s goal will be to have a new injury claim assigned to an injury adjuster within 24 hours. This will be a significant improvement for claimants. Faster access to treatment: As stated earlier, one of the more frustrating issues for an injured claimant was the inconsistent and slow authorization of medical treatment. ICBC has implemented changes to the way claimants can access chiropractic, physiotherapy and massage treatments. In the past, a claimant would have to have the therapist contact ICBC for approval and follow up was causing delays in initiating treatment and frustrating billing experiences. Now, ICBC has arranged with the medical providers that claimants only need to present their claim number (issued when the claimant reports their loss to ICBC) to a treating therapist and they are immediately authorized to treat up to 20 visits for accident related injuries. ICBC s approach is to reduce the process and bureaucracy for a claimant who needs treatment thereby having them focus more on recovery than on the claim process. Improvement in Communication: As part of the management of legal representation, ICBC recognized it needed to make the injury claims process more transparent. One of the ways to accomplish this was to provide comprehensive information to ICBC s customers and claimants. While ICBC has been doing this for some time, it became clear that ICBC needed to focus much more on the needs of its multicultural customers and claimants. ICBC s recent research has shown that the rate of early legal representation is highest in specific geographical locations within the Lower Mainland that have significant multi-cultural populations. To help alleviate the confusion for its multicultural customers and claimants and to address their unique needs, ICBC has focused its efforts in two main areas, a dedicated call line in Punjabi and a multi-language information marketing campaign. While ICBC has had some free translation services in more than 170 languages since 2010, there was a need to look for better ways to communicate with our multi-cultural customers. The new dedicated line in Punjabi is an enhancement to this service. Now, when a Punjabi speaking customer or claimant wants to report a new claim they will be linked directly to a dedicated number and have immediate translation service. ICBC recognized the demand for a Punjabi interpreter has increased significantly over the past two years and this was an opportunity to reach out to that community. ICBC will continue to enhance its translation services expanding it to a dedicated Cantonese and Mandarin line in the future. ICBC has recently embarked upon a marketing campaign that involves radio, TV and print ads that dispel some of the common myths perpetuated by lawyer advertising. One of the most prevalent anti ICBC messaging is through advertisements for legal services. In order to address some of these misconceptions, ICBC is providing information in English, Punjabi and Chinese about the claims process, settlement and access to benefits. ICBC s intent is to impact increasing legal representation rates by reaching out to the ethnic communities and dispelling some of the misconceptions they may have about 9
261 the injury claims process. Attached as an appendix are copies of the current campaign messaging which can be also found on icbc.com. Conclusion Given the multitude of factors that will influence an individual claimant s decision to obtain legal representation, there will always be an aspect of trial and error in developing strategies to deal with legal representation. It is clear, however, that claimants who are frustrated by ICBC s claims process may go elsewhere for assistance and answers. ICBC has taken some meaningful steps to identify issues with its own claims process that have led to frustration on the part of some claimants, and has taken reasonable steps to improve the experience by providing comprehensive information to claimants, good customer service and fair claims handling. ICBC will continue to gather and assess data and look for new ways to improve. 10


262 11

263 12
264 Movement of United Professionals Information Request No RR MoveUP.2.1 Dated 12 January Page 1 of RR MoveUP.2.1 Reference: Exhibit B-5, RR BCUC.30.1 Historically, how many of ICBC s claims have fallen under the Small Claims threshold? If the proportion has changed significantly over the past four years, please provide the proportion in each year. Response: The number of closed bodily injury claims that fall within the $25,000 Small Claims threshold is shown in the table below. The table includes the percentages as well as the number of exposures, because the mix of claims settled in each year has varied. Bodily Injury Exposures Closed with Amount that Fall Under the Small Claims Threshold Closed Year Number of Exposures closed <= $25,000 30,369 35,774 33,596 34,910 % with Payments for Heads of Damage <= $25,000 78% 79% 73% 73%
265 Movement of United Professionals Information Request No RR MoveUP.3.1 Dated 12 January Page 1 of RR MoveUP.3.1 Reference: Exhibit B-5, RR BCUC Response: There were no direct cost savings attributed to the Claims Data Migration Project (CDMP) within the Transformation Program (TP). Therefore, removal of CDMP from the Transformation Program does not directly impact the benefits from TP. However, the following indirect and qualitative benefits to Basic and Optional insurance policyholders will be realized upon completion of claims data migration. Enable decommissioning of legacy claims systems. Improve value of analytical and operational insights into claims data. Reduce system integration complexity by having single source for claims history versus various legacy sources Therefore, the plan is to corporately fund this project in the future. Please quantify the indirect and qualitative financial benefits to Basic and Optional insurance policyholders to be realized upon completion of claims data migration. Response: The benefits referred to in the information request are the expected indirect and qualitative benefits of completing claims data migration. Financial benefits from these areas can only be quantified/realized in future years when these initiatives are undertaken post migration of claims data and when requirements for these areas are known.
266 Movement of United Professionals Information Request No RR MoveUP.4.1 Dated 12 January Page 1 of RR MoveUP.4.1 Reference: Exhibit B-5, RR BCUC Response: There were no direct cost savings attributed to the Claims Data Migration Project (CDMP) within the Transformation Program (TP). Therefore, removal of CDMP from the Transformation Program does not directly impact the benefits from TP. However, the following indirect and qualitative benefits to Basic and Optional insurance policyholders will be realized upon completion of claims data migration. Enable decommissioning of legacy claims systems. Improve value of analytical and operational insights into claims data. Reduce system integration complexity by having single source for claims history versus various legacy sources Therefore, the plan is to corporately fund this project in the future. Please quantify the indirect and qualitative financial benefits to Basic and Optional insurance policyholders to be realized upon completion of claims data migration. Response: Please see the response to information request RR MoveUP.3.1.
267 Movement of United Professionals Information Request No RR MoveUP Dated 12 January Insurance Corporation of British Columbia Response Issued 29 January Page 1 of RR MoveUP Reference: Exhibit B-5, RR BCUC.44.1 With respect to performance-based incentive pay, ICBC on page 4-17 of Exhibit B-1-1 states: The 2015 outlook ($18 million) has the potential to be $4 million higher than 2014 actual ($14 million) as the 2015 outlook reflects ICBC s standard budgeting assumption that in 2015 ICBC will achieve its targets. Please elaborate on why it is considered appropriate use performance-based incentive pay expense based on the assumption that ICBC will meet all of its performance targets for the year for 2015 Outlook, given that some of these targets were not met in Response The targets set for 2015 are specific to the corporate objectives for the year and differ from those for For example, the 2014 targets included measures for corporate projects being on time and on budget. This measure is not included in 2015, however, a measure for material damage costs is included, which was not a measure for Whether or not ICBC meets these targets cannot be determined until the completion of the year. 5.1 Please describe in detail what the material damage target was in Please confirm whether the Corporation has met its Material Damage target for Please indicate what ICBC s results for this metric were in Response: 5.1 As part of the corporate objective of maintaining financial stability, material damage claims costs incurred was a measure for 2015, with a target of $1.069 billion. 5.2 ICBC has not yet finalized the 2015 year-end financial results and, therefore, cannot confirm whether it has met this target. 5.3 As of September 30, 2015, ICBC had incurred $840 million in material damage claims costs. ICBC will publish the 2015 year-end financial results when they are finalized.
268 Movement of United Professionals Information Request No RR MoveUP.6.1 Dated 12 January Page 1 of RR MoveUP.6.1 Reference: Exhibit B-1, page 5-5 in late April 2014 ICBC completed the final stages of Claims Transformation, after which there would be a 12 to 18-month stabilization period. Due to temporary impacts during this stabilization period, ICBC has been unable to survey claims customers after May 2014, but expects to resume surveying soon. and Reference Exhibit B-5, RR BCUC.46.1: Please confirm that in there will be no further Project Stabilization expenses incurred in relation to support required during stabilization (the process from implementation to steady state) for the new claims management system. Response: Project stabilization expenses for the new claims management system was a one-time expense. As the Claims Transformation stabilization period was completed in 2015, there will be no further project stabilization expenses in relation to this in.
269 Movement of United Professionals Information Request No RR MoveUP.7.1 Dated 12 January Page 1 of RR MoveUP.7.1 Reference: Exhibit B-5, RR BCUC.60.3 COMMENT: In its response to this BCUC IR, the Corporation listed a number of steps it had taken to address those factors it can influence to give its policyholders confidence that they do not need to be represented by legal counsel. Is it ICBC s position that these actions are going to produce an improvement in the legal representation rate and if so, when will that positive impact be seen? Response: Please see the response to information request RR BCOAPO.39.1, where ICBC discusses expectations for the Legal Representation Rate, and the response to information request RR BCUC.60.4, where ICBC discusses the potential impacts of ICBC s informational campaigns and initiatives.
270 Movement of United Professionals Information Request No RR MoveUP.7.2 Dated 12 January Page 1 of RR MoveUP.7.2 Reference: Exhibit B-5, RR BCUC.60.3 COMMENT: In its response to this BCUC IR, the Corporation listed a number of steps it had taken to address those factors it can influence to give its policyholders confidence that they do not need to be represented by legal counsel. 7.2 Has the Corporation looked to other jurisdictions to determine what, if any, other steps might be taken to provide policyholders with the confidence needed to reduce the representation rate? If so, what jurisdictions, what programs, and when were they examined? Response: ICBC is not aware of any Canadian jurisdictions where the representation rate has declined while maintaining the same product structure and, therefore, is not aware of any programs that might curb the representation rate in BC. In addition, BC is the only province in Canada with a full tort system, and experience with programs in other Canadian jurisdictions has limited value. While full tort systems exist in jurisdictions in the US, insurance policies there have much lower limits of liability and there are no US jurisdictions with a monopoly on Basic insurance. This means that if there are any programs that have reduced representation rate in US jurisdictions they also would have limited value in BC. It should be noted that other provinces are also experiencing increasing representation rates. For example, Pinnacle Actuarial Resources, Inc. noted in its 2014 closed claim study, entitled Automobile Insurance Third Party Liability Bodily Injury Closed Claim Study in Ontario, that 91% of claimants had some type of legal representation in comparison to a 1987 closed claim study which found that 54% of claimants had some form of legal representation. ICBC would be keen to review other programs that reduce representation rates should they exist, but product differences and ICBC s monopoly position may limit their applicability in BC.
271 Movement of United Professionals Information Request No RR MoveUP.8.1 Dated 12 January Page 1 of RR MoveUP.8.1 Reference: Exhibit B-5, RR BCOAPO.6.1 When asked whether ICBC has observed any correlations between the Abandon and Deflection Rates and other of its performance metrics, the Corporation indicated that it could only do a correlational analysis between rates and other measures if the metric were captured by its Workforce Management Software or imported into it for analysis. 8.1 Has ICBC now performed this analysis? If so, please provide those results If not, please explain why it has failed to do so. Response: ICBC has not performed this correlation analysis. Performing this analysis would require securing technical, analytical, and testing resources to determine the information to be isolated, formatting the necessary data elements, and building and testing the reports. As shown in the Application, Chapter 6, Figures 6.5, 6.6, and 6.7, call centre metrics have returned to anticipated levels after experiencing expected short-term transitional impacts. Therefore, this analysis has been given a lesser priority than other higher priority work that would utilize the same internal resources.
 targets.")
272 Movement of United Professionals Information Request No RR MoveUP.9.1 Dated 12 January Page 1 of RR MoveUP.9.1 Reference: Exhibit B-5, RR BCOAPO Does ICBC have or plan to implement Management and Confidential Incentive Pay performance targets based upon either expediting claims resolutions or reducing legal representation rates? If so, please describe the (intended) targets If not, please explain why not.
273 Movement of United Professionals Information Request No RR MoveUP.9.1 Dated 12 January Page 2 of 2 Response: 9.1 ICBC does not currently have, or plan to implement, incentive pay performance targets for expediting claims resolutions. ICBC continuously strives to reduce legal representation rates and some objectives on individual performance plans include measures on reducing legal representation. However, those measures are only one part of the overall performance plan, and their impact on the final performance rating and incentive pay under the Holdback Incentive Pay plan (which applies to Management and Confidential staff) is weighted differently depending on the individual s role and level within ICBC ICBC has not finalized the performance targets for. The 2015 legal representation rate measures vary in description depending on an individual s level within ICBC ICBC does not provide incentive pay for expediting claims resolution because the decision to accept an offer of settlement rests with the claimant. The speed with which a claim is resolved is outside of ICBC s control and is not an effective measure of file performance. Please see the response to information request RR MoveUP.9.1 above.
274 Movement of United Professionals Information Request No RR MoveUP Dated 12 January Insurance Corporation of British Columbia Response Issued 29 January Page 1 of RR MoveUP Reference: Exhibit B-1-1, Exhibit D.1.1, and ICBC 2014 Revenue Requirements Application, Exhibit D.1.1, and ICBC 2014 Revenue Requirements Decision, p.11 In its response to this IR, ICBC confirmed that it expects, the Legal Representation Rate will continue to increase, consistent with its historical trend rate. AND REFERENCE Ex B-1-1 Exhibit C-0-5 page 12 para 30: The frequency of unrepresented claim exposures5 continued to follow fairly closely its pre-2008 trend rate through 2013, while the frequency of the more costly and complex represented claim exposures began to turn in 2008 from a gently downward slope to a strong upward trend. In 2014, the frequency increase is seen across both the unrepresented and represented claims. COMMENT: Not all injury claims are amenable to legal representation, and in general the more minor a claim the less likely it is to be legally represented, because it may not be sufficiently valuable for a contingency fee arrangement, and the cost of legal representation is disproportionate to the likely settlement or award arising from it. Therefore, it can be said that there is a saturation point or band somewhat less than 100% of claims, where the large majority of claims that are realistically amenable to legal representation are represented Confirm that ICBC is not at risk of 100% of bodily injury claims being legally represented in the current market for legal services Confirm that the more costly and complex a claim is, the greater is the likelihood that it will be legally represented Confirm that because of the economics of legal representation, smaller-value claims (including those where the cost of legal representation may approach or even exceed the value of the claim) are relatively unlikely to be legally represented Confirm that it is not realistic to suppose that there would ever be a scenario where 100% of bodily injury claims are legally represented for reasons including these economic factors. Response: 10.1 ICBC does not agree with the comment that not all injury claims are amenable to legal representation, or that a claim may not be valuable enough to be the subject of a contingency fee arrangement. ICBC recognizes that there are financial reasons why a lawyer may not agree
275 Movement of United Professionals Information Request No RR MoveUP Dated 12 January Insurance Corporation of British Columbia Response Issued 29 January Page 2 of 2 to take on a case on a contingency fee basis, and that hourly fee arrangements are likely too costly for claimants with a small claim. However, as discussed in the 2013 Revenue Requirements Proceeding, because ICBC operates in a full tort system where injured parties have the right to seek legal representation and the right to seek redress through the legal process, ICBC cannot say there is an upper bound to legal representation Generally speaking, the more severe an injury, the greater the likelihood the claimant will have obtained legal representation. More severe injuries are generally associated with greater costs and complexity than less severe injuries As discussed in the response to information request RR MoveUP.10.1 above, ICBC recognizes there may be financial reasons why smaller claims may not become represented. However, some claims may require representation due to medical or legal issues, regardless of the dollar value of the claim. Plaintiff counsel in motor vehicle injury cases typically act on the basis of contingency fee arrangements in which counsel are paid on the basis of a percentage of recovery and there is no fee if there is no recovery. In this circumstance, there is very little risk or cost to a claimant in choosing to become represented. Given the conditions present in contingency fee arrangements, it is unlikely that the cost of legal representation will approach or exceed the value of a claim As a practical matter, ICBC does not expect that the legal representation rate would reach 100%; however, as discussed in the 2013 Revenue Requirements Proceeding, ICBC cannot speculate beyond that because a number of factors may affect a claimant s decision to seek legal representation.
276 Movement of United Professionals Information Request No RR MoveUP.10.5 Dated 12 January Page 1 of RR MoveUP.10.5 Reference: Exhibit B-1-1, Exhibit D.1.1, and ICBC 2014 Revenue Requirements Application, Exhibit D.1.1, and ICBC 2014 Revenue Requirements Decision, p.11 In its response to this IR, ICBC confirmed that it expects, the Legal Representation Rate will continue to increase, consistent with its historical trend rate. AND REFERENCE Ex B-1-1 Exhibit C-0-5 page 12 para 30: The frequency of unrepresented claim exposures5 continued to follow fairly closely its pre-2008 trend rate through 2013, while the frequency of the more costly and complex represented claim exposures began to turn in 2008 from a gently downward slope to a strong upward trend. In 2014, the frequency increase is seen across both the unrepresented and represented claims. COMMENT: Not all injury claims are amenable to legal representation, and in general the more minor a claim the less likely it is to be legally represented, because it may not be sufficiently valuable for a contingency fee arrangement, and the cost of legal representation is disproportionate to the likely settlement or award arising from it. Therefore, it can be said that there is a saturation point or band somewhat less than 100% of claims, where the large majority of claims that are realistically amenable to legal representation are represented. Please provide a graph in which the X axis is the proportion of claims that are legally represented and the Y axis is the ultimate loss cost of bodily injury claims, illustrating the proportion of claims at each increment of value which were legally represented, for policy year 2011.
277 Movement of United Professionals Information Request No RR MoveUP.10.5 Dated 12 January Page 2 of 2 Response: Figure 1 Represented Proportions by Size of Loss for Policy Year 2011 Claims Represented Rate By Size of Loss - Policy Year K % 100K - 200K 80.1% Size of Loss (Incurred Loss) 60K - 100K 40K - 60K 20K - 40K 15K - 20K 10K - 15K 5K - 10K 17.2% 37.8% 51.9% 66.2% 79.1% 77.9% 0-5K 7.1% 0% 10% 20% 30% 40% 50% 60% 70% 80% 90% 100% Represented Rate For the purposes of Figure 1 above, policy year 2011 claims are those associated with policies issued between January 1, 2011 and December 31, The size of loss categories are based on loss and expense payments net of recoveries for closed claims as of December 31, This is considered to represent the ultimate cost for closed claims, which represent 87% of policy year 2011 claims (the remaining 13% remain open as of December 31, 2015). Please refer to the response to information request RR MoveUP for additional details on the characteristics of a represented claim, which supports the results highlighted in Figure 1 above (i.e., represented claims have more costs associated with them and severe claims are more likely to be represented).
278 Movement of United Professionals Information Request No RR MoveUP Dated 12 January Insurance Corporation of British Columbia Response Issued 29 January Page 1 of RR MoveUP Reference: Exhibit B-1-1, Exhibit D.1.1, and ICBC 2014 Revenue Requirements Application, Exhibit D.1.1, and ICBC 2014 Revenue Requirements Decision, p.11 In its response to this IR, ICBC confirmed that it expects, the Legal Representation Rate will continue to increase, consistent with its historical trend rate. AND REFERENCE Ex B-1-1 Exhibit C-0-5 page 12 para 30: The frequency of unrepresented claim exposures5 continued to follow fairly closely its pre-2008 trend rate through 2013, while the frequency of the more costly and complex represented claim exposures began to turn in 2008 from a gently downward slope to a strong upward trend. In 2014, the frequency increase is seen across both the unrepresented and represented claims. COMMENT: Not all injury claims are amenable to legal representation, and in general the more minor a claim the less likely it is to be legally represented, because it may not be sufficiently valuable for a contingency fee arrangement, and the cost of legal representation is disproportionate to the likely settlement or award arising from it. Therefore, it can be said that there is a saturation point or band somewhat less than 100% of claims, where the large majority of claims that are realistically amenable to legal representation are represented Confirm that there is a soft threshold or tipping point in the value of bodily injury claims beneath which legal representation becomes relatively unlikely What legal representation rate does ICBC consider to represent a scenario where substantially all of the bodily injury claims which are realistically candidates for legal representation would be legally represented? 10.8 For approximately what percentage of bodily injury claims does ICBC consider itself to be at risk of legal representation? Response: 10.6 ICBC cannot confirm a soft threshold or tipping point as set out in the question. As discussed in the response to information request RR MoveUP , representation is more likely to occur when injuries are more severe, but it does also occur for less severe injuries and for less valuable claims. Represented claims are also less likely to be of low value because of the added costs of resolving a represented claim.
279 Movement of United Professionals Information Request No RR MoveUP Dated 12 January Insurance Corporation of British Columbia Response Issued 29 January Page 2 of Please see the response to information request RR MoveUP ICBC does not believe that there is an upper bound to the legal representation rate but, as a practical matter, ICBC does not expect the legal representation rate would reach 100% In light of the responses to information requests RR MoveUP.10.6 and RR MoveUP.10.7 above, as well as the response to information request RR MoveUp , ICBC considers there to be potential for legal representation for all bodily injury claims; however, it would be much less of a risk for smaller claims.
280 Movement of United Professionals Information Request No RR MoveUP.11.1 Dated 12 January Page 1 of RR MoveUP.11.1 Reference: EXHIBIT B-5, RR COPE.1.1 Reference: ADJUSTER CASELOADS IN CLAIM CENTRES. In response to this IR, ICBC generated the following table showing the rise in BI Injury Exposures open in Claims Centres at Month Ending Periods. This table shows a significant rise in the open BI exposures since October 2012 to October Does ICBC forecast that this number will continue to trend upwards in? Response: Intake is anticipated to increase in, which could ultimately mean an increase in the number of bodily injury (BI) exposures open. The number of open claims at any point in time is a by-product of claim intake and settlements. Intake forecasts are impacted by seasonal and other factors, while settlements are impacted by staff levels and productivity, representation rates (which increase the time to settlement), and acceptance of offers by claimants. ICBC will continue to focus on the management of its open BI exposures. This includes ensuring the correct resources are devoted to managing the current mix of open claims and filling vacancies, as necessary, in a timely manner.
281 Movement of United Professionals Information Request No RR MoveUP.11.2 Dated 12 January Page 1 of RR MoveUP.11.2 Reference: EXHIBIT B-5, RR COPE.1.1 Reference: ADJUSTER CASELOADS IN CLAIM CENTRES. In response to this IR, ICBC generated the following table showing the rise in BI Injury Exposures open in Claims Centres at Month Ending Periods. This table shows a significant rise in the open BI exposures since October 2012 to October Does ICBC accept that a greater number of open exposures means each employee is handling more files at any given time now than they were in October of 2012? If not, why not? Response: Based on the number of open exposures and injury adjuster full-time equivalents, the average number of exposures assigned was exposures per adjuster in October 2012 and exposures per adjuster in October The number of exposures being handled by each injury adjuster at any given time will vary due to day-to-day considerations, such as vacations, illnesses, and month-to-month productivity and intake. Broader factors, such as the number of staff and the complexity/types of exposures they are assigned, must also be considered to determine if this translates into an increase for each injury adjuster. Finally, during the period in question, ICBC has made significant changes related to Claims Transformation, including implementing a new functional organizational model, new Claims job hierarchy, and new claims systems and business processes. Through Claims Transformation, ICBC has simplified and streamlined business processes, reduced inefficient and redundant processes, and provided employees with the supporting tools and systems to better meet the needs of customers. Because of these changes, it is impossible to make relevant conclusions by simply comparing the average pending levels between 2012 and ICBC has committed to undertaking two workload studies to assess the impact of the new Claims job hierarchy on the job profiles that were altered/created as a result of the Claims job hierarchy. For further information, please also see the response to information request RR RM.3.1.
282 Movement of United Professionals Information Request No RR MoveUP.11.3 Dated 12 January Page 1 of RR MoveUP.11.3 Reference: EXHIBIT B-5, RR COPE.1.1 Reference: ADJUSTER CASELOADS IN CLAIM CENTRES. In response to this IR, ICBC generated the following table showing the rise in BI Injury Exposures open in Claims Centres at Month Ending Periods. This table shows a significant rise in the open BI exposures since October 2012 to October Does ICBC accept that this greater number of open files may negatively impact their employees abilities to provide the level of customer service necessary to maintain the confidence of claimants to rely upon their direct dealings with the Corporation and not to resort to retaining counsel? If not, please explain why not. Response: It is not possible to draw conclusions about claimants confidence in ICBC by simply comparing average pending levels between 2012 and As noted in the response to information request RR MoveUP.11.2, an increase in the number of open exposures does not necessarily translate to an increase in the number of exposures being handled by each injury adjuster at any given time. ICBC has implemented significant changes in that time frame, including the new functional organizational model, the new Claims job hierarchy, and new claims systems and business processes. As discussed in the response to information request RR BCUC.60.2, the Customer Attitudes Survey showed that while customers may have different reasons to become represented, the factors exerting the most influence are external to ICBC; e.g., perceived lawyer benefits and a deserving attitude. Given that the number of injured claimants obtaining legal representation at the outset of their claim has been increasing, it would be inappropriate to assume open unrepresented claim volumes are a significant driver of claimants decisions to seek legal representation.
283 Movement of United Professionals Information Request No RR MoveUP.12.1 Dated 12 January Page 1 of RR MoveUP.12.1 Reference: Exhibit B1-1 Revised Application p footnote 9 9 Contractors are used to support project work and temporarily backfill resources. Contractors may be retained to provide specialized skills not readily available at ICBC or to meet temporary fluctuations in workload. and Reference Exhibit B-5 response to RR COPE.4.2-3: 4.2 ICBC hires contractors to satisfy short term needs, mainly involving work on projects that require a specific skill set. Periodically, contractors may perform core work, backfilling staff allocated to projects. With changing project needs, this is often difficult to plan. Of the 42 contractors, 39 were forecasted for the Information Services Division (ISD) and 3 for the Corporate Services Division. Of these 39 ISD contractors, 32 were allocated to projects based on the skills they possessed, not available within ICBC. 4.3 In 2015, there were 10 contractors retained to temporarily back fill resources. In which department(s) of the Corporation were the 10 contractors deployed who were retained for back filling? Response: Please note that the 10 contractors retained to temporarily back fill resources discussed in the response to information request RR COPE.4.3, filed in response to information request RR COPE.4.2-3, were reported based on employee full-time equivalents (FTE) and are not necessarily represented by 10 individual contractors. Within the Corporate Services Division, the 3 contractors retained to temporarily back fill resources were utilized in the following departments: Organizational Development Change Enablement Total Rewards, HRIS & Measurement Learning & Development Within the Information Services Division, the 7 contractors retained to temporarily back fill resources were utilized in the following departments: Architecture Services Business Insights Development & Integration
284 Movement of United Professionals Information Request No RR MoveUP.12.1 Dated 12 January Page 2 of 2 Data Integration Database Platforms Distributed Computing & Storage Platforms Enterprise Content Management Enterprise Data Management Platforms Infrastructure Automation IS Claims Supporting Solutions IS Identity & Access Management IS Quality Assurance & Testing Services Middleware Platforms

285 Movement of United Professionals Information Request No RR MoveUP Dated 12 January Insurance Corporation of British Columbia Response Issued 29 January Page 1 of RR MoveUP Reference: Exhibit B-5, RR COPE.4.4
286 Movement of United Professionals Information Request No RR MoveUP Dated 12 January Insurance Corporation of British Columbia Response Issued 29 January Page 2 of Please confirm that vacancy management to ensure that ICBC delivers on its overall financial commitments means that the Corporation delayed filling certain positions in order to ensure that controllable operating expenses remain flat through Please confirm that the majority of vacancies were filled in Please confirm the number of vacancies remaining at the end of If all were not filled, please explain the corporation s inability to fill those vacancies within the timeline it set for itself Please confirm when ICBC expects to fill those vacancies. Response: 13.1 Annually, ICBC will set a controllable operating expense budget with related full-time equivalents (FTEs). The current commitment is to keep the controllable operating expense budget flat until 2017, fully absorbing all inflationary pressures, which will benefit Basic insurance policyholders. Vacancy management encompasses a number of tactics, which includes not only delaying the filling of certain positions, but also, through thoughtful assessment of business needs, choosing not to fill a position if a more critical need is required elsewhere in the organization, or deliberately not filling a position due to organizational efficiencies and other corporate priorities. These tactics contribute to managing ongoing controllable operating expenses to ensure that actual spending does not exceed the annual budget As noted in the response to information request RR BCUC.43.1, filed in the response to information request RR BCUC , ICBC does not track unfilled vacancies by employee group and division. At any given time during the year, there will be vacancies in part due to employee movements, retirements, resignations, and organizational changes. These vacancies are filled if there is a business need.
287 Movement of United Professionals Information Request No RR MoveUP Dated 12 January Insurance Corporation of British Columbia Response Issued 29 January Page 3 of As discussed in the response to information request RR MoveUP.13.2 above, ICBC does not track unfilled vacancies by employee group and division, therefore, ICBC is unable confirm the number of vacancies remaining at the end of Similar to what is noted in the response to information request RR BCUC.43.1, filed in the response to information request RR BCUC , by using 2015 FTE outlook less actual annualized FTEs, ICBC can derive a proxy for 2015 unfilled vacancies. The table used in response to information request RR BCUC.43.1 has been expanded below to include 2015 FTE information As discussed in the responses to information request RR MoveUP.13.1 above and RR BCUC , filed in the response to information request RR BCUC , some vacancies may not have been filled as a result of changes in organizational structure, challenges in recruiting individuals possessing necessary skills, filling a more critical need in another part of the organization, and/or choosing to not fill positions where efficiency gains have been made, or more broadly, where business needs do not support filling the vacancy. The existence of vacancies at year-end should not be construed to mean ICBC was unable to, fill those vacancies within the timeline it set for itself as stated in this information request.
288 Movement of United Professionals Information Request No RR MoveUP Dated 12 January Insurance Corporation of British Columbia Response Issued 29 January Page 4 of As noted in the response to information request RR BCUC , filed in the response to information request RR BCUC.43.1, vacancies will be filled if they are still required and/or when a suitable candidate is found. ICBC continues to take a deliberate approach to managing ongoing operating costs to deliver on the commitment to keep controllable operating costs flat.
289 Movement of United Professionals Information Request No RR MoveUP Dated 12 January Insurance Corporation of British Columbia Response Issued 29 January Page 1 of RR MoveUP Reference: Exhibit B-5, RR COPE Please confirm when the budget will be finalized If it is finalized before these IR responses are due, please provide the number of additional Claims Contact Centre FTE s that will be hired in. Response: 14.1 The budget has been finalized and was approved by ICBC s Board of Directors in January, but it has yet to be tabled in the Legislature, where it will be made public as part of the Provincial Budget. This will occur on February 16,.
290 Movement of United Professionals Information Request No RR MoveUP Dated 12 January Insurance Corporation of British Columbia Response Issued 29 January Page 2 of Although the budget has not been finalized and made public, ICBC can advise that it currently expects to hire an additional 22 full-time equivalents into the Claims Contact Centre in, subject to being able to find qualified candidates and to changing business priorities.
291 Movement of United Professionals Information Request No RR MoveUP.15.1 Dated 12 January Page 1 of RR MoveUP.15.1 Reference: Exhibit B-5, RR COPE Please confirm that the investigation of this error has now concluded If not, please explain why not If so: i) please confirm that the error been corrected. ii) Please provide the requested information.
292 Movement of United Professionals Information Request No RR MoveUP.15.1 Dated 12 January Page 2 of 2 Response: 15.1 ICBC confirms that the investigation has concluded. ICBC s service provider has confirmed that the trunk was reporting busy signals in error. The service provider has re-run the reports and confirmed that the busies reported are attributed to the trunk switching between the T1 s (defined in the reference to information request RR COPE.15.1 above), not actual busy signals presented to customers i) ICBC s service provider has revised the way that reports are run. All future reports will now be run on each individual trunk. ii) Reports have been re-run for December 2015, and the result is zero busies. The reports were not re-run for January 2013, July 2015, and October 2015, since reports are run on a snapshot basis, on a pre-determined date agreed to by ICBC. Historical reports run prior to each snapshot are not retained. However, the trunk in use was the same during those months, and ICBC can draw the same conclusion that the reports were incorrectly reporting busies.
293 Movement of United Professionals Information Request No RR MoveUP.16.1 Dated 12 January Page 1 of RR MoveUP.16.1 Reference: Exhibit B-5, RR COPE.13.1 Please confirm that this response indicates ICBC s system and information tracking constraints mean that at any given time, the Corporation is unaware of how many active fraud investigations are underway.
294 Movement of United Professionals Information Request No RR MoveUP.16.1 Dated 12 January Page 2 of 2 Response: ICBC s existing system includes tracking and reporting on the total number of new, open, and closed investigations; however, the system is unable to report separately on the total number of each type of new and open investigations until after the investigation is closed. The total number of new and open investigations can be provided at any given time.
295 Movement of United Professionals Information Request No RR MoveUP.16.2 Dated 12 January Page 1 of RR MoveUP.16.2 Reference: Exhibit B-5, RR COPE.13.1 Please explain how ICBC determines its staffing needs for SIU and the Cyber Unit if its system does not allow it to track the total number of open injury claim fraud investigations and total number of new injury claim fraud investigations.
296 Movement of United Professionals Information Request No RR MoveUP.16.2 Dated 12 January Page 2 of 2 Response: ICBC continually tracks the number of new fraud investigation requests. Injury claims are one of the types of investigations that are included in the total of new and open fraud investigations. Investigations are assigned to officers based on experience and specialization. The complexity of the investigation and the length of time it will take to complete can be difficult to predict. The Special Investigation Unit (SIU) constantly monitors and evaluates its staffing needs in order to remain aligned with corporate goals and priorities. Cyber Unit fraud investigation requests primarily relate to injury claims. These requests are assigned based on the volume of referrals, the priority of the requests, and the experience and specialization of the Cyber Unit investigators.
297 Movement of United Professionals Information Request No RR MoveUP.16.3 Dated 12 January Page 1 of RR MoveUP.16.3 Reference: Exhibit B-5, RR COPE.13.1 Does ICBC expect that the fraud analytics tool or the fraud case management solution referenced in its response to RR BCUC.55.1 will allow the Corporation to track active and new fraud investigation numbers.
298 Movement of United Professionals Information Request No RR MoveUP.16.3 Dated 12 January Page 2 of 2 Response: Yes, ICBC expects that a fraud analytics tool and case management solution will improve its ability to track active and new fraud investigations.

299 Movement of United Professionals Information Request No RR MoveUP.17.1 Dated 12 January Page 1 of RR MoveUP.17.1 Reference: Exhibit B-5, RR COPE.18.1 Please confirm that with the resumption of Claims Services Satisfaction surveys, a YTD figure will be provided in ICBC s Revenue Requirement Application. Response: Yes, with the resumption of Claims Services Satisfaction surveys this year, a year to date figure will be provided in ICBC s Revenue Requirement Application. For more information, please refer to the response to information request RR COPE.9.2.7, filed in the response to information request RR COPE

300 Movement of United Professionals Information Request No RR MoveUP Dated 12 January Insurance Corporation of British Columbia Response Issued 29 January Page 1 of RR MoveUP Reference: EXHIBIT B-9, RR COPE.19.2.d In response to the following two questions, ICBC responded as follows: 18.1 Given that ICBC does not apparently track the number of times estimators inspect completed work, how can it know with any degree of certainty that this practice remains current? 18.2 Please explain why the Corporation does not require a certain level of random and/or targeted post-repair checks for quality control purposes. Response: ICBC s current practices related to the Express Repair program were discussed in the response to information request RR COPE There are many embedded processes in the Express Repair program to ensure estimators review completed work, as appropriate. As outlined in the Express Repair Program Guide, which is publicly available from the business partners section of icbc.com at drop-in visits may include repairs in progress and completed repairs.
301 Movement of United Professionals Information Request No RR MoveUP Dated 12 January Insurance Corporation of British Columbia Response Issued 29 January Page 2 of 2 ICBC also conducts post-repair inspections on body shops who have applied to become accredited as ICBC c.a.r. shop and c.a.r. shop VALET facilities prior to granting accreditation status. As part of the ICBC Accreditation Agreement, all c.a.r. shop and c.a.r. shop VALET facilities must provide a written lifetime guarantee for their completed work, and must have certified and trained staff along with proper equipment. Under the contract of insurance, when a vehicle is repairable, ICBC s obligation is to the customer to return their vehicle to the condition it was in just prior to the crash. ICBC contracts with body shops to deliver services to meet this obligation. ICBC also uses customer feedback through various mechanisms, such as the AutocheX customer service surveys, customer relations enquiries, and direct feedback from customers to determine when post-repair inspections are appropriate.

302 Movement of United Professionals Information Request No RR MoveUP Dated 12 January Insurance Corporation of British Columbia Response Issued 29 January Page 1 of RR MoveUP Reference: EXHIBIT B-9, RR COPE.19.2.f 19.1 Please describe the shifts estimators are scheduled to work Please confirm that staff coverage is less at the beginning and end of each day than during typical office hours. Response: 19.1 Estimating hours of work are covered in Article 12 of the Collective Agreement between ICBC and COPE/MoveUP. Depending on work location, full-time shifts range from a nine-day fortnight from Sunday to Saturday, four days on and four days off, to five consecutive days from Monday to Friday, less scheduled time off days. In addition, work start times and end times may differ between communities and work sites. Shifts are subject to change depending on business needs, and are handled in accordance with the Collective Agreement.
303 Movement of United Professionals Information Request No RR MoveUP Dated 12 January Insurance Corporation of British Columbia Response Issued 29 January Page 2 of In some locations, staff coverage may be less at the beginning or end of each day, and is dependent on appointment schedules, business needs, and hours of service at each location. Currently, larger claim centres are open 7:30 a.m. to 5:30 p.m. from Monday to Thursday, and 7:30 a.m. to 4:30 p.m. on Fridays. Smaller locations are open 8:30 a.m. to 4:30 p.m. from Monday to Friday. For those larger locations with the extended hours discussed above, coverage is typically less at the beginning and end of each day, with the majority of staff working the core hours of 8:30 a.m. to 5:00 p.m.
304 Movement of United Professionals Information Request No RR MoveUP Dated 12 January Insurance Corporation of British Columbia Response Issued 29 January Page 1 of RR MoveUP Reference: EXHIBIT B-9, RR COPE.19.2.n 20.1 Please confirm that in the past estimators would have viewed all vehicles prior to their being taken to shops for repairs Please confirm that the current situation is, with estimates being performed at the VALET shops themselves, estimators are being asked to approve, deny or modify claims for judgement time on vehicles they have not seen in person. Response: 20.1 Before ICBC s Express Repair program was implemented in 2002, ICBC estimators viewed the majority of damaged vehicles prior to them being taken to a body shop for repair. There were some situations where an estimator did not view a vehicle in advance of repairs being commenced. For example, out of province claims, subrogation claims, and situations where emergency repairs were completed before the customer attended a claim centre for their initial damage review. While ICBC did initiate most estimates, for many repairs, the assigned body shop had to seek approval for a supplemental estimate on the initial repair sheet to account for items such as hidden damage, part price changes, and legitimate additional damage not identified upon the estimator s first review.
305 Movement of United Professionals Information Request No RR MoveUP Dated 12 January Insurance Corporation of British Columbia Response Issued 29 January Page 2 of As discussed in the response to information request RR COPE.19.1, ICBC s Express Repair process is similar to many other Direct Repair processes used by insurers in North America. As part of the Express Repair program, all ICBC c.a.r. shop VALET facilities must submit digital images of all claim-related damage to the vehicle. Estimators view the images through the ICBC Claims Document and Imaging System. ICBC follows practices similar to that of the insurance industry. Estimators view the images and base their approval, denial, or modifications on the images provided by the repair facility or by attending the facility in person to view the damage.

306 Movement of United Professionals Information Request No RR MoveUP.21.1 Dated 12 January Page 1 of RR MoveUP.21.1 Reference: EXHIBIT B-9, RR COPE.19.4
307 Movement of United Professionals Information Request No RR MoveUP.21.1 Dated 12 January Page 2 of 2 Please provide the average number of estimates per claim for the years 2010 to the most current date available. Response: As discussed in the response to information request RR COPE.19.4, some claims will not have an estimate (e.g., when there is no damage to a vehicle or when damage to an insured vehicle occurred out of province) and others can have multiple estimates. Original estimates can be created by an ICBC estimator or at a c.a.r. shop VALET facility. In cases of minor damage, the customer may or may not have an original estimate completed, or after having an original estimate completed, may not follow through with the repairs. To respond to this information request, ICBC looked at claims where an estimate was paid. A small proportion of claims have had multiple estimates. Situations where there would be multiple paid estimates on the same vehicle for the same claim include circumstances where different damages are repaired at two facilities (e.g., body damage to the vehicle plus stereo replacement), or circumstances where additional related damages are uncovered after the first estimate is paid. The following table provides the average number of paid estimates per claim by the period in which the repairs were paid. Payment Year Average Number of Estimates per Claim
308 Movement of United Professionals Information Request No RR MoveUP.22.1 Dated 12 January Page 1 of RR MoveUP.22.1 Reference: EXHIBIT B-9, RR COPE.19.7 Please modify the above table to show the number of accredited VALET shops participating in ICBC s direct repair program for each of the years listed as well as the percentage of total effort expended to undertake each type of DIV each of the listed years. Response: The table below includes the number of accredited c.a.r. shop VALET facilities at December 31 of each year. Drop-In Visit Summary YTD 2015 Accredited VALET shops as of Dec 31 Year Category A Category B Adminstrative Guidelines Recognition Total , ,871 7,678 13, , ,730 10,020 15, ,897 9,580 13, , ,655 6,268 11, , ,096 2,016 6, Oct YTD , ,104 Totals 6,791 1,617 18,893 36,216 63,517
309 Movement of United Professionals Information Request No RR MoveUP.22.1 Dated 12 January Page 2 of 2 The increase in accredited c.a.r. shop VALET facilities is not controlled by ICBC as all shops that wish to become accredited can do so by meeting the requirements in the Accreditation Agreement, c.a.r. shop VALET Agreement, and the Express Repair Program Guide. The percentage of total effort expended on each type of DIV completed varies according to the degree of complexity of the estimate being reviewed; as such, it is not possible to assign a percentage of total effort expended. Generally speaking, a Category B DIV would be expected to be more complex than a Category A DIV and therefore require greater effort. In addition, the greatest possible impact to a shop arises out of a Category B DIV. An Administrative Guidelines DIV typically would require less effort than a Category A or Category B DIV, but greater effort than a Recognition DIV. The Recognition category requires the least effort.
310 Movement of United Professionals Information Request No RR MoveUP.22.2 Dated 12 January Page 1 of RR MoveUP.22.2 Reference: EXHIBIT B-9, RR COPE.19.7 Please confirm that now ICBC s stabilization period is over, the number of DIV s will increase again. Response: Not confirmed. As discussed in the responses to information requests RR COPE and RR COPE , ICBC considers that it has entered steady state. As a result, there is no longer a need to focus on reducing the number of DIVs to allow the estimating staff to concentrate on learning and becoming more productive using the new system. However, the total number of DIVs completed is related to the quality of estimates submitted as well as any changes to the Express Repair program that impact the DIVs. As discussed in the response to information request RR COPE.19.7, in 2014, ICBC removed individual estimator targets for DIVs and placed a greater emphasis on the Category A, Category B, and Administrative Guidelines DIVs. This reduces the total number of DIVs and allows estimators to focus on the DIV categories with the greater risk. The response to information request RR COPE.19.7 also discusses refinements made to how repair shops are identified for increased monitoring and refinements to Category B DIVs.
311 Movement of United Professionals Information Request No RR MoveUP.22.3 Dated 12 January Page 1 of RR MoveUP.22.3 Reference: EXHIBIT B-9, RR COPE MoveUP notes that for all reported years a surprisingly high proportion of the Drop In Visits have been designated as Recognition DIVs. Please confirm that going forward a greater proportion (percentage) of the DIV s undertaken will be devoted to addressing Category A, Category B, and Administrative Guidelines concerns instead of DIV s meant to recognize good performance by a c.a.r. shop VALET facility If not, please explain why. Response: As stated in the response to information request RR COPE.19.7, ICBC removed individual estimator targets for completed DIVs and placed a greater emphasis on Category A, Category B, and Administrative Guidelines DIVs. This has resulted in fewer overall DIVs, but with a focus on the DIV categories that have greater risk associated with them. This change was made in 2014 and is reflected by the decrease in the Recognition DIV counts. These are expected to remain low as the focus will be on the other DIV categories, and a greater proportion of the DIVs will be Category A, Category B, and Administrative Guidelines moving forward.

312 Movement of United Professionals Information Request No RR MoveUP Dated 12 January Insurance Corporation of British Columbia Response Issued 29 January Page 1 of RR MoveUP Reference: EXHIBIT B-9, RR COPE Please describe in detail what refinements were made to how a repair shop is identified for increased monitoring Please explain how a reduction of the number of shops being placed under increased monitoring and the reduction in DIV s did not reduce the overall management of the program s risk. Response: ICBC does not believe that the effective management of the Express Repair program s risk is contingent on the number of body shops placed under increased monitoring. The risk is more appropriately managed by having a system that places the right body shops under increased monitoring for the right reasons.
313 Movement of United Professionals Information Request No RR MoveUP Dated 12 January Insurance Corporation of British Columbia Response Issued 29 January Page 2 of 2 ICBC uses a structured and balanced approach that focuses on risk and emphasizes quality DIVs in order to identify shops for increased monitoring. ICBC s multifaceted approach to assessing risk includes, but is not limited to the following items: DIV trending. Key performance indicator trending. Performance review results. Audit results. Customer concerns. Anonymous tips. ICBC staff involvement. The criteria for how a shop is identified for increased monitoring were refined in In addition to having new c.a.r. shop VALET facilities undergo increased monitoring every two months, performance of all shops is reviewed to determine which should undergo increased monitoring. In addition, a random set of 10 to 15 shops is added to the increased monitoring list. Using the risk-based approach has also led to the reduction in the use of Recognition DIVs which were adding little value to the overall review process. ICBC believes that these processes ensure an appropriate level of governance and oversight to manage the Express Repair program s risk. Please see the response to information request RR MoveUP for more information, including links to publicly available documents describing recent changes.
314 Movement of United Professionals Information Request No RR MoveUP Dated 12 January Insurance Corporation of British Columbia Response Issued 29 January Page 1 of RR MoveUP Reference: EXHIBIT B-9, RR COPE Please provide the Industry Feedback relied upon What specific revisions were made to the Express Repair program in response to this feedback? Response: Industry feedback was provided through various ICBC-industry liaison committees, as well as a series of 18 industry engagement sessions held throughout the province in May and June of In addition, similar sessions were conducted with ICBC material damage staff. There were no formal notes or records from these meetings.
315 Movement of United Professionals Information Request No RR MoveUP Dated 12 January Insurance Corporation of British Columbia Response Issued 29 January Page 2 of 2 ICBC believes that the sessions were well received, and feedback is being utilized to improve the Express Repair program. General themes of the feedback from the sessions were: Increase the collaboration/partnership between ICBC and shops. Review DIV categories, with a focus on Category B DIVs and the possible impacts to shops. Look at ways to enhance communication lines for resolving issues. Look at ways to effectively monitor the program without increasing bureaucracy. Difficulties in recruiting and retaining quality staff at the shops. Differences exist in the issues facing shops in the Lower Mainland versus other areas of the province. Information on the changes being made to the Express Repair program is available from the Material damage section of the business partners page of icbc.com, under What s new, News archives as follows: The presentation used at the sessions, listed as 2015 ICBC MD industry info session (July 22, 2015) is available on the Material damage section of the business partners page of icbc.com, under What s new, News archives (i.e., Follow-up on ICBC s industry information sessions o Express Repair Program Improvements o Improvements.pdf

316 Movement of United Professionals Information Request No RR MoveUP.22.8 Dated 12 January Page 1 of RR MoveUP.22.8 Reference: EXHIBIT B-9, RR COPE.19.7 Please confirm when the Express Repair Program Guide will be published. Response: It is expected that the revised Express Repair Program Guide will be published on February 1,.

317 Movement of United Professionals Information Request No RR MoveUP.23.1 Dated 12 January Page 1 of RR MoveUP.23.1 Reference: Exhibit B-9, RR COPE In response to this question, ICBC stated, ICBC does not track the data requested. There is no systematic logging possible to show that an estimator applied specific sections of the Material Damage Procedures Manual when reviewing an estimate. ICBC estimating staff are expected to follow all estimating procedures as well as ICBC s Code of Ethics on every estimate written or reviewed. This is the basic function of an estimator s job, whether the estimator is writing an original estimate or reviewing an estimate created by a c.a.r. shop VALET facility. Please provide the percentage of claims subjected to estimate and repair verification processes for the years 2010 and onward. Response: ICBC understands this question to refer to the percentage of estimates that undergo some level of estimate and repair verification, which could range from an in-person inspection to a virtual inspection or a systematic review of the estimate and related damage. As indicated in the response to information request RR COPE.19.9, filed in the response to information request RR COPE , ICBC estimating staff are expected to follow all estimating procedures on every estimate written or reviewed. As such, 100% of estimates go through some level of estimate and repair verification scrutiny. This is normally driven by the risk and complexity of the estimate, increased monitoring, or shop audits. This has been a cornerstone of ICBC s Express Repair program since being implemented in 2002.
318 Richard Landale Information Request No RR RL.201.a Dated 07 January Page 1 of RR RL.201.a Reference: ICBC's response to the information request RR RL.1.1 In reading this response I noticed ICBC added a few items to change the table. Which is all fine. But what occurred to me as a result ICBC used this phrasing, quote: that only the presentation of the statement of comprehensive income which leads me to wonder why Optional Revenue and Expenses were not referenced. And this albeit outside the BCUC jurisdiction is an incomplete answer, because the table is not a Comprehensive accounting. Are we to assume Optional Insurance business is not covered by IFRS rules, and that the Allocation Tables need not be accounted to the BCUC and these hearings? Also ICBC expanded the table to differentiate between Non-insurance other income, Noninsurance expenses, but not Non-insurance other expenses, WHY? Please add this information. And ICBC added the DPAC adjustments under expenses at no cost, which is a red flag to this intervener. Essentially although ICBC refers to a detailed response to RR BCOAPO.24.3 for an explanation of the reclassifications There is no reference to DPAC adjustments in that response, or anywhere else in ICBCs IR responses. WHY? Why did ICBC need to add DPAC adjustments to the expenses in this table. There must be a reason to explain the original omission, and will ICBC please confirm, or explain the reasons for DPAC adjustments not being impacted by following IFRS rules. Response: In information request RR RL.1.1, Mr. Landale incorrectly added together the expense and revenue items used to illustrate the reclassification impact on performance measures. As
319 Richard Landale Information Request No RR RL.201.a Dated 07 January Page 2 of 2 indicated in the response to information request RR RL.1.1, the revenue and expense reclassification did not impact Basic net income or the rate indication. In the Application, Chapter 5, Figure 5.4 was provided to illustrate the impact of the reclassification of the Basic insurance expenses and premiums earned on the Basic financial performance measures (i.e., Loss Ratio, Insurance Expense Ratio, and Non-insurance Expense Ratio). Figure 5.4 was not intended to reflect all of the Basic insurance revenue and expense items that were reclassified to remain compliant with International Financial Reporting Standards (IFRS). For example, reclassifications to Non-insurance other income or Service fees and other did not impact the calculation of the performance measures and, therefore, were not listed in Figure 5.4. In the response to information request RR RL.1.1, ICBC intentionally expanded upon the line items originally presented in Figure 5.4 to show that the impact of the revenue and expense reclassification to the 2014 Basic net income is nil. This was the reason that the line item Deferred premium acquisition costs (DPAC) adjustments was presented, even though 2014 actual and 2014 actual (restated) values were exactly the same. While Optional insurance is not regulated by the Commission, and therefore, beyond the scope of this proceeding, ICBC can advise that all of its revenues and expenses, whether they pertain to Basic insurance or Optional insurance, are accounted for in accordance with IFRS.
320 Richard Landale Information Request No RR RL.201.b Dated 07 January Page 1 of RR RL.201.b Reference: ICBC's response to the information request RR RL.1.1 What provisions (such as data, confidential filings, methodology, recalculation formulas) does ICBC provide to the BCUC in order for the BCUC to validate ANY OF ICBCs IFRS reclassification calculations, as in part, represented by the table in the above IR. Response: As discussed in the Application, Chapter 9, Appendix 9 A, ICBC functions within an established accountability framework that involves both external and internal reviews and reporting. In addition, ICBC has numerous controls in place to maintain confidence in the reliability and sufficiency of the data used for actuarial valuation and ratemaking analyses, as discussed in the Application, Chapter 2, Exhibit C.0.5, Section I. In the Application, Chapter 2, ICBC explained that the revenue and expense reclassification has an unfavourable impact on operating expenses but an equivalent favourable impact on revenue components that affect the Basic insurance rate change. The outcome is a one-time increase to both the Operating Expense and Other Revenue rate components, which for the purpose of the actuarial analysis, resulted in no net impact to the overall rate change. Please refer to the Application, Chapter 2, Figures 2.2 and 2.13, which illustrate the nil impact of the reclassification on the policy year 2015 rate indication. In the Application, Chapter 4, the unfavourable impact of the reclassification on operating expenses is explained. Even though the outcome of the reclassification has no impact on Basic net income or the rate indication, corporate operating expenses appear to have increased significantly between 2014 actual and 2014 actual (restated). For example, certain revenue components that are in the 2014 actual expenses before restatement are now excluded from the 2014 actual restated expenses. It is important to note that Chapter 4 explains only the expense side of the reclassification impact. In the Application, Chapter 5, the reclassification impact is discussed as it pertains to ICBC s financial performance measures. The one-time increase in Basic operating expenses between 2014 actual and 2014 actual (restated) is presented together with the one-time increase in Basic premiums earned. Figure 5.4 illustrates the impact of the reclassification on the Basic financial
321 Richard Landale Information Request No RR RL.201.b Dated 07 January Page 2 of 2 performance measures (i.e., Loss Ratio, Insurance Expense Ratio, and Non-insurance Expense Ratio). The response to information request RR RL.2.1 provided detailed information to support the calculation of those Basic financial performance measures. The revenue and expense reclassification had no impact on the overall Basic insurance rate change. ICBC has held controllable operating expenses, which are corporate operating expenses excluding pension and post-retirement benefit expense, flat to the 2014 budget set out in ICBC s 2014 Service Plan. The increase in operating expenses between 2014 actual and 2014 actual (restated) is fully explainable as it reflects only the unfavourable impact of the reclassification. As shown in the response to information request RR RL.1.1, the 2014 Basic net income did not change the total increase in expense line items is fully offset by the corresponding total increase in revenue line items. ICBC respectfully submits that there is sufficient information on the record regarding the IFRS revenue and expense reclassification.
322 Richard Landale Information Request No RR RL.202 Dated 07 January Page 1 of RR RL.202 Reference: ICBC's response to the information request RR RL.1.2 After ICBC has recalculated the Incomes and Expenses in accordance with the 2015 IFRS rules, how did Premiums, Claims 1% fluctuations translate into $$$$ millions, as represented in this missing table? If there is no reclassification impact, then will ICBC please update the Forecast Risks and Sensitivities using the same table layout as shown below. Response: Mr. Landale s table is an excerpt from ICBC s 2014 Service Plan, which is available on As is the case for all of ICBC s corporate information, the presentation includes the Basic insurance, Non-insurance, and Optional insurance lines of business. In the multi-year forecast section of the 2014 Service Plan, ICBC discussed key forecast assumptions and included a sensitivity analysis showing the potential impact of a 1% change on ICBC s corporate results for that particular forecast period. The key factors considered in the sensitivity analysis included those related to premiums, claims, investments, and market share. For example, for the 2014 forecast period, a 1% change in premiums, on a base ranging from $3.9 billion (2013 outlook) to $4.4 billion ( forecast), results in a potential impact of $39 to $44 million in net premiums. The revenue and expense reclassification did not impact the majority of key factors considered in ICBC s sensitivity analysis. There was no change to claims costs, unpaid claims balance, rate used to discount claims, investment return, investment balance, or market share.
323 Richard Landale Information Request No RR RL.202 Dated 07 January Page 2 of 2 The revenue and expense reclassification did impact premiums earned. However, as shown in the table below, the increase in 2014 forecast premiums earned did not impact ICBC s sensitivity analysis. In other words, in spite of the reclassification, premiums earned are still within the $39 to $44 million range. Change in 2014 Forecast Premiums Earned Due to Reclassification $ millions Premiums Earned Impact of 1% Change ICBC s Service Plan for the 2014 forecast period: 2014 Forecast ICBC s Service Plan for the forecast period: 2014 Forecast Restated* $ 4,104 $ 41 $ 4,159 $ 42 Difference: Higher (Lower) $ 55 $ 1 * Note 2 from page 14 of ICBC s Service Plan: To conform with IFRS presentation for the financial statements in 2015 and beyond, miscellaneous revenues and recoveries previously netted in operating costs and costs previously netted in revenues have been reclassified to the appropriate revenue and expense categories respectively. The reclassification has no impact on net income. On a comparative basis, controllable operating costs are being maintained at the same level for the 2013 (plan) to 2017 period. For comparative purposes, the 2014 forecast has also been restated. ICBC confirms that the revenue and expense reclassification did not impact 2014 net income the total increase in expense line items is fully offset by the corresponding total increase in revenue line items. Furthermore, as indicated in the response to information request RR RL.1.1, the reclassification did not impact Basic net income or the 2015 rate indication.
324 Richard Landale Information Request No RR RL.203.A-D Dated 07 January Page 1 of RR RL.203.A-D Reference: ICBC's response to the information request RR RL.3.a and RR RL.3.b Thank you again ICBC for a 50% response, and a great table update. But the remaining 50% response needs attention. ICBC provided in part the following response to my RTL 2015 RRA 003, quote: the forecasted transfer from Optional insurance to the provincial government for 2015 and is not relevant to this Application as it pertains to Optional insurance, which is not under the Commission s jurisdiction. A). Will ICBC please provide from 2010 to November 2015 all the OIC s and Letters of Direction issued by the BC Government that correspond with the Capital transfers shown in Exhibit RTL-MCT001. B). Will ICBC please confirm the BC Governments direction to transfer $160 million each year through to 2018 from Excess Optional Insurance business to the BC Treasury. (reference ICBC 2015/ /18 Service Plan page 13). ICBC you wasted my time with your response by referring me to (this is your active link, so click on it yourself to see what I mean) not one listing addresses the transfer of $160 million annually, and in regard to the Letters and OIU s, or even any MOU, I could not find any correlation to the $160 million. C). Will ICBC please provide the requested listing asked, with their appropriate links. D). Will ICBC please provide all Memorandum of Understanding (MOU) between ICBC, the Ministry of Transportation, the Ministry of Finance / Treasury that direct ICBC to transfer Capital to Basic Insurance, to the BC Treasury, to whomever. Or is ICBC hiding information imbedded within the Insurance Corporation Act Section 26, please next page, page 5. (please consider by example 2015 RRA Appendix 8D MOU). Response: 203.A There were two capital transfers from Optional insurance to Basic insurance from 2010 to November 2015 as directed by Orders in Council (OIC): 1) Please see Attachment A Government Directive of December 13, 2012 with respect to Optional Excess Capital Transfer approved by Order in Council 082/13, February 19, 2013 (also available at ICBC.pdf).
325 Richard Landale Information Request No RR RL.203.A-D Dated 07 January Page 2 of 2 2) Please see Attachment B Government Directive of February 17, 2014 with respect to the Excess Capital Transfer and Annual Basic Rate Filing Date approved by Order in Council 055/14, February 18, 2014 (also available at OptionalCapitalTransfer-AnnualBasicRateFilingDate.pdf). There will also be a transfer between Optional insurance and Basic insurance in January. Please see the Application, Appendix 9 A, Attachment 9 A1, for the Government Directive of September 23, 2015 with respect to an Optional Capital Transfer approved by Order in Council 596/15, October 14, B Transfers of excess Optional capital to the provincial government are not relevant to this Basic insurance Revenue Requirements Application as they pertain to ICBC s Optional insurance business, which is not regulated by the Commission. 203.C Please see the response to information request RR RL.203.A above. 203.D ICBC transfers excess Optional capital to the provincial government in accordance with section 26 of the Insurance Corporation Act and as directed via OIC. As discussed in the response to information request RR RL.3.b, these transfers pertain to ICBC s Optional insurance business and, therefore, do not fall under the jurisdiction of the Commission and are not relevant to this Basic insurance Revenue Requirements Application. For transfers from Optional insurance to Basic insurance, please see the response to information request RR RL.203.A above.
326 ICBC s Information Request Response RR RL.203.A-D Attachment A Government Directive of December 13, 2012 with respect to Optional Excess Capital Transfer approved by Order in Council 082/13, February 19, 2013 Insurance Corporation of British Columbia January 29,
327 PROVINCE OF BRITISH COLUMBIA ORDER OF THE LIEUTENANT GOVERNOR IN COUNCIL Order In Council No. 082, Approved end Ordered FEB Executive Council Chambers, Victoria On the recommendation of the undersigned, the Lieutenant Governor, by and with the advice and consent of the Executive Council, orders that approval is given to the directive issued by the Minister of Transportation and Infrastructure to the corporation dated December 13,2012. Presiding Member of the Executive CouncJ7 (Th,fs prltl is for adnflilfs/m/lve pllrpose~ only and is 1f{J/ pari of (he Order,) Authority under which Order Is mude: Act and section: Insurance Corporarlon Act. RS,B,C, 1996, c, 228, s, ~--~ Other: B.C. Reg. 307/2004, s. 3(4) December 28, 2012 page I of I RESUB/O/II n7
328 T DEC Paul Taylor, Chair Board of Directors Insurance Corporation of British Columbia Executive Office Room 517, 151 West Esplanade North Vancouver BC V7M 3H9 Reference: Dear Chair Taylor: Re: Excess Optional Capital Transfer I am writing to inform you that Treasury Board has approved the Insurance Corporation of British Columbia's (ICBC's) request to transfer the total 2012 excess capital from the optional insurance capital account to the basic insurance capital account. This balance would otherwise have been paid to the Consolidated Revenue Fund prior to July 1,2013. ICBC is hereby directed to transfer the excess optional automobile insurance capital, as reported in ICBC's audited financial statements as at December 31, 2012, to its universal compulsory automobile insurance business in order to cause the capital available for the universal compulsory automobile insurance business to be equal to or above 100 per cent of Minimum Capital Test as of December 31,2012. This letter of direction is a government directive within the meaning of that term as it may be defined in Special Direction Ie2 to the British Columbia Utilities Commission (B.C. Reg. 307/2004). Sincerely, tviary Polak Minister Copy to: Honourable Michael de Jong Minister of Finance MLA, Abbotsford West Ministry of Transportation and Infrastructure Office of the l\finister Mailing Address: Parliament Buildings Victoria Be V8V lx4
329 ICBC s Information Request Response RR RL.203.A-D Attachment B Government Directive of February 17, 2014 with respect to the Excess Capital Transfer and Annual Basic Rate Filing Date approved by Order in Council 055/14, February 18, 2014 Insurance Corporation of British Columbia January 29,
330 PROVINCE OF BRITISH COLUMBIA ORDER OF THE LIEUTENANT GOVERNOR IN COUNCIL Order in Council No ' Approved and Ordered February 18' Executive Council Chambel's, Victoria ~-;: ~ Administrator Administrator. On the recommendation of the undersigned, t!l'' I ie111 '"''to,,: 1 :1, by and with the advice and consent of the Executive Council, orders that approval is given to the directive issued by the Minister of Transporiation and lnfrastruoture to the corporation dated February 17,2014. Minister of Transporlalion and lnfrasfnicture Presiding Member of the Executive Council Anlhority under whkh Orde~ is made: (7111s pari isjoradmfllislmlil'e pwposes anly nnd is nat fx/11 of the Order) Act <tnd section: Insurance Corporation Act, R.S.B.C. 1996, c. 228, s. 47 Other: B.C. Reg. 307/2004, s. 3 (4) Fehmary 17, page I of 1
331 February 17,2014 Mark Blucher, President and CEO Insurance Corporation of British Columbia 151 West Esplanade, Room 517 North Vancouver BC V7M 3H9 Reference: Dear Mark Blucher: Re: Excess Optional Capital Transfer and Annual Basic Rate Filing Date I am writing to inform you that Treasury Board has approved the Insurance Corporation of Br:i6sh Columbia's (lcbc's) request to transfer any and all remaining of2013 excess from the optional automobile insurance ("Optional") capital account (above the amount in the Revised Service Plan) to universal compulsory vehicle insurance ("Basic") capital account. The excess Optional capital amount in the Revised Service Plan is to be transferred to the Consolidated Revenue fund prior to July 1, 2014 as planned. The 2013 excess Optional capital transferted to the Basic capital account will be calculated based on the amount that is reported in ICBC's audited financial statements as at December 31, As soon as the audited amount is known, ICBC shall provide this information to Jacquie Dawes, Assistant Deputy Minister, Partnerships Department, Ministry of Transportation and Infrastructure. Treasury Board also directed ICBC to change its annual Commission filing deadline from May to August (for 2014 going forward) to ensure that no consumer is faced with two rate changes in the November 2013 to November 2014 period..../2 Ministry of Transportation and Infrastructure Office of the Mlnisrer i'vlailing },ddress: Parliament Buildings Victori<J BC V8V 1X4
332 -2- This letter of direction is a government directive within the meaning of that tem1 as it may be defined in Special Direction IC2 to the British Columbia Utilities Commission (B.C. Reg. 307/2004). Sincerely, Todd G. Stone Minister Copy to: Honourable Michael de Jong Minister of Finance MLA, Abbotsford West
333 Richard Landale Information Request No RR RL.203.E Dated 07 January Page 1 of RR RL.203.E Reference: ICBC's response to the information request RR RL.3.a...In reference to my table Exhibit RTL-MCT001, ICBC provided an updated table titled IFRS using abbreviations such as n/a, n/app, f/d, o/s. My favourites are, n/a, and n/app. ICBC has no business to say this information is not available, and not applicable, you re running a business ICBC, and you re supposed to keep records, including Basic yearend MCT levels for 2010, 2011, 2014, the missing data years. Will ICBC please make every effort to obtain the missing information referred to above, by re-submitting the corrected and updated IFRS table. Response: The table provided in the response to information request RR RL.3.a is complete. Please see below for clarification on the abbreviations used: n/a This information is not available as the table provides information using International Financial Reporting Standards (IFRS). The calculation for Q Basic Minimum Capital Test (MCT) was not prepared using IFRS. The Q Basic MCT, prepared under Canadian Generally Accepted Accounting Principles, was 156.4%. n/app This information is not applicable as there was no transfer between Optional insurance and Basic insurance for these years. The Actual Basic MCT at YE Final and Actual Basic MCT at YE Before transfer refer to the MCT percentage before and after the transfer of funds from Optional insurance to Basic insurance (row 1 of the table). As years 2010, 2011, and 2014 did not have this transfer, Actual Basic MCT at YE Before transfer is not applicable, as it is the same as Actual Basic MCT at YE Final.
334 Richard Landale Information Request No RR RL.203.F Dated 07 January Page 1 of RR RL.203.F Reference: Section 26; extracted from the Insurance Corporation Act It would be most constructive of ICBC to provide their interpretation of this Section 26, especially sub clauses (2), (3), (4) as these apply to all the various Optional Capital transfers to the BC Treasury since 2010 to inclusive. My interest is connecting these clauses to any OIUs, or MOUs, or any other s, letters that direct ICBC on matters of Capital Transfers. Response: Section 26 of the Insurance Corporation Act applies to Optional insurance capital transfers to the provincial government, and is not the legislative authority for transferring Optional insurance capital to Basic insurance. As this section pertains to Optional insurance only, it is not relevant to a Basic insurance revenue requirements application. The OICs for the transfer of Optional insurance capital to Basic insurance are made under the authority of section 47 of the Insurance Corporation Act. Please see the response to information request RR RL.203.A, filed in the response to information request RR RL.203.A-D, for the OICs that directed ICBC to transfer capital from Optional insurance to Basic insurance in 2012, 2013, and January.
335 Richard Landale Information Request No RR RL.204.A Dated 07 January Page 1 of RR RL.204.A Reference: ICBC's response to the information request RR RL.4.a-b and RR RL.4.c...will ICBC please confirm or correct this assumption, given the response ICBC submitted. If $155 million of Basic Capital is to be consumed in PY2015 (meaning 1 st November 2015 to 31 st. October ), along with the following transfer of $450 million in January, will also be used to cover Basic Capital underwriting costs for the same period, then the assumption is; ICBC is claiming 5.8% (rate exclusion removed from the Indicated Rate Change of 11.2%) equates to the combination of $155 + $450 = $605 million, which ICBC estimates their Basic Capital underwriting costs for PY2015 will be, to avoid the MCT falling to, or, below the regulatory 100% MCT level? Or: By employing $605 million for Basic Insurance underwriting cost purposes, ICBC estimates the MCT will return from 108% (estimated Year End 2015) back up to or remain at 145% MCT throughout the remaining PY2015 to 31 st. October. Response: Neither of the assumptions stated in this information request are correct. The transfer of $450 million in January is actual capital dollars, which will immediately increase the level of Basic capital so that the Basic MCT ratio increases by about 36 percentage points, as indicated in the Application, Chapter 3, paragraph 11. The erosion of $155 million of Basic capital during the 2015 policy year is ICBC s estimate of the impact on the Basic capital level of the rate exclusion of 5.8 percentage points, reducing the Basic MCT ratio by about 12 percentage points over the course of the 2015 policy year. ICBC is not collecting sufficient revenue (or premiums) to cover the costs and the deficiency must be drawn from Basic capital.
336 Richard Landale Information Request No RR RL.204.B Dated 07 January Page 1 of RR RL.204.B Reference: ICBC's response to the information request RR RL.4.a-b and RR RL.4.c Will ICBC please discuss their projected monthly or quarterly fiscal management of $605 million over the PY2015, i.e.; $605million / 12months = $ million underwriting cost per month. Perhaps a graduated diminishing spreadsheet with graph will explain ICBC fiscal plan for these monies. I know I will appreciate a graph. Response: Please see the response to information request RR RL.204.A, which explains the error in the assumption that ICBC is managing $605 million as indicated in this information request. Also, please see the response to the same information request where it is explained that Basic capital will be eroded during the 2015 policy year (which, as explained in the Application, Chapter 2, Exhibit D.0, paragraph 1, spans the period from November 1, 2015 to October 30, 2017) because ICBC is not collecting sufficient revenue to cover its costs due to the rate exclusion of 5.8 percentage points. The impact is likely to be more apparent in the financial statements as the 2015 policy year falls mostly within the calendar year.
337 Richard Landale Information Request No RR RL.204.C Dated 07 January Page 1 of RR RL.204.C Reference: ICBC's response to the information request RR RL.4.a-b and RR RL.4.c ICBC did not answer these questions, and I would also like a response, please. Does this mean following the BC Governments directive to transfer $450 million in January Optional to Basic, that there will be no further erosion of Basic Capital to cover costs for PY2015 (November 2015 to October )? Response: No, the $450 million transfer of Optional capital dollars to Basic insurance does not prevent the erosion of Basic capital, which arises due to the fact that revenue is not sufficient to cover costs as a result of the 5.8 percentage point rate exclusion. As indicated in the response to information request RR RL.4.a-b, the $450 million transfer is used to boost the Basic capital to ensure that ICBC has enough capital to cover costs, and ensure that the MCT level does not fall below the regulatory minimum of 100%.
338 Richard Landale Information Request No RR RL.204.D Dated 07 January Page 1 of RR RL.204.D Reference: ICBC's response to the information request RR RL.4.d...I believe it has been more than adequately established in this current hearing process that if questions arise while in connection with Basic Insurance that pertain to Optional Insurance while contributing to a greater understanding of ICBC operations overall, then the Commission Panel and Interveners can seek answers from ICBC. This is yet another occasion. Will ICBC please explain, while noting the BCUC has no influence on ICBCs Optional insurance business, it is important for understanding the balance between ICBCs Basic and Optional insurance business lines the potential negative (if any) influence of transferring $450 million to Basic Insurance on ICBC Optional capital reserves while still observing OSFI guidelines, and IFR Standards for the Optional Insurance business. Response: The scope of the does not include an explanation of the balance between ICBC s Basic and Optional insurance businesses, or the influence on the Optional insurance business of transferring $450 million to the Basic insurance business. The purpose of the is to provide evidence in support of ICBC s application to change Basic insurance rates, including the influence of the transfer on the Basic insurance rate indication.
339 Richard Landale Information Request No RR RL.205.A-D Dated 07 January Page 1 of RR RL.205.A-D Reference: ICBC's response to the information request RR RL.5.e and RR RL.5.f-g...I spent a lot of time trying to tabulate ICBCs responses, numbers / references into one table, because to my way of thinking, or processing ICBC response data, all the numbers are related to consuming $155 million (Basic Capital), $363 million [Adverse Events (130% MCT) under 2013 OSFI guideline], $450 million (Optional Capital transfer), $627.9 million (Adverse Deviation), $1.209 billion (Minimum Capital required per the 2013 OSFI guideline) macerated somehow (without hard evidence) to the current 2015 OSFI guideline, 100% MCT, 130% MCT, 145% MCT, and the CRC trigger to return to 150% MCT... E). The following response compounds / created my lack of understanding, quote: In summary, both the $363 million and the $450 million refer to capital dollars; however, one is used for capital adequacy purposes and the other is a transfer to increase the capital for Basic insurance.... A). So will ICBC please reproduce a similar table matrix (IFRS) for this IR, that they produced for my IR, RTL 2015 RRA 003, which again was a great table. B). Or put another way:- ICBCs responses to (f) and (g) are most perplexity, as they appear to fly in the face of reason for the $450 million transfer. The reason given is to cover Basic Insurance underwriting costs for PY2015. Is ICBC saying $627.9 million to cover adverse deviation (equity I think) is on top of the already $605 million ($155m Basic Capital + $450m Optional Capital transfer) to cover Basic Insurance underwriting costs, because ICBC has been ADDING to account for claims discounting equity, in order to maintain the MCT at144% for PY2015? C). Lastly, Is there something wrong with the IR, RR RL.5 (g) I specifically referred to ICBC references, and ICBC specifically ignored them. Exhibit G.1 is the only place in the RRA that mentions Adverse Deviation what is it, why is it so important, what impact does it have on the MCT, what impact does it have on the Indicated Rate Change, somewhere along the line Adverse Deviation - $627.9 million means something REAL and TANGIBLE and while it apparently relates to Full Value Basic Equity Since, para 88, 89, and 90 do not address the issue. ICBC s response explanation is most disconcerting while hiding behind Internal discounting analysis, (see Exhibit G.1 footnote f & g) a $627.9 million lack of transparency veil. I ll tell you what this IR question means to me, $155 + $450 + $627.9 millions / 3.4 million policies = $ per policy, virtually half of ICBCs estimated typical Basic Insurance Premium for this year. By the way, in my heart I know this is not true, but it is a measure of the dollars ICBC bandies about without fullness and explanation D). Can t you guys layout these deviations, pluses, minuses, ratios, estimates, adjustments, whatever in a table that makes some sense to everyday BC Basic Insurance Policyholders, and Seniors like myself? Exhibit G.1 footnotes do not do it.
340 Richard Landale Information Request No RR RL.205.A-D Dated 07 January Page 2 of 3 Response: As provided in the response to information request RR BCOAPO , the provision for adverse deviation (PfAD) reflects the degree of uncertainty of a best estimate assumption. It is a provision put in place for financial statement purposes to reflect the amount of uncertainty in the claims liability estimate. Please note that the claims costs used to calculate the rate indication do not include a PfAD. The only instance where the PfAD is used in the Application is in the calculation of the Investment Income on Basic Equity in Chapter 2, Exhibit G.1, row (l). This calculation is based on the Adjusted Basic Equity, which is Basic Equity excluding the impact of discounting and the PfAD to ensure that policyholders receive the full benefit of ICBC s expected return on investments. The Adjusted Basic Equity is higher than the Basic Equity, which means that the investment income is higher, benefitting Basic insurance policyholders. In addition, the actual amount of the PfAD has no impact on the rate indication because the Basic Equity provided in the Application, Chapter 2, Exhibit G.1, row (e) included a PfAD and the adjustment simply removes it. ICBC has created a table to further aid in the explanation of the various capital amounts listed in this information request and the timing of when such events occur. Basic Equity (used for MCT purposes) (1) Basic Equity at December 31, 2015 (before transfer) 1,331,580 (2) Capital Transfer from Optional 450,000 (3) Basic Equity at December 31, 2015 (after transfer) 1,781,580 Adjusted Equity (used to calculate the investment income on Basic equity in rate indication) (4) Removal of Amount of Discount (436,194) Removal of Provision for Adverse (5) Deviation (6) Adjusted Equity as of December 31, 2015 (7) Capital Depleted over PY 2015 from 5.8 ppts of Rate Exclusion (155,037) 627,890 1,973,276 Source From Exhibit G.1, row (e) From Exhibit G.1, row (f) From Exhibit G.1, row (g) From Exhibit G.1, row (i)
341 Richard Landale Information Request No RR RL.205.A-D Dated 07 January Page 3 of 3 Row (3) = Rows (1) + (2); used in the calculation of Basic MCT as at December 31, 2015 (see the Application, Chapter 3, Appendix 3 B). Rows (4) and (5) are discussed in the response to information request RR RL.5.f-g. These are the amounts that are removed from the Basic Equity to calculate the full value of Basic Equity. Put simply, one cannot earn investment income on a number that includes a margin for risk and discount. ICBC removes these items so the investment return for policyholders is based on a full value amount. Row (6) = Rows (3) + (4) + (5). This is called the Adjusted Equity and is used to calculate the investment income on Basic Equity for rate indication purposes only (see the Application, Chapter 2, Exhibit G.1, row (i)). Note that this adjusted equity is greater than the Basic Equity (row 3) before adjustments, meaning that it results in a greater investment income and therefore a more favourable investment income offset component of rates. This number is not used to calculate MCT. Row (7) is the amount of capital that will be depleted during the policy year (PY) 2015 due to the exclusion of 5.8 percentage points of rate change for the 2015 rate indication. This will impact MCT over the 2015 PY. The calculation of the $155 million is as follows: 5.8% (note this is rounded from 5.77%) x $2,685,611 (Projected PY 2015 Premium at Current Rate Level as shown in the Application, Chapter 2, Exhibit A.0.0, col (a)) = $155 million.
342 Richard Landale Information Request No RR RL.206 Dated 07 January Page 1 of RR RL.206 Reference: ICBC's response to the information request RR RL.6...Why on earth did your reply to this IR by referring me to BCUC ? Here s my thinking, if Special Direction IC2 is the Provincial Governments law of the land, in other words the highest ranking / ruling document for ICBC, then when it says follow the Insurance Companies Act, Subsection 515(1) and subsection 515(2) the Superintendent may make guidelines respecting the maintenance by companies and societies of adequate capital and adequate and appropriate forms of liquidity. Along with and: "MCT guideline" means the Guideline for Minimum Capital Test (MCT) for Federally Regulated Property and Casualty Insurance Companies issued by the Office of the Superintendent of Financial Institutions Canada as that guideline is amended or replaced from time to time. Why don t you? Just answer my IR as asked, please... Will ICBC please discuss their provisions / interpretation to comply with the OSFI supervisory target capital ratio of 150% in the context to approved BCUC MCT levels of 100, 130, 145, 160% Please also include in the discussion the integration of adverse events (130%), rate smoothing and predictability (15%) as in compliance with the BCUC prior decisions and Special Direction IC2. Response: The information request refers to the Insurance Companies Act, subsections 515(1) and 515(2). ICBC was created under British Columbia s Insurance Corporation Act. The Insurance Corporation Act sets out the Commission s jurisdiction to regulate Basic insurance rates, and Basic insurance rates are set in accordance with Special Direction IC2, which is a regulation under that Act. Although certain provisions of the Insurance Companies Act apply to ICBC, the subsections of the Insurance Companies Act quoted in the information request are not applicable to ICBC. According to Special Direction IC2, the MCT ratio, which ICBC determines on a quarterly basis, is the MCT as that term is described in the MCT guideline. The definition of MCT guideline provided in the information request is excerpted from Special Direction IC2. It is defined as the Guideline for MCT for Federally Regulated Property and Casualty Insurance Companies issued by the Office of the Superintendent of Financial Institutions (OSFI). In other words, ICBC is not regulated by OSFI, and the only reason a provision from the OSFI guideline applies to ICBC is
343 Richard Landale Information Request No RR RL.206 Dated 07 January Page 2 of 2 because provincial legislation expressly incorporates that particular component by reference. The calculation of the MCT ratio according to the OSFI guideline is provided in the Application, Chapter 3, Appendix 3 B. The OSFI guideline does not apply to ICBC for all purposes; rather, it applies only to the extent that provincial legislation indicates. That purpose is very limited; i.e., it is only incorporating the way in which MCT should be calculated. It is not using the OSFI guideline to set the targets themselves. ICBC, therefore, does not determine the capital management target for its Basic insurance business according to the OSFI guideline. The capital management target, as defined in Special Direction IC2, is part of the Basic insurance Capital Management Plan approved by the Commission. The Commission has approved a capital management target of 145% MCT, which is the sum of the regulatory minimum 100% MCT, the margin for adverse events, and the margin for rate smoothing as specified in Special Direction IC2. The Commission has also approved a risk management target (the sum of the regulatory minimum 100% MCT and the margin for adverse events) of 130% MCT. The threshold for paying a Customer Renewal Credit is 160% MCT. The 2015 OSFI MCT Guideline requires federally regulated insurers (not ICBC) to maintain an MCT ratio of 100% at a minimum. OSFI has also established for the insurers it regulates (not ICBC) an industry-wide supervisory target capital ratio of 150% that provides a cushion above the minimum requirement and facilitates OSFI s early intervention process. OSFI also expects each P&C [property and casualty] insurer [that it regulates (not ICBC)] to establish an internal target capital ratio and maintain on-going capital, above this target. Although there are similarities between the OSFI capital targets applicable to federally-regulated insurers (not ICBC) and the capital management target for ICBC s Basic insurance business, ICBC must comply with the legislative framework specified in Special Direction IC2 and the Basic insurance Capital Management Plan approved by the Commission.
344 Richard Landale Information Request No RR RL.207 Dated 07 January Page 1 of RR RL.207 Reference: ICBC's response to the information request RR RL.7...Whether ICBC files a Key Metric Report or not is really not the issue. The issue is tracking the MCT annually. From what I have gathered since 2011, ICBC will only report back to the BCUC if ICBC feels it necessary because the MCT is about to fall below the 100% MCT minimum level. So how does ICBC do that?, what Key Metric Report, or any other named report does that? Or, does ICBC only report back during a Revenue Requirement Application. I know that is not true, ICBC has a commitment to report to the BC Treasury as well. Response: ICBC believes that the information provided in the response to information request RR RL.7 addressed the information request. In information request RR RL.7, Mr. Landale stated, OSFI guidelines requires P&C insurers to file annually (if not before) a Key Metric Report, and then asked, Will ICBC please file with the BCUC and interveners a copy of their 2013 and 2014 and any 2015 filings of this Key Metric Report in support of their current application. In its response to RR RL.7, ICBC explained, The Key Metric Report is a report that is required to be filed with the Office of the Superintendent of Financial Institutions (OSFI) for those property and casualty insurance companies that are federally regulated by OSFI. As ICBC is not regulated by OSFI, ICBC does not produce, nor file with OSFI the Key Metric Report requested in this information request. ICBC provided further explanation that, As discussed in the response to RR BCUC , the Minimum Capital Test Guideline for Federally Regulated Property and Casualty Insurance Companies issued by OSFI applies to ICBC only to the extent that it is incorporated by reference in provincial legislation. Further explanation is provided in the response to information request RR RL.206. This information request (i.e., RR RL.207) now asks about ICBC s requirements to report to the Commission with respect to the Minimum Capital Test (MCT). As discussed in
345 Richard Landale Information Request No RR RL.207 Dated 07 January Page 2 of 2 past proceedings, ICBC reports to the Commission as required and in accordance with Commission directives. ICBC advises the Commission of the MCT ratio on a quarterly basis. Further, there is a substantial amount of information regarding capital and the MCT ratio in each revenue requirements application. For example, the, in particular Chapter 3, Appendices 3 A and 3 B, includes the information necessary for understanding the Outlook MCT ratio for determining the rate indication.
346 Richard Landale Information Request No RR RL.208 Dated 07 January Page 1 of RR RL.208 Reference: ICBC's response to the information request RR RL.8...This is ICBC s response in part; The Statement of Operations for the third quarter of 2015 is available at: about-icbc/company-info/pages/default.aspx. This is a useless link which happens not to function as a hyperlink.. hmmmm? Instead a pop-up error screen message appears as follows: Unable to open about-icbc/company-info/pages/default.aspx. The Internet site reports that the item you requested could not be found. (HTTP/ ). The following is the correct link, but for only the Third Quarter statement: And this one does work! as it did on January 7 th when I last checked. Also, why answer my IR without providing the requested information, as I mentioned above, I had to receive the information in an , and not on the record. I would like to know though, why does ICBC not retain on their website ALL previous monthly Statement of Operations reports, as is the case for annual reports and other financial report filings, even historically government reporting s? Response: Firstly, ICBC apologizes for providing a hyperlink that did not work. When the URL was copied, an extra space was inadvertently added. For the record, the current Statement of Operations is available from the About ICBC section of icbc.com, under Company information. The quarterly Statement of Operations provides an overview of ICBC s financial information. It is current to the end of the quarter. As each quarter ends, updated information is reported. The Annual Report provides the final reporting for the year. Since the objective of the Statement of Operations is a point in time update, only the most current information is posted online. Other financial reporting, such as the Annual Report, provides the full financial picture for the year and historical record.
347 Richard Landale Information Request No RR RL.209.A-E Dated 07 January Page 1 of RR RL.209.A-E Reference: ICBC's response to the information request RR RL.9...I have spent a considerable amount of research time on Environment Canada s website resulting from this ICBC response... There are very good reasons for these requests, least of which my research suggests there are some 23 more BC Weather Stations with 30 year data histories available. As some of these 23 stations geographical locations are not necessarily comparable to the 10 Airport (flat ground) weathers stations ICBC selected, considering very few accidents happen within any Airport boundaries, but rather on highways between Kamloops, Quesnel, Prince George, Ft. St. John and Ft Nelson across the Rocky Mountains. Also Hope to Kelowna on the Coquihalla Hwy, and the Crowsnest Highway east to Cranbrook and beyond to the Alberta boarder, north to Golden s mountain ranges, west from Prince George to Prince Rupert, Victoria to Port Hardy on Highway 19. A). Will ICBC confirm the 10 BC Weather Station sites are geographically spread across the ICBC Territories identified in the map provided. i.e.: At least one station in each territory. (please think about the answer, and do not jump to yes to quickly). B). Will ICBC please confirm all these 10 BC Weather Stations have a 30 year precipitation data history that suites ICBCs regression forecast models. C). Will ICBC please describe in detail, along with supporting data/evidence, along with their trade off assumption parameters for their: 30-year average is also ICBC s assumption for future precipitation for the purposes of examining regression forecast models with the view I personally would like to verify the PC Precipitation Index they provided. D). Will ICBC please provide all the supporting data so that an independent calculation can be achieved to match the three spreadsheet versions submitted to date. E). Will ICBC please provide all the data used to determine the 13 BC Weather Stations, quote: (ICBC ranked the 13 remaining weather stations according to data quality, and assessed the tradeoff between data quality and geographical coverage) having all the Environment Canada active hyperlinks for these 13 stations. Response: 209.A Please see Attachment A Territory Map, which shows the location of each of the 10 ICBC selected weather stations. It can be seen from Attachment A that, while some territories do not have a selected weather station, the 10 weather stations are geographically spread across BC.
348 Richard Landale Information Request No RR RL.209.A-E Dated 07 January Page 2 of B ICBC confirms that the 10 ICBC selected weather stations have published 30-year average precipitation values. 209.C Please see the response to information request RR RL.11 for supporting data regarding the BC Precipitation index and its corresponding 30-year average. The precipitation data that ICBC has used to support its analysis is provided by Environment Canada, which is the principal scientific authority for information on weather, and uses 1981 to 2010 averages as an overall normal climate benchmark. Since ICBC does not have expertise in climate modeling, it takes the benchmark for normal weather conditions (1981 to 2010) set by Environment Canada as being appropriate. 209.D Please see the response to information request RR RL.11. The precipitation data that is summarized in the response to information request RR RL.11, Attachment A BC Precipitation Index, Section (1) can be found in the uniform resource locators (URLs) provided below. The weighted BC average precipitation in Section (4) is a weighted average of the 10 ICBC selected weather stations, using written exposure in Section (2) as the weightings. This calculation is also shown in the revised BC Precipitation index attachment in ICBC s dated December 21, 2015 (Exhibit B-8), Section (A), column (12). The total written exposure by territory summarized in Section (2) of the response to RR RL.11 is based on ICBC s internal database, which collects all policy information for Basic insurance policyholders. Territory Z (out of province) and Temporary Operating Permits are not included in this summary; therefore, the total is slightly less than the sum of Personal and Commercial calendar year exposures as provided in the Application, Chapter 2, Exhibit B.1.2.
349 Richard Landale Information Request No RR RL.209.A-E Dated 07 January Page 3 of E The following URLs provide all of the relevant information for the 10 ICBC selected weather stations: Weather Station Vancouver Intl A Kamloops A Penticton A Cranbrook A Williams Lake A Smithers A Fort St. John A Victoria Intl A Comox A Port Hardy A URL 2&Prov=BC&StationID= &Prov=BC&StationID= &Prov=BC&StationID= &Prov=BC&StationID= &Prov=BC&StationID= &Prov=BC&StationID= &Prov=BC&StationID= &Prov=BC&StationID= &Prov=BC&StationID= &Prov=BC&StationID=51319 The URLs for the three weather stations considered, but not selected, are shown below. ICBC did not select these three weather stations after considering data quality and geographical coverage. Please see the response to information request RR RL.9 for more information on the data quality and geographical coverage considerations. Weather Station Fort Nelson A Terrace A Abbotsford A URL 2&Prov=BC&StationID= &Prov=BC&StationID= &Prov=BC&StationID=50308
350 ICBC s Information Request Response RR RL.209.A-E Attachment A Territory Map Insurance Corporation of British Columbia January 29,
351
352 Richard Landale Information Request No RR RL.210 Dated 07 January Page 1 of RR RL.210 Reference: ICBC's response to the information request RR RL.10...ICBC has made no effort to support this intuitive aspect to BC Precipitation and motorcycles in March, April and May, with BC Precipitation data, Motorcycle claims, the number of exposures and so on, just an empty statement... Where is the data? Response: The intuitive relationship between BC precipitation and motorcycle exposures is based on the seasonal nature of most BC motorcycle policies. The majority of motorcycle exposures are written prior to summer and cancelled prior to winter. All other factors equal, it is believed that a relatively dry period for the months of March through May is associated with earlier policy effective dates for motorcycle exposures, as well as longer durations, implying a higher number of exposures for the calendar year as a whole. This intuitive relationship is also backed by statistical analysis, which has been updated and monitored on a quarterly basis. In the Application, motorcycle exposures were modeled using an econometric model with two variables: population aged 15 and over and Q2 precipitation. Please note that the Q2 precipitation is calculated as the weighted average across the 10 selected weather stations of days with 0.1mm or more precipitation for the months of March through May. The Application model using these two variables yielded an R 2 statistic of 96.3%. Furthermore, the regression coefficient for the precipitation variable has a p-value of ICBC lists these for the record since they confirm that including the precipitation variable in the model is statistically significant. Table 1 below provides a 5-year summary of the Q2 precipitation versus calendar year motorcycle exposure. This data illustrates the intuitive relationship between Q2 precipitation and motorcycle exposure. For example, of these five years, calendar year 2011 had the highest Q2 precipitation and the lowest exposure growth relative to the prior year. Furthermore, calendar year 2013 had the lowest precipitation of these five years and the highest exposure growth.
353 Richard Landale Information Request No RR RL.210 Dated 07 January Page 2 of 2 Table 1 - Q2 Precipitation and Annual Motorcycle Exposure Calendar Year March - May # Days with >0.1mm Precipitation (weighted average of 10 weather stations) Full Year Motorcycle Written Exposure , , , , ,968
354 Richard Landale Information Request No RR RL.211 Dated 07 January Page 1 of RR RL.211 Reference: ICBC's response to the information request RR RL.11...Did you know ICBC cannot give you a copy of their native excel spreadsheet / worksheet files, as said to me in an . ICBC cannot separate an individual worksheet because of the dependencies on other worksheets and spreadsheet files. I find this particularly peculiar, since ICBC files their Excel Spreadsheets titled as one example:- BIIS Exhibits I,II,III, IV, V Dec 31, 2014.xlsm (56 worksheets long). What a great answer, how can I respond to that, a denial to my request for a native file in order for me to verify the formulas used by ICBC in their worksheet. As mentioned in the first paragraph above, it took ICBC three versions to create a response that I still have difficulty with, but arithmetically have to finally accept. By the way the formula in question is SUM PRODUCT. In the first and second versions, this formula could not be proven, hence ICBC created the third version... Response: ICBC could not find a question in this information request. ICBC would like to point out that the updates to its response to information request RR RL.11 are included in the evidence as exhibits B-7 and B-8.
355 Richard Landale Information Request No RR RL.212 Dated 07 January Page 1 of RR RL.212 Reference: ICBC's response to the information request RR RL.12...Further in para 9, Other Regression Models Exhibit D.0., ICBC continues to reference weather conditions, as part of a set of candidate explanatory variables. Will ICBC please explain how weather conditions are applied in their models, when they advise the BC Weather Precipitation index is no longer used. Please discuss any other weather related variables that ICBC is using in Any actuarial analysis and/or models. I want to know: the how, the where, what the variables are, and how they contribute to actuarial analysis, so that independent verification can be undertaken, and to also be sure of transparency. Response: The Application, Chapter 2, Exhibit B.0.1 describes the exposure model used in the actuarial analysis. Exhibit B.0.1, paragraph 4, explains that the BC Precipitation index is used to construct the precipitation explanatory variable in the motorcycles exposure model. The BC Precipitation index is not used in the exposure model for any other business segment. The Application, Chapter 2, Exhibit D.0 describes the claims frequency and severity models. Exhibit D.0, Section B, explains the difference between a simple regression model using time and seasonality (or time of the year) as explanatory variables, and other regression models using other explanatory variables such as the BC Precipitation index. An examination of the explanations for the frequencies and severities of each coverage will reveal that the selected models are either a flat trend or a simple regression model, neither of which use the BC Precipitation index as an explanatory variable. In summary, with the exception of the motorcycles exposure model, neither the exposure models nor the claims frequency and severity models use the BC Precipitation index as an explanatory variable. As explained in the response to information request RR RL.13, the use of the BC Precipitation index in the motorcycles exposure model has a minor impact on the rate change to cover costs of less than percentage points because motorcycles represent less than 2.5% of all Basic policyholders.
356 Richard Landale Information Request No RR RL.213 Dated 07 January Page 1 of RR RL.213 Reference: ICBC's response to the information request RR RL.13 I do not understand why ICBC in their response to BCUC 8.3 said, quote: If the frequencies for AY 2010 through AY 2014 are adjusted to normal BC precipitation, the modeled frequency for policy year 2015 would slightly increase from 1.471% to 1.475%... The point of this history lesson is to show historically ICBC biases are skewed when it comes to BC Precipitation, Environment Canada historical data, rendering ICBCs forecasting analysis for this current 2015 RRA as being totally unreliable, quote: Please note that ICBC did consider using a 5-year average adjusted to normal BC precipitation for the Bodily Injury and Accident Benefits Personal frequency models; however the impact on rates was small (unfavourable). Please see the response to information request RR BCUC 8.3 for more details. I think perhaps ICBC should re-calibrate, by getting with the most recent data available, rather than their skewed perception to 30 year average frequencies... In light of the preceding information, and my first round of IR s, along with this second round of IR s, will ICBC re-evaluate their BC Precipitation models, analysis and forecast impacts for this current 2015 RRA? Response: ICBC does not believe that re-evaluating the BC precipitation models, analysis, and forecast will provide any additional information for the purposes of the policy year 2015 rate indication analysis, for the reasons summarized below. ICBC believes that its current selections for frequency forecasting are its best estimates based on the information and resources available. The precipitation data that ICBC has used to support its analysis is provided by Environment Canada, which is the principal scientific authority for information on weather, and uses 1981 to 2010 averages as an overall normal climate benchmark. Since ICBC does not have expertise in climate modeling, it takes the benchmark for normal weather conditions (1981 to 2010) set by Environment Canada as being appropriate. ICBC has also graphically shown in Figure 1 below that the recent years of BC s precipitation is not materially different from the BC 30-year average (1981 to 2010).
357 Richard Landale Information Request No RR RL.213 Dated 07 January Page 2 of 2 Figure 1 BC Average Cumulative Precipitation: 2011 to 2015 vs. the 30-year Average 1,200 BC Average Cumulative Precipitation 1,000 Precipitation (mm) Q1 Q2 Q3 Q Average Average
358 Richard Landale Information Request No RR RL.215 Dated 07 January Page 1 of RR RL.215 Reference: ICBC's response to the information request RR RL.15 "...weather is a variable that ICBC monitors quarterly when analyzing exposure and frequency trends to understand if there is any influence that unusual weather may have on a trend..." ICBC says they conduct quarterly reviews, so compiling this existing data is not an arduous request within the RRA hearing. For the purposes of this particular IR response, will ICBC please file all their quarterly analysis, exposures, and frequency trends for the years 2011 to 2015 inclusive, so that this intervener can re-evaluate ICBCs BC Precipitation indexes for the given years, using the same spreadsheet format ed to me December 21 st Response: In accordance with Special Direction IC2, section 1.1, ICBC must calculate the MCT ratio used for determining the rate indication in its revenue requirements application using data from the most recent quarter. To be in accordance with this requirement, ICBC must also use the most recent quarter of claims and exposures data in the actuarial analysis for its revenue requirements applications. The relevant quarter for the 2015 Revenue Requirements Application is the second quarter of 2015, and such information is provided in the Application, Chapter 2, Exhibit Sets B and D. ICBC has complied with Special Direction IC2, and therefore, the data and analysis from other quarters is not used in preparation of the rate indication for policy year The BC Precipitation index information and analysis relevant to the Application was discussed in the response to information request RR RL.11, and updated information was provided to Mr. Landale and is on the evidentiary record as Exhibit B-7 and Exhibit B-8. As discussed in the response to information request RR RL.13, the application of the BC Precipitation index as an explanatory variable for motorcycle exposures has a less than percentage point impact on the policy year 2015 rate change to cover costs. Compiling the data as requested in this information request for the purposes of Mr. Landale s reevaluation of ICBC s BC Precipitation index is a significant task. Given that the information from quarters other than the second quarter of 2015 has no bearing on the policy year 2015 rate indication, and the precipitation analysis based on the relevant data has a small impact in any event, ICBC respectfully declines to compile and provide the extensive information requested.
359 Richard Landale Information Request No RR RL.216.A Dated 07 January Page 1 of RR RL.216.A Reference: The Application, Chapter 3, Figure 3.1 Please explain why using 2015 rules, ICBC has $513 million excess Capital in reserve (unallocated), which is $63 million above the $450 million Optional Capital Transfer. WHY?? Raising the MCT above the BCUC approved ceiling of 145% by another 1.76%?? Response: There are two conceptual errors in the information request. Firstly, Figure 3.1 refers to the 2014 year-end MCT ratio. The $450 million Optional capital transfer does not apply to the 2014 yearend MCT ratio; it applies to the 2015 Outlook MCT ratio as explained in the Application, Chapter 3, and as required by Special Direction IC2. Secondly, the Commission has not approved a ceiling of 145% for the MCT ratio. The Commission has approved a capital management target of 145% MCT as specified in the Decision on 2013 Revenue Requirements. Figure 3.1 shows that the Excess of Capital Available over Required is $513 million, as calculated using the 2015 OSFI MCT Guideline. This is further explained in the Application, Chapter 3, Appendix 3 A.

360 Richard Landale Information Request No RR RL.216.B Dated 07 January Page 1 of RR RL.216.B Reference: The following table is a compilation of ICBC response to BCUC RRA , Figures 3.1, Figure 3.2, Figure 3 A.1 and Figure 3 B.1 from Chapter 3 Appendix A and B. My first reaction is this table cannot be right. No matter how hard I tried to utilize ICBCs key data from the tables referenced above, the accumulated costs that follow are wrong... Will ICBC please provide the evidence to support the following, so that the above noted Figure Tables can be supported with calculated fact, and not a lot of OSFI Guideline text. 1). 2013, Minimum Capital Required before & including 2015 OSFI Guidelines. 2). Annual transition amount from Figure 3.1 for 2015,, 2017 or $112 million source, (line j), please also consider item 3 in this request. 3). The actual annual rising dollars transition from 130% MCT to 133% through 2015, 16, and 17, because this relationship could not be reproduced to equate with 133% MCT in 2017 (see arrows in the above table). You might like to review RTL 2015 RRA 205 in concert with this IR. Response: 216.B.1 For ease of reference, ICBC refers to the table named Figure 3.1 in the preamble to this information request (top right corner) as Table A, because it is not the same as the table in the
361 Richard Landale Information Request No RR RL.216.B Dated 07 January Page 2 of 2 Application, Chapter 3, Figure 3.1. Table A has incorrectly restated the minimum capital required per year and has incorrectly recalculated the associated phase-in amount per year as well as the margins for adverse events. This is the reason why the information cannot be reconciled with that provided in the table named Figure 3.2 in the preamble to this information request (top left corner) which, for ease of reference, ICBC refers to as Table B. Table B is not the same as the table in the Application, Chapter 3, Figure 3.2, but it does show the correct phase-in amount of the minimum capital required over the next three years ($112 million) as further explained in the response to Part 2 below. 216.B.2 The phase-in amount is the difference between the total minimum capital required as at December 31, 2014 calculated using the 2015 OSFI MCT Guideline and the 2013 OSFI MCT Guideline. The difference is $112 million, which will be phased in over three years as follows: $37 million in 2015 and, and $38 million in B.3 There is not an actual rising dollar transition from 130% MCT to 133% MCT through 2015,, and 2017 because the dollar value of the margin for adverse events is preserved at $363 million throughout this period. As explained in the response to information request RR BCUC , If the risk management target were maintained at 130%, then the margin for adverse events would erode by $34 million by Line d of Table B shows that the margin for adverse events would erode by $11 million in 2015 if the risk management target were maintained at 130%. Similarly the margin for adverse events would erode by $22 million in and $34 million in 2017 if the risk management target were maintained at 130%. The total of these three numbers is $67 million, which is different to the total shown in Table A for the reasons explained in Part 1 of this response.

362 Richard Landale Information Request No RR RL.216.C Dated 07 January Page 1 of RR RL.216.C Reference: ICBC's response to the information request RR RL.16.b filed in the response to information request RR RL.16.a-b I do not believe ICBC has correctly answered my IR which is repeated again here: Will ICBC please demonstrate the consequential dollar value differences and/or shortfalls between 2014 and 2015 including an outlook through to 2017 as they pertain to the approved BCUC 2014 Capital Management Plan. Please consider the Minimum Capital Required (line a) for 2015,, In previous forecasts ICBCs actuaries file the MCR numbers as rising, in this instance the MCR is falling, which to this intervener is ridiculous. Simply put, I surmise ICBC actuaries are forecasting their Written Exposures from 2015 to 2017 must be in decline, thereby reducing the required Written Exposure forecasted MCR. Also how is this table reflected within the approved BCUC 2014 Capital Management Plan? Response: The Minimum Capital Required (line a) is declining because of the phase-in of the change to the OSFI guideline, as further explained in the Application, Chapter 3, Section C and Appendix 3 A. Table 1 in this information request is copied from ICBC s response to information request RR BCUC , and is correct. Table 1 relates to the Application, Chapter 3, Figure 3.2 and the explanation of how the dollar values of the margins relate to the Commissionapproved Basic Capital Management Plan is provided in the Application, Chapter 3, Section D. ICBC agrees that, in the absence of the change to the OSFI guideline, the Minimum Capital Required should grow in line with the growth in claims costs over the long term. As explained in
363 Richard Landale Information Request No RR RL.216.C Dated 07 January Page 2 of 2 the response to information request RR RL.216.D, the long-term growth in claims costs is partially a result of the growth in written exposures. ICBC is not forecasting a decline in written exposures as suggested in this information request.
364 Richard Landale Information Request No RR RL.216.D Dated 07 January Page 1 of RR RL.216.D Reference: As a side IR, is the Minimum Capital Required a reflection of Written Exposures, past, present and forecasted, as in a 25 / 30 year regression table Response: Yes, Minimum Capital Required is a reflection of the changes within written exposures over time. As stated in the response to information request RR BCUC.38.1, each component of the Minimum Capital Required (unpaid claims liabilities, unearned premium, and investment assets) should grow in line with the growth in claims costs over the long term. Growth in claims costs is the combination of the long-term growth in claims severity, claims frequency, and written exposures (i.e., the number of policies).
365 Richard Landale Information Request No RR RL.217.A-B Dated 07 January Page 1 of RR RL.217.A-B Reference: ICBC's response to the information request RR RL.17 A). The five tables do not show the numerical (and / or the dollars involved) impact of the Rate Smoothing Framework, which is the difference between 130% and 145% MCT. B). I cannot find the PY 2015 Lost Cost Forecast Variance (LCFV) of 5.8ppt in these tables, what am I missing? or, is this information missing altogether? Response: Loss cost forecast variance and the rate smoothing provisions are one-time items that do not relate to one another from year to year. For example, the loss cost forecast variance represents the difference in claim costs that has emerged for the previous policy year compared to what was originally forecast. This impact will vary from year to year and would not be expected to exhibit a particular trend rate. As requested, please see Table 1 below, which summarizes the components of the past four policy year rate indications, including the loss cost forecast variance as well as the rate smoothing provision included in each revenue requirements application. The sum of the components in each row is equal to the indicated rate change in the final column of Table 1. For comparative purposes, the numbers provided in the first three columns of Figure 5 in the response to information request RR RL.17 are annualized trends, whereas the numbers provided in Table 1 below represent components of the indicated rate change. Table 1 Basic Loss Cost Trend (ppt of rate) Loss Cost Forecast Variance (ppt of rate) Rate Smoothing Provision (ppt of rate) Other (ppt of rate) Indicated Rate Change PY % PY % PY % PY %
366 Richard Landale Information Request No RR RL.218.A-B Dated 07 January Page 1 of RR RL.218.A-B Reference: ICBC's response to the information request RR RL.18.a-b...ICBC has spent $400 million on integrating the Claims Transformation Program (CTP) since 2011, with PY 2014 being one full year of operations for ICBCs actuaries to refine their analysis of the CTP impact on reducing the Indicated Rate Change. A mere 0.7 ppt is a shameful result, or, extremely aggressive exertion of accepted actuarial analysis with unsubstantiated Claims impacts within the CTP... A-B). Please respond. Response: The $400 million referenced in the information request is for the full Transformation Program and not just for the Claims Transformation Program (CTP). The total cost of implementing the CTP reflects the total spent over a 5-year period. The expenditure came from ICBC s Optional insurance business and was never expected to be fully recovered in a 1-year period. CTP is a substantial change to ICBC s claims management system and processes, and will have direct benefits throughout future years on Basic and Optional insurance lines of business (please refer to the Application, Chapter 2, Exhibit E.2, which summarizes the annual Basic claims cost savings, stabilizing at $35 million per calendar year in 2017). In addition, it lays the groundwork for future enhancements, which will also benefit ICBC s customers through lower rates and better customer service. To clarify, the $34 million of savings from the CTP provided in the Application, Chapter 2, Exhibit E.2 reflects the bodily injury savings applicable for Basic insurance in policy year 2015 only. The rate impact associated with these savings reflects only the change in the estimated savings for policy year 2015 compared to the savings that are already included in the current rates (the current rates already include $27 million of savings for CTP). This concept is further explained in the response to information request RR RL.18.a-b. Exhibit E.2 summarizes the current and future years of savings attributable to the CTP.
367 Richard Landale Information Request No RR RL.218.C Dated 07 January Page 1 of RR RL.218.C Reference: In reference to Exhibit E.0 para 15 page 5 job hierarchy and Exhibit E.2 lines (c), (d), (e) and (f)...will ICBC please confirm there are only four levels / positions in the new job hierarchy within the new CTP. If there are more, please provide their title positions along with their relative Transitional impacts on efficiency and quality of file handling ($000 s) for each of the years shown in the exhibit. Response: There are more roles in the Claims job hierarchy than the four listed in the Application, Chapter 2, Exhibit E.2. The following are the roles in the Claims job hierarchy: Customer Service Adjuster Claims Adjuster Claims Adjuster Commercial Injury Adjuster Senior Injury Adjuster Claims Examiner (Injury) Senior Claims Examiner (Injury) Recovery Coordinator Estimator Estimator Specialty Vehicles Commercial Claims Appraiser Claims Examiner Commercial Total Loss Handler Claims Support Assistant Claims Document Support Assistant As indicated in the Application, Chapter 2, Exhibit E.0, the long-term benefits of the Claims Transformation Program primarily reflect claims cost savings associated with bodily injury (BI) claims. The prospective adjustment therefore reflects that only the BI claims costs and the roles handling BI claims listed in Exhibit E.2 would be materially impacted. The other roles from the list above handle material damage claims, accident benefits claims, or are support positions. Material damage claims have shorter durations and more certain
368 Richard Landale Information Request No RR RL.218.C Dated 07 January Page 2 of 2 outcomes than those involving bodily injury, and a significant impact to claims costs was not expected. Accident benefits are statutory coverages and, similarly, a significant impact to claims costs was not expected.
369 Richard Landale Information Request No RR RL.218.D Dated 07 January Page 1 of RR RL.218.D Reference: It is most disconcerting to read in figure E.0.1 that ICBC continues to carry forward excuses for passing on increased operational and staffing costs within this new CTP to Basic Insurance policyholders Response: There does not seem to be a question in this information request; however, ICBC will provide additional clarification regarding the concerns expressed. All amounts in the Application, Chapter 2, Exhibit E.2, including rows (c) through (g), are attributable to bodily injury claims costs and do not represent any additional operational and staffing costs. The CTP is a multi-year endeavour. As discussed in the Application, Chapter 6, paragraph 33, the stabilization period following the rollout of ClaimCenter continued late into 2015, and ICBC is still in a co-existence period during which the legacy claims system continues to exist alongside the new claims management system. The benefits and transitional impact estimates reflect that reality. As discussed in the response to information request RR RL.218.A-B, the amount of savings in Exhibit E.2 is for each given year. As CTP progresses, the estimated benefits to Basic policyholders increase (row (b)) and the negative transitional impact on bodily injury claims costs decreases (row (g)). For example, the savings from CTP attributable to bodily injury claims costs for policy year 2015 are an estimated $34.4 million (row (j)) and the transitional impact for policy year 2015 is $0.3 million (row (k)), which nets to an overall savings of $34.2 million.
370 Richard Landale Information Request No RR RL.218.F Dated 07 January Page 1 of RR RL.218.F Reference: ICBC's response to the information request RR RL.18.d-e ICBC continues NOT TO ANSWER IR questions with actual numbers / evidence. This again demonstrates ICBC lack of transparency. Please provide the numerical evidence in one table or a series of tables to support Exhibit E.2 as requested. Response: ICBC believes that Exhibit E.2 in the Application, Chapter 2 summarizes the assumptions and data used to construct the prospective adjustment at an appropriate level of detail for an external review. The internal analyses that are referenced in Exhibit E.2 were prepared in a format that allows expert peer review, not in a format suitable for examination by an external party. The internal analyses consist of a large number of interlinked spreadsheets and a significant amount of effort would be required to format them for the purpose of an external review. The internal analyses supporting Exhibit E.2 were conceptually and technically peer reviewed for completeness and accuracy. To aid in the understanding of Exhibit E.2, ICBC has also provided additional commentary to describe Exhibit E.2 in the response to information request RR RL.18.c.
371 Richard Landale Information Request No RR RL.219 Dated 07 January Page 1 of RR RL.219 Reference: ICBC's response to the information request RR RL.19 In ICBCs response to this IR, we are referred all over the place. Well in my opinion, ICBC has an obligation to this current 2015 RRA to layout all the relevant facts and figures in one place, in their response to this IR. Put the response in one table or ten tables, whatever it takes to complete the picture, so that the Commission Panel and Interveners can assess for themselves the impacts ICBC has over their corporate and controllable operating expenses. Expecting the reader to follow along the response theme by diverting the reader s attention all over the place is not helpful to a cohesive understanding. It is a measure used to distract the reader while avoiding transparency. Response: The Application, Chapter 4, Figure 4.4 Corporate Operating Expenses has two components: 1) controllable operating expenses; and 2) pension and post-retirement benefit expenses. ICBC has a commitment to keep controllable operating expenses flat from the 2013 plan and has met its commitment, with inflationary increases fully absorbed. Each year, actual controllable operating expenses have been at or below plan. This benefits Basic insurance policyholders. ICBC has not committed to keep pension and post-retirement benefit expenses flat as these expenses are impacted by market-driven forces. Increases in the pension and post-retirement benefit expenses over the years are primarily due to the downward trend in the market-based rate used to discount pension and post-retirement benefit liabilities, and to changes in accounting standards discussed in previous filings. All things being held equal, the impact of a decrease in the market-based discount rate is an increase to pension and post-retirement benefit expenses and vice versa. In 2014, miscellaneous expenses and revenue have been reclassified in accordance with International Financial Reporting Standards. Total corporate amounts are provided in the table below in order to tie in with the Application, Chapter 4, Figure 4.4. As illustrated in the table below, the reclassification has no impact to net income.
372 Richard Landale Information Request No RR RL.219 Dated 07 January Page 2 of 3 ($ millions) 2014 Actual Miscellaneous Revenue Reclass 2014 Actual Restated Revenues and Investment Income 5, ,104 Claims and Claims-Related Costs (3,560) (3,560) Controllable Operating Expenses (539) (55) (594) Pension and Post-Retirement Benefit Expense Commissions and Deferred Premium Acquisition Costs (DPAC) (58) (58) (496) (496) Transformation Program (24) (24) Net Income* * Rounding may affect totals. As noted in the Application, Chapter 2, Figure 2.2 (reproduced below), the reclassification has no impact on rate indication.
373 Richard Landale Information Request No RR RL.219 Dated 07 January Page 3 of 3 ICBC respectfully submits that referring to information already on the record in the Application, and to other information requests that provide similar information, is a well-established protocol, which improves the efficiency of a proceeding by avoiding duplicate information and an unnecessarily large written record. As discussed in the 2013 Revenue Requirements Proceeding, all parties and the Commission benefit from this approach.
374 Richard Landale Information Request No RR RL.220 Dated 07 January Page 1 of RR RL.220 Reference: ICBC's response to the information request RR RL.20.d filed in the response to information request RR RL.20.d-f D). Will ICBC please comment in regard to this assumption, Figure 4.4 Merchant Fees for PY2015 is $31,000,000 or put another away, $31 million divided by 3.4 million policies equals approximately $9.10 per policy. In my particular case that equals $9.10 / $1,162 (Basic, Optional, Road Star & 4.4%) = 0.783% of my total charge to my credit card charge, ICBC pays as a service fee. I still would like the answer to this IR, which is repeated, I gave ICBC my numbers, and I would like the numbers back as requested make it personal, please. Incidentally, of course I divided the number by 3.4 million, I had no other evidence to utilize, such as shall we say, Written Policies or Exposures or What, that is why I requested a personal answer... Response: To clarify, the $31 million Merchant Fee shown for calendar year 2015 in the Application, Chapter 4, Figure 4.4 is a corporate operating expense. The corresponding Basic component of this amount is $17.80 million, as shown in the Application, Chapter 2, Exhibit H.1 and in the response to information request RR RL.20.a. The Merchant Fees, or credit card service fees, attributable to policies effective in policy year (PY) 2015 are $19.05 million, an increase of $1.56 million compared to the PY 2014 Merchant Fees of $17.49 million. It is the increase of $1.56 million that impacts the policy year rate change to cover costs, translating to an average impact of 49 cents per policy (i.e., $1,562,000 / 3,171,035 policies).
375 Richard Landale Information Request No RR RL.221 Dated 07 January Page 1 of RR RL.221 Reference: ICBC's response to the information request RR RL.21 First off, I truly appreciate the ICBC staff member who scripted this response, well done. I have read this executive summary response provided by ICBC at least four, five times now. I have come to realize I am out of my depth. I am leaving the IR here more for a record than to request further explanation. Response: ICBC acknowledges that the intervener accepts the response to information request RR RL.21.
376 Richard Landale Information Request No RR RL.222.A Dated 07 January Page 1 of RR RL.222.A Reference: The Application, Chapter 8, Section C.1, para 15 and 16. Will ICBC please provide ALL MOU s that exist between ICBC and those partners listed in paragraph 16. Response: ICBC does not have Memoranda of Understanding with its Road Improvement Program partners. Rather, there are contracts established for each road improvement project, which provide the level of ICBC contribution to the project. For more information, please see the response to information request RR RL.222.B.
377 Richard Landale Information Request No RR RL.222.B Dated 07 January Page 1 of RR RL.222.B Reference: The Application, Chapter 8, Section C.1, para 15 and 16 and Appendix 8 B Under the Capital allocations attributed to Basic Insurance, will ICBC please provide in a table along with any MOU s, or correspondence from partners, the PY2015 budget forecast for each partner? and how much is budgeted / allocated in PY 2015 to each partner?, with the descriptive headline that pertains to each project allocations to each partner, (i.e.: per Study Tables 5.8 and 5.9). Response: ICBC s budgets are based on calendar/fiscal year and not on a policy year basis and budget forecasts are not established for each road authority partner. Rather, regional budget allocations are established at the beginning of the calendar year. The 2015 regional budget allocations are listed below. The regional budget allocations can fluctuate depending on the number of road safety project submissions and the expected safety benefits associated with each submission. $1.7M Greater Vancouver (municipal) Region $1.8M Fraser Valley (municipal) Region $1.0M Southern Interior and Northern (municipal) Region $1.0M Vancouver Island (municipal) Region $2.5M Provincial Highway (Ministry of Transportation and Infrastructure (MOTI)) Given that budgets are not set on an individual partner basis, ICBC has included in Attachment A ICBC Road Safety Partner Projects -2015, a table setting out the actual number of projects and the amount contracted in calendar year 2015 for each partner.
378 ICBC s Information Request Response RR RL.222.B Attachment A ICBC Road Safety Partner Projects 2015 Insurance Corporation of British Columbia January 29,
379 ICBC Road Safety Partner Projects Road Safety Partner Number Of Projects Total ICBC Contribution 100 Mile House 1 $2,000 Abbotsford 13 68,500 Bowen Island 1 5,000 Burnaby 4 190,000 Campbell River 4 32,700 Chetwynd 2 10,634 Chilliwack 9 95,700 Colwood 2 12,500 Coquitlam ,000 Cowichan Tribes 2 9,300 Dawson Creek 1 15,000 Delta 10 77,427 Duncan 3 65,000 Esquimalt 1 20,000 Fort St John 4 70,700 Gibsons 1 45,000 Kamloops 7 348,300 Kelowna ,880 Ladysmith 1 14,830 Lake Cowichan 5 20,800 Langford 4 148,000 Langley (City) 4 24,500 Langley (Township) ,900 Maple Ridge 8 142,000 Mission 1 15,000 MOTI 103 2,474,100 Nanaimo 6 157,600 New Westminster 5 74,000 North Cowichan 6 35,000 North Saanich 2 10,000 North Vancouver (City) 5 140,000 North Vancouver (District) 3 20,000 Oak Bay 4 29,100 Osoyoos 1 13,560 Parksville 5 32,700 Penticton 3 44,800 Pitt Meadows 2 15,000 Port Alberni 2 6,775 Port Coquitlam 2 12,500
380 ICBC Road Safety Partner Projects Road Safety Partner Number Of Projects Total ICBC Contribution Port Moody 3 50,000 Prince Rupert 1 8,450 Qualicum Beach 2 20,000 Richmond ,500 Saanich 5 109,818 Salmon Arm 1 7,500 Sidney 1 7,500 Sooke 4 25,000 Squamish 4 53,500 Surrey 37 1,204,000 Taylor 1 41,400 Terrace 1 10,000 Trail 2 12,800 Translink 1 21,500 Tumbler Ridge 1 6,125 UBC 2 41,000 Ucluelet Vancouver ,500 Vernon 3 32,100 Victoria 7 62,900 View Royal 6 36,524 West Kelowna 3 43,900 West Vancouver (District) 2 36,000 Westbank First Nation 1 15,000 White Rock 1 7,000 Grand Total 405 $7,834,673
381 Richard Landale Information Request No RR RL.222.C Dated 07 January Page 1 of RR RL.222.C Reference: The Application, Chapter 8, Section C.1, para 15 and 16 and Appendix 8 B Assuming the claim ICBC purports for every $1 invested in road improvements, there could be a $4.70 benefit crash cost saving for PY 2015 (see Section C.1 para 17), is ICBC forecasting the same level of benefit crash cost savings in PY2015/16 for these PY2015/16 projects, or higher / lower benefit crash cost savings. The reason for this particular IR, is the following table below demonstrates completely different summary totals for all 111 projects, with a $6.08 benefit crash cost savings between the years 2008 and 2010, extrapolated between Traffic and Collision Data years 2008 to 2013, (hocus pocus), or is it only $3.61?... Within this report Tables ES-1, 2, 3,& 4 depict percentages, Figures ES.1,.2,.3 and.4 depict graphic values from the aforementioned tables respectively. The various time spans or collision rates, have no intuitive relationship to the 5 year service life expressed in Table ES-4. This is because the raw data in Tables A-3 Summary of Treatment Site Selection, and A.4 Summary of Treatment Sites, show ICBCs Contribution / Road Safety Program investments were between 2008 and 2010 for all 111 sites noted in the report, not within the last 5 years... Response: The results from the Road Improvement Program Evaluation Report (the Evaluation Report) provided in the Application, Chapter 8, Appendix 8 B are used to determine whether ICBC s previous road safety investments have been successful. The results are only for those projects that were included in the 2015 evaluation (i.e., for those projects that were completed in 2008 to
382 Richard Landale Information Request No RR RL.222.C Dated 07 January Page 2 of ). The methodology discussed in the Evaluation Report is a time-series analysis, which examines the safety performance before and after the improvements have been implemented. Thus, a significant amount of post-implementation time is required to assess the effectiveness. It is impossible to forecast whether the $4.70 crash cost savings described in the evaluation will be higher, lower, or the same for projects completed in. This is because the projects ultimately supported by the Road Improvement Program are dependent upon the nature of the projects brought forward to ICBC by program partners. ICBC evaluates each project proposal and makes an appropriate investment based upon its assessment of the relative effectiveness of the road safety measure being proposed. Ultimately, ICBC will not have certainty of the effectiveness of the measure until it is implemented, and then evaluated some years later. Net present value (NPV) should not be used in the calculation of the benefit cost (B/C) ratio as shown in the information request. Dividing the NPV by the costs will not result in the B/C ratio. NPV is the sum of the road safety benefits (i.e., the value of reduced collisions), discounted to a present value minus the cost of the road improvement project. The B/C ratio is calculated as the discounted road safety benefits divided by the costs. If correctly evaluated for the numbers in the table above, the B/C ratio would be 4.6, which is similar to the B/C ratio values reported in the Evaluation Report. The following formula is used to calculate NPV: where: t = the time of the cash flow i = the discount rate R t = the net cash flow (i.e., cash inflow cash outflow at time t) N = the total number of periods

383 Richard Landale Information Request No RR RL.222.C Dated 07 January Page 3 of 3 As an example, consider a road improvement project that has an ICBC contribution cost of $25,000. After the road safety project has been implemented, an evaluation is completed and it is determined that there has been a reduction in collisions which, when converted to economic benefits, is equal to $22,000 per year. The road safety benefits are expected to continue to accrue for five years and the discount rate is 3%. Thus, the NPV is as follows: The B/C ratio is simply calculated as the discounted value of incremental benefits divided by the discounted value of incremental costs. For the example given above, the B/C ratio (BCR) is 4.03, as shown below.
. CANADIAN DIRECT INSURANCE Canadian Western Bank Group
 . CANADIAN DIRECT INSURANCE Canadian Western Bank Group C10-3 Ms. June Elder Manager, Corporate Regulatory Affairs, Insurance Corporation of British Columbia, 151 West Esplanade, North Vancouver, BC V7M
W E I S B E R G C O R P O R A T I O N
 C5-4 W E I S B E R G L A W C O R P O R A T I O N 2730 Ailsa Crescent North Vancouver, BC V7K 2B2 Fred J. Weisberg Barrister & Solicitor Direct: (604) 980-4069 fredweislaw@gmail.com November 29, 2016 Ms.
Re: Insurance Corporation of British Columbia Order G /Project No Revenue Requirements Application
 14952 95A Avenue Surrey, British Columbia. V3R 7T6 C1-11 3 February 2014 Ms. Erica Hamilton Commission Secretary British Columbia Utilities Commission Sixth Floor, 900 Howe Street Vancouver, British Columbia
PNG WEST 2013 REVENUE REQUIREMENTS EXHIBIT A-9
 ERICA HAMILTON COMMISSION SECRETARY Commission.Secretary@bcuc.com web site: http://www.bcuc.com SIXTH FLOOR, 900 HOWE STREET, BOX 250 VANCOUVER, BC CANADA V6Z 2N3 TELEPHONE: (604) 660-4700 BC TOLL FREE:
2013 Revenue Requirements Application Public Workshop OPENING REMARKS
 2013 Revenue Requirements Application Public Workshop September 24, 2013 OPENING REMARKS 1 1 ICBC S Application Two main components of Application Basic rate increase of 4.9% Proposed new Basic Capital
2013 DCAT Report Approved by Board of Directors October 4, 2013
 2013 DCAT Report Approved by Board of Directors October 4, 2013 2013 Dynamic Capital Adequacy Testing Report Basic Compulsory Automobile Insurance TABLE OF CONTENTS 1.0 Executive Summary... 1 SUMMARY OF
FEVI DEFERRAL ACCOUNT PEC EXHIBIT A2-3
 ERICA HAMILTON COMMISSION SECRETARY Commission.Secretary@bcuc.com web site: http://www.bcuc.com VIA EMAIL gas.regulatory.affairs@fortisbc.com April 4, 2013 SIXTH FLOOR, 900 HOWE STREET, BOX 250 VANCOUVER,
Insurance Corporation of British Columbia
 Financial Report Discussion of Results Financial Resource Summary Table This report contains statements regarding the business of the Corporation. The table below provides an overview of ICBC s financial
MANITOBA PUBLIC INSURANCE
 MANITOBA PUBLIC INSURANCE AI.11 RATE STABILIZATION RESERVE AI.11 Discussion of the Rate Stabilization Reserve (RSR) AI.11.A Background The purpose of the Rate Stabilization Reserve (RSR) is to protect
Use of Internal Models for Determining Required Capital for Segregated Fund Risks (LICAT)
") Canada Bureau du surintendant des institutions financières Canada 255 Albert Street 255, rue Albert Ottawa, Canada Ottawa, Canada K1A 0H2 K1A 0H2 Instruction Guide Subject: Capital for Segregated Fund
Canada Bureau du surintendant des institutions financières Canada 255 Albert Street 255, rue Albert Ottawa, Canada Ottawa, Canada K1A 0H2 K1A 0H2 Instruction Guide Subject: Capital for Segregated Fund
For further information, please contact Guy Leroux at
 BChydro m R GENE IONS Joanna Sofield Chief Regulatory Officer Phone: (604 623-4046 Fax: (604 623-4407 bchyd roregulatorygroup@bchydro.com July 13 2009 Ms. Erica M. Hamilton Commission Secretary British
Insurance Corporation of British Columbia 2015/ /18 SERVICE PLAN
 2015/16 2017/18 SERVICE PLAN For more information on the Insurance Corporation of British Columbia contact: In the Lower Mainland 604-661-2800 Elsewhere in B.C., Canada, or the U.S. 1-800-663-3051 Head
Consolidated Statement of Financial Position
 Consolidated Statement of Financial Position March 31 Assets Cash and cash equivalents $ 27,128 $ 45,815 Accrued interest 75,863 55,327 Assets held for sale (note 5) 25,712 - Financial investments (note
Réponse du Transporteur et du Distributeur à l'engagement 4
 Demande R-3842-2013 Réponse du Transporteur et du Distributeur à l'engagement 4 Original : 2013-11-05 HQTD-6, Document 4.4 En liasse Demande R-3842-2013 Engagement 4 (Demandé par l'aqcie-cifq le 2013-11-01,
Canadian Office & Professional Employees Union, Local 378
 Canadian Office & Professional Employees Union, Local 378 2 nd Fl., 4595 Canada Way, Burnaby, B.C. V5G 1J9 Phone: (604) 299-0378 Toll Free: 1-800-665-6838 Fax: (604) 299-8211 August 18, 2004 Via e-mail:
November 8, Dear Mr. Wruck:
 B-23 Fred James Chief Regulatory Officer Phone: 604-623-4046 Fax: 604-623-4407 bchydroregulatorygroup@bchydro.com November 8, 2017 Mr. Patrick Wruck Commission Secretary and Manager Regulatory Support
FORTISBC ENERGY CEC ROE 2016 EXHIBIT A-7
 ERICA HAMILTON COMMISSION SECRETARY Commission.Secretary@bcuc.com web site: http://www.bcuc.com SIXTH FLOOR, 900 HOWE STREET, BOX 250 VANCOUVER, BC CANADA V6Z 2N3 TELEPHONE: (604) 660-4700 BC TOLL FREE:
June 22, British Columbia Utilities Commission Sixth Floor 900 Howe Street Vancouver, B.C. V6Z 2N3. Ms. Erica M. Hamilton, Commission Secretary
 Diane Roy Director, Regulatory Affairs - Gas FortisBC Energy Inc. B1-7 16705 Fraser Highway Surrey, B.C. V4N 0E8 Tel: (604) 576-7349 Cell: (604) 908-2790 Fax: (604) 576-7074 Email: diane.roy@fortisbc.com
Parties are invited to make submissions on IR responses and the additional topics to be issued by the Panel. ACTION DATE (2014)
") ERICA HAMILTON COMMISSION SECRETARY Commission.Secretary@bcuc.com web site: http://www.bcuc.com SIXTH FLOOR, 900 HOWE STREET, BOX 250 VANCOUVER, BC CANADA V6Z 2N3 TELEPHONE: (604) 660-4700 BC TOLL FREE:
ERICA HAMILTON COMMISSION SECRETARY Commission.Secretary@bcuc.com web site: http://www.bcuc.com SIXTH FLOOR, 900 HOWE STREET, BOX 250 VANCOUVER, BC CANADA V6Z 2N3 TELEPHONE: (604) 660-4700 BC TOLL FREE:
Insurance Corporation of British Columbia 2014 ANNUAL SERVICE PLAN REPORT
 2014 ANNUAL SERVICE PLAN REPORT For more information on the Insurance Corporation of British Columbia contact: In the Lower Mainland 604-661-2800 Elsewhere in B.C., Canada, or the U.S. 1-800-663-3051 Head
FORTISBC INC PERFORMANCE BASED RATEMAKING REVENUE REQUIREMENTS EXHIBIT A-27
 ERICA HAMILTON COMMISSION SECRETARY Commission.Secretary@bcuc.com web site: http://www.bcuc.com VIA EMAIL rhobbs@shaw.ca January 16, 2014 SIXTH FLOOR, 900 HOWE STREET, BOX 250 VANCOUVER, B.C. CANADA V6Z
Report on Performance
 Report on Performance As a Crown corporation, ICBC continually works to align with government goals and objectives. ICBC fulfilled the expectations outlined in the Mandate Letter (see Appendix C) to which
BRITISH COLUMBIA UTILITIES COMMISSION GENERIC COST OF CAPITAL PROCEEDING EXHIBIT A2 5
 ERICA HAMILTON COMMISSION SECRETARY Commission.Secretary@bcuc.com web site: http://www.bcuc.com SIXTH FLOOR, 900 HOWE STREET, BOX 250 VANCOUVER, BC CANADA V6Z 2N3 TELEPHONE: (604) 660 4700 BC TOLL FREE:
Ms. Laurel Ross, Acting Commission Secretary and Director
 Diane Roy Vice President, Regulatory Affairs Gas Regulatory Affairs Correspondence Email: gas.regulatory.affairs@fortisbc.com Electric Regulatory Affairs Correspondence Email: electricity.regulatory.affairs@fortisbc.com
Guideline. Earthquake Exposure Sound Practices. I. Purpose and Scope. No: B-9 Date: February 2013
 Guideline Subject: No: B-9 Date: February 2013 I. Purpose and Scope Catastrophic losses from exposure to earthquakes may pose a significant threat to the financial wellbeing of many Property & Casualty
July 20, British Columbia Utilities Commission Sixth Floor 900 Howe Street Vancouver, BC V6Z 2N3
 Insurance Corporation of British Columbia 151 W. Esplanade North Vancouver BC V7M 3H9 Phone: (604) 661-2800 regaffairs @ex.icbc.com B-14 July 20, 2007 British Columbia Utilities Commission Sixth Floor
Re: FortisBC Inc. Application for Approval of Demand Side Management Expenditures for the Period of 2015 and 2016
 ERICA HAMILTON COMMISSION SECRETARY Commission.Secretary@bcuc.com web site: http://www.bcuc.com VIA EMAIL August 22, 2014 SIXTH FLOOR, 900 HOWE STREET, BOX 250 VANCOUVER, BC CANADA V6Z 2N3 TELEPHONE: (604)
BC HYDRO F2012 F2014 REVENUE REQUIREMENTS EXHIBIT A2 8
 ERICA M. HAMILTON COMMISSION SECRETARY Commission.Secretary@bcuc.com web site: http://www.bcuc.com VIA EMAIL bchydroregulatorygroup@bchydro.com March 31, 2011 SIXTH FLOOR, 900 HOWE STREET, BOX 250 VANCOUVER,
STARGAS APPLICATION TO ALTER RATES. Re: Stargas Utilities Ltd. Application to Alter Rates and Refinance
 ERICA HAMILTON COMMISSION SECRETARY Commission.Secretary@bcuc.com web site: http://www.bcuc.com SIXTH FLOOR, 900 HOWE STREET, BOX 250 VANCOUVER, BC CANADA V6Z 2N3 TELEPHONE: (604) 660 4700 BC TOLL FREE:
Final MCT Guideline, Internal Models, Assessing the Actuarial Function, and Stress Testing 2014 and Beyond
 Final MCT, Internal Models, Assessing the Actuarial Function, and Stress Testing 2014 and Beyond Presented to the 2014 Canadian Insurance Financial Forum (CIFF) May 21, 2014 Judith Roberge and Chris Townsend
July 7, 2015 File No.: /14797 BY . British Columbia Utilities Commission 6 th floor, 900 Howe Street Vancouver, BC V6Z 2N3
 C7-3 July 7, 2015 File No.: 240148.00782/14797 Matthew Ghikas Direct +1 604 631 3191 Facsimile +1 604 632 3191 mghikas@fasken.com BY E-MAIL British Columbia Utilities Commission 6 th floor, 900 Howe Street
August 29, British Columbia Utilities Commission 6 th Floor, 900 Howe Street Vancouver, BC V6Z 2N3
 Diane Roy Director, Regulatory Affairs - Gas FortisBC Energy Inc. August 29, 2012 British Columbia Utilities Commission 6 th Floor, 900 Howe Street Vancouver, BC V6Z 2N3 16705 Fraser Highway Surrey, B.C.
FORTISBC INC. RECONSIDERATION AND VARIANCE OF ORDER G PHASE 2 EXHIBIT A-4
 Patrick Wruck Commission Secretary Commission.Secretary@bcuc.com Website: www.bcuc.com Sixth Floor, 900 Howe Street Vancouver, BC Canada V6Z 2N3 TEL: (604) 660-4700 BC Toll Free: 1-800-663-1385 FAX: (604)
January 23, Via Original via Mail. British Columbia Utilities Commission 6 th Floor, 900 Howe Street Vancouver, BC V6Z 2N3
 3700 2 nd Avenue Burnaby, BC V5C 6S4 January 23, 2014 Via Email Original via Mail 6 th Floor, 900 Howe Street Vancouver, BC V6Z 2N3 Attention: Ms. Erica M. Hamilton, Commission Secretary Dear Ms. Hamilton:
Insurance Corporation of British Columbia (ICBC) 2018 Basic Insurance Rate Design Application Project No ICBC s Reply to TREAD Submission
 2018 Basic Insurance Rate Design Application Project No ICBC s Reply to TREAD Submission") September 18, 2018 File No.: 298298.00020/14797 Matthew Ghikas Direct +1 604 631 3191 Facsimile +1 604 632 3191 mghikas@fasken.com Electronic Filing British Columbia Utilities Commission Sixth Floor, 900
September 18, 2018 File No.: 298298.00020/14797 Matthew Ghikas Direct +1 604 631 3191 Facsimile +1 604 632 3191 mghikas@fasken.com Electronic Filing British Columbia Utilities Commission Sixth Floor, 900
2018/ /21 SERVICE PLAN
 2018/19 2020/21 SERVICE PLAN February 2018 For more information on the Insurance Corporation of British Columbia, contact: In the Lower Mainland 604-661-2800 Elsewhere in B.C., Canada, or the U.S. 1-800-663-3051
Attached is BC Hydro s annual filing of the Report on Demand-Side Management Activities for the 12 months ending March 31, 2012.
 Janet Fraser Chief Regulatory Officer Phone: 60-6-06 Fax: 60-6-07 bchydroregulatorygroup@bchydro.com July 0, 01 Ms. Erica Hamilton Commission Secretary British Columbia Utilities Commission Sixth Floor
Report on Performance
 The goal of these and many other ongoing efforts is to make insurance more affordable for British Columbians, by addressing rising claims costs and improving rate fairness. Report on Performance As a Crown
FEU COMMON RATES, AMALGAMATION RATE DESIGN RECONSIDERATION PHASE 2 EXHIBIT A-4
 ERICA HAMILTON COMMISSION SECRETARY Commission.Secretary@bcuc.com web site: http://www.bcuc.com VIA EMAIL gas.regulatory.affairs@fortisbc.com July 24, 2013 SIXTH FLOOR, 900 HOWE STREET, BOX 250 VANCOUVER,
Newfoundland and Labrador. Auto Insurance Review. ~ May 2018 ~
 Newfoundland and Labrador Auto Insurance Review ~ May 2018 ~ Table of Contents Introduction... 3 Non-Pecuniary Damages Payments... 3 Reform Costing Analysis... 4 Increasing the Non-Pecuniary Damages Deductible...
Interveners of Past Record (2016 General Rate Application) Manitoba Public Insurance 2017/18 General Rate Application
 Manitoba Public Insurance 2017/18 General Rate Application") June 20, 2016 VIA EMAIL ATTENTION: Interveners of Past Record (2016 General Rate Application) Re: Manitoba Public Insurance 2017/18 General Rate Application Background The 2017/18 GRA of MPI was filed
June 20, 2016 VIA EMAIL ATTENTION: Interveners of Past Record (2016 General Rate Application) Re: Manitoba Public Insurance 2017/18 General Rate Application Background The 2017/18 GRA of MPI was filed
FortisBC Inc. Annual Review of 2018 Rates Project No British Columbia Utilities Commission Information Request No. 1
 Patrick Wruck Commission Secretary Commission.Secretary@bcuc.com bcuc.com Suite 410, 900 Howe Street Vancouver, BC Canada V6Z 2N3 P: 604.660.4700 TF: 1.800.663.1385 F: 604.660.1102 September 6, 2017 Sent
REINSURANCE ON AN ASSUMPTION BASIS ( ASSUMPTION REINSURANCE )
") Index REINSURANCE ON AN ASSUMPTION BASIS ( ASSUMPTION REINSURANCE ) Legislative Authorities Sections 254 and 587.1 of the Insurance Companies Act ( ICA ) 1 Assumption Reinsurance as Compared to Indemnity
Index REINSURANCE ON AN ASSUMPTION BASIS ( ASSUMPTION REINSURANCE ) Legislative Authorities Sections 254 and 587.1 of the Insurance Companies Act ( ICA ) 1 Assumption Reinsurance as Compared to Indemnity
Subject: Profit and Rate Adequacy Review Private Passenger Automobiles
 Paula Elliott Principal Oliver Wyman 20 Bremner Boulevard Suite 800 Toronto, ON M5J 0A8 Canada Tel: +1 416 868 2000 Fax: 416 868 7002 paula.elliott@oliverwyman.com www.oliverwyman.com Cheryl Blundon, Board
W E I S B E R G C O R P O R A T I O N
 W E I S B E R G L A W C O R P O R A T I O N 2730 Ailsa Crescent North Vancouver, BC V7K 2B2 Fred J. Weisberg Barrister & Solicitor Direct: (604) 980-4069 fredweislaw@gmail.com January 4, 2018 BY EMAIL
DECISION 2018 NSUARB 145 M08678 NOVA SCOTIA UTILITY AND REVIEW BOARD IN THE MATTER OF THE INSURANCE ACT
 DECISION 2018 NSUARB 145 M08678 NOVA SCOTIA UTILITY AND REVIEW BOARD IN THE MATTER OF THE INSURANCE ACT IN THE MATTER OF AN APPLICATION by THE DOMINION OF CANADA GENERAL INSURANCE COMPANY for approval
February 11, Review of Alberta Automobile Insurance Experience. as of June 30, 2004
 February 11, 2005 Review of Alberta Automobile Insurance Experience as of June 30, 2004 Contents 1. Introduction and Executive Summary...1 Data and Reliances...2 Limitations...3 2. Summary of Findings...4
ICBC is pleased to enclose its inaugural Rate Design Application respecting universal compulsory automobile insurance (Basic insurance).
.") Insurance 151 W. Esplanade Corporation North Vancouver BC V7M 3H9 of British Phone: (604) 661-2800 Columbia regaffairs @ex.icbc.com B-1-1 March 29,2007 British Columbia Utilities Commission Sixth Floor
Insurance 151 W. Esplanade Corporation North Vancouver BC V7M 3H9 of British Phone: (604) 661-2800 Columbia regaffairs @ex.icbc.com B-1-1 March 29,2007 British Columbia Utilities Commission Sixth Floor
The Benefits of Competition in the Provision of Automobile Insurance in BC January 2018
 The Benefits of Competition in the Provision of Automobile Insurance in BC January 2018 Prepared for the Insurance Bureau of Canada CONTENTS 1 Executive Summary... 3 1.1 Key Findings... 3 1.2 Minor Injury
PRESENTATION TO FIXED INCOME INVESTORS BMO CAPITAL MARKETS. June 12, 2014
 PRESENTATION TO FIXED INCOME INVESTORS BMO CAPITAL MARKETS June 12, 2014 Forward-looking and non-ifrs statements This presentation relating to (the Company, Genworth Canada or MIC ) includes certain forward-looking
AIRB 2017 Annual Review Bill Adams, Vice-President, Western Ryan Stein, Director of Policy August 15, 2017
 AIRB 2017 Annual Review Bill Adams, Vice-President, Western Ryan Stein, Director of Policy August 15, 2017 Annual Review 2017 Agenda Overview of Alberta s auto insurance market Analysis of bodily injury
Re: Pacific Northern Gas (N.E.) Ltd. Project No /Order G Revenue Requirements Application
 Ltd. Project No /Order G Revenue Requirements Application") ERICA HAMILTON COMMISSION SECRETARY Commission.Secretary@bcuc.com web site: http://www.bcuc.com SIXTH FLOOR, 900 HOWE STREET, BOX 250 VANCOUVER, BC CANADA V6Z 2N3 TELEPHONE: (604) 660-4700 BC TOLL FREE:
ERICA HAMILTON COMMISSION SECRETARY Commission.Secretary@bcuc.com web site: http://www.bcuc.com SIXTH FLOOR, 900 HOWE STREET, BOX 250 VANCOUVER, BC CANADA V6Z 2N3 TELEPHONE: (604) 660-4700 BC TOLL FREE:
Dynamic Solvency Test
 Dynamic Solvency Test Joint regional seminar in Asia, 2005 Asset Liability Management Evolution of DST International financial reporting changed to a GAAP basis Actuarial reserves were no longer good and
B.C. Utilities Commission File No.: 4.2 (2015) 6 th Floor Howe Street Vancouver, B.C. V6Z 2N3
 6 th Floor Howe Street Vancouver, B.C. V6Z 2N3") B-3 Janet P. Kennedy Vice President, Regulatory Affairs & Gas Supply Pacific Northern Gas Ltd. 950, 1185 West Georgia Street Vancouver, BC V6E 4E6 Tel: (604) 691-5680 Fax: (604) 697-6210 Email: jkennedy@png.ca
B-3 Janet P. Kennedy Vice President, Regulatory Affairs & Gas Supply Pacific Northern Gas Ltd. 950, 1185 West Georgia Street Vancouver, BC V6E 4E6 Tel: (604) 691-5680 Fax: (604) 697-6210 Email: jkennedy@png.ca
1. Background. March 7, 2014
 Janet Fraser Chief Regulatory Officer Phone: 604-623-4046 Fax: 604-623-4407 bchydroregulatorygroup@bchydro.com March 7, 2014 Ms. Erica Hamilton Commission Secretary British Columbia Utilities Commission
At the Commission's oral hearing for ICBC's 2006 Revenue Requirement Application, ICBC will be putting forward witness panels in the following order.
 lnsurance Corporation of British Colum bia March,00 W. Esplanade, Ste. 0 North Vancouver BC VM H Phone: (0) -00 regaffairs@ex.icbc.com B- British Columbia Utilities Commission Sixth Floor 00 Howe Street
Volume: 3, Actuarial Reports Page No.: 22, Oct report 4, Feb report
 CAC (MPI) CAC (MPI) 1-1 CAC (MPI) 1-1 Volume: 3, Actuarial Reports Page No.: 22, Oct report 4, Feb report Topic: Sub Topic: Issue: Actuarial Reports Ensuring the reasonableness of the Actuarial Reports
BC HYDRO F2017 F2019 REVENUE REQUIREMENTS EXHIBIT A-29
 Patrick Wruck Commission Secretary Commission.Secretary@bcuc.com Website: www.bcuc.com Sixth Floor, 900 Howe Street Vancouver, BC Canada V6Z 2N3 TEL: (604) 660-4700 BC Toll Free: 1-800-663-1385 FAX: (604)
Supervisory Framework JUNE 2012
 Supervisory Framework JUNE 2012 The Financial Institutions Commission of British Columbia (FICOM) is a regulatory agency of the Ministry of Finance, established in 1989 to contribute to the safety and
QUARTERLY VALUATION HIGHLIGHTS RISK SHARING POOLS. as at September 30, Ontario Alberta Grid and Alberta Non Grid New Brunswick and Nova Scotia
 QUARTERLY VALUATION HIGHLIGHTS RISK SHARING POOLS as at September 30, 2018 Ontario Alberta Grid and Alberta NonGrid New Brunswick and Nova Scotia FA Actuarial 1/16/2019 Should you require any further information,
ORDER NUMBER G IN THE MATTER OF the Utilities Commission Act, RSBC 1996, Chapter 473. and
 Suite 410, 900 Howe Street Vancouver, BC Canada V6Z 2N3 bcuc.com P: 604.660.4700 TF: 1.800.663.1385 F: 604.660.1102 ORDER NUMBER G-48-19 IN THE MATTER OF the Utilities Commission Act, RSBC 1996, Chapter
EDUCATIONAL NOTE DYNAMIC CAPITAL ADEQUACY TESTING PROPERTY AND CASUALTY COMMITTEE ON SOLVENCY STANDARDS FOR FINANCIAL INSTITUTIONS
 EDUCATIONAL NOTE Educational notes are not binding. They are provided to help actuaries perform actuarial work and may include eamples, eplanations and/or options. DYNAMIC CAPITAL ADEQUACY TESTING PROPERTY
Genworth MI Canada Inc. Management s Discussion and Analysis For the first quarter ended March 31, 2011
 Management s Discussion and Analysis For the first quarter ended March 31, 2011 May 2, 2011 ( Genworth Canada or the Company ) completed its initial public offering ( IPO ) on July 7, 2009. The full three-month
FORTISBC ENERGY PROPOSAL FOR DEPRECIATION & NET SALVAGE RATE CHANGES EXHIBIT A2-3
 Laurel Ross Acting Commission Secretary Commission.Secretary@bcuc.com Website: www.bcuc.com Sixth Floor, 00 Howe Street Vancouver, BC Canada VZ N TEL: (0) 0-00 BC Toll Free: -00-- FAX: (0) 0- Log No. VIA
Cost Implications of Changes to the Minor Injury Regulations Nova Scotia Part I Summary of Findings Prepared by Oliver, Wyman Limited April 27, 2010
 Cost Implications of Changes to the Minor Injury Regulations Nova Scotia Part I Summary of Findings Prepared by Oliver, Wyman Limited April 27, 2010 Introduction Oliver, Wyman Limited (Oliver Wyman) was
Re: Insurance Corporation of British Columbia 2014 Revenue Requirements Application Project No
 14952 95A Avenue Surrey, British Columbia. V3R 7T6 C1-6 21 st. October 2014 Ms. Erica Hamilton Commission Secretary British Columbia Utilities Commission Sixth Floor, 900 Howe Street Vancouver, British
Prudential Standard APS 117 Capital Adequacy: Interest Rate Risk in the Banking Book (Advanced ADIs)
") Prudential Standard APS 117 Capital Adequacy: Interest Rate Risk in the Banking Book (Advanced ADIs) Objective and key requirements of this Prudential Standard This Prudential Standard sets out the requirements
Prudential Standard APS 117 Capital Adequacy: Interest Rate Risk in the Banking Book (Advanced ADIs) Objective and key requirements of this Prudential Standard This Prudential Standard sets out the requirements
B.C. Utilities Commission File No.: 4.2.7(2013) 6th Floor Howe Street Vancouver, BC V6Z 2N3
 6th Floor Howe Street Vancouver, BC V6Z 2N3") Janet P. Kennedy Vice President, Regulatory Affairs & Gas Supply Pacific Northern Gas Ltd. Suite 950 1185 West Georgia Street Vancouver, BC V6E 4E6 Tel: (604) 691-5680 Fax: (604) 697-6210 Email: jkennedy@png.ca
Janet P. Kennedy Vice President, Regulatory Affairs & Gas Supply Pacific Northern Gas Ltd. Suite 950 1185 West Georgia Street Vancouver, BC V6E 4E6 Tel: (604) 691-5680 Fax: (604) 697-6210 Email: jkennedy@png.ca
September 26, Via Original via Mail. British Columbia Utilities Commission Sixth Floor 900 Howe Street Vancouver, B.C.
 B-8 Diane Roy Director, Regulatory Affairs FortisBC Energy 16705 Fraser Highway Surrey, B.C. V4N 0E8 Tel: (604) 576-7349 Cell: (604) 908-2790 Fax: (604) 576-7074 Email: diane.roy@fortisbc.com www.fortisbc.com
Solvency Control Levels
 International Association of Insurance Supervisors Solvency, Solvency Assessments and Actuarial Issues Subcommittee Draft Guidance Paper Solvency Control Levels Contents I. Introduction...1 II. Minimum
MANITOBA PUBLIC INSURANCE
 MANITOBA PUBLIC INSURANCE TESTIMONY OF LUKE JOHNSTON CHIEF ACTUARY & DIRECTOR OF PRICING & ECONOMICS Good morning, Mr. Chairman, members of the Board, ladies and gentlemen. My name is Luke Johnston. I
FortisBC Inc. Application for an Exempt Residential Rate
 B-1 Corey Sinclair Manager, Regulatory Affairs FortisBC Inc. Suite 100-1975 Springfield Road Kelowna, BC V1Y 7V7 Ph: (250) 469-8038 Fax: 1-866-335-6295 electricity.regulatory.affairs@fortisbc.com www.fortisbc.com
ACTUARIAL HIGHLIGHTS NEW BRUNSWICK RISK SHARING POOL APRIL 2014 OPERATIONAL REPORT
 NEW BRUNSWICK RISK SHARING POOL APRIL 2014 OPERATIONAL REPORT ACTUARIAL HIGHLIGHTS Related Bulletin: F14-033 New Brunswick RSP April 2014 Operational Report For your convenience, bookmarks have been added
Simon Fraser University Pension Plan for Administrative/Union Staff
 Actuarial Report on the Simon Fraser University Pension Plan for Administrative/Union Staff as at 31 December 2010 Vancouver, B.C. September 13, 2011 Contents Highlights and Actuarial Opinion... 1 Appendix
Practical application of Liquidity Premium to the valuation of insurance liabilities and determination of capital requirements
 28 April 2011 Practical application of Liquidity Premium to the valuation of insurance liabilities and determination of capital requirements 1. Introduction CRO Forum Position on Liquidity Premium The
RE: New York Workers Compensation Experience Rating Plan Revisions Effective October 1, 2013
 B U L L E T I N 733 Third Ave New York, New York 10017 Tel: (212) 697-3535 www.nycirb.org May 1, 2013 Contact: Mr. Ziv Kimmel Vice President & Chief Actuary Ext. 117, Zkimmel@nycirb.org R.C. 2334 To: The
Aggregate Margin Task Force: LATF Update
 Aggregate Margin Task Force: LATF Update Mark Birdsall, FSA, MAAA William Hines, FSA, MAAA Tricia Matson, MAAA, FSA Aggregate Margin Task Force American Academy of Actuaries All Rights Reserved. Agenda
ICBC 2018 BASIC INSURANCE RATE DESIGN EXHIBIT
 C1-2 B.C. UTILITIES COMMISSION -Project No. 1598968 ICBC 2018 Basic Insurance Rate Design Application Information Requests Submitted by Richard McCandless August 28, 2018. Note on terminology. Unless specified,
Dynamic Risk Modelling
 Dynamic Risk Modelling Prepared by Rutger Keisjer, Martin Fry Presented to the Institute of Actuaries of Australia Accident Compensation Seminar 20-22 November 2011 Brisbane This paper has been prepared
GN47: Stochastic Modelling of Economic Risks in Life Insurance
 GN47: Stochastic Modelling of Economic Risks in Life Insurance Classification Recommended Practice MEMBERS ARE REMINDED THAT THEY MUST ALWAYS COMPLY WITH THE PROFESSIONAL CONDUCT STANDARDS (PCS) AND THAT
Richard T.Landale A, Avenue Surrey, British Columbia. V3R 7T6. 15 th. March 2016
 Richard T.Landale 14952 95A, Avenue Surrey, British Columbia. V3R 7T6 15 th. March 2016 Ms. Laurel Ross Acting Commission Secretary and Director British Columbia Utilities Commission Sixth Floor, 900 Howe
British Columbia Hydro and Power Authority (BC Hydro) Application for Approval of New Power Purchase Agreement (PPA) with FortisBC Inc.
 Application for Approval of New Power Purchase Agreement (PPA) with FortisBC Inc.") C1-24 Reply Attention of: Ludmila B. Herbst Direct Dial Number: (604) 661-1722 Email Address: lherbst@farris.com Our File No.: 05497-0224 January 20, 2014 BY EMAIL British Columbia Utilities Commission
C1-24 Reply Attention of: Ludmila B. Herbst Direct Dial Number: (604) 661-1722 Email Address: lherbst@farris.com Our File No.: 05497-0224 January 20, 2014 BY EMAIL British Columbia Utilities Commission
INFORMATION RELEASE BCUC responds to BC Hydro s comments on the Site C Inquiry Final Report November 28, 2017
 INFORMATION RELEASE BCUC responds to BC Hydro s comments on the Site C Inquiry Final Report November 28, 2017 Vancouver The British Columbia Utilities Commission (BCUC) has responded to the letter from
Aviva Canada s Submission to the. Alberta Insurance Rate Board Annual Review. July 24, 2018
 Aviva Canada s Submission to the Alberta Insurance Rate Board 2018 Annual Review July 24, 2018 AIRB 2018 Annual Review Page 1 Aviva Canada s Submission to the Alberta Insurance Rate Board Aviva Canada
included in the survey is published in the Quarterly Reports and the Budget and Fiscal Plan.
 Information Request No. 2.23.0(a) Dated: 5 April 2004 23.0 Reference: BC Hydro letter of March 29, 2004 indicating, among other things, that BC Hydro is prepared to call Mr. Robert Fairholm to testify
Alberta Annual Review of Automobile Insurance Loss Experience
 Alberta Annual Review of Automobile Insurance Loss Experience July 2017 PRIORY SQUARE, GUELPH, ON N1H 6P8 T: (519) 824-4400 F: (519) 824-0599 www.cooperators.ca Friday, July 21, 2017 Automobile Insurance
RTL Intervener Argument Feb doc Page 1 of 9
 REQUESTOR NAME: Richard T. Landale BCUC Intervener C2 TO: INSURANCE CORPORATION OF BRITISH COLUMBIA DATE: February 27 th. 2017 PROJECT NO: 3698890 BCUC APPLICATION NAME: ICBC 2016 REVENUE REQUIREMENT APPLICATION
Regulatory Capital Filing Certification
 Educational Note Regulatory Capital Filing Certification Committee on Risk Management and Capital Requirements May 2006 Document 206049 Ce document est disponible en français 2006 Canadian Institute of
IFRS 9 Financial Instruments and Disclosures
 Guideline Subject: IFRS 9 Financial Instruments and Disclosures Category: Accounting Date: June 2016 Introduction This guideline provides application guidance to Federally Regulated Entities (FREs) applying
Revised Educational Note. Premium Liabilities. Committee on Property and Casualty Insurance Financial Reporting. March 2015.
 Revised Educational Note Premium Liabilities Committee on Property and Casualty Insurance Financial Reporting March 2015 Document 215017 Ce document est disponible en français 2015 Canadian Institute of
1) Role of the DCAT and 2) Interest Rate Forecasting in the 2019 GRA
 Role of the DCAT and 2) Interest Rate Forecasting in the 2019 GRA") 1) Role of the DCAT and 2) Interest Rate Forecasting in the 2019 GRA Consumers' Association of Canada (Manitoba) Submitted by the Public Interest Law Centre Co-Authored by Dr. Wayne Simpson and Ms Andrea
1) Role of the DCAT and 2) Interest Rate Forecasting in the 2019 GRA Consumers' Association of Canada (Manitoba) Submitted by the Public Interest Law Centre Co-Authored by Dr. Wayne Simpson and Ms Andrea
Regulatory Impact Analysis: Cost Recovery Impact Statement - Overview of Required Information 1
 ACC Levies for 2019/20 and 2020/21 Cost Recovery Impact Statement Agency Disclosure Statement This Cost Recovery Impact Statement has been prepared by the Ministry of Business, Innovation and Employment.
Protecting Canadians' Long Term Disability Benefits. CLHIA Policy Paper
 Protecting Canadians' Long Term Disability Benefits CLHIA Policy Paper September 2010 Introduction: Ensuring that all Canadian employees covered by long term disability 1 (LTD) plans continue to receive
DECISION 2017 NSUARB 65 M07903 NOVA SCOTIA UTILITY AND REVIEW BOARD IN THE MATTER OF THE INSURANCE ACT. -and-
 DECISION 2017 NSUARB 65 M07903 NOVA SCOTIA UTILITY AND REVIEW BOARD IN THE MATTER OF THE INSURANCE ACT -and- IN THE MATTER OF AN APPLICATION by CAA INSURANCE COMPANY for approval to modify its rates and
Looking Ahead PROJECTING ONTARIO S PENSION BENEFITS GUARANTEE FUND
 Looking Ahead PROJECTING ONTARIO S PENSION BENEFITS GUARANTEE FUND The Pension Benefits Guarantee Fund (PBGF) is governed by the Ontario Pension Benefits Act ( the Act ) and regulations made under the
Stochastic Analysis Of Long Term Multiple-Decrement Contracts
 Stochastic Analysis Of Long Term Multiple-Decrement Contracts Matthew Clark, FSA, MAAA and Chad Runchey, FSA, MAAA Ernst & Young LLP January 2008 Table of Contents Executive Summary...3 Introduction...6
Creative Energy Response to BCOAPO IR 1 May 30, 2018
 B-8 Creative Energy Response to BCOAPO IR 1 May 30, 2018 1.0 Reference: Exhibit B1, Application, page 1, 2017 Load Forecast The applied for method for setting rates for Steam customers is simple; it begins
For further information, please contact Fred James at or by at
 Janet Fraser Chief Regulatory Officer Phone: 604-623-4046 Fax: 604-623-4407 bchydroregulatorygroup@bchydro.com February 28, 2014 Ms. Erica Hamilton Commission Secretary British Columbia Utilities Commission
Property & Casualty Dynamic Capital Adequacy Testing and Stress Testing The Canadian Framework
 Property & Casualty Dynamic Capital Adequacy Testing and Stress Testing The Canadian Framework Caribbean Actuarial Conference December 5, 2009 Xavier Bénarosch, FCAS, FCIA, CFA, FRM Table of contents Concept
Framework for a New Standard Approach to Setting Capital Requirements. Joint Committee of OSFI, AMF, and Assuris
 Framework for a New Standard Approach to Setting Capital Requirements Joint Committee of OSFI, AMF, and Assuris Table of Contents Background... 3 Minimum Continuing Capital and Surplus Requirements (MCCSR)...