STOCHASTIC MODELING OF HURRICANE DAMAGE UNDER CLIMATE CHANGE
|
|
|
- Poppy Fox
- 6 years ago
- Views:
Transcription
1 STOCHASTIC MODELING OF HURRICANE DAMAGE UNDER CLIMATE CHANGE Rick Katz Institute for Study of Society and Environment National Center for Atmospheric Research Boulder, CO USA Web site: Talk:
2 QUOTE Emil Gumbel (1941): "Il est impossible que l'improbable n'arrive jamais."

3
4
5 OUTLINE (1) Economic Damage from Hurricanes (2) Stochastic Model for Damage (3) Effects of El Niño (4) Trends in Extreme Hurricanes (5) Unresolved Issues
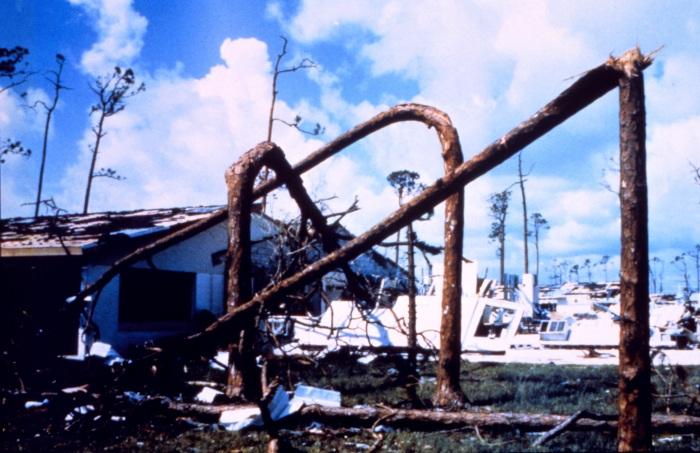
6 (1) Economic Damage from Hurricanes Data -- Pielke and Landsea (1998) Web site: sciencepolicy.colorado.edu/homepages/roger_pielke/ hp_roger/hurr_norm/data.html Normalized Data -- Adjusted for inflation & changes in societal vulnerability -- Residual intended to reflect only climate
7
8 (2) Stochastic Model for Damage Random Sum Model -- Embrechts et al. (1997): Bread and butter of insurance mathematics Number of Events -- Poisson distribution (Trend? Covariates?) Damage for Individual Storm -- Lognormal distribution (Trend? Covariates?) -- Generalized Pareto distribution for upper tail
9 Statistics of Random Sums -- Notation N(t) number of events in tth yr X k damage from kth event in tth yr (i. i. d.) S(t) = X 1 + X X N(t) total damage in tth yr -- Mean of total annual damage E[S(t)] = E[N(t)] E(X k ) -- Variance of total annual damage Var[S(t)] = E[N(t)] Var(X k ) + Var[N(t)] [E(X k )] 2

10
11
12
13
14 Heavy Tail -- Estimated shape parameter of GP distribution 0.5 Origin of Heavy Tail -- Underlying geophysical phenomenon? -- Inherent feature of distribution of income or wealth? (Recall origin of Pareto distribution) Chance Mechanisms -- Mixture of light-tailed distributions can induce heavy-tailed distribution (e. g., exponential to Pareto)
15 (3) Effects of El Niño El Niño Phenomenon -- Statistical characteristics ( quasi-periodic ) -- Teleconnections (interannual variability) Connections to Hurricane Statistics -- Hurricane frequency -- Hurricane intensity -- Hurricane path (North Atlantic Oscillation)
16
17
18 Tail Dependence on El Niño State -- Unable to detect effect on parameters of generalized Pareto distribution -- Unable to detect effect on frequency of high damage (parameter of Poisson distribution) Inconsistency between Extremal & Non-Extremal Modeling -- Issue of parsimony -- Chance mechanisms -- Penultimate approximations
19 (4) Trends in Extreme Hurricanes Background -- Trend in frequency of intense hurricanes (Along with trends in Sea Surface Temperature) Damage Data -- Adjusted for inflation & societal vulnerability -- Lack of any apparent trend
20 Hurricane Damage Data -- U. S. National Hurricane Center most damaging hurricanes ( ) Unadjusted damage data (Only corrected for inflation, 2004 US billion $) Adjusted damage data (Adjusted for both inflation & changes in societal vulnerability)
21 Unadjusted Hurricane Damage 40 Damage (billion $) Year
22 Adjusted Hurricane Damage 100 Damage (billion $) Year
23 Annual Number of Events (Adjusted Damage) -- Poisson distribution (With trend?) Rate parameter λ(t): log λ(t) = λ 0 + λ 1 t MLE of λ 1 = ( 1.2 % per yr increase) LRT: P-value 0.057
24 Adjusted Hurricane Frequency 4 3 Frequency Year
25 Adjusted Hurricane Frequency 4 Observed Poisson trend 3 Frequency Year
26 Adjusted Damage for Individual Storm -- Generalized Pareto (GP) distribution for upper tail Excess in adjusted damage over threshold of $10 billion (17 storms) Heavy upper tail: Shape parameter ξ 0.3 (If include damage from Hurricane Katrina in 2005: ξ 0.5)
27 Adjusted Hurricane Damage: Q-Q Plot Katrina Observed Damage (billion $) Expected Damage (billion $)
28 Trend in Adjusted Damage -- GEV distribution fit to damage for all 30 storms (Rather than GPD to highest 17 storms) Linear trend in location parameter μ(t): μ(t) = μ 0 + μ 1 t MLE of μ 1 = billion $ per yr LRT: P-value (Shape parameter ξ 0.5)
29 (5) Unresolved Issues Trends -- Meteorology versus impacts El Niño Effects -- Frequency effect stable -- Damage effect unstable?
WEATHER EXTREMES AND CLIMATE RISK: STOCHASTIC MODELING OF HURRICANE DAMAGE
 WEATHER EXTREMES AND CLIMATE RISK: STOCHASTIC MODELING OF HURRICANE DAMAGE Rick Katz Institute for Study of Society and Environment National Center for Atmospheric Research Boulder, CO USA Email: rwk@ucar.edu
EVA Tutorial #1 BLOCK MAXIMA APPROACH IN HYDROLOGIC/CLIMATE APPLICATIONS. Rick Katz
 1 EVA Tutorial #1 BLOCK MAXIMA APPROACH IN HYDROLOGIC/CLIMATE APPLICATIONS Rick Katz Institute for Mathematics Applied to Geosciences National Center for Atmospheric Research Boulder, CO USA email: rwk@ucar.edu
An Introduction to Statistical Extreme Value Theory
 An Introduction to Statistical Extreme Value Theory Uli Schneider Geophysical Statistics Project, NCAR January 26, 2004 NCAR Outline Part I - Two basic approaches to extreme value theory block maxima,
NEWCASTLE UNIVERSITY SCHOOL OF MATHEMATICS & STATISTICS SEMESTER /2013 MAS8304. Environmental Extremes: Mid semester test
 NEWCASTLE UNIVERSITY SCHOOL OF MATHEMATICS & STATISTICS SEMESTER 2 2012/2013 Environmental Extremes: Mid semester test Time allowed: 50 minutes Candidates should attempt all questions. Marks for each question
QUANTIFYING THE RISK OF EXTREME EVENTS IN A CHANGING CLIMATE. Rick Katz. Joint Work with Holger Rootzén Chalmers and Gothenburg University, Sweden
 QUANTIFYING THE RISK OF EXTREME EVENTS IN A CHANGING CLIMATE Rick Katz Joint Work with Holger Rootzén Chalmers and Gothenburg University, Sweden email: rwk@ucar.edu Talk: www.isse.ucar.edu/staff/katz/docs/pdf/qrisk.pdf
Modeling the extremes of temperature time series. Debbie J. Dupuis Department of Decision Sciences HEC Montréal
 Modeling the extremes of temperature time series Debbie J. Dupuis Department of Decision Sciences HEC Montréal Outline Fig. 1: S&P 500. Daily negative returns (losses), Realized Variance (RV) and Jump
Generalized MLE per Martins and Stedinger
 Generalized MLE per Martins and Stedinger Martins ES and Stedinger JR. (March 2000). Generalized maximum-likelihood generalized extreme-value quantile estimators for hydrologic data. Water Resources Research
Analysis of extreme values with random location Abstract Keywords: 1. Introduction and Model
 Analysis of extreme values with random location Ali Reza Fotouhi Department of Mathematics and Statistics University of the Fraser Valley Abbotsford, BC, Canada, V2S 7M8 Ali.fotouhi@ufv.ca Abstract Analysis
AN EXTREME VALUE APPROACH TO PRICING CREDIT RISK
 AN EXTREME VALUE APPROACH TO PRICING CREDIT RISK SOFIA LANDIN Master s thesis 2018:E69 Faculty of Engineering Centre for Mathematical Sciences Mathematical Statistics CENTRUM SCIENTIARUM MATHEMATICARUM
Financial Risk Forecasting Chapter 9 Extreme Value Theory
 Financial Risk Forecasting Chapter 9 Extreme Value Theory Jon Danielsson 2017 London School of Economics To accompany Financial Risk Forecasting www.financialriskforecasting.com Published by Wiley 2011
Generalized Additive Modelling for Sample Extremes: An Environmental Example
 Generalized Additive Modelling for Sample Extremes: An Environmental Example V. Chavez-Demoulin Department of Mathematics Swiss Federal Institute of Technology Tokyo, March 2007 Changes in extremes? Likely
Measuring Financial Risk using Extreme Value Theory: evidence from Pakistan
 Measuring Financial Risk using Extreme Value Theory: evidence from Pakistan Dr. Abdul Qayyum and Faisal Nawaz Abstract The purpose of the paper is to show some methods of extreme value theory through analysis
Frequency Distribution Models 1- Probability Density Function (PDF)
") Models 1- Probability Density Function (PDF) What is a PDF model? A mathematical equation that describes the frequency curve or probability distribution of a data set. Why modeling? It represents and summarizes
Models 1- Probability Density Function (PDF) What is a PDF model? A mathematical equation that describes the frequency curve or probability distribution of a data set. Why modeling? It represents and summarizes
Modelling Environmental Extremes
 19th TIES Conference, Kelowna, British Columbia 8th June 2008 Topics for the day 1. Classical models and threshold models 2. Dependence and non stationarity 3. R session: weather extremes 4. Multivariate
Modelling Environmental Extremes
 19th TIES Conference, Kelowna, British Columbia 8th June 2008 Topics for the day 1. Classical models and threshold models 2. Dependence and non stationarity 3. R session: weather extremes 4. Multivariate
Advanced Extremal Models for Operational Risk
 Advanced Extremal Models for Operational Risk V. Chavez-Demoulin and P. Embrechts Department of Mathematics ETH-Zentrum CH-8092 Zürich Switzerland http://statwww.epfl.ch/people/chavez/ and Department of
UNIVERSITY OF OSLO. Please make sure that your copy of the problem set is complete before you attempt to answer anything.
 UNIVERSITY OF OSLO Faculty of Mathematics and Natural Sciences Examination in: STK4540 Non-Life Insurance Mathematics Day of examination: Wednesday, December 4th, 2013 Examination hours: 14.30 17.30 This
GPD-POT and GEV block maxima
 Chapter 3 GPD-POT and GEV block maxima This chapter is devoted to the relation between POT models and Block Maxima (BM). We only consider the classical frameworks where POT excesses are assumed to be GPD,
2002 Statistical Research Center for Complex Systems International Statistical Workshop 19th & 20th June 2002 Seoul National University
 2002 Statistical Research Center for Complex Systems International Statistical Workshop 19th & 20th June 2002 Seoul National University Modelling Extremes Rodney Coleman Abstract Low risk events with extreme
Analysis of the Oil Spills from Tanker Ships. Ringo Ching and T. L. Yip
 Analysis of the Oil Spills from Tanker Ships Ringo Ching and T. L. Yip The Data Included accidents in which International Oil Pollution Compensation (IOPC) Funds were involved, up to October 2009 In this
Risk Management and Time Series
 IEOR E4602: Quantitative Risk Management Spring 2016 c 2016 by Martin Haugh Risk Management and Time Series Time series models are often employed in risk management applications. They can be used to estimate
**BEGINNING OF EXAMINATION** A random sample of five observations from a population is:
 **BEGINNING OF EXAMINATION** 1. You are given: (i) A random sample of five observations from a population is: 0.2 0.7 0.9 1.1 1.3 (ii) You use the Kolmogorov-Smirnov test for testing the null hypothesis,
Fundamentals of Catastrophe Modeling. CAS Ratemaking & Product Management Seminar Catastrophe Modeling Workshop March 15, 2010
 Fundamentals of Catastrophe Modeling CAS Ratemaking & Product Management Seminar Catastrophe Modeling Workshop March 15, 2010 1 ANTITRUST NOTICE The Casualty Actuarial Society is committed to adhering
Introduction to Algorithmic Trading Strategies Lecture 8
 Introduction to Algorithmic Trading Strategies Lecture 8 Risk Management Haksun Li haksun.li@numericalmethod.com www.numericalmethod.com Outline Value at Risk (VaR) Extreme Value Theory (EVT) References
The impact of present and future climate changes on the international insurance & reinsurance industry
 Copyright 2007 Willis Limited all rights reserved. The impact of present and future climate changes on the international insurance & reinsurance industry Fiona Shaw MSc. ACII Executive Director Willis
UNIVERSITY OF OSLO. The Poisson model is a common model for claim frequency.
 UNIVERSITY OF OSLO Faculty of mathematics and natural sciences Candidate no Exam in: STK 4540 Non-Life Insurance Mathematics Day of examination: December, 9th, 2015 Examination hours: 09:00 13:00 This
The stochastic calculus
 Gdansk A schedule of the lecture Stochastic differential equations Ito calculus, Ito process Ornstein - Uhlenbeck (OU) process Heston model Stopping time for OU process Stochastic differential equations
Homework Problems Stat 479
 Chapter 10 91. * A random sample, X1, X2,, Xn, is drawn from a distribution with a mean of 2/3 and a variance of 1/18. ˆ = (X1 + X2 + + Xn)/(n-1) is the estimator of the distribution mean θ. Find MSE(
CATASTROPHIC RISK AND INSURANCE Hurricane and Hydro meteorological Risks
 CATASTROPHIC RISK AND INSURANCE Hurricane and Hydro meteorological Risks INTRODUCTORY REMARKS OECD IAIS ASSAL VII Conference on Insurance Regulation and Supervision in Latin America Lisboa, 24-28 April
Statistical methods for financial models driven by Lévy processes
 Statistical methods for financial models driven by Lévy processes José Enrique Figueroa-López Department of Statistics, Purdue University PASI Centro de Investigación en Matemátics (CIMAT) Guanajuato,
Quantitative Models for Operational Risk
 Quantitative Models for Operational Risk Paul Embrechts Johanna Nešlehová Risklab, ETH Zürich (www.math.ethz.ch/ embrechts) (www.math.ethz.ch/ johanna) Based on joint work with V. Chavez-Demoulin, H. Furrer,
Non-pandemic catastrophe risk modelling: Application to a loan insurance portfolio
 w w w. I C A 2 0 1 4. o r g Non-pandemic catastrophe risk modelling: Application to a loan insurance portfolio Esther MALKA April 4 th, 2014 Plan I. II. Calibrating severity distribution with Extreme Value
ADVANCED OPERATIONAL RISK MODELLING IN BANKS AND INSURANCE COMPANIES
 Small business banking and financing: a global perspective Cagliari, 25-26 May 2007 ADVANCED OPERATIONAL RISK MODELLING IN BANKS AND INSURANCE COMPANIES C. Angela, R. Bisignani, G. Masala, M. Micocci 1
Stochastic Models. Statistics. Walt Pohl. February 28, Department of Business Administration
 Stochastic Models Statistics Walt Pohl Universität Zürich Department of Business Administration February 28, 2013 The Value of Statistics Business people tend to underestimate the value of statistics.
BROWNIAN MOTION Antonella Basso, Martina Nardon
 BROWNIAN MOTION Antonella Basso, Martina Nardon basso@unive.it, mnardon@unive.it Department of Applied Mathematics University Ca Foscari Venice Brownian motion p. 1 Brownian motion Brownian motion plays
Two hours. To be supplied by the Examinations Office: Mathematical Formula Tables and Statistical Tables THE UNIVERSITY OF MANCHESTER
 Two hours MATH20802 To be supplied by the Examinations Office: Mathematical Formula Tables and Statistical Tables THE UNIVERSITY OF MANCHESTER STATISTICAL METHODS Answer any FOUR of the SIX questions.
Linda Allen, Jacob Boudoukh and Anthony Saunders, Understanding Market, Credit and Operational Risk: The Value at Risk Approach
 P1.T4. Valuation & Risk Models Linda Allen, Jacob Boudoukh and Anthony Saunders, Understanding Market, Credit and Operational Risk: The Value at Risk Approach Bionic Turtle FRM Study Notes Reading 26 By
Analysis of truncated data with application to the operational risk estimation
 Analysis of truncated data with application to the operational risk estimation Petr Volf 1 Abstract. Researchers interested in the estimation of operational risk often face problems arising from the structure
Mongolia s TOP-20 Index Risk Analysis, Pt. 3
 Mongolia s TOP-20 Index Risk Analysis, Pt. 3 Federico M. Massari March 12, 2017 In the third part of our risk report on TOP-20 Index, Mongolia s main stock market indicator, we focus on modelling the right
Modeling Co-movements and Tail Dependency in the International Stock Market via Copulae
 Modeling Co-movements and Tail Dependency in the International Stock Market via Copulae Katja Ignatieva, Eckhard Platen Bachelier Finance Society World Congress 22-26 June 2010, Toronto K. Ignatieva, E.
Reliability and Risk Analysis. Survival and Reliability Function
 Reliability and Risk Analysis Survival function We consider a non-negative random variable X which indicates the waiting time for the risk event (eg failure of the monitored equipment, etc.). The probability
Stochastic model of flow duration curves for selected rivers in Bangladesh
 Climate Variability and Change Hydrological Impacts (Proceedings of the Fifth FRIEND World Conference held at Havana, Cuba, November 2006), IAHS Publ. 308, 2006. 99 Stochastic model of flow duration curves
INDIAN INSTITUTE OF SCIENCE STOCHASTIC HYDROLOGY. Lecture -5 Course Instructor : Prof. P. P. MUJUMDAR Department of Civil Engg., IISc.
 INDIAN INSTITUTE OF SCIENCE STOCHASTIC HYDROLOGY Lecture -5 Course Instructor : Prof. P. P. MUJUMDAR Department of Civil Engg., IISc. Summary of the previous lecture Moments of a distribubon Measures of
Case Study: Heavy-Tailed Distribution and Reinsurance Rate-making
 Case Study: Heavy-Tailed Distribution and Reinsurance Rate-making May 30, 2016 The purpose of this case study is to give a brief introduction to a heavy-tailed distribution and its distinct behaviors in
Estimation and Application of Ranges of Reasonable Estimates. Charles L. McClenahan, FCAS, ASA, MAAA
 Estimation and Application of Ranges of Reasonable Estimates Charles L. McClenahan, FCAS, ASA, MAAA 213 Estimation and Application of Ranges of Reasonable Estimates Charles L. McClenahan INTRODUCTION Until
Contents Utility theory and insurance The individual risk model Collective risk models
 Contents There are 10 11 stars in the galaxy. That used to be a huge number. But it s only a hundred billion. It s less than the national deficit! We used to call them astronomical numbers. Now we should
QQ PLOT Yunsi Wang, Tyler Steele, Eva Zhang Spring 2016
 QQ PLOT INTERPRETATION: Quantiles: QQ PLOT Yunsi Wang, Tyler Steele, Eva Zhang Spring 2016 The quantiles are values dividing a probability distribution into equal intervals, with every interval having
1. You are given the following information about a stationary AR(2) model:
 model:") Fall 2003 Society of Actuaries **BEGINNING OF EXAMINATION** 1. You are given the following information about a stationary AR(2) model: (i) ρ 1 = 05. (ii) ρ 2 = 01. Determine φ 2. (A) 0.2 (B) 0.1 (C) 0.4
Fall 2003 Society of Actuaries **BEGINNING OF EXAMINATION** 1. You are given the following information about a stationary AR(2) model: (i) ρ 1 = 05. (ii) ρ 2 = 01. Determine φ 2. (A) 0.2 (B) 0.1 (C) 0.4
Modelling and Management of Cyber Risk
 Martin Eling and Jan Hendrik Wirfs University of St. Gallen, Switzerland Institute of Insurance Economics IAA Colloquium 2015 Oslo, Norway June 7 th 10 th, 2015 2 Contact Information Title: Authors: Martin
Estimate of Maximum Insurance Loss due to Bushfires
 19th International Congress on Modelling and Simulation, Perth, Australia, 12 16 December 2011 http://mssanz.org.au/modsim2011 Estimate of Maximum Insurance Loss due to Bushfires X.G. Lin a, P. Moran b,
The University of Chicago, Booth School of Business Business 41202, Spring Quarter 2017, Mr. Ruey S. Tsay. Solutions to Final Exam
 The University of Chicago, Booth School of Business Business 41202, Spring Quarter 2017, Mr. Ruey S. Tsay Solutions to Final Exam Problem A: (40 points) Answer briefly the following questions. 1. Describe
Statistics & Flood Frequency Chapter 3. Dr. Philip B. Bedient
 Statistics & Flood Frequency Chapter 3 Dr. Philip B. Bedient Predicting FLOODS Flood Frequency Analysis n Statistical Methods to evaluate probability exceeding a particular outcome - P (X >20,000 cfs)
Portfolio Optimization. Prof. Daniel P. Palomar
 Portfolio Optimization Prof. Daniel P. Palomar The Hong Kong University of Science and Technology (HKUST) MAFS6010R- Portfolio Optimization with R MSc in Financial Mathematics Fall 2018-19, HKUST, Hong
Statistics for Managers Using Microsoft Excel 7 th Edition
 Statistics for Managers Using Microsoft Excel 7 th Edition Chapter 5 Discrete Probability Distributions Statistics for Managers Using Microsoft Excel 7e Copyright 014 Pearson Education, Inc. Chap 5-1 Learning
QUANTIFICATION OF OPERATIONAL RISKS IN BANKS: A THEORETICAL ANALYSIS WITH EMPRICAL TESTING
 QUANTIFICATION OF OPERATIONAL RISKS IN BANKS: A THEORETICAL ANALYSIS WITH EMPRICAL TESTING Associate Professor John Evans*, Faculty of Business, UNSW Associate Professor Robert Womersley, Faculty of Science,
Research Article Multiple-Event Catastrophe Bond Pricing Based on CIR-Copula-POT Model
 Discrete Dynamics in Nature and Society Volume 218, Article ID 56848, 9 pages https://doi.org/1.1155/218/56848 Research Article Multiple-Event Catastrophe Bond Pricing Based on CIR-Copula-POT Model Wen
Shifting our focus. We were studying statistics (data, displays, sampling...) The next few lectures focus on probability (randomness) Why?
 The next few lectures focus on probability (randomness) Why?") Probability Introduction Shifting our focus We were studying statistics (data, displays, sampling...) The next few lectures focus on probability (randomness) Why? What is Probability? Probability is used
Probability Introduction Shifting our focus We were studying statistics (data, displays, sampling...) The next few lectures focus on probability (randomness) Why? What is Probability? Probability is used
Some Characteristics of Data
 Some Characteristics of Data Not all data is the same, and depending on some characteristics of a particular dataset, there are some limitations as to what can and cannot be done with that data. Some key
2. Copula Methods Background
 1. Introduction Stock futures markets provide a channel for stock holders potentially transfer risks. Effectiveness of such a hedging strategy relies heavily on the accuracy of hedge ratio estimation.
STK 3505/4505: Summary of the course
 November 22, 2016 CH 2: Getting started the Monte Carlo Way How to use Monte Carlo methods for estimating quantities ψ related to the distribution of X, based on the simulations X1,..., X m: mean: X =
Statistics and Finance
 David Ruppert Statistics and Finance An Introduction Springer Notation... xxi 1 Introduction... 1 1.1 References... 5 2 Probability and Statistical Models... 7 2.1 Introduction... 7 2.2 Axioms of Probability...
Chapter 5. Continuous Random Variables and Probability Distributions. 5.1 Continuous Random Variables
 Chapter 5 Continuous Random Variables and Probability Distributions 5.1 Continuous Random Variables 1 2CHAPTER 5. CONTINUOUS RANDOM VARIABLES AND PROBABILITY DISTRIBUTIONS Probability Distributions Probability
Portfolio modelling of operational losses John Gavin 1, QRMS, Risk Control, UBS, London. April 2004.
 Portfolio modelling of operational losses John Gavin 1, QRMS, Risk Control, UBS, London. April 2004. What is operational risk Trends over time Empirical distributions Loss distribution approach Compound
Continuous random variables
 Continuous random variables probability density function (f(x)) the probability distribution function of a continuous random variable (analogous to the probability mass function for a discrete random variable),
David R. Clark. Presented at the: 2013 Enterprise Risk Management Symposium April 22-24, 2013
 A Note on the Upper-Truncated Pareto Distribution David R. Clark Presented at the: 2013 Enterprise Risk Management Symposium April 22-24, 2013 This paper is posted with permission from the author who retains
Insurance: Mathematics and Economics. Univariate and bivariate GPD methods for predicting extreme wind storm losses
 Insurance: Mathematics and Economics 44 2009) 345 356 Contents lists available at ScienceDirect Insurance: Mathematics and Economics journal homepage: www.elsevier.com/locate/ime Univariate and bivariate
Operational Risk Quantification and Insurance
 Operational Risk Quantification and Insurance Capital Allocation for Operational Risk 14 th -16 th November 2001 Bahram Mirzai, Swiss Re Swiss Re FSBG Outline Capital Calculation along the Loss Curve Hierarchy
Fitting the generalized Pareto distribution to commercial fire loss severity: evidence from Taiwan
 The Journal of Risk (63 8) Volume 14/Number 3, Spring 212 Fitting the generalized Pareto distribution to commercial fire loss severity: evidence from Taiwan Wo-Chiang Lee Department of Banking and Finance,
MODELLING OF INCOME AND WAGE DISTRIBUTION USING THE METHOD OF L-MOMENTS OF PARAMETER ESTIMATION
 International Days of Statistics and Economics, Prague, September -3, MODELLING OF INCOME AND WAGE DISTRIBUTION USING THE METHOD OF L-MOMENTS OF PARAMETER ESTIMATION Diana Bílková Abstract Using L-moments
Modelling Premium Risk for Solvency II: from Empirical Data to Risk Capital Evaluation
 w w w. I C A 2 0 1 4. o r g Modelling Premium Risk for Solvency II: from Empirical Data to Risk Capital Evaluation Lavoro presentato al 30 th International Congress of Actuaries, 30 marzo-4 aprile 2014,
Paper Series of Risk Management in Financial Institutions
 - December, 007 Paper Series of Risk Management in Financial Institutions The Effect of the Choice of the Loss Severity Distribution and the Parameter Estimation Method on Operational Risk Measurement*
Continuous Processes. Brownian motion Stochastic calculus Ito calculus
 Continuous Processes Brownian motion Stochastic calculus Ito calculus Continuous Processes The binomial models are the building block for our realistic models. Three small-scale principles in continuous
Modelling insured catastrophe losses
 Modelling insured catastrophe losses Pavla Jindrová 1, Monika Papoušková 2 Abstract Catastrophic events affect various regions of the world with increasing frequency and intensity. Large catastrophic events
Universität Regensburg Mathematik
 Universität Regensburg Mathematik Modeling financial markets with extreme risk Tobias Kusche Preprint Nr. 04/2008 Modeling financial markets with extreme risk Dr. Tobias Kusche 11. January 2008 1 Introduction
Math 5760/6890 Introduction to Mathematical Finance
 Math 5760/6890 Introduction to Mathematical Finance Instructor: Jingyi Zhu Office: LCB 335 Telephone:581-3236 E-mail: zhu@math.utah.edu Class web page: www.math.utah.edu/~zhu/5760_12f.html What you should
MEASURING EXTREME RISKS IN THE RWANDA STOCK MARKET
 MEASURING EXTREME RISKS IN THE RWANDA STOCK MARKET 1 Mr. Jean Claude BIZUMUTIMA, 2 Dr. Joseph K. Mung atu, 3 Dr. Marcel NDENGO 1,2,3 Faculty of Applied Sciences, Department of statistics and Actuarial
On modelling of electricity spot price
 , Rüdiger Kiesel and Fred Espen Benth Institute of Energy Trading and Financial Services University of Duisburg-Essen Centre of Mathematics for Applications, University of Oslo 25. August 2010 Introduction
LDA at Work. Falko Aue Risk Analytics & Instruments 1, Risk and Capital Management, Deutsche Bank AG, Taunusanlage 12, Frankfurt, Germany
 LDA at Work Falko Aue Risk Analytics & Instruments 1, Risk and Capital Management, Deutsche Bank AG, Taunusanlage 12, 60325 Frankfurt, Germany Michael Kalkbrener Risk Analytics & Instruments, Risk and
Two hours UNIVERSITY OF MANCHESTER. 23 May :00 16:00. Answer ALL SIX questions The total number of marks in the paper is 90.
 Two hours MATH39542 UNIVERSITY OF MANCHESTER RISK THEORY 23 May 2016 14:00 16:00 Answer ALL SIX questions The total number of marks in the paper is 90. University approved calculators may be used 1 of
John Cotter and Kevin Dowd
 Extreme spectral risk measures: an application to futures clearinghouse margin requirements John Cotter and Kevin Dowd Presented at ECB-FRB conference April 2006 Outline Margin setting Risk measures Risk
4-2 Probability Distributions and Probability Density Functions. Figure 4-2 Probability determined from the area under f(x).
.") 4-2 Probability Distributions and Probability Density Functions Figure 4-2 Probability determined from the area under f(x). 4-2 Probability Distributions and Probability Density Functions Definition 4-2
4-2 Probability Distributions and Probability Density Functions Figure 4-2 Probability determined from the area under f(x). 4-2 Probability Distributions and Probability Density Functions Definition 4-2
A Bivariate Shot Noise Self-Exciting Process for Insurance
 A Bivariate Shot Noise Self-Exciting Process for Insurance Jiwook Jang Department of Applied Finance & Actuarial Studies Faculty of Business and Economics Macquarie University, Sydney Australia Angelos
EE365: Risk Averse Control
 EE365: Risk Averse Control Risk averse optimization Exponential risk aversion Risk averse control 1 Outline Risk averse optimization Exponential risk aversion Risk averse control Risk averse optimization
Lecture 9: Practicalities in Using Black-Scholes. Sunday, September 23, 12
 Lecture 9: Practicalities in Using Black-Scholes Major Complaints Most stocks and FX products don t have log-normal distribution Typically fat-tailed distributions are observed Constant volatility assumed,
IEOR E4703: Monte-Carlo Simulation
 IEOR E4703: Monte-Carlo Simulation Simulating Stochastic Differential Equations Martin Haugh Department of Industrial Engineering and Operations Research Columbia University Email: martin.b.haugh@gmail.com
STAT 400 Homework 06 Spring 2018 Dalpiaz UIUC Due: Friday, March 9, 2:00 PM
 STAT 400 Homework 06 Spring 2018 Dalpiaz UIUC Due: Friday, March 9, 2:00 PM Exercise 1 Consider a random variable X with the moment generating function (a) Calculate P (4 < X < 16). M X (t) = e 5t+8t2
Economic Risk and Potential of Climate Change
 Economic Risk and Potential of Climate Change Prof. Dr. Peter Hoeppe; Dr. Ernst Rauch This document appeared in Detlef Stolten, Bernd Emonts (Eds.): 18th World Hydrogen Energy Conference 2010 - WHEC 2010
The Black-Scholes Model
 The Black-Scholes Model Liuren Wu Options Markets Liuren Wu ( c ) The Black-Merton-Scholes Model colorhmoptions Markets 1 / 18 The Black-Merton-Scholes-Merton (BMS) model Black and Scholes (1973) and Merton
Private property insurance data on losses
 38 Universities Council on Water Resources Issue 138, Pages 38-44, April 2008 Assessment of Flood Losses in the United States Stanley A. Changnon University of Illinois: Chief Emeritus, Illinois State
THE MAKING OF A RISKIER FUTURE
 THE MAKING OF A RISKIER FUTURE Disaster risks are increasing rapidly. While annual losses and deaths from natural disasters vary, long-term average of total annual damage is increasing at an exponential
Homework Problems Stat 479
 Chapter 2 1. Model 1 is a uniform distribution from 0 to 100. Determine the table entries for a generalized uniform distribution covering the range from a to b where a < b. 2. Let X be a discrete random
Assessing the performance of Bartlett-Lewis model on the simulation of Athens rainfall
 European Geosciences Union General Assembly 2015 Vienna, Austria, 12-17 April 2015 Session HS7.7/NP3.8: Hydroclimatic and hydrometeorologic stochastics Assessing the performance of Bartlett-Lewis model
Lecture 17. The model is parametrized by the time period, δt, and three fixed constant parameters, v, σ and the riskless rate r.
 Lecture 7 Overture to continuous models Before rigorously deriving the acclaimed Black-Scholes pricing formula for the value of a European option, we developed a substantial body of material, in continuous
Power laws and scaling in finance
 Power laws and scaling in finance Practical applications for risk control and management D. SORNETTE ETH-Zurich Chair of Entrepreneurial Risks Department of Management, Technology and Economics (D-MTEC)
Value at Risk and Self Similarity
 Value at Risk and Self Similarity by Olaf Menkens School of Mathematical Sciences Dublin City University (DCU) St. Andrews, March 17 th, 2009 Value at Risk and Self Similarity 1 1 Introduction The concept
[D7] PROBABILITY DISTRIBUTION OF OUTSTANDING LIABILITY FROM INDIVIDUAL PAYMENTS DATA Contributed by T S Wright
![[D7] PROBABILITY DISTRIBUTION OF OUTSTANDING LIABILITY FROM INDIVIDUAL PAYMENTS DATA Contributed by T S Wright](/thumbs/92/107898301.jpg "[D7] PROBABILITY DISTRIBUTION OF OUTSTANDING LIABILITY FROM INDIVIDUAL PAYMENTS DATA Contributed by T S Wright") Faculty and Institute of Actuaries Claims Reserving Manual v.2 (09/1997) Section D7 [D7] PROBABILITY DISTRIBUTION OF OUTSTANDING LIABILITY FROM INDIVIDUAL PAYMENTS DATA Contributed by T S Wright 1. Introduction
Faculty and Institute of Actuaries Claims Reserving Manual v.2 (09/1997) Section D7 [D7] PROBABILITY DISTRIBUTION OF OUTSTANDING LIABILITY FROM INDIVIDUAL PAYMENTS DATA Contributed by T S Wright 1. Introduction
Probability Weighted Moments. Andrew Smith
 Probability Weighted Moments Andrew Smith andrewdsmith8@deloitte.co.uk 28 November 2014 Introduction If I asked you to summarise a data set, or fit a distribution You d probably calculate the mean and
D I S C O N T I N U O U S DEMAND FUNCTIONS: ESTIMATION AND PRICING. Rotterdam May 24, 2018
 D I S C O N T I N U O U S DEMAND FUNCTIONS: ESTIMATION AND PRICING Arnoud V. den Boer University of Amsterdam N. Bora Keskin Duke University Rotterdam May 24, 2018 Dynamic pricing and learning: Learning
Statistics for Business and Economics
 Statistics for Business and Economics Chapter 5 Continuous Random Variables and Probability Distributions Ch. 5-1 Probability Distributions Probability Distributions Ch. 4 Discrete Continuous Ch. 5 Probability
Statistics 6 th Edition
 Statistics 6 th Edition Chapter 5 Discrete Probability Distributions Chap 5-1 Definitions Random Variables Random Variables Discrete Random Variable Continuous Random Variable Ch. 5 Ch. 6 Chap 5-2 Discrete