EVA Tutorial #1 BLOCK MAXIMA APPROACH IN HYDROLOGIC/CLIMATE APPLICATIONS. Rick Katz
|
|
|
- Erik Norris
- 6 years ago
- Views:
Transcription
1 1 EVA Tutorial #1 BLOCK MAXIMA APPROACH IN HYDROLOGIC/CLIMATE APPLICATIONS Rick Katz Institute for Mathematics Applied to Geosciences National Center for Atmospheric Research Boulder, CO USA Home page: Lecture:
2 2 Outline (1) Traditional Methods/Rationale for Extreme Value Analysis (2) Max Stability/Extremal Types Theorem (3) Block Maxima Approach under Stationarity (4) Return Levels (5) Block Maxima Approach under Nonstationarity (6) Trends in Extremes (7) Other Forms of Covariates
3 3 (1) Traditional Methods/Rationale for Extreme Value Analysis Fit models/distributions to all data -- Even if primary focus is on extremes Statistical theory for averages -- Ubiquitous role of normal distribution -- Central Limit Theorem for sums or averages
4 4 Central Limit Theorem -- Given time series X 1, X 2,..., X n Assume independent and identically distributed (iid) Assume common cumulative distribution function (cdf) F Assume finite mean μ and variance σ 2 -- Denote sum by S n = X 1 + X X n -- Then, no matter what shape of cdf F, Pr{(S n nμ) / n 1/2 σ x} Φ(x) as n where Φ denotes standard normal N(0, 1) cdf
5 5 Robustness -- Avoid sensitivity to extremes (outliers / contamination) Nonparametric Alternatives -- Kernel density estimation Ok for center of distribution (but not for lower & upper tails) -- Resampling Fails for maxima Cannot extrapolate
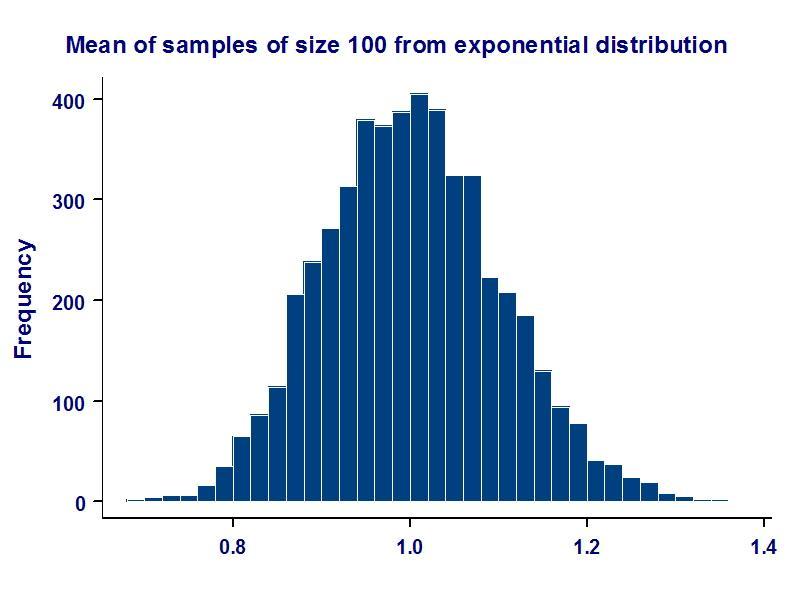
6 6 Conduct sampling experiment -- Exponential distribution with cdf F(x) = 1 exp[ (x/σ)], x > 0, σ > 0 Here σ is scale parameter (also mean)
7 -- Draw random samples of size n = 10 from exponential distribution (with σ = 1) and calculate mean for each sample 7 (i) First pseudo random sample 1.678, 0.607, 0.732, 1.806, 1.388, 0.630, 0.382, 0.396, 1.324, (Sample mean 1.009) (ii) Second pseudo random sample Sample mean (iii) Third pseudo random sample Sample mean Repeat many more times
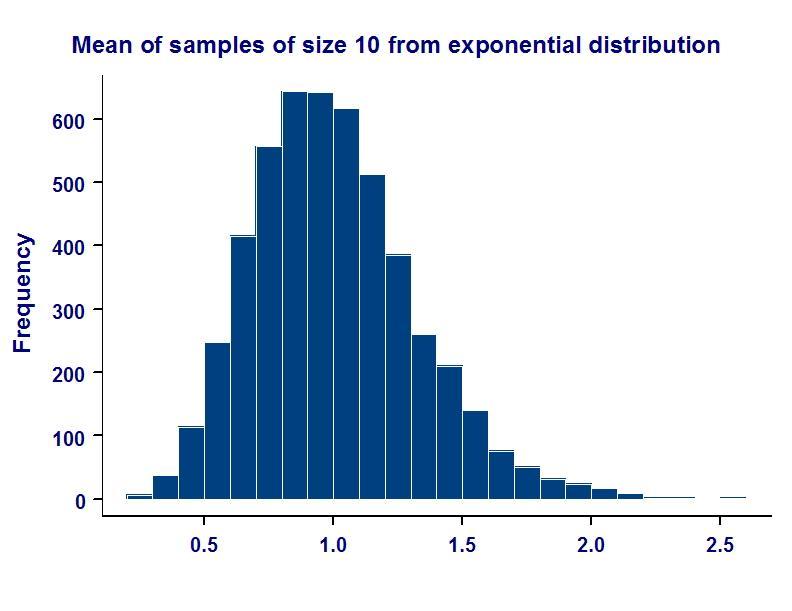
8 8
9 9
10 10 Limited information about extremes -- Exploit what theory is available More robust/flexible approach -- Tail behavior of standard distributions is too restrictive Statistical theory indicates possibility of heavy tails Data suggest evidence of heavy tails Conventional distributions have light tails
11 11 -- Example Let X have standard normal distribution [i. e., N(0, 1)] with probability density function (pdf) φ(x) = (2π) 1/2 exp( x 2 / 2) Then Pr{X > x} 1 Φ(x) φ(x) / x, for large x
12 12 Statistical behavior of extremes -- Effectively no role for normal distribution -- What form of distribution(s) instead? Conduct another sampling experiment -- Calculate largest value of random sample (instead of mean) (i) Standard normal distribution N(0, 1) (ii) Exponential distribution (σ = 1)
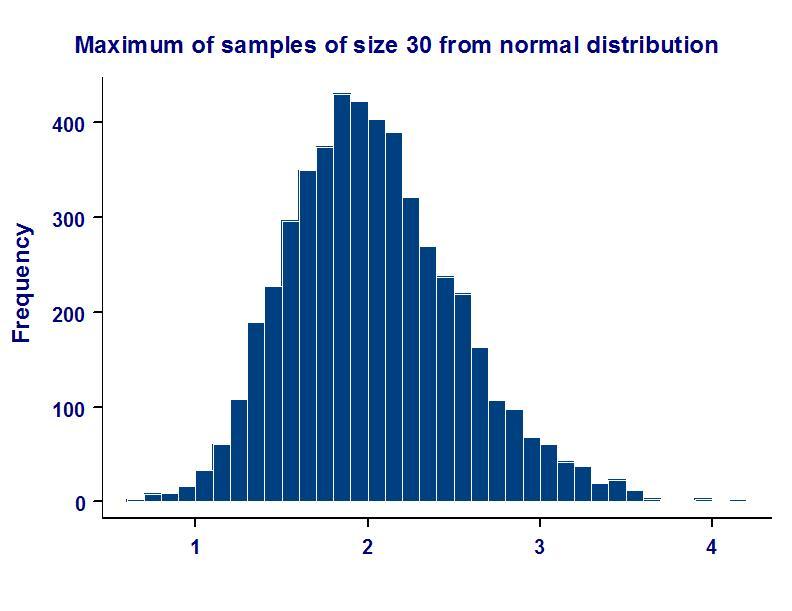
13 13
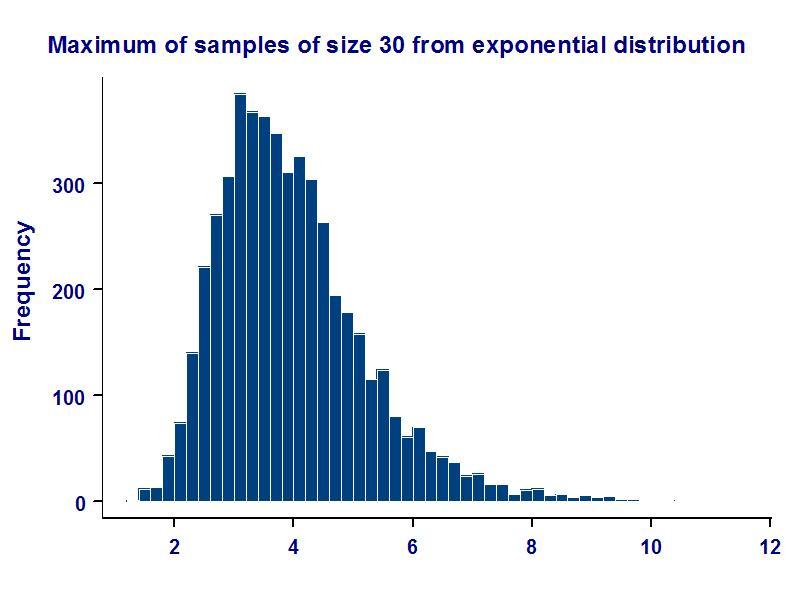
14 14
15 15 (2) Max Stability/Extremal Types Theorem Sum stability -- Property of normal distribution X 1, X 2,..., X n iid with common cdf N(μ, σ 2 ) Then sum S n = X 1 + X X n is exactly normally distributed In particular, (S n nμ) / n 1/2 σ has an exact N(0, 1) distribution
16 16 Max stability -- Want to find distribution(s) for which maximum has same form as original sample Note that max{x 1, X 2,..., X 2n } = max{max{x 1, X 2,..., X n }, max{x n+1, X n+2,..., X 2n }} -- So cdf G, say, must satisfy G 2 (x) = G(ax + b) Here a > 0 and b are constants
17 17
18 18
19 19 Extremal Types Theorem Time series X 1, X 2,..., X n assumed iid (for now) Set M n = max{x 1, X 2,..., X n } Suppose that there exist constants a n > 0 and b n such that Pr{(M n b n ) / a n x} G(x) as n where G is a non-degenerate cdf Then G must a generalized extreme value (GEV) cdf; that is, G(x; μ, σ, ξ) = exp { [1 + ξ (x μ)/σ] 1/ξ }, 1 + ξ (x μ)/σ > 0 μ location parameter, σ > 0 scale parameter, ξ shape parameter
20 20 (i) ξ = 0 (Gumbel type, limit as ξ 0) Light upper tail Domain of attraction for many common distributions (e. g., normal, exponential, gamma)
21 21 (ii) ξ > 0 (Fréchet type) Heavy upper tail with infinite rth-order moment if r 1/ξ (e. g., infinite variance if ξ 1/2) Fits precipitation, streamflow, economic damage
22 22 (iii) ξ < 0 (Weibull type) Bounded upper tail [ x < μ + σ / ( ξ) ] Fits temperature, wind speed, sea level
23 23 Location parameter of GEV is not equivalent to mean Scale parameter of GEV is not equivalent to standard deviation
24 24 Alternative forms of distribution for maxima -- Lognormal distribution Log-transformed variable has normal distribution Positively skewed Light-tailed in sense of extreme value theory (Gumbel domain of attraction) -- Log Pearson Type III distribution Log-transformed variable has gamma distribution Heavy-tailed distribution (Fréchet domain of attraction) Not as flexible as GEV distribution
25 25 (3) Block Maxima Approach under Stationarity GEV distribution -- Fit directly to maxima (say with block size n) e. g., annual maximum of daily precipitation amount or highest temperature over given year or annual peak stream flow -- Advantages Do not necessarily need to explicitly model annual and diurnal cycles Do not necessarily need to explicitly model temporal dependence
26 26 Parameter estimation techniques -- Method of moments Easy to calculate Relatively inefficient -- Probability-weighted moments (L-moments) Easy to calculate Efficient for small samples -- Maximum likelihood Requires iterative numerical techniques Quantification of uncertainty Incorporation of covariates/nonstationarity
27 27 Maximum likelihood estimation (mle) -- Given observed block maxima X 1 = x 1, X 2 = x 2,..., X T = x T -- Assume exact GEV dist. with pdf g(x; μ, σ, ξ) = G'(x; μ, σ, ξ) -- Likelihood function L(x 1, x 2,..., x T ; μ, σ, ξ) = g(x 1 ; μ, σ, ξ) g(x 2 ; μ, σ, ξ) g(x T ; μ, σ, ξ) Minimize ln L(x 1, x 2,..., x T ; μ, σ, ξ) with respect to μ, σ, ξ
28 28 Likelihood ratio test (LRT) For example, to test whether ξ = 0 fit two models: (i) ln L(x 1, x 2,..., x T ; μ, σ, ξ) minimized with respect to μ, σ, ξ (ii) ln L(x 1, x 2,..., x T ; μ, σ, ξ = 0) minimized with respect to μ, σ If ξ = 0, then 2 [(ii) (i)] has approximate chi square distribution with 1 degree of freedom (df) for large T -- Confidence interval (e. g., for ξ) based on profile likelihood Minimize ln L(x 1, x 2,..., x T ; μ, σ, ξ) with respect to μ, σ as function of ξ Use chi square dist. with 1 df
29 29 Fort Collins daily precipitation amount -- Fort Collins, CO, USA Time series of daily precipitation amount (in), Semi-arid region Marked annual cycle in precipitation (peak in late spring/early summer, driest in winter) Consider annual maxima (block size n 365) No obvious long-term trend in annual maxima (T = 100) Flood on 28 July 1997 (Damaged campus of Colorado State Univ.)
30 30
31 31
32 32
33 33 Parameter estimates and standard errors Parameter Estimate (Std. Error) Location μ (0.062) Scale σ (0.049) Shape ξ (0.092) -- LRT for ξ = 0 (P-value 0.038) -- 95% confidence interval for shape parameter ξ (based on profile likelihood) < ξ < 0.369
34 34 (4) Return Levels Assume stationarity -- i. e., unchanging climate Return period / Return level -- Return level with (1/p)-yr return period x(p) = G 1 (1 p; μ, σ, ξ), 0 < p < 1 Quantile of GEV cdf G (e. g., p = 0.01 corresponds to 100-yr return period)
35 35
36 36 GEV distribution x(p) = μ (σ/ξ) {1 [ ln(1 p)]} ξ Confidence interval: Re-parameterize replacing location parameter μ with x(p) & use profile likelihood method -- Fort Collins precipitation example (annual maxima) Estimated 100-yr return level: 5.10 in 95% confidence interval (based on profile likelihood): 3.93 in < x(0.01) < 8.00 in
37 37 Interpretation of return level (i) Mean waiting time until next event = 1/p On average, wait 100 yr for next 100-yr event (ii) Average number of events over time period (of length 1/p) = 1 On average, one 100-yr event occurs within 100-yr time period
38 38 (5) Block Maxima Approach under Nonstationarity Sources -- Trends Global climate change Local land use changes -- Physically-based Large-scale atmospheric/oceanic circulation patterns (e. g., El Niño Southern Oscillation phenomenon) Used in statistical downscaling
39 39 Theory -- No general extreme value theory under nonstationarity Only limited results under restrictive conditions Methods -- Introduction of covariates resembles generalized linear models -- Straightforward to extend maximum likelihood estimation Issues -- Nature of relationship between extremes & covariates Resembles that for overall / center of data?
40 40 (6) Trends in Extremes Trends -- Example (Urban heat island) Trend in summer minimum temperature at Phoenix, AZ (i. e., block minima) min{x 1, X 2,..., X n } = max{ X 1, X 2,..., X n } Assume negated summer minimum temperature in year t has GEV distribution with location and scale parameters: μ(t) = μ 0 + μ 1 t, ln σ(t) = σ 0 + σ 1 t, ξ(t) = ξ, t = 1, 2,...
41 41 Parameter estimates and standard errors Parameter Estimate (Std. Error) Location: μ * μ * (0.041) Scale: σ σ (0.010) Shape: ξ *Sign of location parameters reversed to convert back to minima -- LRT for μ 1 = 0 (P-value < 10 5 ) -- LRT for σ 1 = 0 (P-value 0.366)
42 42
43 43 Q-Q plots under non-stationarity -- Transform to common distribution Non-stationary GEV [μ(t), σ(t), ξ(t)] Not invariant to choice of transformation (i) Non-stationary GEV to standard exponential ε t = {1 + ξ(t) [X t μ(t)] / σ(t)} 1/ξ(t) (ii) Non-stationary GEV to standard Gumbel (used by extremes) ε t = [1/ξ(t)] log {1 + ξ(t) [X t μ(t)] / σ(t)}
44 44
45 45
46 46 (7) Other Forms of Covariates Physically-based covariates -- Example [Arctic Oscillation (AO)] Winter maximum temperature at Port Jervis, NY, USA (i. e., block maxima) Z denotes winter index of AO Given Z = z, assume conditional distribution of winter maximum temperature is GEV distribution with parameters: μ(z) = μ 0 + μ 1 z, ln σ(z) = σ 0 + σ 1 z, ξ(z) = ξ
47 47 Parameter estimates and standard errors Parameter Estimate (Std. Error) Location: μ μ (0.319) Scale: σ σ (0.092) Shape: ξ LRT for μ 1 = 0 (P-value < 0.001) -- LRT for σ 1 = 0 (P-value 0.635)
48 48
49 49
QUANTIFYING THE RISK OF EXTREME EVENTS IN A CHANGING CLIMATE. Rick Katz. Joint Work with Holger Rootzén Chalmers and Gothenburg University, Sweden
 QUANTIFYING THE RISK OF EXTREME EVENTS IN A CHANGING CLIMATE Rick Katz Joint Work with Holger Rootzén Chalmers and Gothenburg University, Sweden email: rwk@ucar.edu Talk: www.isse.ucar.edu/staff/katz/docs/pdf/qrisk.pdf
An Introduction to Statistical Extreme Value Theory
 An Introduction to Statistical Extreme Value Theory Uli Schneider Geophysical Statistics Project, NCAR January 26, 2004 NCAR Outline Part I - Two basic approaches to extreme value theory block maxima,
STOCHASTIC MODELING OF HURRICANE DAMAGE UNDER CLIMATE CHANGE
 STOCHASTIC MODELING OF HURRICANE DAMAGE UNDER CLIMATE CHANGE Rick Katz Institute for Study of Society and Environment National Center for Atmospheric Research Boulder, CO USA Email: rwk@ucar.edu Web site:
Two hours. To be supplied by the Examinations Office: Mathematical Formula Tables and Statistical Tables THE UNIVERSITY OF MANCHESTER
 Two hours MATH20802 To be supplied by the Examinations Office: Mathematical Formula Tables and Statistical Tables THE UNIVERSITY OF MANCHESTER STATISTICAL METHODS Answer any FOUR of the SIX questions.
Modelling Environmental Extremes
 19th TIES Conference, Kelowna, British Columbia 8th June 2008 Topics for the day 1. Classical models and threshold models 2. Dependence and non stationarity 3. R session: weather extremes 4. Multivariate
Financial Risk Forecasting Chapter 9 Extreme Value Theory
 Financial Risk Forecasting Chapter 9 Extreme Value Theory Jon Danielsson 2017 London School of Economics To accompany Financial Risk Forecasting www.financialriskforecasting.com Published by Wiley 2011
Modelling Environmental Extremes
 19th TIES Conference, Kelowna, British Columbia 8th June 2008 Topics for the day 1. Classical models and threshold models 2. Dependence and non stationarity 3. R session: weather extremes 4. Multivariate
Generalized MLE per Martins and Stedinger
 Generalized MLE per Martins and Stedinger Martins ES and Stedinger JR. (March 2000). Generalized maximum-likelihood generalized extreme-value quantile estimators for hydrologic data. Water Resources Research
INDIAN INSTITUTE OF SCIENCE STOCHASTIC HYDROLOGY. Lecture -5 Course Instructor : Prof. P. P. MUJUMDAR Department of Civil Engg., IISc.
 INDIAN INSTITUTE OF SCIENCE STOCHASTIC HYDROLOGY Lecture -5 Course Instructor : Prof. P. P. MUJUMDAR Department of Civil Engg., IISc. Summary of the previous lecture Moments of a distribubon Measures of
Introduction to Algorithmic Trading Strategies Lecture 8
 Introduction to Algorithmic Trading Strategies Lecture 8 Risk Management Haksun Li haksun.li@numericalmethod.com www.numericalmethod.com Outline Value at Risk (VaR) Extreme Value Theory (EVT) References
Frequency Distribution Models 1- Probability Density Function (PDF)
") Models 1- Probability Density Function (PDF) What is a PDF model? A mathematical equation that describes the frequency curve or probability distribution of a data set. Why modeling? It represents and summarizes
Models 1- Probability Density Function (PDF) What is a PDF model? A mathematical equation that describes the frequency curve or probability distribution of a data set. Why modeling? It represents and summarizes
INDIAN INSTITUTE OF SCIENCE STOCHASTIC HYDROLOGY. Lecture -26 Course Instructor : Prof. P. P. MUJUMDAR Department of Civil Engg., IISc.
 INDIAN INSTITUTE OF SCIENCE STOCHASTIC HYDROLOGY Lecture -26 Course Instructor : Prof. P. P. MUJUMDAR Department of Civil Engg., IISc. Summary of the previous lecture Hydrologic data series for frequency
A New Hybrid Estimation Method for the Generalized Pareto Distribution
 A New Hybrid Estimation Method for the Generalized Pareto Distribution Chunlin Wang Department of Mathematics and Statistics University of Calgary May 18, 2011 A New Hybrid Estimation Method for the GPD
AN EXTREME VALUE APPROACH TO PRICING CREDIT RISK
 AN EXTREME VALUE APPROACH TO PRICING CREDIT RISK SOFIA LANDIN Master s thesis 2018:E69 Faculty of Engineering Centre for Mathematical Sciences Mathematical Statistics CENTRUM SCIENTIARUM MATHEMATICARUM
**BEGINNING OF EXAMINATION** A random sample of five observations from a population is:
 **BEGINNING OF EXAMINATION** 1. You are given: (i) A random sample of five observations from a population is: 0.2 0.7 0.9 1.1 1.3 (ii) You use the Kolmogorov-Smirnov test for testing the null hypothesis,
Modelling catastrophic risk in international equity markets: An extreme value approach. JOHN COTTER University College Dublin
 Modelling catastrophic risk in international equity markets: An extreme value approach JOHN COTTER University College Dublin Abstract: This letter uses the Block Maxima Extreme Value approach to quantify
Lecture 3: Probability Distributions (cont d)
") EAS31116/B9036: Statistics in Earth & Atmospheric Sciences Lecture 3: Probability Distributions (cont d) Instructor: Prof. Johnny Luo www.sci.ccny.cuny.edu/~luo Dates Topic Reading (Based on the 2 nd Edition
EAS31116/B9036: Statistics in Earth & Atmospheric Sciences Lecture 3: Probability Distributions (cont d) Instructor: Prof. Johnny Luo www.sci.ccny.cuny.edu/~luo Dates Topic Reading (Based on the 2 nd Edition
Commonly Used Distributions
 Chapter 4: Commonly Used Distributions 1 Introduction Statistical inference involves drawing a sample from a population and analyzing the sample data to learn about the population. We often have some knowledge
QQ PLOT Yunsi Wang, Tyler Steele, Eva Zhang Spring 2016
 QQ PLOT INTERPRETATION: Quantiles: QQ PLOT Yunsi Wang, Tyler Steele, Eva Zhang Spring 2016 The quantiles are values dividing a probability distribution into equal intervals, with every interval having
ECON Introductory Econometrics. Lecture 1: Introduction and Review of Statistics
 ECON4150 - Introductory Econometrics Lecture 1: Introduction and Review of Statistics Monique de Haan (moniqued@econ.uio.no) Stock and Watson Chapter 1-2 Lecture outline 2 What is econometrics? Course
IEOR E4602: Quantitative Risk Management
 IEOR E4602: Quantitative Risk Management Basic Concepts and Techniques of Risk Management Martin Haugh Department of Industrial Engineering and Operations Research Columbia University Email: martin.b.haugh@gmail.com
Chapter 8: Sampling distributions of estimators Sections
 Chapter 8 continued Chapter 8: Sampling distributions of estimators Sections 8.1 Sampling distribution of a statistic 8.2 The Chi-square distributions 8.3 Joint Distribution of the sample mean and sample
Estimate of Maximum Insurance Loss due to Bushfires
 19th International Congress on Modelling and Simulation, Perth, Australia, 12 16 December 2011 http://mssanz.org.au/modsim2011 Estimate of Maximum Insurance Loss due to Bushfires X.G. Lin a, P. Moran b,
Statistics & Flood Frequency Chapter 3. Dr. Philip B. Bedient
 Statistics & Flood Frequency Chapter 3 Dr. Philip B. Bedient Predicting FLOODS Flood Frequency Analysis n Statistical Methods to evaluate probability exceeding a particular outcome - P (X >20,000 cfs)
Chapter 5. Continuous Random Variables and Probability Distributions. 5.1 Continuous Random Variables
 Chapter 5 Continuous Random Variables and Probability Distributions 5.1 Continuous Random Variables 1 2CHAPTER 5. CONTINUOUS RANDOM VARIABLES AND PROBABILITY DISTRIBUTIONS Probability Distributions Probability
Business Statistics 41000: Probability 3
 Business Statistics 41000: Probability 3 Drew D. Creal University of Chicago, Booth School of Business February 7 and 8, 2014 1 Class information Drew D. Creal Email: dcreal@chicagobooth.edu Office: 404
Exam 2 Spring 2015 Statistics for Applications 4/9/2015
 18.443 Exam 2 Spring 2015 Statistics for Applications 4/9/2015 1. True or False (and state why). (a). The significance level of a statistical test is not equal to the probability that the null hypothesis
GPD-POT and GEV block maxima
 Chapter 3 GPD-POT and GEV block maxima This chapter is devoted to the relation between POT models and Block Maxima (BM). We only consider the classical frameworks where POT excesses are assumed to be GPD,
The rth moment of a real-valued random variable X with density f(x) is. x r f(x) dx
 is. x r f(x) dx") 1 Cumulants 1.1 Definition The rth moment of a real-valued random variable X with density f(x) is µ r = E(X r ) = x r f(x) dx for integer r = 0, 1,.... The value is assumed to be finite. Provided that
1 Cumulants 1.1 Definition The rth moment of a real-valued random variable X with density f(x) is µ r = E(X r ) = x r f(x) dx for integer r = 0, 1,.... The value is assumed to be finite. Provided that
Describing Uncertain Variables
 Describing Uncertain Variables L7 Uncertainty in Variables Uncertainty in concepts and models Uncertainty in variables Lack of precision Lack of knowledge Variability in space/time Describing Uncertainty
Measuring Financial Risk using Extreme Value Theory: evidence from Pakistan
 Measuring Financial Risk using Extreme Value Theory: evidence from Pakistan Dr. Abdul Qayyum and Faisal Nawaz Abstract The purpose of the paper is to show some methods of extreme value theory through analysis
Random Variables Handout. Xavier Vilà
 Random Variables Handout Xavier Vilà Course 2004-2005 1 Discrete Random Variables. 1.1 Introduction 1.1.1 Definition of Random Variable A random variable X is a function that maps each possible outcome
Likelihood Methods of Inference. Toss coin 6 times and get Heads twice.
 Methods of Inference Toss coin 6 times and get Heads twice. p is probability of getting H. Probability of getting exactly 2 heads is 15p 2 (1 p) 4 This function of p, is likelihood function. Definition:
Simulation of Extreme Events in the Presence of Spatial Dependence
 Simulation of Extreme Events in the Presence of Spatial Dependence Nicholas Beck Bouchra Nasri Fateh Chebana Marie-Pier Côté Juliana Schulz Jean-François Plante Martin Durocher Marie-Hélène Toupin Jean-François
Continuous random variables
 Continuous random variables probability density function (f(x)) the probability distribution function of a continuous random variable (analogous to the probability mass function for a discrete random variable),
ME3620. Theory of Engineering Experimentation. Spring Chapter III. Random Variables and Probability Distributions.
 ME3620 Theory of Engineering Experimentation Chapter III. Random Variables and Probability Distributions Chapter III 1 3.2 Random Variables In an experiment, a measurement is usually denoted by a variable
1. You are given the following information about a stationary AR(2) model:
 model:") Fall 2003 Society of Actuaries **BEGINNING OF EXAMINATION** 1. You are given the following information about a stationary AR(2) model: (i) ρ 1 = 05. (ii) ρ 2 = 01. Determine φ 2. (A) 0.2 (B) 0.1 (C) 0.4
Fall 2003 Society of Actuaries **BEGINNING OF EXAMINATION** 1. You are given the following information about a stationary AR(2) model: (i) ρ 1 = 05. (ii) ρ 2 = 01. Determine φ 2. (A) 0.2 (B) 0.1 (C) 0.4
The University of Chicago, Booth School of Business Business 41202, Spring Quarter 2009, Mr. Ruey S. Tsay. Solutions to Final Exam
 The University of Chicago, Booth School of Business Business 41202, Spring Quarter 2009, Mr. Ruey S. Tsay Solutions to Final Exam Problem A: (42 pts) Answer briefly the following questions. 1. Questions
Lecture 5: Fundamentals of Statistical Analysis and Distributions Derived from Normal Distributions
 Lecture 5: Fundamentals of Statistical Analysis and Distributions Derived from Normal Distributions ELE 525: Random Processes in Information Systems Hisashi Kobayashi Department of Electrical Engineering
Homework Assignments
 Homework Assignments Week 1 (p. 57) #4.1, 4., 4.3 Week (pp 58 6) #4.5, 4.6, 4.8(a), 4.13, 4.0, 4.6(b), 4.8, 4.31, 4.34 Week 3 (pp 15 19) #1.9, 1.1, 1.13, 1.15, 1.18 (pp 9 31) #.,.6,.9 Week 4 (pp 36 37)
Chapter 7. Inferences about Population Variances
 Chapter 7. Inferences about Population Variances Introduction () The variability of a population s values is as important as the population mean. Hypothetical distribution of E. coli concentrations from
Definition 9.1 A point estimate is any function T (X 1,..., X n ) of a random sample. We often write an estimator of the parameter θ as ˆθ.
 of a random sample. We often write an estimator of the parameter θ as ˆθ.") 9 Point estimation 9.1 Rationale behind point estimation When sampling from a population described by a pdf f(x θ) or probability function P [X = x θ] knowledge of θ gives knowledge of the entire population.
9 Point estimation 9.1 Rationale behind point estimation When sampling from a population described by a pdf f(x θ) or probability function P [X = x θ] knowledge of θ gives knowledge of the entire population.
All Investors are Risk-averse Expected Utility Maximizers. Carole Bernard (UW), Jit Seng Chen (GGY) and Steven Vanduffel (Vrije Universiteit Brussel)
, Jit Seng Chen (GGY) and Steven Vanduffel (Vrije Universiteit Brussel)") All Investors are Risk-averse Expected Utility Maximizers Carole Bernard (UW), Jit Seng Chen (GGY) and Steven Vanduffel (Vrije Universiteit Brussel) First Name: Waterloo, April 2013. Last Name: UW ID #:
All Investors are Risk-averse Expected Utility Maximizers Carole Bernard (UW), Jit Seng Chen (GGY) and Steven Vanduffel (Vrije Universiteit Brussel) First Name: Waterloo, April 2013. Last Name: UW ID #:
Bivariate Birnbaum-Saunders Distribution
 Department of Mathematics & Statistics Indian Institute of Technology Kanpur January 2nd. 2013 Outline 1 Collaborators 2 3 Birnbaum-Saunders Distribution: Introduction & Properties 4 5 Outline 1 Collaborators
Basic notions of probability theory: continuous probability distributions. Piero Baraldi
 Basic notions of probability theory: continuous probability distributions Piero Baraldi Probability distributions for reliability, safety and risk analysis: discrete probability distributions continuous
Lecture Notes 6. Assume F belongs to a family of distributions, (e.g. F is Normal), indexed by some parameter θ.
, indexed by some parameter θ.") Sufficient Statistics Lecture Notes 6 Sufficiency Data reduction in terms of a particular statistic can be thought of as a partition of the sample space X. Definition T is sufficient for θ if the conditional
Sufficient Statistics Lecture Notes 6 Sufficiency Data reduction in terms of a particular statistic can be thought of as a partition of the sample space X. Definition T is sufficient for θ if the conditional
continuous rv Note for a legitimate pdf, we have f (x) 0 and f (x)dx = 1. For a continuous rv, P(X = c) = c f (x)dx = 0, hence
 0 and f (x)dx = 1. For a continuous rv, P(X = c) = c f (x)dx = 0, hence") continuous rv Let X be a continuous rv. Then a probability distribution or probability density function (pdf) of X is a function f(x) such that for any two numbers a and b with a b, P(a X b) = b a f (x)dx.
continuous rv Let X be a continuous rv. Then a probability distribution or probability density function (pdf) of X is a function f(x) such that for any two numbers a and b with a b, P(a X b) = b a f (x)dx.
Applications of Good s Generalized Diversity Index. A. J. Baczkowski Department of Statistics, University of Leeds Leeds LS2 9JT, UK
 Applications of Good s Generalized Diversity Index A. J. Baczkowski Department of Statistics, University of Leeds Leeds LS2 9JT, UK Internal Report STAT 98/11 September 1998 Applications of Good s Generalized
Random Variables and Probability Distributions
 Chapter 3 Random Variables and Probability Distributions Chapter Three Random Variables and Probability Distributions 3. Introduction An event is defined as the possible outcome of an experiment. In engineering
Some Characteristics of Data
 Some Characteristics of Data Not all data is the same, and depending on some characteristics of a particular dataset, there are some limitations as to what can and cannot be done with that data. Some key
NORMAL APPROXIMATION. In the last chapter we discovered that, when sampling from almost any distribution, e r2 2 rdrdϕ = 2π e u du =2π.
 NOMAL APPOXIMATION Standardized Normal Distribution Standardized implies that its mean is eual to and the standard deviation is eual to. We will always use Z as a name of this V, N (, ) will be our symbolic
Chapter 4: Commonly Used Distributions. Statistics for Engineers and Scientists Fourth Edition William Navidi
 Chapter 4: Commonly Used Distributions Statistics for Engineers and Scientists Fourth Edition William Navidi 2014 by Education. This is proprietary material solely for authorized instructor use. Not authorized
Much of what appears here comes from ideas presented in the book:
 Chapter 11 Robust statistical methods Much of what appears here comes from ideas presented in the book: Huber, Peter J. (1981), Robust statistics, John Wiley & Sons (New York; Chichester). There are many
Slides for Risk Management
 Slides for Risk Management Introduction to the modeling of assets Groll Seminar für Finanzökonometrie Prof. Mittnik, PhD Groll (Seminar für Finanzökonometrie) Slides for Risk Management Prof. Mittnik,
Version A. Problem 1. Let X be the continuous random variable defined by the following pdf: 1 x/2 when 0 x 2, f(x) = 0 otherwise.
 = 0 otherwise.") Math 224 Q Exam 3A Fall 217 Tues Dec 12 Version A Problem 1. Let X be the continuous random variable defined by the following pdf: { 1 x/2 when x 2, f(x) otherwise. (a) Compute the mean µ E[X]. E[X] x
Math 224 Q Exam 3A Fall 217 Tues Dec 12 Version A Problem 1. Let X be the continuous random variable defined by the following pdf: { 1 x/2 when x 2, f(x) otherwise. (a) Compute the mean µ E[X]. E[X] x
Non-informative Priors Multiparameter Models
 Non-informative Priors Multiparameter Models Statistics 220 Spring 2005 Copyright c 2005 by Mark E. Irwin Prior Types Informative vs Non-informative There has been a desire for a prior distributions that
MODELLING OF INCOME AND WAGE DISTRIBUTION USING THE METHOD OF L-MOMENTS OF PARAMETER ESTIMATION
 International Days of Statistics and Economics, Prague, September -3, MODELLING OF INCOME AND WAGE DISTRIBUTION USING THE METHOD OF L-MOMENTS OF PARAMETER ESTIMATION Diana Bílková Abstract Using L-moments
Sampling Distribution
 MAT 2379 (Spring 2012) Sampling Distribution Definition : Let X 1,..., X n be a collection of random variables. We say that they are identically distributed if they have a common distribution. Definition
BROWNIAN MOTION Antonella Basso, Martina Nardon
 BROWNIAN MOTION Antonella Basso, Martina Nardon basso@unive.it, mnardon@unive.it Department of Applied Mathematics University Ca Foscari Venice Brownian motion p. 1 Brownian motion Brownian motion plays
Lecture 2. Probability Distributions Theophanis Tsandilas
 Lecture 2 Probability Distributions Theophanis Tsandilas Comment on measures of dispersion Why do common measures of dispersion (variance and standard deviation) use sums of squares: nx (x i ˆµ) 2 i=1
Homework Problems Stat 479
 Chapter 10 91. * A random sample, X1, X2,, Xn, is drawn from a distribution with a mean of 2/3 and a variance of 1/18. ˆ = (X1 + X2 + + Xn)/(n-1) is the estimator of the distribution mean θ. Find MSE(
Section 7.1: Continuous Random Variables
 Section 71: Continuous Random Variables Discrete-Event Simulation: A First Course c 2006 Pearson Ed, Inc 0-13-142917-5 Discrete-Event Simulation: A First Course Section 71: Continuous Random Variables
Chapter 3 Common Families of Distributions. Definition 3.4.1: A family of pmfs or pdfs is called exponential family if it can be expressed as
 Lecture 0 on BST 63: Statistical Theory I Kui Zhang, 09/9/008 Review for the previous lecture Definition: Several continuous distributions, including uniform, gamma, normal, Beta, Cauchy, double exponential
All Investors are Risk-averse Expected Utility Maximizers
 All Investors are Risk-averse Expected Utility Maximizers Carole Bernard (UW), Jit Seng Chen (GGY) and Steven Vanduffel (Vrije Universiteit Brussel) AFFI, Lyon, May 2013. Carole Bernard All Investors are
Analysis of extreme values with random location Abstract Keywords: 1. Introduction and Model
 Analysis of extreme values with random location Ali Reza Fotouhi Department of Mathematics and Statistics University of the Fraser Valley Abbotsford, BC, Canada, V2S 7M8 Ali.fotouhi@ufv.ca Abstract Analysis
Understanding Tail Risk 1
 Understanding Tail Risk 1 Laura Veldkamp New York University 1 Based on work with Nic Kozeniauskas, Julian Kozlowski, Anna Orlik and Venky Venkateswaran. 1/2 2/2 Why Study Information Frictions? Every
Random variables. Contents
 Random variables Contents 1 Random Variable 2 1.1 Discrete Random Variable............................ 3 1.2 Continuous Random Variable........................... 5 1.3 Measures of Location...............................
Unit 5: Sampling Distributions of Statistics
 Unit 5: Sampling Distributions of Statistics Statistics 571: Statistical Methods Ramón V. León 6/12/2004 Unit 5 - Stat 571 - Ramon V. Leon 1 Definitions and Key Concepts A sample statistic used to estimate
Unit 5: Sampling Distributions of Statistics
 Unit 5: Sampling Distributions of Statistics Statistics 571: Statistical Methods Ramón V. León 6/12/2004 Unit 5 - Stat 571 - Ramon V. Leon 1 Definitions and Key Concepts A sample statistic used to estimate
Statistics and Finance
 David Ruppert Statistics and Finance An Introduction Springer Notation... xxi 1 Introduction... 1 1.1 References... 5 2 Probability and Statistical Models... 7 2.1 Introduction... 7 2.2 Axioms of Probability...
SYSM 6304 Risk and Decision Analysis Lecture 2: Fitting Distributions to Data
 SYSM 6304 Risk and Decision Analysis Lecture 2: Fitting Distributions to Data M. Vidyasagar Cecil & Ida Green Chair The University of Texas at Dallas Email: M.Vidyasagar@utdallas.edu September 5, 2015
Appendix A. Selecting and Using Probability Distributions. In this appendix
 Appendix A Selecting and Using Probability Distributions In this appendix Understanding probability distributions Selecting a probability distribution Using basic distributions Using continuous distributions
Statistical Tables Compiled by Alan J. Terry
 Statistical Tables Compiled by Alan J. Terry School of Science and Sport University of the West of Scotland Paisley, Scotland Contents Table 1: Cumulative binomial probabilities Page 1 Table 2: Cumulative
The Bernoulli distribution
 This work is licensed under a Creative Commons Attribution-NonCommercial-ShareAlike License. Your use of this material constitutes acceptance of that license and the conditions of use of materials on this
The Normal Distribution
 The Normal Distribution The normal distribution plays a central role in probability theory and in statistics. It is often used as a model for the distribution of continuous random variables. Like all models,
Chapter 4 Continuous Random Variables and Probability Distributions
 Chapter 4 Continuous Random Variables and Probability Distributions Part 2: More on Continuous Random Variables Section 4.5 Continuous Uniform Distribution Section 4.6 Normal Distribution 1 / 27 Continuous
An Introduction to Stochastic Calculus
 An Introduction to Stochastic Calculus Haijun Li lih@math.wsu.edu Department of Mathematics Washington State University Week 2-3 Haijun Li An Introduction to Stochastic Calculus Week 2-3 1 / 24 Outline
Tutorial 11: Limit Theorems. Baoxiang Wang & Yihan Zhang bxwang, April 10, 2017
 Tutorial 11: Limit Theorems Baoxiang Wang & Yihan Zhang bxwang, yhzhang@cse.cuhk.edu.hk April 10, 2017 1 Outline The Central Limit Theorem (CLT) Normal Approximation Based on CLT De Moivre-Laplace Approximation
STRESS-STRENGTH RELIABILITY ESTIMATION
 CHAPTER 5 STRESS-STRENGTH RELIABILITY ESTIMATION 5. Introduction There are appliances (every physical component possess an inherent strength) which survive due to their strength. These appliances receive
Mongolia s TOP-20 Index Risk Analysis, Pt. 3
 Mongolia s TOP-20 Index Risk Analysis, Pt. 3 Federico M. Massari March 12, 2017 In the third part of our risk report on TOP-20 Index, Mongolia s main stock market indicator, we focus on modelling the right
Risk management. Introduction to the modeling of assets. Christian Groll
 Risk management Introduction to the modeling of assets Christian Groll Introduction to the modeling of assets Risk management Christian Groll 1 / 109 Interest rates and returns Interest rates and returns
Deriving the Black-Scholes Equation and Basic Mathematical Finance
 Deriving the Black-Scholes Equation and Basic Mathematical Finance Nikita Filippov June, 7 Introduction In the 97 s Fischer Black and Myron Scholes published a model which would attempt to tackle the issue
Statistics for Business and Economics
 Statistics for Business and Economics Chapter 5 Continuous Random Variables and Probability Distributions Ch. 5-1 Probability Distributions Probability Distributions Ch. 4 Discrete Continuous Ch. 5 Probability
Stochastic model of flow duration curves for selected rivers in Bangladesh
 Climate Variability and Change Hydrological Impacts (Proceedings of the Fifth FRIEND World Conference held at Havana, Cuba, November 2006), IAHS Publ. 308, 2006. 99 Stochastic model of flow duration curves
WEATHER EXTREMES AND CLIMATE RISK: STOCHASTIC MODELING OF HURRICANE DAMAGE
 WEATHER EXTREMES AND CLIMATE RISK: STOCHASTIC MODELING OF HURRICANE DAMAGE Rick Katz Institute for Study of Society and Environment National Center for Atmospheric Research Boulder, CO USA Email: rwk@ucar.edu
12 The Bootstrap and why it works
 12 he Bootstrap and why it works For a review of many applications of bootstrap see Efron and ibshirani (1994). For the theory behind the bootstrap see the books by Hall (1992), van der Waart (2000), Lahiri
Financial Risk Management
 Financial Risk Management Professor: Thierry Roncalli Evry University Assistant: Enareta Kurtbegu Evry University Tutorial exercices #4 1 Correlation and copulas 1. The bivariate Gaussian copula is given
Favorite Distributions
 Favorite Distributions Binomial, Poisson and Normal Here we consider 3 favorite distributions in statistics: Binomial, discovered by James Bernoulli in 1700 Poisson, a limiting form of the Binomial, found
4-1. Chapter 4. Commonly Used Distributions by The McGraw-Hill Companies, Inc. All rights reserved.
 4-1 Chapter 4 Commonly Used Distributions 2014 by The Companies, Inc. All rights reserved. Section 4.1: The Bernoulli Distribution 4-2 We use the Bernoulli distribution when we have an experiment which
Statistics and Probability
 Statistics and Probability Continuous RVs (Normal); Confidence Intervals Outline Continuous random variables Normal distribution CLT Point estimation Confidence intervals http://www.isrec.isb-sib.ch/~darlene/geneve/
Clark. Outside of a few technical sections, this is a very process-oriented paper. Practice problems are key!
 Opening Thoughts Outside of a few technical sections, this is a very process-oriented paper. Practice problems are key! Outline I. Introduction Objectives in creating a formal model of loss reserving:
NEWCASTLE UNIVERSITY SCHOOL OF MATHEMATICS & STATISTICS SEMESTER /2013 MAS8304. Environmental Extremes: Mid semester test
 NEWCASTLE UNIVERSITY SCHOOL OF MATHEMATICS & STATISTICS SEMESTER 2 2012/2013 Environmental Extremes: Mid semester test Time allowed: 50 minutes Candidates should attempt all questions. Marks for each question
Estimation Procedure for Parametric Survival Distribution Without Covariates
 Estimation Procedure for Parametric Survival Distribution Without Covariates The maximum likelihood estimates of the parameters of commonly used survival distribution can be found by SAS. The following
FINITE SAMPLE DISTRIBUTIONS OF RISK-RETURN RATIOS
 Available Online at ESci Journals Journal of Business and Finance ISSN: 305-185 (Online), 308-7714 (Print) http://www.escijournals.net/jbf FINITE SAMPLE DISTRIBUTIONS OF RISK-RETURN RATIOS Reza Habibi*
1 Geometric Brownian motion
 Copyright c 05 by Karl Sigman Geometric Brownian motion Note that since BM can take on negative values, using it directly for modeling stock prices is questionable. There are other reasons too why BM is
High-Frequency Data Analysis and Market Microstructure [Tsay (2005), chapter 5]
![High-Frequency Data Analysis and Market Microstructure [Tsay (2005), chapter 5]](/thumbs/79/79153367.jpg "High-Frequency Data Analysis and Market Microstructure [Tsay (2005), chapter 5]") 1 High-Frequency Data Analysis and Market Microstructure [Tsay (2005), chapter 5] High-frequency data have some unique characteristics that do not appear in lower frequencies. At this class we have: Nonsynchronous
1 High-Frequency Data Analysis and Market Microstructure [Tsay (2005), chapter 5] High-frequency data have some unique characteristics that do not appear in lower frequencies. At this class we have: Nonsynchronous
An Information Based Methodology for the Change Point Problem Under the Non-central Skew t Distribution with Applications.
 An Information Based Methodology for the Change Point Problem Under the Non-central Skew t Distribution with Applications. Joint with Prof. W. Ning & Prof. A. K. Gupta. Department of Mathematics and Statistics
IEOR 165 Lecture 1 Probability Review
 IEOR 165 Lecture 1 Probability Review 1 Definitions in Probability and Their Consequences 1.1 Defining Probability A probability space (Ω, F, P) consists of three elements: A sample space Ω is the set
Choice Probabilities. Logit Choice Probabilities Derivation. Choice Probabilities. Basic Econometrics in Transportation.
 1/31 Choice Probabilities Basic Econometrics in Transportation Logit Models Amir Samimi Civil Engineering Department Sharif University of Technology Primary Source: Discrete Choice Methods with Simulation
Practice Exercises for Midterm Exam ST Statistical Theory - II The ACTUAL exam will consists of less number of problems.
 Practice Exercises for Midterm Exam ST 522 - Statistical Theory - II The ACTUAL exam will consists of less number of problems. 1. Suppose X i F ( ) for i = 1,..., n, where F ( ) is a strictly increasing