Financial and Fiscal Commission. Training Workshop
|
|
|
- Hector Kelly
- 5 years ago
- Views:
Transcription
1 Financial and Fiscal Commission Training Workshop
2 Background Outline Constitutional Imperative Institutional Framework Economic Rationale Historical Background Current Structure The review Current Thinking 2
3 WHAT IS THE FINANCIAL AND FISCAL COMMISSION? The Financial and Fiscal Commission is established in terms of the 1996 Constitution through the Financial and Fiscal Commission Act. The role, function and powers of the Commission are determined by: The Constitution, The Commission must report to national and provincial legislatures The Financial and Fiscal Commission Act, and The Intergovernmental Fiscal Relations Act.
4 WHAT IS THE COMMISSION S KEY FUNCTION? The Commission must consider: The annual division of revenue between and among the three spheres of government Any other - Conditional or - unconditional allocations to provinces or Local Government.
5 Constitutional Imperatives Section 217 Spheres entitled to Equitable Share of Nationally Raised Revenue Why? Provinces have narrow based taxes but extensive spending responsibilities Vast variations in fiscal capacities Does not prescribe methodology for determining each province share of the provincial pool Only list factors to be considered when making such determination. 214 (2) (a-j) 5
6 Constitutional imperatives 214 (2) (a j) National interest National debt Needs and interest of national Ability to perform functions by provinces Fiscal capacity Developmental needs Economic disparities Provincial obligations Stability, predictability flexibility How does the formula take all these factors into account? 6
7 Institutional framework The ES functions within an IGFR system comprising of: National Treasury Budget Council Budget Forum TCF IGFR forums such as 10 X 10 Financial and Fiscal Commission FFC Interacts with various stakeholders throughout national budget process through its work cycle An Act of Parliament on the Equitable Division of Nationally Raised Revenue may only be enacted after the FFC has been consulted 7

8 Economic Rationale for Grants Dominant sources of revenue for Sub-national governments True for provinces in South Africa Necessary for the Fiscal Health of provinces Facilitate services delivery 8
9 Economic Rationale... Redistribution: Vertical gap Division of Nationally Raised Revenue between National, Provincial and Local no funding Is a consultative political process rule? Why? Revenue Own Revenue Provincial revenue pool: Motor Vehicle Licenses Gambling Taxes Hospital Fees Local: User Charges Property Taxes 3-7% 10-90% National Revenue Pool: Income Tax Corporate Tax VAT Fuel Levy Custom duties 9
10 Economic rationale... Redistribution: Horizontal gap 14.4 GDP-R Corrects for disparities in inter-regional resource mobilisation Fiscal harmonization or equalisation Ensures that individuals with similar circumstances in different provinces get similar benefits or services Intergovernmental spillovers 16.7 EC FS GT KZN LP MP NC NW WC Incentivize provision of service that would otherwise not be 10
11 Categories of grants... Broadly grants are classified into two categories Unconditional Conditional PES is both unconditional and non-matching No matching grants in SA Matching Schedule 5 Non Matching Schedule 4 Block grants 11

")
12 Methodology for distributing grants Numerous methods of allocating transfers are available Ad hoc based Origin of collection Cost reimbursement Performance based Formula based Used in SA between 1994 and 1998 (Decentralised decisions) Partial or Total 12
13 Principles of good transfer... Autonomy Priorities? Adequacy Equity Take into account both expenditure needs and fiscal capacity Incentives Transfer system Compliance? Simplicity Efficiency Predictability Does the PES formula comply with all these factors? 13
14 FFC Analytical Framework For the PES


15 Background to the PES PES is a transfer/grant mechanism that distributes funds among provinces Underpinned by the constitution Incepted in 1998 Components based and population driven Under-gone several reviews since inception 15

 Health (18) Social Security(17) Economic")
16 Historical Background During its 1996 submission the Financial and Fiscal Commission recommended a formula based approach to the division of revenue. At inception the formula comprised of seven components Each component uses certain variables as a needs indicator Weighted equally across province Education(40) Health (18) Social Security(17) Economic Activity(8) Backlogs(3) Basic(9) and Institutional component(5) 16

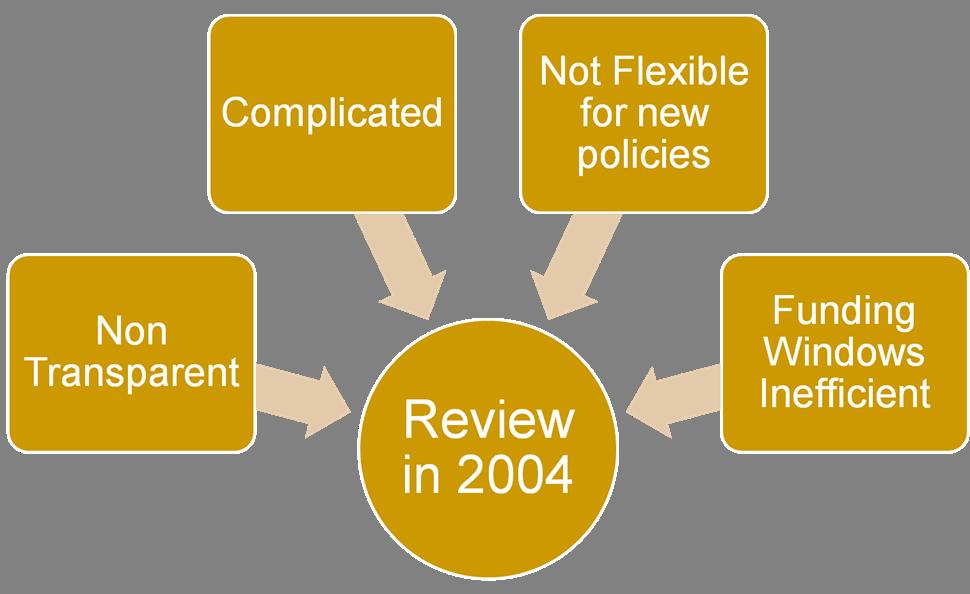
17 Historical background Formula has undergone numerous review since inception. In 2001 Backlog component In 2004 social security component Introduction of the poverty component In 2006: Demarcation Annual update of data What about other provincial functions? Can the weights be used as budgets guides? Notes: The 2004 review raised quite a Number of Issues. Demarcation was also problematic. 17
18 Current structure of PES /horizontal division Six components with associated weights Education (51%) Learner enrolment, school age population Health (26%) Proportion of people with/without medical aid Basic (14%) Province share of national population Institutional (5%) Divided equally between provinces Poverty (3%) Proportion of poor (quintile 1 and 2) people in a province Economic output (1%) Contribution of provinces to GDP Institutional 5 Basic 14 Health 26 Poverty 3 Economic Output 1 Education 51 18
19 Determining the PES pool Provincial equitable share pool is firstly dertermined from national revenue National R274 b (49,5) Provinces R238b (43%) Local R42 b (7,6) Divided through the PES formula/ model R38b Conditional R200b PES 19

20 The PES Formula/model Specified as: P a = E i +H i +B i +P i +E i +I i Where P a = provincial allocation The PES model is deterministic E = province s share of education component H = province s share of health component B = province s share of basic component P = province s share of poverty component E = province s share of economic activity component I = province s share of institutional component Outcomes are precisely determined through known relationships 20
21 How it works: Calculating Education component School enrolment 1 Age cohort 5-17 % share school enrolment % share age cohort Snap Survey Census, 2001 (demarcated) 1 1 Weighted average Eastern Cape 2,139,668 2,151, % 16.6% 16.9% Free State 680, , % 5.9% 5.7% Gauteng 1,883,550 1,893, % 14.6% 14.9% KwaZulu-Natal 2,848,878 3,013, % 23.3% 23.1% Limpopo 1,782,954 1,798, % 13.9% 14.1% Mpumalanga 1,087,774 1,074, % 8.3% 8.5% Northern Cape 264, , % 2.2% 2.2% North West 753, , % 6.7% 6.4% Western Cape 969,065 1,094, % 8.5% 8.1% TOTAL 12,410,501 12,933, % 100.0% 100.0% 21
22 Health Component 2006 General household survey (demarcation) Weighting: With medical aid Weighting: Without medical aid Weighted total Weighted share Population with medical aid Population without medical aid 1 4 Eastern Cape 713 6, ,536 25, % Free State 439 2, ,072 10, % Gauteng 2,058 7,550 2,058 30,200 32, % KwaZulu-Natal 1,062 8,855 1,062 35,420 36, % Limpopo 374 5, ,052 20, % Mpumalanga 367 3, ,488 12, % Northern Cape ,884 4, % North West 468 2, ,240 11, % Western Cape 893 3, ,400 16, % TOTAL 6,505 40,823 6, , , % 22
23 Basic component 2007 Community Survey Total Weighted share Eastern Cape % Free State % Gauteng % KwaZulu-Natal % Limpopo % Mpumalanga % Northern Cape % North West % Western Cape % TOTAL % 23
24 Poverty component IES Survey 2000 (Q1+Q2) Basic component value Poverty index 1 Weighted share Eastern Cape 56.4% % Free State 45.7% % Gauteng 21.9% % KwaZulu-Natal 43.0% % Limpopo 56.3% % Mpumalanga 36.9% % Northern Cape 44.0% % North West 37.9% % Western Cape 14.6% % TOTAL % 24
25 Institutional component Weighted share Eastern Cape 11.1% Free State 11.1% Gauteng 11.1% KwaZulu-Natal 11.1% Limpopo 11.1% Mpumalanga 11.1% Northern Cape 11.1% North West 11.1% Western Cape 11.1% TOTAL 100.0% 25
26 Economic activity GDP-R, 2004 (preliminary) (R million) Weighted share Eastern Cape 122, % Free State 84, % Gauteng 519, % KwaZulu-Natal 251, % Limpopo 103, % Mpumalanga 102, % Northern Cape 33, % North West 97, % Western Cape 225, % TOTAL 1,539, % 26
27 Total shares Education Health Social Welfar e Basic Poverty Economic Activ ity Institution al Weighted Aver age 51% 26% 0% 14% 3% 1% 5% 100% Eastern Cape 16.9% 14.9% 13.5% 20.0% 7.9% 11.1% 15.6% Free State 5.7% 6.2% 5.7% 6.9% 5.5% 11.1% 6.1% Gauteng 14.9% 19.0% 21.5% 12.4% 33.7% 11.1% 16.8% KwaZulu-Natal 23.1% 21.5% 21.2% 23.9% 16.3% 11.1% 21.8% Limpopo 14.1% 12.0% 10.8% 16.0% 6.7% 11.1% 13.0% Mpumalanga 8.5% 7.6% 7.5% 7.3% 6.7% 11.1% 8.2% Northern Cape 2.2% 2.4% 2.2% 2.5% 2.2% 11.1% 2.7% North West 6.4% 6.9% 6.7% 6.7% 6.3% 11.1% 6.8% Western Cape 8.1% 9.6% 10.9% 4.2% 14.7% 11.1% 9.0% TOTAL 100.0% 100.0% 100.0% 100.0% 100.0% 100.0% 100.0% 27
28 Implementation of the equitable share weights, 2009/ / / / / /13 w eighted 2010 MTEF weighted shares 3-year phasing shares Percentage Eastern Cape 15.6% 15.5% 15.4% 15.2% Free State 6.2% 6.1% 6.1% 6.0% Gauteng 16.9% 17.3% 17.4% 17.4% Kw azulu-natal 21.6% 21.7% 21.8% 22.0% Limpopo 12.9% 12.8% 12.7% 12.6% Mpumalanga 8.2% 8.2% 8.2% 8.1% Northern Cape 2.7% 2.7% 2.7% 2.7% North West 7.0% 6.6% 6.7% 6.7% Western Cape 9.0% 9.1% 9.1% 9.2% Total 100.0% 100.0% 100.0% 100.0% 1. The re-alignment to the new boundaries for Gauteng and North West is not phased in over the 2010 MTEF.

29 Calculating the total EC shares EC = (16.9*51)+(14.9*26)+(13.5*14)+(20.0*3)+(11.1* 5)+(7.9*5)=15.6 Therefore Total EC allocation= Total PES share * total provincial pool R200b * 15.6 = ±R30b Model spread sheet 29

30 Question? Is there a way in which the PES formula can be manipulated to give more money to our province? The formula treats each province equally by using data which is independently collected. This eliminate possibilities of manipulation. Additional funding is motivated at the vertical level 30

31 The review: why the reforms Why review the formula? The removal of social welfare in 2004 prompted need for comprehensive review Misalignment between weightings and provincial spending The formula was challenged for its redistributiveness Arbitrary determination of weightings The FFC was requested to lead the review process 31

32 The review Driven by inputs from provinces the review focused on the following Channeling resources to poor provinces Is the PES Redistributive? Incorporation of Social welfare component into the formula Addressing economic disparities between provinces Alternate funding mechanism for provincial developmental needs Exploring new indicators for formula components 32
33 The review Balance between provincial discretion and national policy Finding alternative to demographically driven allocation formula Determining the formula s relevance to current policy trajectory Assessing the feasibility of a costed norms approach The model So what are the result of the analysis? 33
34 Results of the Review Addressing multiple objectives PES is overloaded with many policy objectives Whose priorities should be funded first? Basic nature of the PES Should the PES be an unconditional general purpose grant or conditional transfer? PES is generally redistributive Analysis of data indicates that the formula redistributes from richer to poorer provinces (In relative terms) Problem lies with other pillars of the decentralisation system 34
35 Results:Other pillars of Decentralisation System Expenditure assignments Matching allocations to agreed priorities Methodology for Quantifying expenditure needs Clarity on the nature of decentralised expenditure responsibilities Revenue autonomy fiscal capacity in the PES Conditional grants Borrowing 35
36 Current thinking :options for Reform First Option Reform within the confines of current system Address PES problem not related to the system Improve the Performance of the PES PES will retain most part of current structure Bring PES closer to equalisation grant Both on Expenditure need and fiscal capacity Divide the pool into sub-pools in line with objectives E.g. Remove economic activity (or integrated with another component) as it simply constitutes revenue sharing. Distribute (remainder) funds proportionally to the fiscal gap of provinces 36

37 Options For Reform... Where Fiscal Gap = Expenditure Need - Fiscal Capacity Fiscal capacity will be computed from forecasted receipts on revenue sharing and potential own revenue including surcharges Expenditure needs will be calculated using the per-client expenditure norm. Per client expenditure norm computes expenditure needs based on financial standard or norm per client I still don t understand 37
38 Options for reform... Methodology Requires categorisation of main expenditure functions Determination of overall budget envelopes for each category Identification of number of clients for each category The norm can be prescriptive or notional This methodology ensures budget feasibility Require national consensus on key priorities Option does not resolve the structural problems affecting the PES 38
39 Options for Reform... Second Option Reforming other pillars of the system Establish clear link between instruments and objectives Strengthen overall performance of basic social services delivery (Education and Health) Matching allocations to priorities Separate education and health from the PES Convert the components into separate block grants Funds are locked within functions under which provinces are flexible to use funds 39
40 Options For Reform National develop performance standards Funding risk are contained within sector Funds to be distributed through Per Client Expenditure Norm Remove the economic activity component from the formula Close the (supposed) vertical gap Introduce an Equalisation Grant Predetermined fixed funding rule (other functions) Distribution formula based on proportional fiscal gap (excluding education and health) 40

41 Other reform options under 2 Option 2 increases the Fiscal Responsibility and Accountability of Provinces Increase Revenue Autonomy by Activating the PIT and Fuel Levy Surcharges National Government must Create Fiscal Space for Provinces to Tax lessen Impact on Tax Payers 41
42 Local Government Formula
43 Costed Norms Approach
44 - THE COSTED NORMS APPROACH - AN INSTRUMENT FOR THE ALLOCATION OF FINANCIAL RESOURCES For the next three-year MTEF cycle, starting in 2001, the FFC proposes that constitutionally mandated basic social services be provided and that the preferred method for determining the necessary resources be the costed norms approach.
45 DEFINITION The costed norms approach is a formula based method for calculating the financial resources necessary for the provision of basic social service levels, given nationally mandated norms and standards.
46 -WHY USE THE COSTED NORMS APPROACH FOR THE S GRANT? Provides a basis for objective formulae to determine minimum amount of money a province needs to ensure delivery of basic social services, Facilitates reconciliation of decisions on budgets with service delivery to ensure accountability, Recognises the different resource needs of different provinces, but maintains a province s budget-making competency, Provides for allocation of resources in a transparent manner, and Formula allows for flexibility and responsiveness to policy needs.
47 THREE BROAD IMPLEMENTATION STEPS 1. Constitutionally mandated basic level of social services should be determined nationally and should be expressed in terms of norms and standards for each programme area. 2. Fiscal requirements should be determined by taking account of factors affecting provincial conditions and the macroeconomic framework. 3. Total costs of providing basic education, social security, and primary health services may then be calculated for each province.
48 THE VERTICAL DIVISION AND THE COSTED NORMS APPROACH The costed norms approach facilitates political negotiations around the vertical division. It can provide a set of alternative benchmark norms, with each norm being costed. The consequences of budget changes for norms and standards can then be immediately calculated for each sector. The trade-offs thereby become very clear and allow for betterinformed negotiations.
49 KEY RECOMMENDATIONS The provincial equitable share should provide for constitutionally mandated basic levels of social service provision and provinces should be held accountable for the delivery of such services; The FFC has used the Costed Norms Approach in arriving At the formulae for basic education, welfare and health services; Each province should be allocated a Basic (B)Element Basic (B)Element, which will include the provision of services not defined as Constitutionally mandated basic services;
50 KEY RECOMMENDATIONS COTINUED.. Each province should be allocated an Institutional Element set equal to the minimum cost of operating government institution; In view of urgent need, national conditional grand should be allocated to provinces to support the reduction of social infrastructure backlog
51 THE COSTED NORMS APPROACH AND THE SOCIAL SECTOR COMPONENTS
52 EDUCATION Learners divided into nine groups and distinguished Basic education = Ordinary and Special school, Cost per learner in a group is estimated using a series of weights multiplied by a cost per learner - taking account of differences. Total cost to a province is average cost per learner multiplied by the number of learners enrolled. A weighting is introduced to distinguish between funding appropriate and inappropriate age learners
53 LEARNER GROUPS All Special Learner Ordinary Learner Primary Learner Secondary Learner Poor Non-Poor Poor Non-Poor Rural C1 Urban C2 Rural C3 Urban C4 Rural C5 Urban C6 Rural C7 Urban C8
54 The Local Government Equitable Share (LES) Formula 54
55 Introduction Presentation Outline Overview of LG fiscal framework and the need for equalisation Evolution of LES Previous FFC recommendations and inputs Overview of current formula FFC LES analytical tools FFC LES simulation model Practical illustrations 55
56 Origin Introduction Sections 214 and 227 of Constitution Characteristic Unconditional Purpose Assist municipalities to fulfill their constitutional mandate Composition 3 Funding mechanisms Largest via a formula RSC levy replacement grant for district municipalities Special Councillor remuneration
57 LG fiscal framework Funding requirements of a municipality equals: Expenditure Service delivery and developmental responsibilities Cost of governance, admin, planning and regulation MINUS Revenues Own revenues Transfers Borrowing Schedule 4 (B) of Constitution Water and sanitation Electricity (Category B) Roads and stormwater Municipal solid waste/refuse removal Municipal public services (environmental health, community services, security services, public safety, parks and recreation) Agency services (libraries) Section 229 of the Constitution Property tax (Categories A and B) User charges for water, sanitation, electricity (authorised municipalities) Surcharges on municipal services (authorised municipalities) Other (donations, etc.) Section 214 of the Constitution LGES, Infrastructure Grants, Capacity Building Grants, Grants-inkind, Transfers from provinces 57
58 Differences among Municipalities Average % HH without services Average Own Revenue Average GVA contribution to national GVA Type of Municipality Average Population Average % Poor Average Budget Size Grant Dependance Metropolitan Municipality 2,445,720 33% 27% R 13,688,520,038 61% 25% 9.763% Average Poor Municipality 180,026 70% 77% R 88,373,705 22% 62% 0.078% Fiscal Gap = Expenditure Responsibilities Own Revenues Gap can be vertical (per sphere) or horizontal (per municipality) LES intended to fill this funding gap 58
59 The importance of expenditure equalisation ethekwini Revenue P Rates 28% Grants 21% ethekwini Operating Budget 2008/09 = R17.5 Billion User charges 44% Other 7% Albert Luthuli Revenue Grants 69% Other 6% User charges 10% P Rates 15% Albert Luthuli Operating Budget 2008/09 = R130 million 59
60 Evolution of the LGES Changes to account for the costs of: Transformation (incl. re-demarcation) Data updates New Priorities such as FBS policies Increased demand for basic services 60
")
61 Evolution of the LGES (1) 61


62 Evolution of the LGES (2) 62
63 Previous Formula 2004 Funding Windows of the 2004 LES Allocations % R293 allocations % S-grant % I-grant % Nodal allocations % Free basic serv ices (w ater, sanitation and refuse) % Free basic electricity /energy % Total % 63

64 Shortcomings of previous formula 64


65 Previous FFC recommendations and inputs into current formula 65
66 The Current LES LES = BS + I + D RRC ± C Where: BS = Basic Services Component I = Institutional Component D = Development Component RRC = Revenue Raising Component C = Correction Component 66
67 Important Features of the LES In most cases, municipalities treated uniformly in allocation process Allocations are done within 3 year budget cycles (MTEF) Allocations 100% guaranteed in year 1 (DORA), 90% in year 2 and 0% in year 3 Funds follow functions i.e. Functions as authorised by Minister (CoGTA) and MEC for LG important Development component currently inactive Changes to parameters result in shifts in allocations from one municipality to another Total gains to LG via vertical division
68 Basic Services Component Purpose Enable municipalities to provide basic services and free basic services Attempts to compliment the MIG Characteristics Supports households earning less than R800 per month Recognises water reticulation, sanitation, refuse removal, electricity reticulation and environmental health as basic services Distinction between poor households actually serviced and poor households receiving no service 68
69 Basic Services Component BS = [Water Subsidy1 * Poor with Water + Water Subsidy 2* Poor without Water] + [Sanitation Subsidy1 * Poor with Sanitation + Sanitation Subsidy2 * Poor without Sanitation] + [Refuse Subsidy1 * Poor with Refuse + Refuse Subsidy2 * Poor without Refuse] + [Electricity Subsidy1 * Poor with Electricity + Electricity Subsidy2 * Poor without Electricity] + 69
70 Basic Services Component Servicing parameters W ith services without Cost of water Cost of sanitation Cost of refuse Cost of electricity Health Basket of services
71 Institutional Support Purpose Supplement the funding of a municipality for administrative and governance cost Deemed to be avenue to fund mainly poor municipalities Accrues to all municipalities, unlike I grant in previous formula Assumes high economies of scale in local administration with increased population Structure I = Base Allocation + [Admin support*population] + [Councillor Support*Number of seats] 71
72 Institutional Component I grant Baseline allocation Escalation with population 1 Councillors
73 Revenue Raising Component LES = (BS + I + D) - {(PR*T) + (RSC/FL*T)} Where BS = Basic Services Component I = Institutional Component D = Development Component PR = Predicted Property Rates RSC/F = Regional Services Council/Fuel Levy T = Tax Rate Differentiated Tax arrangements Tax rates Tax rates range Rating Prop rates RSC % A 6% % C 6% % % % % % %


74 Changes in allocation shares Previous formula focused funding on rural municipalities Introduction of new formula saw a reverse trend, aided by introduction of health component Differentiated tax approach attempted to reverse trend 74
75 Technical Design Issues Measure of Poverty Income less than R800 used since 1998 including updates of census No inflation adjustments (link with social grants??) Imputed expenditure more accurate Data Updates Updates with census? Once every 10 years? Ability to account for migration? Basic Services Component Accurate costing of municipal services is required to inform vertical and horizontal divisions Institutional Component No Costing of what constitutes an effective local admin undertaken I grant large for metros and urban areas, should they receive it?? Funds more needed in rural areas? Revenue Raising Component Not efficient to use actual PR collected and can be unconstitutional (S227(2)) Tax bands applied in steps, not a smooth gradient Development Component Internationally, most Intergovernmental transfers of a social nature Should official remove component??
76 LES and Broader LG Policy Differentiated Approach Already effective in MIG Extend to LES?? Appropriately funding Rural municipalities Funding should be linked to broader rural development policies Appropriately funding Urban municipalities Increased migration to urban centres Role of Metros/urban municipalities in economic development Municipalities in-between the extremes? Separate formulae to achieve different goals? Funding Maintenance through the LES and link with MIG Increasing maintenance backlog (lack of funds or poor budgeting) No link between additional opex with new infrastructure via MIG grant How would the subsidy be measured?
77 FFC LES Simulation Model Developed in 2009 to assist LES Review Depicts data on specific municipalities Analyses changes to preset parameters Changes analysed per municipality and by categories of municipalities Spatial Characteristics and Density Census and CS Population Categories Poor Households Income 2004 Gross Value Added (Economic Activity) 77
78 Practical Illustrations Overview and description of current LES formula spreadsheet used by NT FFC LES simulation model Overview of model Simulations Measure sensitivity of current parameters Analyse shifts in allocations and ability to target municipalities Changes to poverty measure to assist poor HH Changes in I Component to assist poor municipalities Methods to increase funds to urban municipalities 78
79 8- Way forward Defining elements of the results chain from financial inputs to physical outputs, outcomes and developmental impacts requires non-financial data to measure efficiency and effectiveness; Analysing linkages between policy objectives, the legal framework, institutional and governance capacity, service delivery levels and modalities, accountability mechanisms and developmental impact; Assist development of capacity of Parliamentary Budget Office. What value can we add?
80 Budget Analysis 80
81 Overview of Presentation 1. Introduction 2. Definitions and indicators 3. Budget process and outputs 4. Situational analysis 5. Medium term trends and budget analysis for provinces Medium term trends and budget analysis for municipalities Conclusions and Way forward
82 1- Introduction What does budget analysis involve? With financial data available: Review of past trends which affect future budget needs and policy priorities; Budget summaries and examinations of completeness, accuracy and conformance with regulations especially expenditure control; Estimation of resources required or available for programs, legislation and projects; Testifying before examining and fund granting bodies. With non-financial data available: Undertaking unit (beneficiary) cost and benefit analyses; Estimating value for money (efficiency, effectiveness), equity of allocations, rate of backlog reduction.
83 1- Introduction FFC Budget Analysis Unit Objective: To assist Parliamentary finance and appropriations committees to understand, review and suggest amendments to short- and medium-term budgets; Philosophy: Budget legibility and transparency for accountable institutions; Nature of recommendations: Report formats, [non-financial] data required, link to policy priorities and strategic plans, institutional capacity, transmission mechanisms
84 2- Definitions and indicators Medium to long term Medium-term one to three years; long-term - three to seven years; Data sources National Treasury for ENE (Mar 2010,11,12), PBER (Aug 2011), LBER (Aug 2010), MTBPS (Nov) and BR (Mar); other national departments; Compare three-year past trends against three-year budget forecasts for revenue, spending and deficits; Performance indicators derived from Constitution, Chapter 13, Section 214 (2) a-j; e.g. national interest, needs and obligations; service delivery obligations, fiscal capacity, efficiency of and disparities between provinces and municipalities; stability versus flexibility.
85 2- Definitions and indicators Short term IYM Short-term less than one year, involves in-year monitoring or IYM; Data sources National Treasury for Sec 32 (PFMA) reports on quarterly spending of provinces, Sec 71 (MFMA) reports on quarterly spending of municipalities, adjustment budgets; Compare quarterly (from monthly) revenue collections and spending disbursements hockey stick effect Under-spending, over-budgeting, rollovers, fiscal dumping or saving? Over-spending, under-budgeting, virements or deficit financing? Who has the power to re-allocate between departments, provinces or municipalities?
86 3- Budget process and products With implementation of Money Bills Amendment Act of 2009; annual budget process will be transformed: Budgeting becomes negotiated between Executive and Parliament ; National, provincial and municipal financial years?; Medium term budget landmarks Budget Review and Recommendations reports (due July), Review of LBER (due Sep 2010) MTBPS (Nov 2010) and Division of Revenue / Appropriation Bills (Feb to Mar 2011) In-year monitoring quarterly Sec 32 and Sec 71 reports (Feb, May, Aug, Nov), adjustments budgets (Oct)
87 4- Medium-term trends and forecasts - Situational analysis (1) Nominal versus real annual growth; growth path stability or volatility; Since 2005/06 when economic growth peaked at nearly 6% per annum, the trend has been that of deceleration, and a decline of just over 1% p.a. in 2009/10. Over the next three years, growth is anticipated to pick up and reach 3.7% in 2012/13. By contrast, growth of general government spending has been accelerating and has averaged nearly 10% p.a. in 2008/09 to 2009/10. This is projected to decelerate sharply over the next three years to just over 1% p.a. While countercyclical during the early recession (though not the boom), government spending is now inducing large deficits which will have to be whittled back over the medium-term.
88 4- Medium-term trends and forecasts - Situational analysis (1) The proportion of GDP devoted to state spending has increased from 29.4% in 2005/06 to 34.1% in 2009/10. This is projected to decline slightly over the next three years. There has been, and continues to be, a clear shift away from national to provincial and municipal levels of government. Provinces increase their share of general government spending from 34% in 2005/06 to 36.5% in 2011/12. The relative importance of municipalities grows even more markedly from 22% to 27.4% in 2012/13.
89 5.1- Medium term trends and forecasts Provincial governments Funding (1) In 2005/06, 4.5% of provincial revenue was own raised. By 2012/13 however, this ratio is projected to continue its downward trend to 2.7%. Thus, while government is decentralizing its spending, revenue is highly and increasingly centralized, leading to characterizations of provinces as lacking fiscal autonomy. Fiscal autonomy is also being eroded by an increasing preference for conditional over unconditional grants. Conditional grants made up 11.8% of provincial funding in 2005/06. By 2012/13, this is anticipated to rise to 19.9%.
90 5.1- Medium term trends and forecasts Provincial governments Funding (2) While the Provincial Equitable Share grows by less than 1% p.a. over the next three years, conditional grants grow by over 4%. Provinces generated small surpluses in 2006/07 and 2007/08, have swung sharply into deficit over past two years, but are optimistically projected to reverse course over the next three years.
91 5.2- Medium term trends and forecasts Provincial governments Spending (1) The largest component of provincial spending is education, but its share has declined by 3% over the past 4 years to 42%. Education budgets have grown rapidly over the past two years, but below the average for provincial spending. Save for the past two years, health spending has been slightly below average. The contribution of health has remained roughly constant. Spending on infrastructure was well above average during the boom years, but has been well below average during the recession, with high levels of volatility recorded. Capital spending is pro-cyclical and serves as a shock absorber by government. Administrative services are similarly pro-cyclical but due to the large personnel component exhibit less volatility.
92 5.2- Medium term trends and forecasts Provincial governments Spending (2) Personnel spending was relatively subdued during the boom years, leading to a build-up of wage demand pressures. Higher than inflation increases and the occupation-specific dispensation have led to 9-12% real annual increases in the wage bill during the recession. Personnel costs are projected to rise very moderately over the next two years and even decline in the outer year. Actual and budgeted spending on goods and services is more volatile, growing when resources allow and decelerating or declining when budgets are tight. As indicated earlier, capital spending is the most unstable and pro-cyclical component of provincial government budgets. This is passed on by national government through its capital conditional grant programmes.
93 6.1- Medium term trends and forecasts Municipal governments Funding (1) The aggregate of local government spending is dominated by metropolitan and urban municipalities; and aggregate trends therefore strongly reflect urban rather than rural localities. Own raised revenue constitutes 69% of municipal funding; and whilst this ratio has been declining in recent years, the trend is budgeted to reverse itself over the medium-term. The share of own revenue derived from property rates and service charges has been and is projected to continue rising (to 16.4% and 37% respectively). The recent disestablishment of the RSC levy has been compensated for by, respectively, a conditional grant, the LES and now the fuel levy sharing arrangement with the metropoles. This transition has imposed high volatility on municipal budgets, especially through conditional grants from both national and provincial governments.
94 6.1- Medium term trends and forecasts Municipal governments Funding (2) Municipalities do not report deficits on their capital accounts, but external loans are recognised as a source of capital funding. Municipalities generate operational surpluses averaging 5-6% of funding. During the boom years, these surpluses more than covered the value of external loans for capital; and are projected to do so for the next two. However, during the recession (2008/09 to 2009/10), the operational surpluses have declined below that of loans. This implies net deficit financing. The capital accounts make up 21% of municipal spending compared to about 7.5% of provincial spending.
95 6.2- Medium term trends and forecasts Municipal governments Spending (1) Disaggregated data by function (e.g. water, electricity, transport) is only available for one year, hence no trends have been analysed yet. Personnel constitutes nearly 25% of municipal spend and this has been rising slowly. Budgeted wage restraint over the medium-term does not stop this trend. Bulk purchases of electricity and water are also projected to rise well above the government average, reflecting expectations of tariff increases.
96 6.2- Medium term trends and forecasts Municipal governments Spending (2) Repairs and maintenance reflect a more procyclical pattern, rising and decelerating faster than average during the boom and recession respectively. However growth has been and is projected to above average. This item increases its contribution from 5.3% to 6.3% over the seven year period of analysis. As with provincial governments, capital spending is the most volatile and pro-cyclical. Average real annual growth averaged 25% over the past three years but is projected to decline by 4.6% over the next three. The impulses for capital spending volatility are derived from all sources of capital revenue, but especially inter-governmental grants.
97 7- Conclusion (1) Government revenue tends to be pro-cyclical and at municipal level, may even exaggerate the business cycle on local economies. This places limits on the capacity of government to act as a counter-cyclical force. Governments generally ensure a relatively stable growth path for personnel and essential goods and services. Basic services such as education and health at provincial level and water and sanitation at municipal level are more consistently funded along stable growth paths. If certain portions of the budget are relatively fixed, others must be more flexible shock absorbers, exhibiting exaggerated procyclicality.
98 7- Conclusion (2) At all levels of government, capital spending is the first to be cut during recessionary periods but also most likely to be rapidly increased during the boom golden rule of budgeting. To a lesser degree, this is also true of repairs and maintenance, non-essential goods and services; as well as administrative, training and infrastructure services. Whilst this may be an operational necessity, cutbacks in infrastructure and training are counter-productive to laying the foundations for future growth.
99 8- Way forward? (1) Defining elements of the results chain from financial inputs to physical outputs, outcomes and developmental impacts requires nonfinancial data to measure efficiency and effectiveness; Analysing linkages between policy objectives, the legal framework, institutional and governance capacity, service delivery levels and modalities, accountability mechanisms and developmental impact; Assist development of capacity of Parliamentary Budget Office. What value can we add?
100 Data and Information
101 Data and Information The Data and information Unit plays an integral part of the Research and recommendations team The DIU is in charge of all the data that the research team uses in developing their research papers, the data is also used in updating and also development of new models.
102 PROJECTS 1. Audit of Data Conduct an audit of data used within the IGFR system and housed by various official statistical agencies Data cleaning and mining for easy use by the researchers Take part and represent the FFC on the National Statistical System 2. Update of Models Use the latest official data to update the FFC models 3. FFC data Architecture and warehouse development Management of information and data to be used for the support of FFC research.
103 Architecture of DIU Data Warehouse Data is obtained from different sources and in different formats, They are formatted into excel spread sheets then uploaded into the SQL server for storage Business objects then universes are created over the Dbase for the development of reports If there is recent data it also goes through the same process so as to update the data warehouse Data Custodian National Treasury Stats SA SARB Etc Spread sheet SQL Dbase Table format Universe Pre designed reports DIY reports
104 Project support Project specific data requirements Budget Analysis Fiscal Policy Education Health Social Development Local Government IGFR FFC Models
105 Project Support Data Warehouse Source Type Period FFC Projects Fiscal Policy Budget Analysis Local Government IGFR Model Simulation PES LES Costed norms Etc FFC Outputs DOR Submission IGFR Submission
106 End 106

107 00 107
DIVISION OF REVENUE TO PROVINCES AND LOCAL GOVERNMENT
 DIVISION OF REVENUE TO PROVINCES AND LOCAL GOVERNMENT Presentation to Select Committee on Appropriations Presenter: Wendy Fanoe National Treasury 15 July 2014 Outline Outline of the key steps in the national
Presentation to the Egyptian Ministry of Planning, Monitoring, and Administrative Reform (MPMAR) Study Tour: South Africa.
 Study Tour: South Africa.") Presentation to the Egyptian Ministry of Planning, Monitoring, and Administrative Reform (MPMAR) Study Tour: South Africa April 13 2016 STRUCTURE OF THE PRESENTATION 1. Background to South Africa s Intergovernmental
Presentation to the Egyptian Ministry of Planning, Monitoring, and Administrative Reform (MPMAR) Study Tour: South Africa April 13 2016 STRUCTURE OF THE PRESENTATION 1. Background to South Africa s Intergovernmental
REVIEW OF THE LOCAL GOVERNMENT EQUITABLE SHARE FORMULA
 T In partnership with: REVIEW OF THE LOCAL GOVERNMENT EQUITABLE SHARE FORMULA Parliament 19 February 2013 INTRODUCING THE NEW FORMULA Structure of the presentation 2 Background to the formula and review
Provincial Budgeting and Financial Management
 Provincial Budgeting and Financial Management Presentation to Select Committee on Appropriations Presenter: Edgar Sishi National Treasury 15 July 2014 INTRODUCTION Provincial functions are assigned by
2015 Division of Revenue Bill Joint meeting of the Standing and Select Committees on Appropriations
 . 2015 Division of Revenue Bill Joint meeting of the Standing and Select Committees on Appropriations Presenters: Malijeng Ngqaleni, Wendy Fanoe, Dumebi Ubogu and Empie van Schoor Intergovernmental Relations
Processes for Financing Public Basic Education in South Africa
 Processes for Financing Public Basic Education in South Africa Final January 2017 Research commissioned by the International Budget Partnership 1 Table of Contents 1 INTRODUCTION... 3 2 RELEVANT LEGISLATION...
South Africa s Intergovernmental Fiscal system. 22 June 2007
 South Africa s Intergovernmental Fiscal system 22 June 2007 South Africa: Are these really perceptions??? Federal/Central View: Giving money and power to sub-national governments is like giving whiskey
FINANCIAL VIABILITY OF MUNICIPALITIES
 FINANCIAL VIABILITY OF MUNICIPALITIES Financial and Fiscal Commission 11th National Municipal Managers Forum: SALGA 31 August 2017 For an Equitable Sharing of National Revenue STRUCTURE OF PRESENTATION
Municipal Infrastructure Grant Baseline Study
 Municipal Infrastructure Grant Baseline Study August 2008 Published July 2009 Disclaimer This Research Report for the Municipal Infrastructure Grant (MIG) Baseline Study has been prepared using information
FUNDING BASIC EDUCATION CHAPTER 2. Daniel McLaren
 CHAPTER 2 FUNDING BASIC EDUCATION Daniel McLaren 36 Basic Education Rights Handbook Education Rights in South Africa Chapter 2: Funding Basic Education Basic Education Rights Handbook Education Rights
Composition of the intergovernmental system Alignment between functional and fiscal assignments
 . Disaster Management Amendment Bill: National Treasury inputs National Assembly: Portfolio Committee on Cooperative Governance and Traditional Affairs (CoGTA) x 20 May 2015 Outline Composition of the
Focus on Household and Economic Statistics. Insights from Stats SA publications. Nthambeleni Mukwevho Stats SA
 Focus on Household and Economic Statistics Insights from Stats SA publications Nthambeleni Mukwevho Stats SA South African Population Results from CS 2016 Source: CS 2016 EC Household Results from CS 2016
University of Pretoria Department of Economics Working Paper Series
 University of Pretoria Department of Economics Working Paper Series Assessing Fiscal Capacity at the Local Government Level in South Africa Margaret Chitiga-Mabugu Human Sciences Research Council, Pretoria
Fiscal Responsibility in South Africa
 Fiscal Responsibility in South Africa Ismail Momoniat, National Treasury, Republic of South Africa Website: www.treasury.gov.za Ismail.Momoniat@treasury.gov.za Kenneth.Brown@treasury.gov.za Dondo.Mogajane@treasury.gov.za
BUDGET SOUTH AFRICAN BUDGET: THE MACRO PICTURE. Key messages
 BUDGET CHILDREN AND THE SOUTH AFRICAN BUDGET: THE MACRO PICTURE UNICEF/Pirozzi Key messages The nearly 2 million children in South Africa account for more than a third of the country s population. South
Submission on the Function Shift of Further Education and Training (FET)
") Submission on the Function Shift of Further Education and Training (FET) For an Equitable Sharing of National Revenue. 3 DECEMBER 2013 Financial and Fiscal Commission Montrose Place (2 nd Floor), Bekker
Submission on the Function Shift of Further Education and Training (FET) For an Equitable Sharing of National Revenue. 3 DECEMBER 2013 Financial and Fiscal Commission Montrose Place (2 nd Floor), Bekker
Sharing the Cake: A Review of Provincial Equitable Share Formula in South Africa
 Sharing the Cake: A Review of Provincial Equitable Share Formula in South Africa M. Govinda Rao and Bongani Khumalo The views and opinions expressed in this paper are those of the authors and not the Financial
UNPACKING INFRASTRUCTURE DEVELOPMENT SPENDING IN LOCAL GOVERNMENT
 UNPACKING INFRASTRUCTURE DEVELOPMENT SPENDING IN LOCAL GOVERNMENT MUNICIPAL INFRASTRUCTURE SUMMIT 25 MAY 2015 OUT LINE Municipal Infrastructure Matrix Access to Basic services backlogs Capital Budget Funding
Ensuring The Effective Participation Of Each Sphere Of Government In The Processes And Structures That Determine Intergovernmental Fiscal Arrangements
 Ensuring The Effective Participation Of Each Sphere Of Government In The Processes And Structures That Determine Intergovernmental Fiscal Arrangements Jackie Manche, Chief Executive Officer, Independent
STRATEGIC PLAN AND BUDGET 2013 TO 2016 MUNICIPAL DEMARCATION BOARD
 STRATEGIC PLAN AND BUDGET 2013 TO 2016 MUNICIPAL DEMARCATION BOARD BRIEFING TO THE PORTFOLIO COMMITTEE ON COOPERATIVE GOVERNANCE AND TRADITIONAL AFFAIRS 19 MARCH 2013 DELEGATION Mr LJ Mahlangu Chairperson:
FFC Public Hearings on the LG Fiscal Framework. Comment by SALGA
 FFC Public Hearings on the LG Fiscal Framework Comment by SALGA Leriba Lodge 4 June 2012 Overview Introduction General Comments Service Delivery Capital Investment Revenue Patterns Expenditure LGFF Proposed
LABOUR MARKET PROVINCIAL 54.3 % 45.7 % Unemployed Discouraged work-seekers % 71.4 % QUARTERLY DATA SERIES
 QUARTERLY DATA SERIES ISSUE 6 October 2016 PROVINCIAL LABOUR MARKET introduction introduction The Eastern Cape Quarterly Review of Labour Markets is a statistical release compiled by the Eastern Cape Socio
2016 Division of Revenue Amendment Bill Select and Standing Committees on Apportions
 2016 Division of Revenue Amendment Bill Select and Standing Committees on Apportions National Treasury 10 November 2016 Overview The 2016 Division of Revenue Act (DoRA) was considered and approved by Legislatures
IMPACT OF GOVERNMENT PROGRAMMES USING ADMINISTRATIVE DATA SETS SOCIAL ASSISTANCE GRANTS
 IMPACT OF GOVERNMENT PROGRAMMES USING ADMINISTRATIVE DATA SETS SOCIAL ASSISTANCE GRANTS Project 6.2 of the Ten Year Review Research Programme Second draft, 19 June 2003 Dr Ingrid Woolard 1 Introduction
REPORT OF THE SELECT COMMITTEE ON FINANCE ON THE PROVINCIAL TREASURIES EXPENDITURE REVIEW FOR THE 2014/15 FINANCIAL YEAR, DATED 14 OCTOBER 2015
 REPORT OF THE SELECT COMMITTEE ON FINANCE ON THE PROVINCIAL TREASURIES EXPENDITURE REVIEW FOR THE 2014/15 FINANCIAL YEAR, DATED 14 OCTOBER 2015 1. Introduction and Background The Select Committee on Finance
EPWP INCENTIVE GRANT MANUAL
 EPWP Incentive Grant Manual 2009/10 EPWP INCENTIVE GRANT MANUAL FROM THE NATIONAL DEPARTMENT OF PUBLIC WORKS FOR THE IMPLEMENTATION OF THE EPWP INCENTIVE GRANT BY IMPLEMENTING PUBLIC BODIES Version 1 May
SECTION 2: OVERVIEW OF AUDIT OUTCOMES. Consolidated general report on national and provincial audit outcomes for
 SECTION 2: OVERVIEW OF AUDIT OUTCOMES 45 Consolidated general report on national and provincial audit outcomes for 204-5 Figure : Slight improvement in audit outcomes (all auditees) 7% (76) 28% (3) 26%
CURRICULUM VITAE OF JUGAL MAHABIR
 CURRICULUM VITAE OF JUGAL MAHABIR PERSONAL DETAILS TITLE : Mr SURNAME : Mahabir FIRST NAME : Jugal AGE : 28 years SEX : Male MARITAL STATUS : Married with two children NATIONALITY : South African DRIVERS
PORTFOLIO COMMITTEE ON RURAL DEVELOPMENT AND LAND REFORM 3 MAY 2017
 2017 ENE ALLOCATION PORTFOLIO COMMITTEE ON RURAL DEVELOPMENT AND LAND REFORM 3 MAY 2017 1 Branches allocation to Total Branches Final ENE allocation % baseline R'000 % Administration 1,721,620 16.9% Ministerial
Intergovernmental Finance and Fiscal Equalization in Albania
 The Fiscal Decentralization Initiative for Central and Eastern Europe Intergovernmental Finance and Fiscal Equalization in Albania by Sherefedin Shehu Table of Contents Executive Summary... 5 Introduction...
National Treasury. Modelling the infrastructure investment needs in South African metros: 2016 to FINAL version
 National Treasury Modelling the infrastructure investment needs in South African metros: 2016 to 2025 FINAL version 6 November 2015 i Contact Details Contact Kim Walsh Postal address PO Box 46830, Glosderry,
Financial and Fiscal Commission
 Financial and Fiscal Commission Recommendations and Comments The Allocation of Financial Resources to National, Provincial and Local Governments for the 1998/99 Fiscal Year, Submitted in terms of Section
Hands-on. Learning Brief 45. Learning from our implementing partners. University of Cape Town
 EARLY CHILDHOOD DEVELOPMENT Hands-on Learning from our implementing partners University of Cape Town Are children s rights prioritised at a time of budget cuts? Assessing the adequacy of the 2013/14 social
An analysis of training expenditure in the Public Service sector
 March 2018 An analysis of training expenditure in the Public Service sector 1. Background and Introduction The Public Service sector in South Africa, comprised of the national and provincial government
Portfolio Committee on Energy
 Portfolio Committee on Energy Briefing Integrated National Electrification Programme (INEP) 26 August 2014 Context & Purpose Previous briefings to PC on INEP DoE in September 2013 Salga and DoE in February
CLIMATE FINANCE OPPORTUNITIES FOR ENHANCED LOCAL ACTION
 CLIMATE FINANCE OPPORTUNITIES FOR ENHANCED LOCAL ACTION V-LED AFRICA WORKSHOP: LOCALISING CLIMATE FINANCE AND ACTION 23-25 APRIL 2018, IRENE, SOUTH AFRICA 1 CC expenditure will absorb ~ 70% of domestic
Back to Contents. 7.1 Introduction. Jugal Mahabir 96
 Jugal Mahabir 96 7.1 Introduction Local government is constitutionally mandated to provide basic services to communities within a three-sphere decentralised system of governance. Schedules 4B and 5B of
The Presidency Department of Performance Monitoring and Evaluation
 The Presidency Department of Performance Monitoring and Evaluation Briefing to the Standing Committee on Appropriations on the Strategic Plan and Annual Performance Plan for the 2012/13 financial year
Labour. Labour market dynamics in South Africa, statistics STATS SA STATISTICS SOUTH AFRICA
 Labour statistics Labour market dynamics in South Africa, 2017 STATS SA STATISTICS SOUTH AFRICA Labour Market Dynamics in South Africa 2017 Report No. 02-11-02 (2017) Risenga Maluleke Statistician-General
Provincial Review 2016: KwaZulu-Natal
 Provincial Review 2016: KwaZulu-Natal KwaZulu-Natal has a strong role in South Africa s manufacturing and agriculture, and has its largest port and main North-South freight corridor. Its manufacturing
PLAN AND MANAGE THE BUDGET POLICY & PROCEDURE MANUAL
 PLAN AND MANAGE THE BUDGET POLICY & PROCEDURE MANUAL THABA CHWEU LOCAL MUNICIPALITY Approved 25 June 2012 Resolution no: A50/2012 TABLE OF CONTENTS 1 INTRODUCTION... 1 1.1 Vision and value statement...
Children and South Africa s Budget
 Children and South Africa s Budget Children and South Africa s Budget 1. Macro context 2. Health 3. Education 4. Social Development 1. MACRO CONTEXT South Africa Key message 1 The nearly 20 million children
Submission on Draft Money Bills Amendment Procedures and Related Matters Bill
 Financial and Fiscal Commission Submission on Draft Money Bills Amendment Procedures and Related Matters Bill 2008 For an Equitable Sharing of National Revenue 1. Introduction 1.0.1 The Financial and Fiscal
South Africa. UNICEF/Bart de Ruigh
 South Africa UNICEF/Bart de Ruigh MACRO BUDGET SOUTH AFRICA 2017/2018 1 0.5 % Real average annual rate of decline of provincial government financing over the MTEF UNICEF/Bart de Ruigh Preface This budget
Knowledge is too important to leave in the hands of the bosses INFLATION MONITOR MARCH 2018
 Knowledge is too important to leave in the hands of the bosses INFLATION MONITOR MARCH 2018 1 The Consumer Price Index (CPI) declined to 3.8% in March 2018 The term inflation means a sustained increase
LABOUR MARKET PROVINCIAL 51.6 % 48.4 % Unemployed Discouraged work-seekers % 71.8 % QUARTERLY DATA SERIES
 QUARTERLY DATA SERIES ISSUE 7 November 2016 PROVINCIAL LABOUR MARKET introduction introduction The Eastern Cape Quarterly Review of Labour Markets is a statistical release compiled by the Eastern Cape
A comprehensive view of the state of the residential rental market in South Africa Q JAN - MAR
 A comprehensive view of the state of the residential rental market in South Africa JAN - MAR PayProp Rental Index Quarterly The current downward trend in the South African economy appears to be taking
Local Revenue Mobilization Initiative. LMRI overall goal. Overall Training objectives. 23-Jun-15
 Local Revenue Mobilization Initiative Local Revenues Concept and Legal Framework Session one 1 LMRI overall goal To improve revenue generation at the local level a more effective and efficient revenue
Changing Approaches to Financing and Financial Management in the South African Local Government Sector
 868 Changing Approaches to Financing and Financial Management in the South African Local Government Sector D Sing School of Public Administration & Development Management, University of Natal ABSTRACT
Eskom 2018/19 Revenue Application
 Eskom 2018/19 Revenue Application Nersa Public Hearings Bloemfontein 15 November 2017 Where we are coming from This revenue application is being made for the year 2018/19, after the Energy Regulator maintained
PRESENTATION TO THE SELECT COMMITTEE ON PUBLIC SERVICES DPW STRATEGIC PLAN AND BUDGET FOR 2012/13 15 MAY 2012
 PRESENTATION TO THE SELECT COMMITTEE ON PUBLIC SERVICES DPW STRATEGIC PLAN AND BUDGET FOR 2012/13 15 MAY 2012 TABLE OF CONTENTS MINISTER S FOREWORD PART A: STRATEGIC OVERVIEW INTRODUCTION AND STRATEGIC
Post subsidies in provincial Departments of Social Development. Report prepared by Debbie Budlender
 Post subsidies in provincial Departments of Social Development Report prepared by Debbie Budlender April 2017 1 About this study: The care work project was initiated in 2016 by the Shukumisa Campaign in
budget brief 4 Budget 2009: Still Getting the Balance Right?
 PIMS budget brief 4 Budget 2009: Still Getting the Balance Right? The PIMS Budget Briefs are brief, non-technical versions of the Budget Papers which provide analysis of significant, topical budgeting
1. Introduction 2. DOMESTIC ECONOMIC DEVELOPMENTS. 2.1 Economic performance in South Africa ISBN: SECOND QUARTER 2013
 November 2013 ISBN: 978-1-920493-99-8 SECOND QUARTER 2013 1. Introduction The Quarterly Economic Update for the second quarter of 2013 (2Q2013) has been expanded and contains a range of new indicators.
Balancing the NHI funding requirements with the economic capacity of South Africa. NHI Colloquium 1 June 2016 Presenter: Dondo Mogajane
 Balancing the NHI funding requirements with the economic capacity of South Africa NHI Colloquium 1 June 2016 Presenter: Dondo Mogajane Tough choices in difficult times South Africa faces exceptionally
Further ambitious social reforms are being proposed to tackle poverty, growth and inequality problems. The National Health Insurance
 Chapter 2 Inclusive Growth, Development and Fiscal Policy 2.1 Introduction South Africa experienced a long period of economic decline in the last decades of apartheid (1985 1994). In the immediate postapartheid
TABLE OF CONTENTS SUBJECTS 1. INTRODUCTION 2. INSTITUTIONAL ARRANGEMENTS. Roles and responsibilities
 IDP REVIEW PROCESS PLAN DEPARTMENT OF THE OFFICE OF THE MUNICIPAL MANAGER JULY 2009-JUNE2010 TABLE OF CONTENTS SUBJECTS 1. INTRODUCTION 2. INSTITUTIONAL ARRANGEMENTS Roles and responsibilities 2.1 Council
South African Human Rights Commission
 South African Human Rights Commission Presentation on Strategic Plan and Annual Performance Plan to the Portfolio Committee on Justice & Constitutional Development 1 OUTLINE OF PRESENTATION PART A: OVERVIEW
ECONOMIC GROWTH PROVINCIAL INTRODUCTION QUARTERLY DATA SERIES
 ISSUE 7 OCTOBER 2016 PROVINCIAL QUARTERLY DATA SERIES ECONOMIC GROWTH INTRODUCTION The Quarterly Economic Review is a statistical release compiled by the Eastern Cape Socio Economic Consultative Council
Theewaterskloof Municipality
 Theewaterskloof Municipality Final Budget 2018/2019 to 2020/2021 29 May 2018 English is original version Copies of this document can be viewed: In the foyer of all municipal offices All public libraries
South African ART policies between 2013/ /15: An analysis of ARV Expenditure
 South African ART policies between 2013/14 2014/15: An analysis of ARV Expenditure Gavin Surgey Teresa Guthrie 31 March 2015 DRAFT [Do not quote without prior permission] Background Over 2.5m people on
SECOND QUARTER PERFORMANCE REPORT OF THE NATIONAL HOME BUILDERS REGISTRATION COUNCIL 1 JULY 2014 TO 30 SEPTEMBER 2014
 SECOND QUARTER PERFORMANCE REPORT OF THE NATIONAL HOME BUILDERS REGISTRATION COUNCIL 1 JULY 2014 TO 30 SEPTEMBER 2014 NATIONAL DEPARTMENT OF HUMAN SETTLEMENTS Contact Mr. Mongezi Mnyani Designation Chief
Government Gazette REPUBLIC OF SOUTH AFRICA. Vol. 478 Cape Town 1 April 2005 No
 Government Gazette REPUBLIC OF SOUTH AFRICA Vol. 478 Cape Town 1 April 2005 No. 27443 THE PRESIDENCY No. 291 1 April 2005 It is hereby notified that the President has assented to the following Act, which
Presentation to the Select Committee on Appropriations COMMUNITY LIBRARY SERVICES GRANT. 25 May 2011
 Presentation to the Select Committee on Appropriations COMMUNITY LIBRARY SERVICES GRANT 25 May 2011 Community Library Services Grant 31 December 2010 Table: Community Library Services Grant expenditure
Integrating climate risk assessment/management/drr into national policies, programmes and sectoral planning. G Midgley, South Africa
 Integrating climate risk assessment/management/drr into national policies, programmes and sectoral planning G Midgley, South Africa The national policy framework South Africa s Disaster Management Act,
CHAPTER 12. Challenges, Constraints and Best Practices in Maintaining and Rehabilitating Water and Electricity Distribution Infrastructure PART 3
 CHAPTER 12 Challenges, Constraints and Best Practices in Maintaining and Rehabilitating Water and Electricity Distribution Infrastructure 13 // Submission for the 21/15 Division of Revenue CHAPTER 12 12.1
Housing backlog: Protests and the demand for Housing in South Africa BY ESTERI MSINDO PSAM
 Housing backlog: Protests and the demand for Housing in South Africa BY ESTERI MSINDO PSAM Housing delivery law and regulation Section 26 of the constitution stipulates that everyone has the right to adequate
Outlook for Scotland s Public Finances and the Opportunities of Independence. May 2014
 Outlook for Scotland s Public Finances and the Opportunities of Independence May 2014 1 Table of Contents Executive Summary... 3 Introduction and Overview... 5 Scotland s Public Finances 2008-09 to 2012-13...
MUNICIPAL FISCAL POWERS AND FUNCTIONS BILL
 REPUBLIC OF SOUTH AFRICA MUNICIPAL FISCAL POWERS AND FUNCTIONS BILL (As amended by the Portfolio Committee on Finance (National Assembly)) (The English text is the offıcial text of the Bill) (MINISTER
Labour force survey. September Embargoed until: 29 March :30
 Statistical release P0210 Labour force survey September 2006 Embargoed until: 29 March 2007 12:30 Enquiries: Forthcoming issue: Expected release date User Information Services LFS March 2007 September
29 March 2012 MBOMBELA LOCAL MUNICIPALITY DRAFT 2012/ /2015 ANNUAL BUDGET AND MEDIUM- TERM REVENUE AND EXPENDITURE FRAMEWORK
 29 March 2012 MBOMBELA LOCAL MUNICIPALITY DRAFT 2012/2013 2014/2015 ANNUAL BUDGET AND MEDIUM- TERM REVENUE AND EXPENDITURE FRAMEWORK MBOMBELA LOCAL MUNICIPALITY 2012/13 TO 2014/15 DRAFT ANNUAL BUDGET AND
LEKWA-TEEMANE LOCAL MUNICIPALITY TERMS OF REFERENCE OVERSIGHT COMMITTEE
 LEKWA-TEEMANE LOCAL MUNICIPALITY TERMS OF REFERENCE OVERSIGHT COMMITTEE To be read in conjunction with National Treasury MFMA Circular 32 The Oversight Report CONTENTS 1. INTRODUCTION 3 2. BACKGROUND 3
Equity in Public Sector Health Care Financing and Expenditure in South Africa: An Analysis of Trends between 1995/96 to 2000/01
 Equity in Public Sector Health Care Financing and Expenditure in South Africa: An Analysis of Trends between 1995/96 to 2000/01 Technical Report to Chapter 4 of the South African Health Review 1998 Equity
South African Baseline Study on Financial Literacy
 Regional Dissemination Conference on Building Financial Capability South African Baseline Study on Financial Literacy Lyndwill Clarke Head: Consumer Education 30-31 January 2013 Nairobi, Kenya Outline
Introducing an Automatic Mechanism for Adjustment of Minimum and Maximum Levels of Relevant Income
 Introducing an Automatic Mechanism for Adjustment of Minimum and Maximum Levels of Relevant Income Consultation Paper January 2015 Table of Contents FOREWORD... 2 PERSONAL INFORMATION COLLECTION STATEMENT...
Who cares about regional data?
 Who cares about regional data? Development happens somewhere - in a spatial locality. Aggregations hide [important] variety in the data Within South Africa: KwaZulu-Natal is not like the Western Cape Within
Residential Property Indices. Date Published: March 2018
 Residential Property Indices Date Published: March 2018 National Inflation Current annual inflation rate is 4.08% and monthly is 0.31% Market Review As at the end of February 2018 the national house price
Tax Statistics Highlights A joint publication between National Treasury and the South African Revenue Service
 2345678901234567890123456789012345678901234567890123456789012345678901234567890123456789012345678901234567890123456789012345678901234567890123 123456789012345678901234567890123456789012345678901234567890123456789012345678901234567890123456789012345678901234567890123456789012345678901
PUBLIC SECTOR INNOVATION AWARDS LAUCH 2017
 PUBLIC SECTOR INNOVATION AWARDS LAUCH 2017 SOUTHERN SUN ELANGENI& MAHARANI, DURBAN LIMPOPO REVENUE ENHANCEMENT PROJECT 1 Outline of the presentation Introduction and background Triggers of LP Revenue Enhancement
Programme based budgeting: the health budget programme structure in South Africa
 Programme based budgeting: the health budget programme structure in South Africa WHO symposium on Health Financing Presenter: Mark Blecher National Treasury of South Africa 1 November 2017 1 Presentation
Trends in Medical Schemes Contributions, Membership and Benefits
 COUNCIL FOR MEDICAL SCHEMES Number 2 of 2008 Prepared by the Office of the Registrar of Medical Schemes Trends in Medical Schemes Contributions, Membership and Benefits 2002 2006 May 2008 COUNCIL FOR MEDICAL
Initiative of National Department of Health to accelerate Health Infrastructure Service Delivery
 Initiative of National Department of Health to accelerate Health Infrastructure Service Delivery To manage the mentioned challenges, in 2010/11, Financial year, the National Department of Health (NDOH)
Residential Property Indices. Date Published: July 2018
 Residential Property Indices Date Published: July 2018 National Inflation Current annual inflation rate is 3.93% and monthly is 0.28% Market Review As at the end of June 2018 the national house price inflation
Residential Property Indices. Date Published: October 2018
 Residential Property Indices Date Published: October 2018 National Inflation Current annual inflation rate is 3.77% and monthly is 0.25%. Market Review As at the end of September 2018 the national house
Learner Guide Municipal budgeting and implementation. Unit Standard Title Plan a municipal budgeting and reporting cycle. Unit Standard ID
 Learner Guide Municipal budgeting and implementation Unit Standard Title Plan a municipal budgeting and reporting cycle Unit Standard ID 116364 Notice This material has been developed by National Treasury
PART 1 CHAPTER 2. Economic and Social Value of Social Grants. // Submission for the 2014/15 Division of Revenue
 CHAPTER 2 Economic and Social Value of Social Grants 28 CHAPTER 2 2.1 Introduction South Africa is an upper-middle income country based on economic factors (such as GDP per capita or the structure of the
department of human settlements eastern cape, south africa
 department of human settlements eastern cape, south africa expenditure tracking report 2009/2010 yeukai mukorombindo Eastern Cape Department of Human Settlements Expenditure Tracking Report 2009/10 Yeukai
FISCAL OVERSIGHT OPPORTUNITIES AND
 FISCAL OVERSIGHT OPPORTUNITIES AND CHALLENGES FOR 2017 AND BEYOND A STRATEGIC PLANNING REVIEW SESSION OF THE STANDING COMMITTEE ON APPROPRIATIONS 04 MAY 2017 PRESENTATION OUTLINE 1. Background 2. Impact
MFMA. Audit outcomes of municipalities
 0- Audit outcomes of municipalities 0- Reputation promise The Auditor-General of South Africa (AGSA) has a constitutional mandate and, as the Supreme Audit Institution (SAI) of South Africa, it exists
LRS INFLATION MONITOR JANUARY 2015
 LRS INFLATION MONITOR JANUARY 201 1 CPI SLOWED SLIGHTLY TO.% IN JANUARY 201 KEY FINDINGS Inflation measures how much more expensive a set of goods and services has become over a certain period, usually
Monitoring the Performance
 Monitoring the Performance of the South African Labour Market An overview of the Sector from 2014 Quarter 1 to 2017 Quarter 1 Factsheet 19 November 2017 South Africa s Sector Government broadly defined
MANGAUNG METROPOLITAN MUNICIPALITY BUDGET POLICY
 MANGAUNG METROPOLITAN MUNICIPALITY BUDGET POLICY 2 INDEX 1. Statutory Framework... 3 2. Policy Objectives... 8 3. Votes, Categories of Expenditure and Line Items... 8 4. Capital Budget Mythology... 9 5.
Universe and Sample. Page 26. Universe. Population Table 1 Sub-populations excluded
 Universe and Sample Universe The universe from which the SAARF AMPS 2008 (and previous years) sample was drawn, comprised adults aged 16 years or older resident in private households, or hostels, residential
FEDERAL/PROVINCIAL/TERRITORIAL FISCAL RELATIONS IN TRANSITION
 Canada's Western Premiers' Conference 2003 FEDERAL/PROVINCIAL/TERRITORIAL FISCAL RELATIONS IN TRANSITION A Report to Canada's Western Premiers from the Finance Ministers of British Columbia, Alberta, Saskatchewan,
Local Road Funding History in Minnesota
 2007-26 Local Road Funding History in Minnesota Take the steps... Research...Knowledge...Innovative Solutions! Transportation Research Technical Report Documentation Page 1. Report No. 2. 3. Recipients
Government Gazette REPUBLIC OF SOUTH AFRICA. AIDS HELPLINE: Prevention is the cure
 Please note that most Acts are published in English and another South African official language. Currently we only have capacity to publish the English versions. This means that this document will only
RANDFONTEIN LOCAL MUNICIPALITY Municipal Profile
 introduction The Housing Development Agency ("HDA") is a national public development agency that promotes sustainable communities by making well located and appropriately planned land and buildings available
South Africa. UNICEF South Africa
 South Africa UNICEF South Africa Education BUDGET SOUTH AFRICA 2017/2018 1 17% Budget for school children remains at 17% of total government expenditure Preface This budget brief is one of four that explore
Taking accountability to improve audit outcomes
 Taking accountability to improve audit outcomes INTEGRATED DEVELOPMENT PLAN (IDP) Plan-Do-Check-Act Cycle, also the Deming cycle, courtesy of the International Organization for Standardization 3 4 5 6
Income and Non-Income Inequality in Post- Apartheid South Africa: What are the Drivers and Possible Policy Interventions?
 Income and Non-Income Inequality in Post- Apartheid South Africa: What are the Drivers and Possible Policy Interventions? Haroon Bhorat Carlene van der Westhuizen Toughedah Jacobs Haroon.Bhorat@uct.ac.za