Volume Title: Mortgage Lending Experience in Agriculture. Volume Author/Editor: Lawrence A. Jones and David Durand
|
|
|
- Liliana Merritt
- 6 years ago
- Views:
Transcription
1 This PDF is a selection from an out-of-print volume from the National Bureau of Economic Research Volume Title: Mortgage Lending Experience in Agriculture Volume Author/Editor: Lawrence A. Jones and David Durand Volume Publisher: Princeton University Press/NBER Volume IBN: X Volume URL: Publication Date: 1954 Chapter Title: Location of Areas of Farm Mortgage Distress Chapter Author: Lawrence A. Jones, David Durand Chapter URL: Chapter pages in book: (p )
2 PART I THE ECONOMIC GEOGRAPHY OF FARM MORTGAGE DITRE
3

4 <1>- LOCATION OF AREA OF FARM MORTGAGE DITRE THE main purpose of Part I is to describe geographical variations in farm mortgage distress between 1920 and 1940 and to relate the observed variations to general economic conditions in different farming areas and to those characteristics of agriculture, such as type of farming, soil, topography, climate, and location relative to markets, that affect farm earnings. Chapter i takes up the problem of locating and mapping areas where distress was either unusually heavy or notably less severe than elsewhere. Later chapters will deal specifically with the mortgage experience in major agricultural areas, relating it to general economic conditions and the physical factors affecting productivity. Indicators of Farm Mortgage Distress In the broadest sense farm mortgage distress means much more than foreclosure or forced sale. ometimes mortgage distress is evidenced by nothing more than mortgage delinquency, without actual loss of the farm pledged as security. There may even be distress without delinquency, appearing in the form of lowered family living standards or badly run-down land and buildings. Farmers have often had to "mine" their soil in order to pay their mortgages. In our analysis, however, the chief emphasis will be on those forms of distress evidenced by loss of farm through bankruptcy, foreclosure, or assignment to creditors in lieu of foreclosure, though other economic manifestations of distress will be mentioned. The several indicators to be used in locating agricultural areas relatively subject to or free from debt difficulties are: (i) records of distress transfers of farms, available for all states and also for a 485-county sample taken throughout the country and compiled by the Bureau of Agricultural Economics under a Works Progress Administration project; (2) farm mortgage foreclosures and losses reported by the federal land banks, the Federal Farm Mortgage Corporation, and several of the major insurance companies; the number of commercial bank
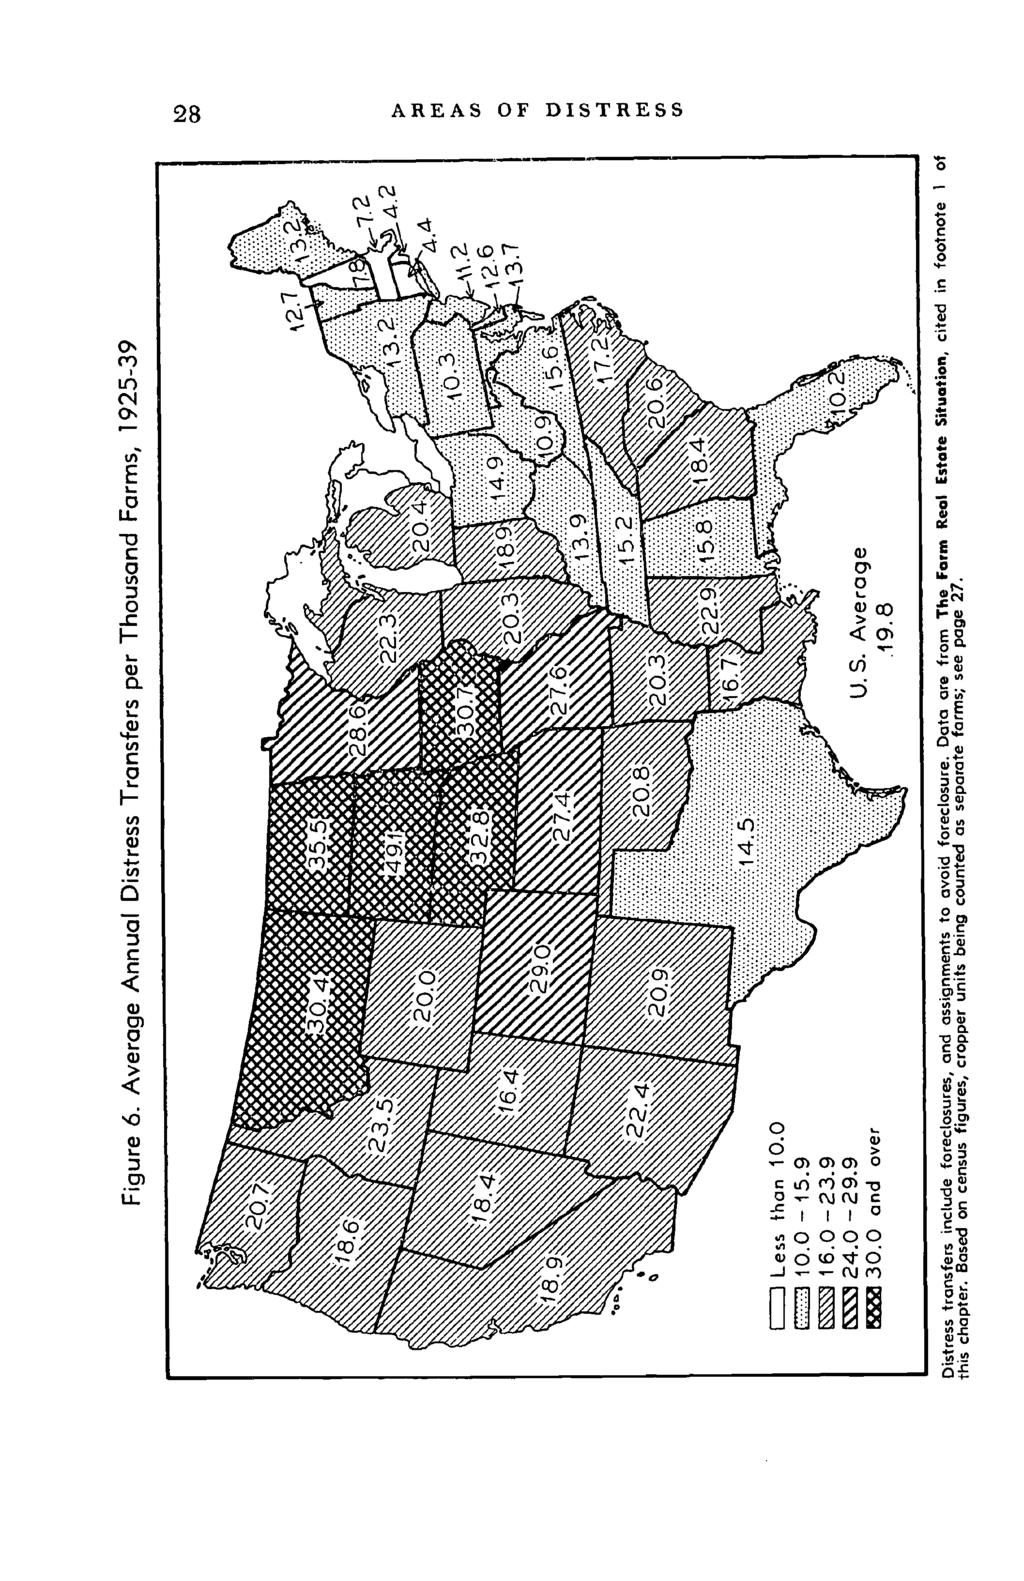
5 26 AREA OF DITRE failures and the rate of decline in bank deposits; and (4) trends in farm real estate values. These data are diverse, which is a disadvantage in the sense that there seems to be no feasible method of combining them into an index of farm mortgage distress by counties, or even by groups of counties. But the diversity is also an advantage because it provides broad evidence concerning farm economic conditions. The loan experience of individual institutional lenders is not necessarily representative of all lenders, nor is it necessarily an accurate measure of the extent of farm mortgage distress in an area. With several types of data, however, it is possible to develop a reasonably good picture of farm mortgage experience in various parts of the United tates during the interwar period. Distress Transfers of Farms The record of distress transfers is probably the most comprehensive single source of information concerning farm mortgage difficulty. In the first place, these transfers include assignments to creditors in lieu of foreclosure as well as actual foreclosures and bankruptcies. In the second place, the record covers all types of lenders, including individuals. Thus it contributes greatly to the picture of debt distress in areas where the loans of banks, insurance companies, and federal land banks were relatively few. The United tates Department of Agriculture has compiled, by states, annual distress transfer rates (distress transfers per thousand farms) for 1925 and subsequent years.1 The data, to be sure, have two obvious shortcomings: they do not cover the early twenties, when considerable distress occurred in some parts of the country; and the statewide units in which they are available are often too large to show important geographical variations. Despite their weaknesses, the statewide distress transfer rates provide worthwhile information concerning trends in, and the location of, farm mortgage distress during most of the 1 These materials are published, usually every other year, in The Farm Real Estate ituation. The issues used for Figures 6 and 7, identified by UDA publication number and the years for which distress transfers are reported, are: Circular No. 150 ( ), No. ( ), No. 354 No. 548 ( ), and No. 662 The reporting years used by the Department of Agriculture end on March 15. Thus the year referred to as 1925 is the twelve-month period ending March 15, 1926, and the period referred to as extends from March i6, 1925 through March 15, 1940.

6 AREA OF DITRE 27 interwar period. For example, the annual averages for give a broad, general picture of geographical variations (Figure 6). A further use of the statewide distress transfer rates is possible because they can be adjusted somewhat for variations in the ratio of mortgaged farms to total farms that occurred from state to state. Figure 7 shows estimated annual average distress transfers, , per thousand mortgaged farms.2 The adjusted distress transfer rates imply somewhat worse experience in certain sections of the country than do the unadjusted rates. This tendency is particularly noticeable in the outheast, where the ratio of mortgaged farms to total farms is low largely because of the census practice of counting cropper units as whole farms. ince cropper units would not ordinarily be considered as whole farms, the adjusted transfer rates undoubtedly give a more accurate picture of mortgage conditions in the outheast than do the unadjusted rates. For other parts of the country, the superiority of either set of distress transfer rates over the other depends on point of view. If, for example, the emphasis is upon the proportion of farmers who had financial difficulties in a given state, the unadjusted rates are probably superior. If, however, the emphasis is upon the amount of difficulty experienced by lenders, the adjusted rates are probably better. Distress transfers were also tabulated under a Works Progress Administration project from official records in 485 selected counties.8 The period covered is 1935 and earlier years, and in some counties records go back to In later chapters these data will be used to show the trend of distress after 1900 in selected areas. For the present purpose of locating trouble spots, the number of distress transfers during expressed as a percentage of the estimated number of mortgaged farms in 1930 is the measure used, because of its greater accuracy for the outheast and thus for regional comparisons.4 Variations in dis- 2 The estimates were obtained by dividing the annual average number of distress transfers per thousand farms in by the estimated ratio of mortgaged farms to total farms in The ratios of mortgaged farms to total farms for each state, which are available only at five-year intervals beginning with are contained in Farm-Mortgage Debt in the United tates: 1945, a cooperative report by the Bureau of the Census and the Bureau of Agricultural Economics, Table 2, page 6. 8 ee Transfers of Farm Real Estate (Bureau of Agricultural Economics, mimeo., August 1939). 4 Information on the total number of mortgaged farms by counties was not directly available and had to be estimated. The Census of Agriculture gives
7

8
9 Figure 8. Distress Transfers, , per Hundred Mortgaged Farms in 1930 than 20 Eslimotes supphed for missing years , t and over Data on distress transfers (i.e., foreclosures, and assignments to avoid foreclosure) are from Transfers of Form Reel Estate (BAE, 1939) and are described in the accompanying text. For comment on 1930 as base year, and other details, see footnote 4. 0 LTJ C,) 0 LTJ C,)

10 AREA OF DITRE 31 tress among the WPA sample counties are shown on that basis in Figure 8. The map covers all counties for which distress transfers were listed for every year from 1920 to 1935, inclusive, and a few additional counties for which missing years could easily be estimated. Experience with Federal Land Bank Loans Frequently it will be convenient to refer to the twelve federal land banks merely as "land banks." The abbreviated term will be applied only to them and will not include the so-called joint stock land banks, which were established along with the federal land banks under authority of the Federal Farm Loan Act of 1916 but were later liquidated by the Emergency Farm Mortgage Act of The federal land banks started operations in 1917 with initial capital entirely subscribed by the United tates government. ince they started in a period when credit from other sources was comparatively easy to obtain, the volume of their loans grew slowly, by the end of 1920 amounting only to $356 million, or 31/2 percent of the total farm mortgage debt. With the tightening of credit from other sources after 1920, the volume of land bank loans grew more rapidly; by the beginning of 1927 county data on the number of owner-operated farms mortgaged. Also available were statewide estimates, made by the Bureau of Agricultural Economics, of the percent of tenant- or manager-operated farms mortgaged as well as the percent of owner-operated farms mortgaged. From the combined information the percent (X) of tenant- or manager-operated farms mortgaged in each county was estimated by means of the proportion % tenant- or manager-operated farms X mortgaged in state % owner-operated farms % owner-operated farms mortgaged mortgaged in county in state Adding, for each county, the number of tenant- or manager-operated farms mortgaged (X percent of all farms) to the number of owner-operated farms mortgaged gave the estimate for the total number of farms mortgaged in the county. While regional comparability is improved (through more accurate representation of the outheast) by expressing distress transfers as a percentage of mortgaged farms rather than of all farms, some noncomparability may nevertheless be involved in using as the base year. In areas such as the western Great Plains, where a substantial proportion of the foreclosures occurred before 1930 and thereby reduced the number of mortgaged farms in that year, the rate of foreclosures would tend to be overstated in comparison with areas where the majority of foreclosures occurred after 1930.

11 32 AREA OF DITRE it aggregated slightly more than a billion dollars.5 Meanwhile most of the capital originally subscribed by the government had been paid back by farmer-borrowers who became stockholders in the system, which is cooperative in character. In the early thirties, when economic conditions became critical, the lending operations of the land banks were very substantially curtailed by a shortage of loan funds that arose because certain classes of distressed assets, including acquired real estate, were not eligible as security for land bank bonds. ince the volume of real estate acquisitions was rapidly increasing (the land banks acquired an average of roughly 9,000 farms a year from 1932 to the end of the decade), it constituted a large and continuing drain on resources available for lending. To meet this situation the government subscribed additional capital, which permitted the banks not only to grant extensions of time to deserving borrowers but also to undertake extensive farm debt refinancing operations. In addition the land banks became agents for direct governmental mortgage loans of an emergency type known as Land Bank Commissioner loans. By 1937 land bank and Commissioner loans amounted to $2,889 million and constituted 39 percent of the total farm mortgage debt.7 As farm incomes increased during World War II, mortgage loan deliquencies and distress transfers of farm real estate declined sharply. Farmers began to repay their loans at a greatly increased rate and the financial position of the land banks rapidly improved. In the fiscal year ending June 30, 1947 the last government capital was repaid and the banks became wholly farmer-owned cooperative credit institutions. ince the land banks loaned widely throughout the United tates, the geographical variations in their loan experience are an important indicator of areas of farm mortgage distress. A useful measure of where borrowers had difficulty is the "mortality rate" of loans: that is, the percentage ratio of the volume of real estate acquisitions and charge-offs within a certain group 5 Donald C. Horton, Harald C. Larsen, and Norman J. Wall, Farm-Mortgage Credit Facilities in the United tates (U.. Department of Agriculture, Misc. Pub. No. 478, 1942), Table 2, p In contrast to the federal land banks, the joint stock land banks had capital originally provided by private subscription. Thus two types of land bank were established under the Federal Farm Loan Act, one proprietary and the other cooperative. 7 Horton, Larsen, and Wall, op.cit., Table 2, p. 12.
, together with charge-offs, to 1939 or later for all land")
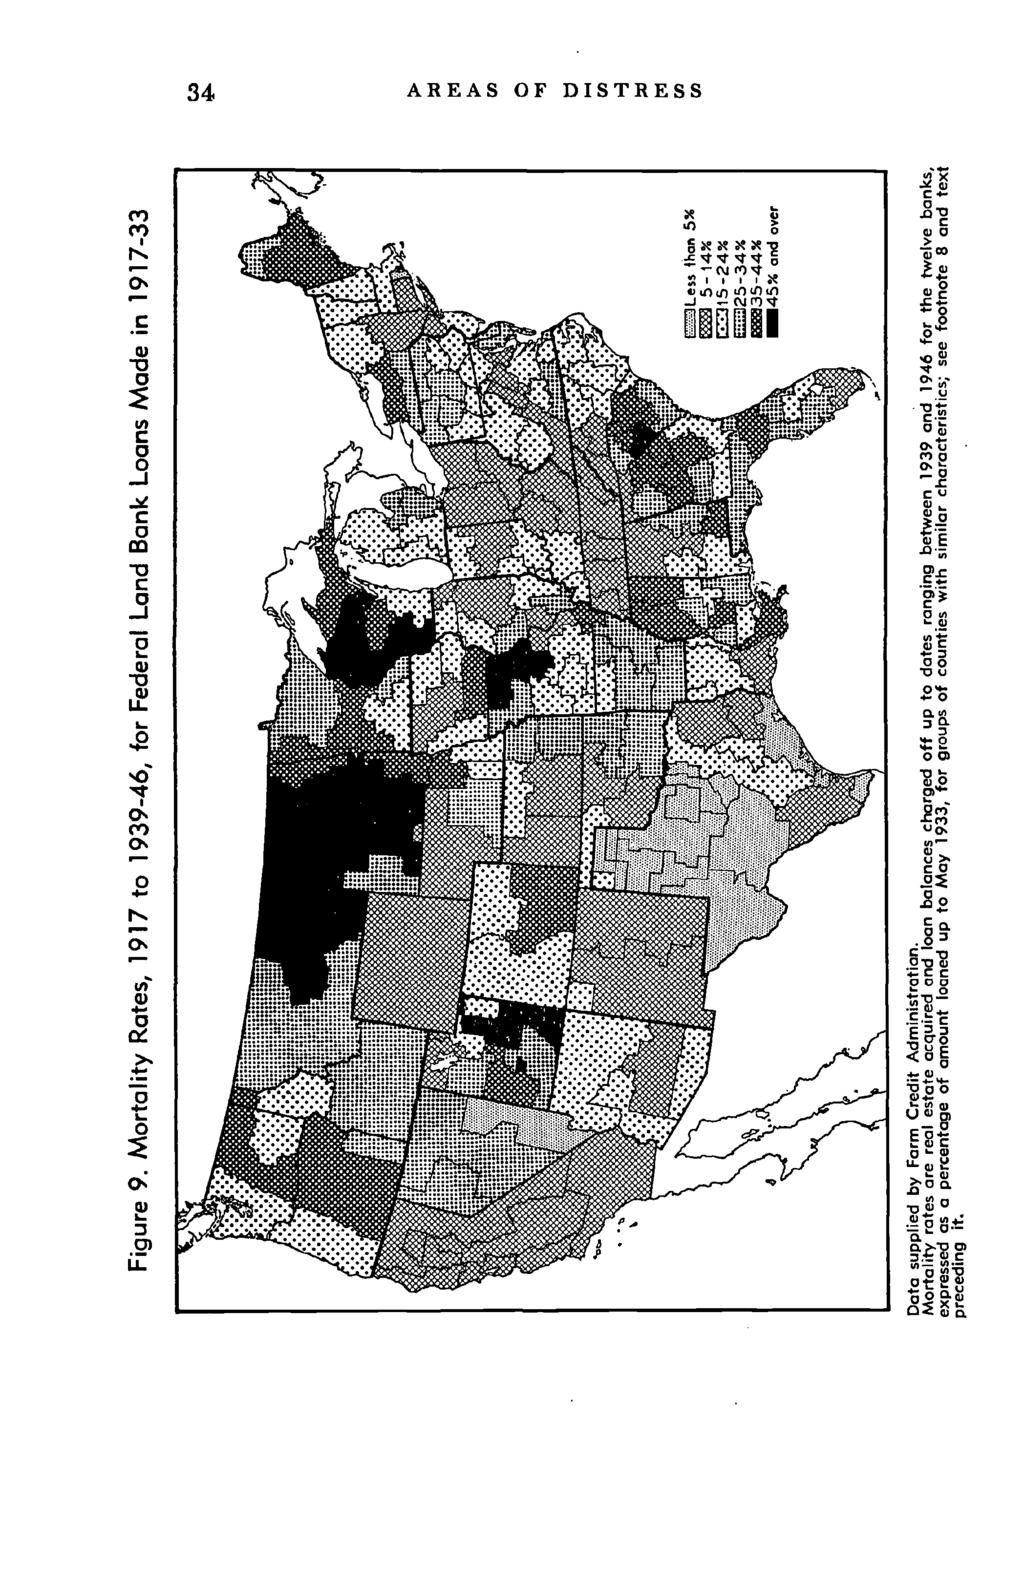
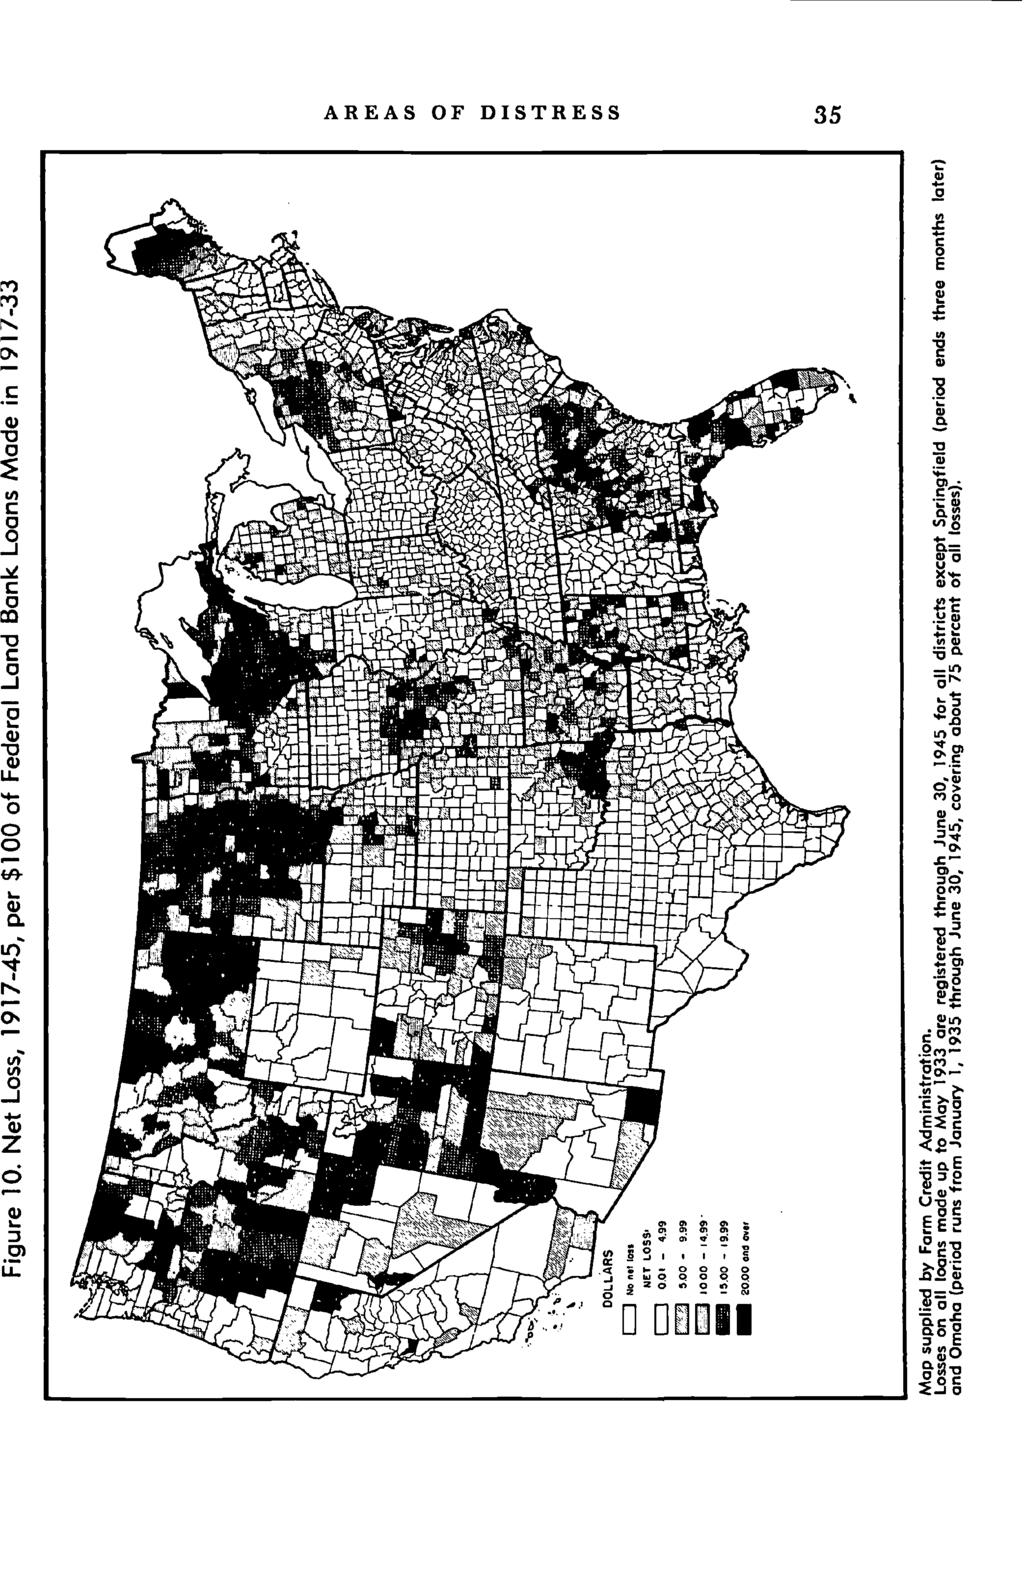
12 AREA OF DITRE 33 of loans to the total original amount of the loans. The Farm Credit Administration has compiled information by county on the amount of acquisitions (whether by foreclosure or by voluntary deed), together with charge-offs, to 1939 or later for all land bank loans made between 1917 and Mortality rates, calculated for groups of adjoining counties which in general have similar physical, climatic, and type-of-farming characteristics, are shown in Figure 9. As a measure of where lenders had difficulty, loss rates serve better than mortality rates. County to county variation.s in loss rates on land bank loans made before 1933 may be observed in Figure io. The areas of high mortality rates have also been, on the whole, areas of high loss rates, but the correspondence is not perfect. Losses are not necessarily proportional to the volume of acquisitions (in which both foreclosed farms and farms acquired by voluntary deed are included). ome acquisitions eventually result in large losses, but others may result in no loss at all or in gains. Actual loss experience is influenced by such factors as practice in making and foreclosing loans, the amount spent in acquiring, maintaining, and disposing of properties, and the time of acquisition and sale in relation to trends in the farm real estate market. The countrywide loss rate through June 1946 on land bank loans made from 1917 to 1933 was 7.1 percent (Table 5). Among states the range was from no loss in Rhode Island to 26.1 percent in Wisconsin. Experience with Land Bank Commissioner Loans Land Bank Commissioner loans, because they first became available in i when the usual credit sources were drastically curtailed, afford a unique chance to assess variations in experience on loans made in the worst part of the depression. Commissioner loans, which were direct financing by the federal government through the agency of the land could be made on first or second farm mortgage security, whereas regular land bank loans were restricted to first mortgages. Except for a con- 8 In reporting acquisitions and charge-offs, two banks had cut-off dates in 1939, two in 1941, one in 1942, one in 1943, and the remaining six in Foreclosures after 1939 on loans made before 1933 were relatively few and would not affect the mortality rates significantly. 9 The Federal Farm Mortgage Corporation, wholly owned by the government, was created in 1934 to provide funds for making Land Bank Commissioner loans by the sale of government-guaranteed bonds. Commissioner loans previously made were taken over by the corporation. ince July 1, 1947 no new Commissioner loans have been made.
13
14
15 36 AREA OF DITRE Region and state TABLE 5 Loss Rates through June 1946 on Federal Land Bank Loans Made in Loss ratea Region and state Loss ratea The Northeast Corn Belt states Maine 9.8% Ohio i.0% New Hampshire i.6 Indiana 4.0 Vermont 4.8 Illinois 2.0 Massachusetts 1.3 Iowa 4.6c Rhode island b Missouri 10.1 Connecticut Lake states New York 10.2 Michigan 9.6 New Jersey 4.0 Wisconsin 26.1 Pennsylvania 9.1 Minnesota u.o 1lppalachian states Great Plains Delaware and Mounain states Maryland 2.4 North Dakota 25.3 Virginia outh Dakota 18.2c West Virginia 3.5 Nebraska 6.2c North Carolina 3.7 Kansas 2.6 Kentucky 2.2 Montana 2.5 Tennessee 1.4 Idaho 8.6 Cotton Belt states Wyoming i.oc outh Carolina 17.5 Colorado 9.7 Georgia io.q New Mexico 2.5 Alabama 3.6 Arizona.4 Mississippi Utah 8.7 Arkansas ii.8 Nevada 14.4 Louisiana i.6 Pacific Coast states Oklahoma 4.9 Washington Texas 1.9 Oregon Florida 16.2 California United tates 7.1% From special tabulations of the Farm Credit Administration. a Losses through June 30, 1946 on all federal land bank loans made from 1917 through May 1933, as a percentage of the amount loaned. b In Rhode Island there was a gain of 0.3 percent. C Losses are for the period January i, 1935 through June 30, siderable number of good "prudent investment" loans made on part-time farms in certain areas, the Commissioner first mortgages were largely concentrated in situations considered too risky for federal land bank loans. The Commissioner second mortgages, which were usually junior to land bank first mortgages, were made on better land meeting the higher requirements of the land banks. For both first and second mortgages,
. There was a limit, first put at $5,000 and later at $7,500, Ofl individual loans.")
16 AREA OF DITRE 37 the total amount loaned, together with the prior lien in the case of a second mortgage, could be as much as 75 percent of the appraised normal value of the property (while regular land bank loans were limited to about 50 percent). There was a limit, first put at $5,000 and later at $7,500, Ofl individual loans. ince Commissioner loans were made on a second mortgage basis and on comparatively risky first mortgage security, they tended to bulk large in areas of distress and areas where other sources of loans were limited. Although many of the Land Bank Commissioner loans soon ran into repayment difficulties, it was the government's policy to make every effort to avoid actual foreclosures, and from 1933 through 1935 there were very few. In 1936 the investment in farm real estate acquired by the Commissioner increased somewhat and was equal to i percent of the amount of loans outstanding at the beginning of the year.1 By 1939 the acquisition rate had increased to 4.5 percent. In 1940 acquisitions declined but still amounted to 2.8 percent of loans outstanding at the beginning of the year. Loss rates on first mortgage Land Bank Commissioner loans made from 1933 through 1935 are given by state in Table 6. The loans reported on, made when the refinancing program was most active, represent about three-fourths of the $419 million total of Commissioner first mortgage loans made from 1933 through mid Figure i i shows county variations in loss rates on a special group of the loans covered by Table 6: those whose amounts exceeded 65 percent of the appraised normal agricultural value of the farm. The pattern of distress is similar to that for the regular land bank loans, except for two notable differences: (i) heavier Commissioner losses in the dust bowl areas of western Kansas and adjoining states, and (2) smaller Commissioner losses in areas of the Far West lying between the two great mountain ranges, particularly in Idaho, Nevada, Arizona, and the eastern half of Washington and Oregon. Experience with Loans by Life insurance Companies Insurance companies have long been lenders in the farm mortgage field and before the twenties were second in importance only to commercial banks. After 1910, loans of insurance companies increased at about the same rate as the farm mortgage 10 Horton, Larsen, and Wall, op.cit., Table 42, p. 121.
17 38 AREA OF DITRE TABLE 6 Loss Rates through June 1946 on Land Bank Commissioner First Mortgage Loans Made in Region Region and state Loss ratea and state Loss rates The Northeast Maine New Hampshire Vermont Massachusetts Rhode Island Connecticut New York New Jersey Pennsylvania dppalachian.cta tes Delaware Maryland Virginia West Virginia North Carolina Kentucky Tennessee Cotton Belt states outh Carolina Georgia Alabama Mississippi Arkansas Louisiana Oklahoma Texas Florida Corn Belt states Ohio Indiana Illinois Iowa Missouri Lake states Michigan Wisconsin Minnesota Great Plains and Mountain states North Dakota outh Dakota Nebraska Kansas Montana Idaho Wyoming Colorado New Mexico Arizona Utah Nevada Pacific Coast states Washington Oregon California United tates 4.7% From special tabulations of the Farm Credit Administration. a Losses through June 30, 1946 on all Land Bank Commissioner first mortgage loans closed from May 1933 through December as a percentage of the total amount of the loans. b Less than 0.05 percent gain. loans made by commercial banks, and by the end of 1920 they totaled $1,206 million, or 12 percent of the total farm mortgage debt.11 Insurance companies undoubtedly had losses in the agricultural depression of 1921, although little information about them is available. On the whole, however, their activities in the farm lending business at that time were much more suc- 11. Ibid., Table 2, p % % b

18 I, 2 -. in. I, F -

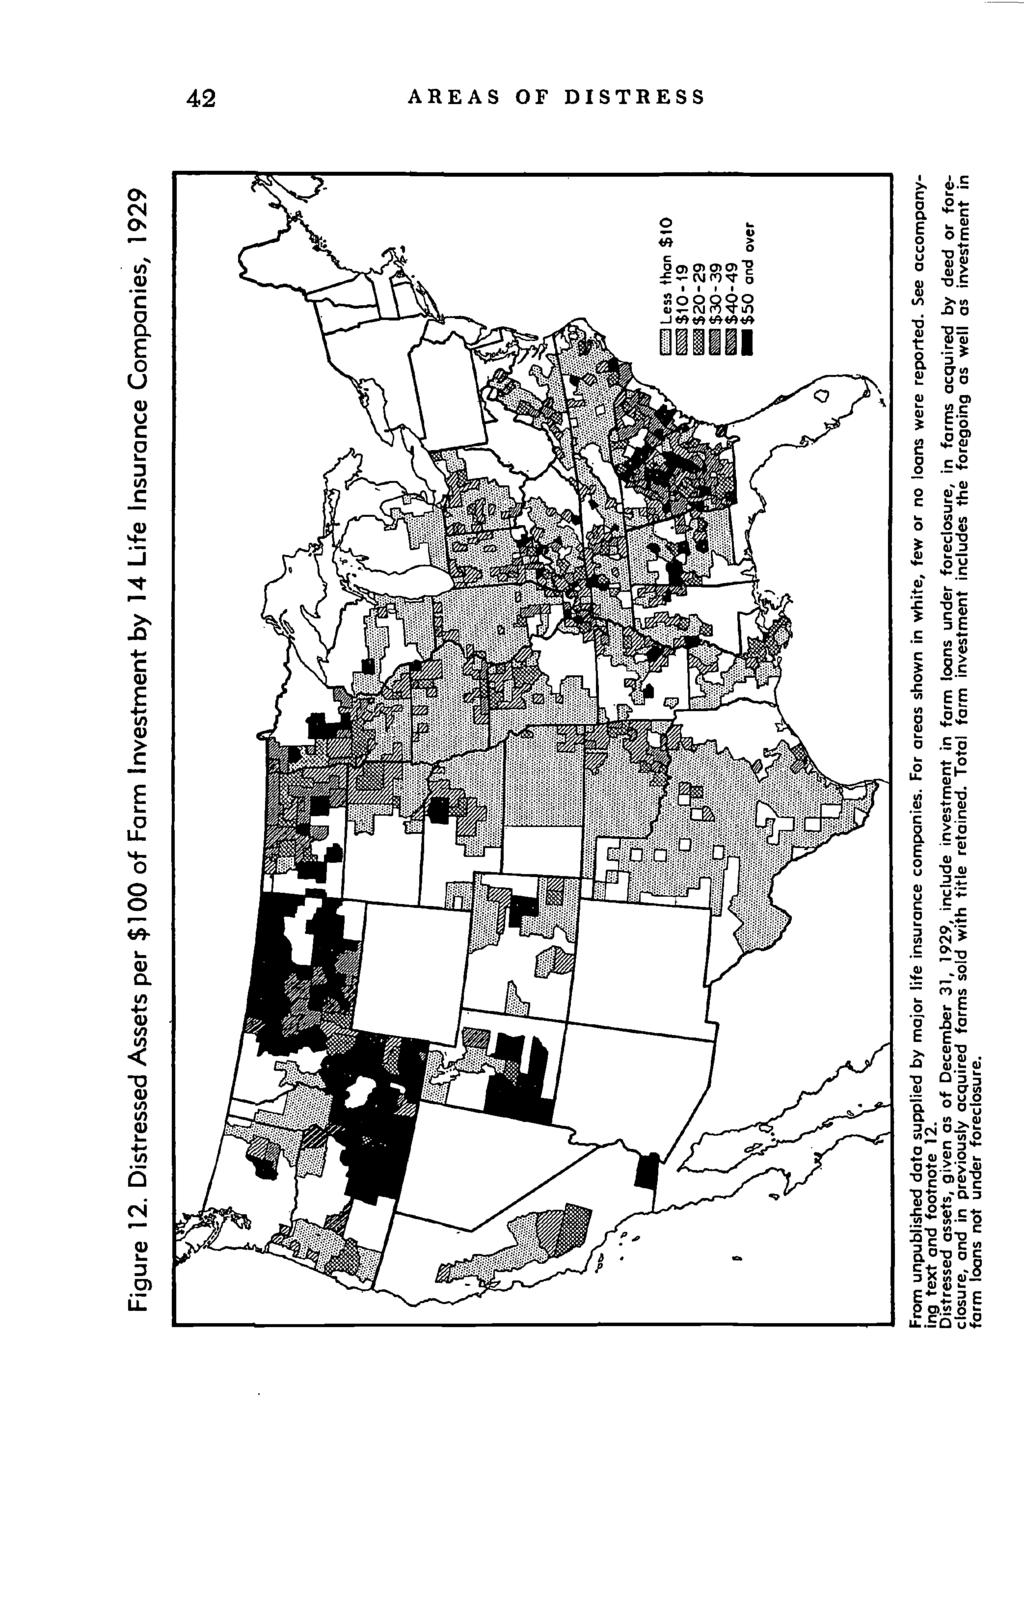
19 40 AREA OF DITRE cessful than those of commercial banks. After 1920, loans of insurance companies continued to expand and by the end of the decade their outstandings had about doubled. In the thirties, when the depression became especially severe, insurance companies foreclosed a large volume of their loans, and many of the remaining loans were refinanced by the land banks and the Land Bank Commissioner. Between 1929 and the end of 1937 insurance company farm mortgage holdings were reduced From $2,139 million to $895 million, mainly as a result of foreclosures and refinancing. Because of the importance of insurance companies as lenders their foreclosure experience is significant in the over-all picture of farm mortgage distress. But the farm real estate loans of these companies were not so widespread geographically as the loans of commercial banks or of the federal land banks. The insurance companies tended to concentrate their business in the Middle West, where a substantial volume of above-averagesized loans could be made. At the beginning of 1930 the farm mortgage loans held by insurance companies amounted to 22 percent of the total farm mortgage debt of the United tates, but the proportion varied widely in different parts of the country, from practically no loans in the northeastern states to over percent of all mortgage loans in several of the midwestern states (Table 7). Unpublished data showing farm mortgage lending experience by counties as of the end of 1929 have been provided by fourteen major insurance companies and as of the end of 1932 by fifteen companies. The farm mortgage loans held by these companies amounted to about 6o percent of the total of such loans held by all life insurance companies on the dates of report. Areas where borrowers had difficulty can be located from the insurance company data by means of a "distressed asset ratio," which is the percentage ratio of pending plus completed foreclosures to total farm investment as of a given date. County to county variations in the distressed asset ratios of reporting companies are shown in Figure 12 for the end of 1929 and in Figure 13 for the end of The 1929 map is significant because 12 In the construction of the maps drawn from life insurance company data some cognizance had to be taken of counties where the number of loans was small. As a rule, counties with only one loan were eliminated entirely. Counties with, say, two to ten loans were also eliminated unless they could be consolidated with contiguous counties having about the same number. Thus in peripheral areas, where loan volume was often small, the maps show experience by groups
20 AREA OF DITRE TABLE 7 hare of Total Farm Mortgage Debt Held by Life Insurance Companies, hare hare of total of total Region farm inort- Region farm mortand state gage debt and state gage debt The Northeast Maine New Hampshire Vermont Massachusetts Rhode Island Connecticut New York New Jersey Pennsylvania Appalachian states Delaware Marylandb Virginia West Virginia North Carolina Kentucky Tennessee Cotton Belt states outh Carolina Georgia Alabama Mississippi Arkansas Louisiana Oklahoma Texas a o.o% a a 0.0 a Florida a Corn Belt states Ohio Indiana Illinois Iowa Missouri Lake states Michigan Wisconsin Minnesota Great Plains and Mountain states North Dakota outh Dakota Nebraska Kansas Montana Idaho Wyoming Colorado New Mexico Arizona Utah Nevada Pacific Coast states Washington Oregon California 21.7% , I o United tates 22.0% From Distribution by Lender Groups of Farm-Mortgage and Reat Estate Holdings, January x, , by Harald C. Larsen (Bureau of Agricultural Economics, mimeo., August 1945), Tables 17 and 22, pages 6o and 68. Based on data as of January i. a Less than 0.05 percent. b Includes District of Columbia. it shows areas where distress developed early in the interwar period. Among them are a section of the eastern Cotton Belt and a strip of territory running west from northwestern Minnesota of counties rather than individual counties. Counties with few loans were never consolidated with counties having numerous loans.
21
22 AREA OF DITRE 43 through North Dakota, Montana, Idaho, and eastern Oregon. By the end of 1932, when economic conditions were approaching their worst, the volume of pending and completed farm mortgage foreclosures had increased substantially. At that time one-fourth of the total farm investment of the reporting companies was in acquired farms and in loans under foreclosure. On the extent to which foreclosures resulted in loss to the lender, the material provided by life insurance companies concerns recovery experience with acquired farms sold by thirteen firms from 1929 to 1937 inclusive. For the United tates as a whole, receipts from sales amounted to 90.4 percent of total costs to date of sale, indicating a loss rate of 9.6 percent on the reporting companies' investment in acquired farms. Their experience, however, varied considerably from that average in individual states and counties. Discussion of the variations in loss rates will be deferred until Chapters and 4, which deal with some of the areas where the insurance companies were especiafly active lenders. Commercial Bank Data Before the liquidation that began in the early twenties, commercial banks were the largest holders of farm mortgage loans among the institutional lenders. At the end of 1920 their loans amounted to nearly $1.5 billion, or about 14 percent of the total farm mortgage debt.'3 But during the twenties, while the insurance companies were almost doubling their portfolios, the commercial banks lost ground as mortgage lenders. By 1931, bank holdings of farm mortgages had declined to less than $i.o billion and by the end of 1934 to about billion (Figure 4). Direct evidence of area variations in foreclosures and loss rates for commercial banks is not available, but considerable indirect evidence is provided by data on deposit changes and bank failures. By their very nature, the operations of commercial banks are certain to reflect the prosperity of the communities in which they do business. Declining incomes and tightened money conditions will quickly manifest themselves by deposit withdrawals. If withdrawals continue, and if investment losses are severe, bank failures are apt to result. The relationship between bank suspensions and distress farm transfers is indicated 13 Horton et al., op.cit., Table 2, p. 32.

23 'I
24 AREA OF DITRE 45 in Figure 14. tates with a high rate of bank suspensions usually had a high rate of distress transfers. Likewise there was, in the main, a significant and direct relationship between distress transfers and the shrinkage of bank deposits, as Figure 15 shows. To a small extent, of course, the two scatter diagrams reflect the same thing, for the shrinkage of bank deposits represents Figure 14. Relation between Commercial Bank uspensions, , and Distress Transfers of Farms, Distress Transfer Rate I I I I Bank usper,son Rote Distress transfer rote gives average annual foreclosures and assignments per thousand mortgaged farms for each state; sec Figure 7. Bank suspension rate is the number of commercial bank suspensions in , from Banking and Monetary tatistics (FR, 1943, pp. 284 f.), given as a percentage of banks active in 1920 (from the annual report of the Comptroller of the Currency for 1920: Table 105, pp. 857 ff., adjusted to exclude mutual savings banks, Table 74, p. 816). bank suspensions as well as deposit withdrawals from active banks. On a countrywide basis, farm mortgage debt held by commercial banks during the interwar period was not large compared to their other earning assets. At the end of 1920, when the banks were the most important of the institutional lenders
25 46 AREA OF DITRE Figure 15. Relation between Change in Commercial Bank Deposits, , and Distress Transfers of Farms, Rote 80. ø I I....1 I I 20 I 0 I I Percenfoge Change In Bonk Deposits Distress transfer rote gives overage annual foreclosures and assignments per thousand mortgaged farms for each state; see Figure 7. Percentage changes in commercial bank deposits were calculated from data for 1919 and 1934, June call dates, in Banking and Monetary tatistics (FR, 1943, pp. 24 ff.). concerned, farm mortgage loans amounted to only.5 percent of their total loans and discounts. In states where agriculture is the principal industry, however, farm mortgage ioans constituted a more important segment of bank earning assets: for example, in North Dakota 14.2 percent, in Minnesota 16.4 percent, in Iowa 23.8 percent, and in Mississippi 26.4 percent.'4 Bank suspensions during the twenties were mainly in agricultural areas (Figure i6). Concentration was heavy in a strip running north to south from North Dakota and Minnesota to eastern Texas. Georgia and outh Carolina also had numerous bank failures. After 1929, the volume of suspensions increased 14 V. N. Vaigren and Elmer E. Engelbert, Far?n Mortgage Loans by Banks, Insurance Companies, and Other Agencies (U.. Department of Agriculture, Bulletin 1047, December 1921), Table p. 8.
26 Figure 16. Bank uspensions, After a mop supplied by the Board of Governors of the Federal Reserve ystem. ttj U, 0 U) LTJ U)

27 r F..

28 AREA OF DITRE 49 rapidly and spread to many industrial areas. By the end of 1933, when the wave of failures had about subsided, the cumulative number of bank suspensions for inclusive amounted to 50 percent of the state and national commercial banks active on June 30, In the industrial Northeast, where bank failures were relatively few, the percentage of suspensions ranged from ii percent in New Hampshire to 34 percent in New Jersey. In the Far West, California had a relatively low ratio of 19 percent. tates with exceptionally heavy suspension rates included the following: Florida, i io percent (evidently some of the suspended banks were organized after 1920); Michigan, 87; outh Dakota, 83; Iowa, Arkansas, 76; and outh Carolina, 73. The pattern of deposit changes further highlights some of agriculture's trouble spots. Deposit changes during the twenties are shown in Figure 17. During the early thirties the decline in deposits continued and spread (Figures 17 and i8). By the end of 1933 deposits in most of the northern Great Plains, Iowa, and Minnesota were less than half those of imilar shrinkages occurred in Arkansas, Georgia, eastern Oklahoma, outh Carolina, and scattered counties throughout the Mountain region. Areas of relatively good economic conditions, indicated by an increase in deposits between 1920 and the end of 1933, show up in the northeastern states and western Texas. In areas such as the Far West where branch banking is important, the maps reveal mainly the experience of independent banks, since deposits of branch banks are reported for the county in which the head office is located. Possibly, experience in these areas may have been more favorable than the maps indicate. In thinly populated counties of the Mountain region the decline of deposits to zero usually meant that there was only one bank in the county, and it failed. In analyzing the maps showing changes in deposits it is well to realize that during the farm boom of 1919 and 1920, when farmers borrowed heavily and agricultural prices were exceptionally high, there was a heavy flow of investment funds into agricultural communities. Thus the decline of deposits in some areas was a natural readjustment to more normal conditions. Nevertheless, considerable hardships and distress resulted. From the source noted on Figure 14.
29 :4..r.
.")
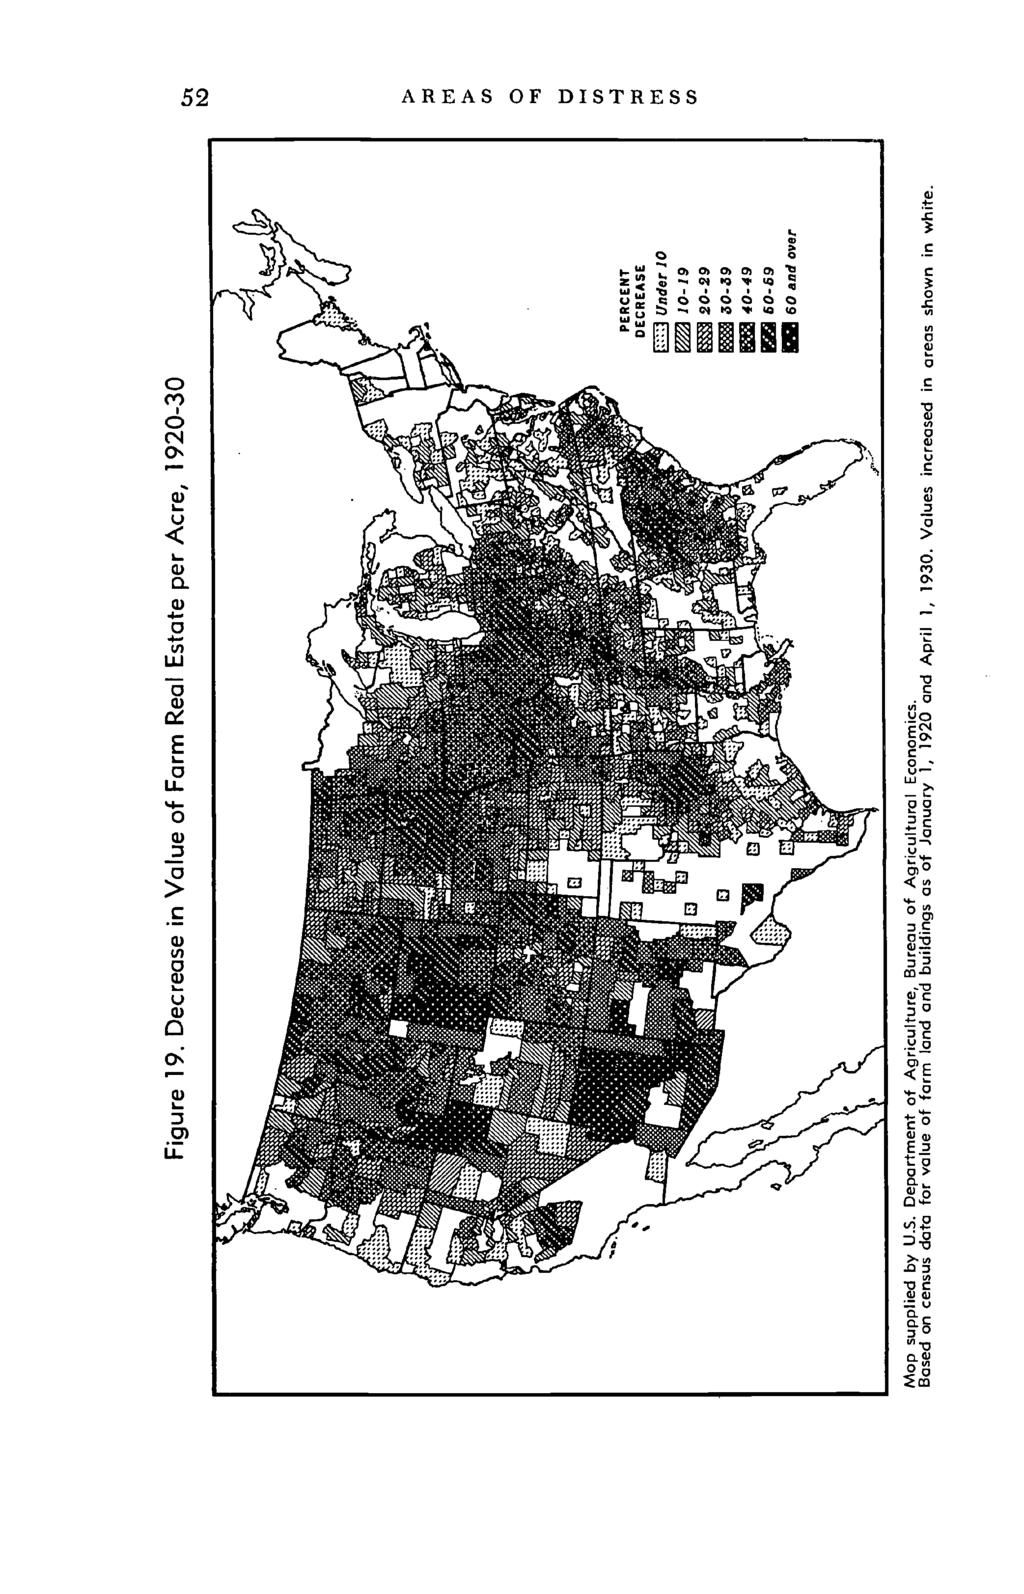
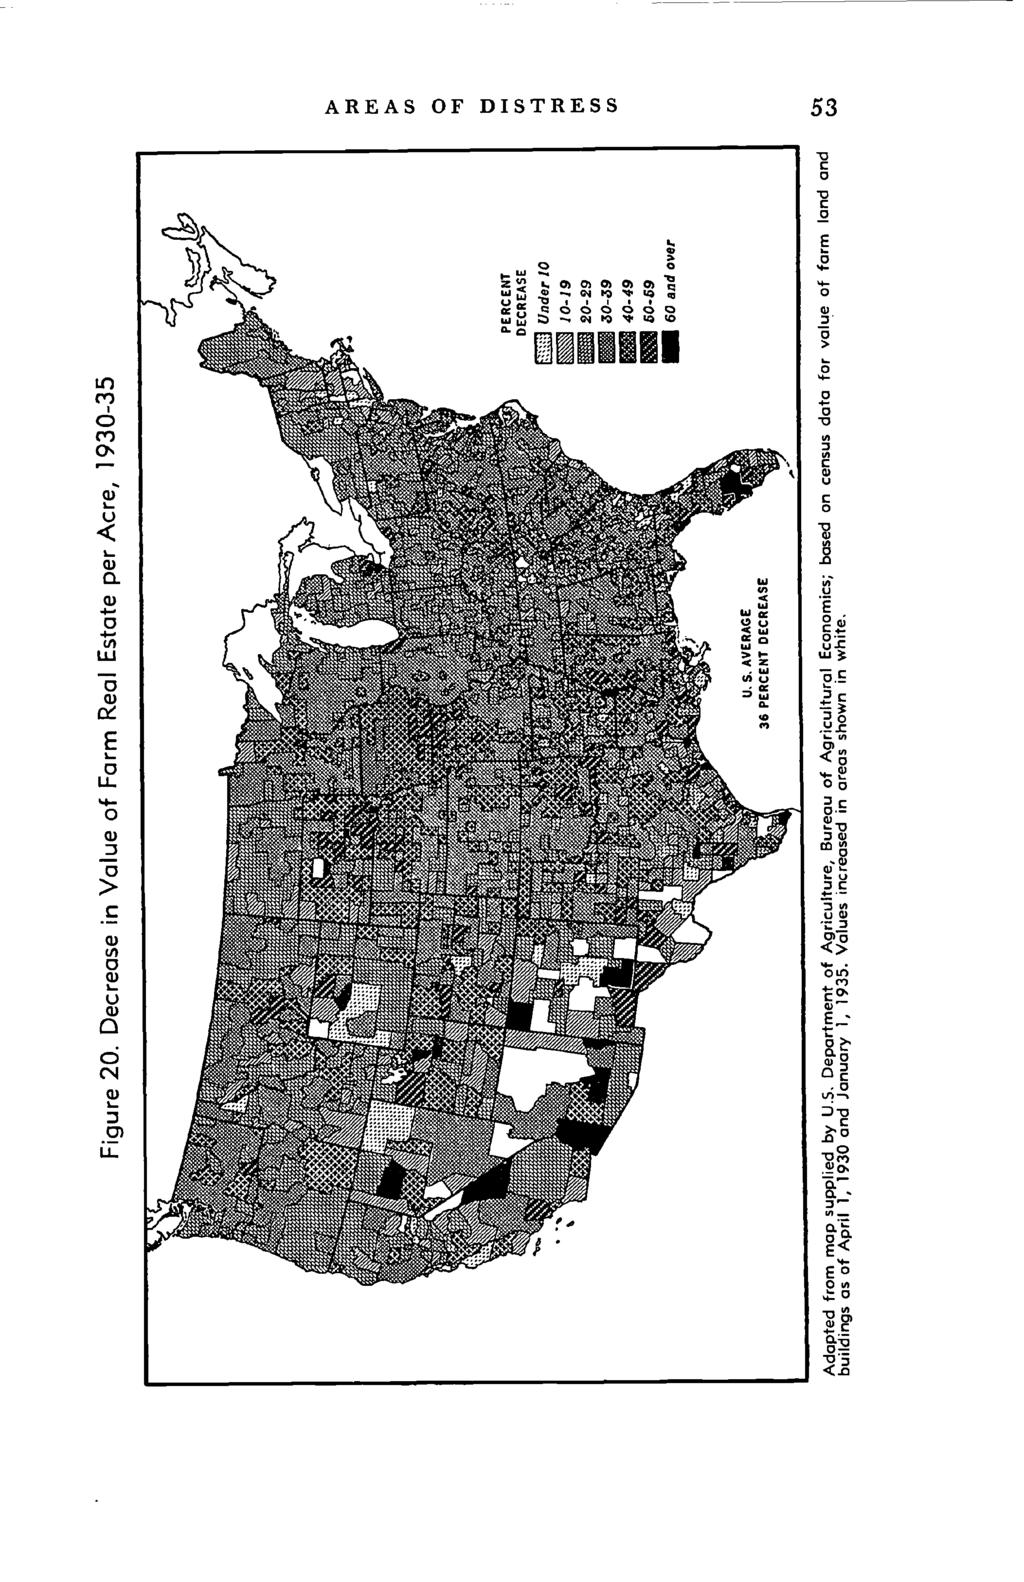
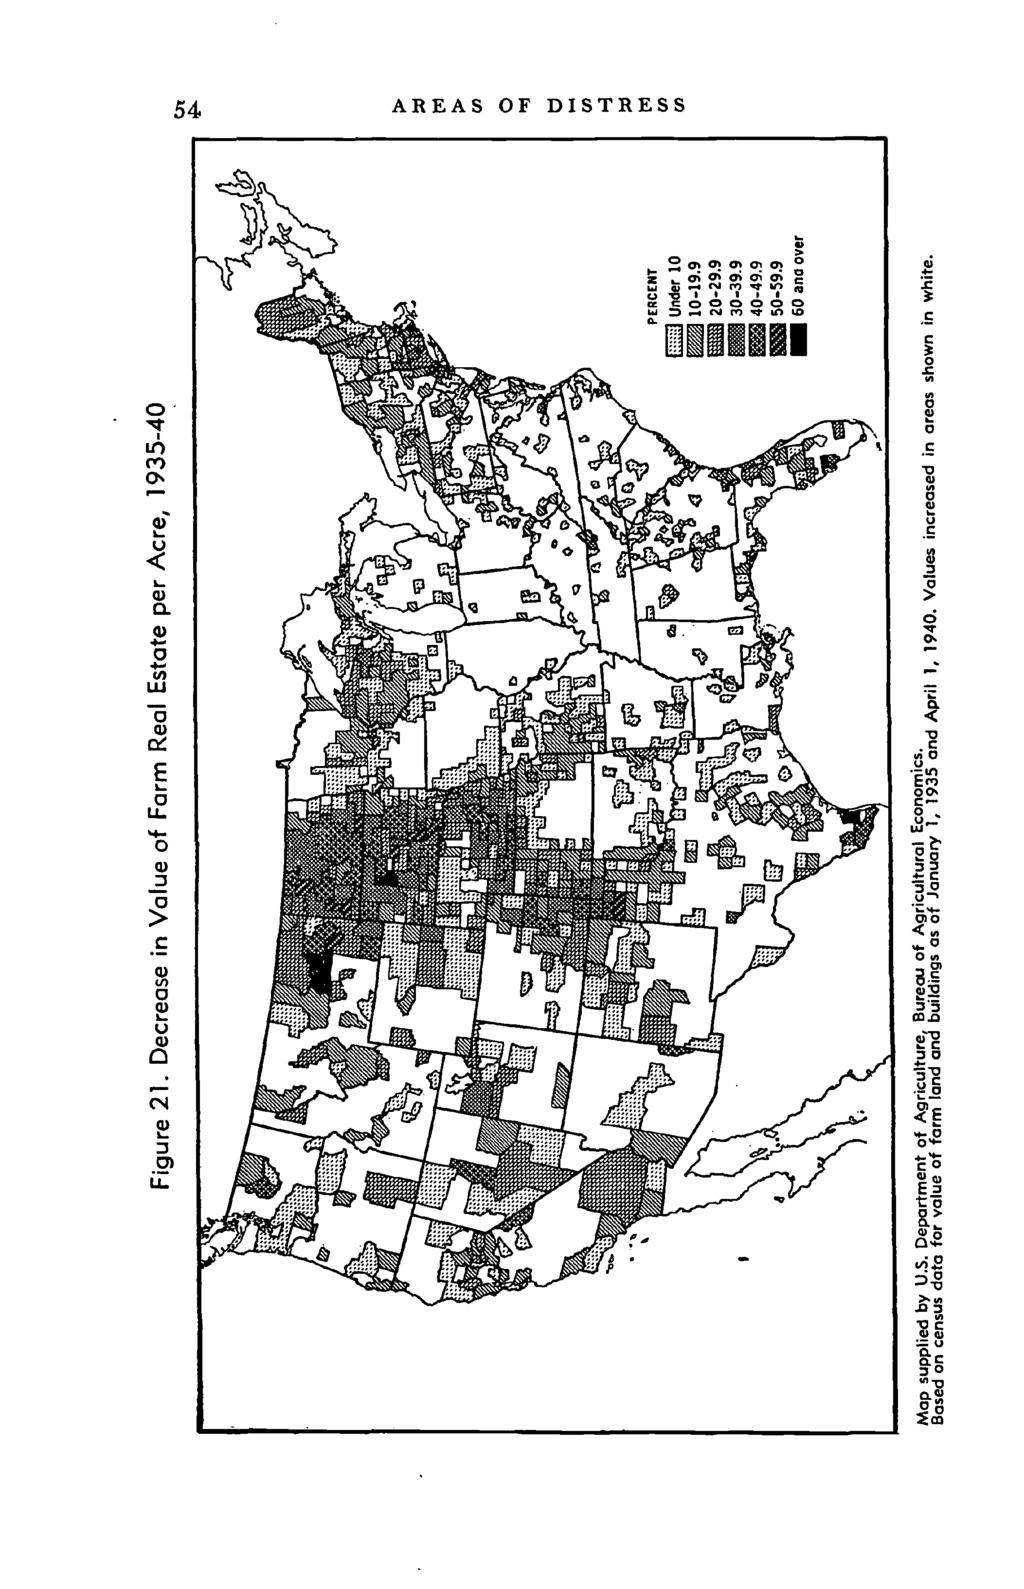
30 AREA OF DITRE 51 Trends in Land Values Indirect evidence of farm mortgage distress in the interwar period is afforded by the Census of Agriculture estimates of increases and decreases in land values by counties, the decreases being particularly significant (Figures 19, 20, and 21). Land values are the net result of numerous economic forces, including the mortgage situation; and in turn land values exert a reciprocal effect upon the situation. When land prices increase, mortgage debt eventually follows suit, thus setting the stage for possible future trouble. If farm incomes later decline substantially, some decrease in land values and some debt distress will develop almost automatically. The decrease in land values reduces loan security and operator equities; and any attempt by lenders to protect their investments through foreclosure or forced sale will merely aggravate the situation by driving prices down further. In short, declines in land values are both a cause and an effect of farm mortgage distress, and it is unlikely that either will develop to any great extent without the other. Exceptions may occur in areas having a small amount of mortgage debt. Even in a severe agricultural depression such areas might experience considerable declines in land values without noticeable mortgage distress. In general, however, farm mortgage distress during the interwar period was most acute in the areas in which land values declined the most (Figure 22). From 1920 to 1930, decreases in farm real estate values were greatest in the outheast, the Corn Belt, the eastern Great Plains, southeastern Oklahoma and northeastern Texas, and scattered areas throughout the Mountain region (Figure ig). Increases occurred in the Northeast, Florida, the western portions of Texas, Oklahoma, and Kansas, and parts of California and the western half of Washington and Oregon. In the years between 1930 and 1935, which cover the worst phase of the depression, oniy a few counties in the United tates escaped the deflation of farm property values (Figure 20). The extent of the decline is indicated by the fact that nine-tenths of the counties experienced decreases of 20 percent or more, and values dropped percent or more in over two-thirds of all counties. Declines of 40 percent or more occurred mainly in the western Corn Belt, outh Dakota, Nebraska, and eastern Oklahoma. By 1935 many agricultural areas had begun to recover economically. Reflecting this improvement, land value increases
31
32
33
34 AREA OF DITRE 55 Figure 22. Relation between Decline in Farm Real Estate Values, , and Distress Transfers of Farms, Distresi I OC Rate. C CO Percentage Decline in Value of Form Real Estate Distress transfer rate gives overage annual foreclosures and assignments per thousand mortgaged farms for each state; see Figure 7. Declines in value of farm land and buildings were calculated from the index of the Bureau of Agricultural Economics in Agricultural Finance Review, November 1952 (p. were general between 1935 and 1940 lfl the Corn Belt, the outh, and the Mountain region, and along the west coast (Figure 2 i). Exceptions were the northeastern and Great Plains states. There the financial condition of farmers remained generally unfavorable through the late thirties. Location of High and Low Distress Areas A review of the foregoing maps showing variations in general economic conditions, in over-all foreclosure experience, and in foreclosure and loss experience reported by specific lenders indicates considerable similarity in distress patterns. There are, it appears, four, or possibly five, important farming areas where mortgage distress was very much worse than average, and there are four areas where experience was very much better than
35 Figure 23. Major Areas of Good and Poor Farm Mortgage Loan Experience, GOOD EXPERIENCE A uburban Northeast B Central Corn Belt C Western Texas D Pacific Coast POOR EXPERIENCE E Great Plains F Lake tates G outhern Iowa and Northern Missouri Eastern Cotton Belt Central Cotton Belt 0 C,) U, U,
36 AREA OF DITRE 57 average (Figure 23). Of course variations occurred within these broad areas, and in scattered counties (not indicated) mortgage experience differed considerably from that of the area as a whole. A brief description of the high and low distress areas follows, summarizing the evidence in each case. Great Plains: The northern and central plains area containing the Dakotas, most of Montana, Nebraska, Kansas, and the eastern parts of Wyoming and Colorado is the most conspicuous of all the trouble spots because of its geographical extent. All the direct evidence heretofore considered distress transfers, insurance company foreclosures, and foreclosures and losses on land bank and Commissioner loans_points to bad mortgage experience in the Great Plains during the period under review. In addition there is substantial indirect evidence in the form of bank suspensions, decreases in bank deposits, and decreases in land values. Lake tates: In the region bordering the western Great Lakes, the area of poor experience covers most of Minnesota and Wisconsin, and the northern part of Michigan that is contiguous with Wisconsin. Distress transfers, insurance company and land bank foreclosures, and especially land bank and Commissioner losses combine to show considerable mortgage difficulty there, as in the Great Plains. Decreases in land values, however, were not so evident; northern Minnesota even showed substantial increases from 1920 to 1930 and from 1935 to outhern Iowa and Northern Missouri: The rather small distress area in the Corn Belt is important because its farming is relatively intensive and there is a considerable concentration of wealth. While the maps of distress transfers and of land bank and insurance company foreclosures all indicate trouble, probably the most dramatic evidence is the loss experience both of the life insurance companies (Figure 34, Chapter 3), which will be discussed later, and of the land banks. There was also a great deal of trouble, with serious losses, in northeastern Iowa. Eastern Cotton Belt: The distress area in the eastern cotton lands occupies most of Georgia and outh Carolina with a little of Alabama. Although the distress transfer maps do not clearly delineate the area, its very poor mortgage experience shows up plainly on the land bank and insurance company maps. Moreover, there were many bank failures, substantial declines in bank deposits, and noticeable declines in real estate values. Central Cotton Belt: The comparatively distressed part of

37 58 AREA OF DITRE the central Cotton Belt, including Mississippi, Arkansas, eastern Louisiana, and the eastern half of Oklahoma, is less of a trouble area than any of those previously discussed, though experience there was by no means good. The most definite evidence pointing to trouble in the central Cotton Belt was the experience with land bank loans. uburban Northeast: outhern New England and sections of New York and New Jersey within a hundred-mile radius of New York city make up an area of very good.experience. Distress transfer rates were low, and the land bank experience was good. Insurance companies made very few loans in the Northeast. Central Corn Belt: Central Illinois and parts of central Indiana and western Ohio had surprisingly good experience in comparison with the rest of the Corn Belt. This is shown most effectively on the loss rate maps for land banks and (as will appear later) for life insurance companies (page 86). The maps of land bank and insurance company foreclosure rates also indicate better than average experience in the central Corn Belt. Western Texas: Here the ranching and small grain areas of the southern Great Plains are joined with the western end of the Cotton Belt. But unlike the northerly sections of the Great Plains and the easterly sections of the Cotton Belt, western Texas had excellent farm mortgage experience, which is conspicuous on all the land bank and life insurance company maps. The area is also noteworthy as one of the few sections of the country that had substantial increases in land values during the twenties. Of further interest is the small number of bank failures in western Texas. Pacific Coast: Farm mortgage experience from southern California to northwestern Washington was generally good. This is confirmed by the distress transfer maps, insurance company foreclosure rates, and land bank foreclosure and loss rates. Increases in land values were general throughout the twenties.
Kentucky , ,349 55,446 95,337 91,006 2,427 1, ,349, ,306,236 5,176,360 2,867,000 1,462
 TABLE B MEMBERSHIP AND BENEFIT OPERATIONS OF STATE-ADMINISTERED EMPLOYEE RETIREMENT SYSTEMS, LAST MONTH OF FISCAL YEAR: MARCH 2003 Beneficiaries receiving periodic benefit payments Periodic benefit payments
Ability-to-Repay Statutes
 Ability-to-Repay Statutes FEDERAL ALABAMA ALASKA ARIZONA ARKANSAS CALIFORNIA STATUTE Truth in Lending, Regulation Z Consumer Credit Secure and Fair Enforcement for Bankers, Brokers, and Loan Originators
Q209 NATIONAL DELINQUENCY SURVEY FROM THE MORTGAGE BANKERS ASSOCIATION. Data as of June 30, 2009
 NATIONAL DELINQUENCY SURVEY FROM THE MORTGAGE BANKERS ASSOCIATION Q209 Data as of June 30, 2009 2009 Mortgage Bankers Association (MBA). All rights reserved, except as explicitly granted. Data are from
Q309 NATIONAL DELINQUENCY SURVEY FROM THE MORTGAGE BANKERS ASSOCIATION. Data as of September 30, 2009
 NATIONAL DELINQUENCY SURVEY FROM THE MORTGAGE BANKERS ASSOCIATION Q309 Data as of September 30, 2009 2009 Mortgage Bankers Association (MBA). All rights reserved, except as explicitly granted. Data are
State Individual Income Taxes: Personal Exemptions/Credits, 2011
 Individual Income Taxes: Personal Exemptions/s, 2011 Elderly Handicapped Blind Deaf Disabled FEDERAL Exemption $3,700 $7,400 $3,700 $7,400 $0 $3,700 $0 $0 $0 $0 Alabama Exemption $1,500 $3,000 $1,500 $3,000
DATA AS OF SEPTEMBER 30, 2010
 NATIONAL DELINQUENCY SURVEY Q3 2010 DATA AS OF SEPTEMBER 30, 2010 2010 Mortgage Bankers Association (MBA). All rights reserved, except as explicitly granted. Data are from a proprietary paid subscription
Union Members in New York and New Jersey 2018
 For Release: Friday, March 29, 2019 19-528-NEW NEW YORK NEW JERSEY INFORMATION OFFICE: New York City, N.Y. Technical information: (646) 264-3600 BLSinfoNY@bls.gov www.bls.gov/regions/new-york-new-jersey
Income from U.S. Government Obligations
 Baird s ----------------------------------------------------------------------------------------------------------------------------- --------------- Enclosed is the 2017 Tax Form for your account with
State Corporate Income Tax Collections Decline Sharply
 Corporate Income Tax Collections Decline Sharply Nicholas W. Jenny and Donald J. Boyd The Rockefeller Institute Fiscal News: Vol. 1, No. 3 July 26, 2001 According to a report from the Congressional Budget
Federal Registry. NMLS Federal Registry Quarterly Report Quarter I
 Federal Registry NMLS Federal Registry Quarterly Report 2012 Quarter I Updated June 6, 2012 Conference of State Bank Supervisors 1129 20 th Street, NW, 9 th Floor Washington, D.C. 20036-4307 NMLS Federal
The Effect of the Federal Cigarette Tax Increase on State Revenue
 FISCAL April 2009 No. 166 FACT The Effect of the Federal Cigarette Tax Increase on State Revenue By Patrick Fleenor Today the federal cigarette tax will rise from 39 cents to $1.01 per pack. The proceeds
Media Alert. First American CoreLogic Releases Q3 Negative Equity Data
 Contact Information Below Media Alert First American CoreLogic Releases Q3 Negative Equity Data First American CoreLogic, the first company to develop a national, state and city-level negative equity report,
Annual Costs Cost of Care. Home Health Care
 2017 Cost of Care Home Health Care USA National $18,304 $47,934 $114,400 3% $18,304 $49,192 $125,748 3% Alaska $33,176 $59,488 $73,216 1% $36,608 $63,492 $73,216 2% Alabama $29,744 $38,553 $52,624 1% $29,744
Checkpoint Payroll Sources All Payroll Sources
 Checkpoint Payroll Sources All Payroll Sources Alabama Alaska Announcements Arizona Arkansas California Colorado Connecticut Source Foreign Account Tax Compliance Act ( FATCA ) Under Chapter 4 of the Code
Nation s Uninsured Rate for Children Drops to Another Historic Low in 2016
 Nation s Rate for Children Drops to Another Historic Low in 2016 by Joan Alker and Olivia Pham The number of uninsured children nationwide dropped to another historic low in 2016 with approximately 250,000
Motor Vehicle Sales/Use, Tax Reciprocity and Rate Chart-2005
 The following is a Motor Vehicle Sales/Use Tax Reciprocity and Rate Chart which you may find helpful in determining the Sales/Use Tax liability of your customers who either purchase vehicles outside of
Providing Subprime Consumers with Access to Credit: Helpful or Harmful? James R. Barth Auburn University
 Providing Subprime Consumers with Access to Credit: Helpful or Harmful? James R. Barth Auburn University FICO Scores: Identifying Subprime Consumers Category FICO Score Range Super-prime 740 and Higher
Impacts of Prepayment Penalties and Balloon Loans on Foreclosure Starts, in Selected States: Supplemental Tables
 THE UNIVERSITY NORTH CAROLINA at CHAPEL HILL T H E F R A N K H A W K I N S K E N A N I N S T I T U T E DR. MICHAEL A. STEGMAN, DIRECTOR T 919-962-8201 OF PRIVATE ENTERPRISE CENTER FOR COMMUNITY CAPITALISM
Volume URL: Chapter Title: Appendix D Tables On Consumer Debt. Chapter URL:
 This PDF is a selection from an out-of-print volume from the National Bureau of Economic Research Volume Title: The Pattern of Consumer Debt, 1935-36: A Statistical Analysis Volume Author/Editor: Blanche
Volume Title: Mortgage Lending Experience in Agriculture. Volume Author/Editor: Lawrence A. Jones and David Durand
 This PDF is a selection from an out-of-print volume from the National Bureau of Economic Research Volume Title: Mortgage Lending Experience in Agriculture Volume Author/Editor: Lawrence A. Jones and David
Pay Frequency and Final Pay Provisions
 Pay Frequency and Final Pay Provisions State Pay Frequency Minimum Final Pay Resign Final Pay Terminated Alabama Bi-weekly or semi-monthly No Provision No Provision Alaska Semi-monthly or monthly Next
Undocumented Immigrants are:
 Immigrants are: Current vs. Full Legal Status for All Immigrants Appendix 1: Detailed State and Local Tax Contributions of Total Immigrant Population Current vs. Full Legal Status for All Immigrants
Residual Income Requirements
 Residual Income Requirements ytzhxrnmwlzh Ch. 4, 9-e: Item 44, Balance Available for Family Support (04/10/09) Enter the appropriate residual income amount from the following tables in the guideline box.
THE HOME ENERGY AFFORDABILITY GAP 2017
 TOTAL US $38,597,642,593 $47,648,609,571 123.4 The Index (2 nd Series) indicates the extent to which the has increased between the base year and the current year. In the total United States this Index
ATHENE Performance Elite Series of Fixed Index Annuities
 Rates Effective August 8, 05 ATHE Performance Elite Series of Fixed Index Annuities State Availability Alabama Alaska Arizona Arkansas Product Montana Nebraska Nevada New Hampshire California PE New Jersey
MEDICAID BUY-IN PROGRAMS
 MEDICAID BUY-IN PROGRAMS Under federal law, states have the option of creating Medicaid buy-in programs that enable employed individuals with disabilities who make more than what is allowed under Section
Sales Tax Return Filing Thresholds by State
 Thanks to R&M Consulting for assistance in putting this together Sales Tax Return Filing Thresholds by State State Alabama Alaska Arizona Arkansas California Colorado Connecticut Delaware Filing Thresholds
SECTION 109 HOST STATE LOAN-TO-DEPOSIT RATIOS. The Board of Governors of the Federal Reserve System, the Federal Deposit Insurance
 SECTION 109 HOST STATE LOAN-TO-DEPOSIT RATIOS The Board of Governors of the Federal Reserve System, the Federal Deposit Insurance Corporation, and the Office of the Comptroller of the Currency (the agencies)
MINIMUM WAGE WORKERS IN HAWAII 2013
 WEST INFORMATION OFFICE San Francisco, Calif. For release Wednesday, June 25, 2014 14-898-SAN Technical information: (415) 625-2282 BLSInfoSF@bls.gov www.bls.gov/ro9 Media contact: (415) 625-2270 MINIMUM
AIG Benefit Solutions Producer Licensing and Appointment Requirements by State
 3600 Route 66, Mail Stop 4J, Neptune, NJ 07754 AIG Benefit Solutions Producer Licensing and Appointment Requirements by State As an industry leader in the group insurance benefits market, AIG is firmly
EBRI Databook on Employee Benefits Chapter 6: Employment-Based Retirement Plan Participation
 EBRI Databook on Employee Benefits Chapter 6: Employment-Based Retirement Plan Participation UPDATED July 2014 This chapter looks at the percentage of American workers who work for an employer who sponsors
Termination Final Pay Requirements
 State Involuntary Termination Voluntary Resignation Vacation Payout Requirement Alabama No specific regulations currently exist. No specific regulations currently exist. if the employer s policy provides
kaiser medicaid and the uninsured commission on An Overview of Changes in the Federal Medical Assistance Percentages (FMAPs) for Medicaid July 2011
 for Medicaid July 2011") P O L I C Y B R I E F kaiser commission on medicaid and the uninsured July 2011 An Overview of Changes in the Federal Medical Assistance Percentages (FMAPs) for Medicaid Executive Summary Medicaid, which
P O L I C Y B R I E F kaiser commission on medicaid and the uninsured July 2011 An Overview of Changes in the Federal Medical Assistance Percentages (FMAPs) for Medicaid Executive Summary Medicaid, which
Economic Impacts of Wait Times for Commercial Driver s Licenses Skills Tests
 Economic Impacts of Wait Times for Commercial Driver s Licenses Skills Tests Nam D. Pham, Ph.D. Mary Donovan January 2019 Economic Impact of Wait Times for Commercial Driver s Licenses Skills Tests Nam
Federal Rates and Limits
 Federal s and Limits FICA Social Security (OASDI) Base $118,500 Medicare (HI) Base No Limit Social Security (OASDI) Percentage 6.20% Medicare (HI) Percentage Maximum Employee Social Security (OASDI) Withholding
State Tax Relief for the Poor
 State Tax Relief for the Poor David S. Liebschutz and Steven D. Gold T his paper summarizes highlights of the book State Tax Relief for the Poor by David S. Liebschutz, associate director of the Center
State Income Tax Tables
 ALABAMA 1 st $1,000... 2% Next 5,000... 4% Over 6,000... 5% ALASKA... 0% ARIZONA 1 1 st $10,000... 2.87% Next 15,000... 3.2% Next 25,000... 3.74% Next 100,000... 4.72% Over 150,000... 5.04% ARKANSAS 1
# of Credit Unions As of March 31, 2011
 # of Credit Unions # of Credit Unins # of Credit Unions As of March 31, 2011 8,600 8,400 8,200 8,000 8,478 8,215 7,800 7,909 7,600 7,400 7,651 7,442 7,200 7,000 6,800 # of Credit Unions -Trend By Asset-Based
Q Homeowner Confidence Survey Results. May 20, 2010
 Q1 2010 Homeowner Confidence Survey Results May 20, 2010 The Zillow Homeowner Confidence Survey is fielded quarterly to determine the confidence level of American homeowners when it comes to the value
Chapter D State and Local Governments
 Chapter D State and Local Governments State and Local Governments contains detailed information on the taxes, revenues, and expenditures of states and localities. The public finances of these two levels
FAPRI Analysis of Dairy Policy Options for the 2002 Farm Bill Conference
 FAPRI Analysis of Dairy Policy Options for the 2002 Farm Bill Conference FAPRI-UMC Report #04-02 April 11, 2002 Food and Agricultural Policy Research Institute University of Missouri 101 South Fifth Street
The Costs and Benefits of Half a Loaf: The Economic Effects of Recent Regulation of Debit Card Interchange Fees. Robert J. Shapiro
 The Costs and Benefits of Half a Loaf: The Economic Effects of Recent Regulation of Debit Card Interchange Fees Robert J. Shapiro October 1, 2013 The Costs and Benefits of Half a Loaf: The Economic Effects
Population in the U.S. Floodplains
 D ATA B R I E F D E C E M B E R 2 0 1 7 Population in the U.S. Floodplains Population in the U.S. Floodplains As sea levels rise due to climate change, planners and policymakers in flood-prone areas must
THE HOME ENERGY AFFORDABILITY GAP 2012
 TOTAL US $38,597,642,593 $38,573,122,158 99.9 The Index (2 nd Series) indicates the extent to which the has increased between the base year and the current year. In the total United States this Index was
NOTICE TO MEMBERS CANADIAN DERIVATIVES CORPORATION CANADIENNE DE. Trading by U.S. Residents
 NOTICE TO MEMBERS CANADIAN DERIVATIVES CORPORATION CANADIENNE DE CLEARING CORPORATION COMPENSATION DE PRODUITS DÉRIVÉS NOTICE TO MEMBERS No. 2002-013 January 28, 2002 Trading by U.S. Residents This is
STATE REVENUE REPORT Fiscal Studies Program The Nelson A. Rockefeller Institute of Government
 STATE REVENUE REPORT Fiscal Studies Program The Nelson A. Rockefeller Institute of Government December 2004 No. 58 State Tax Revenue on Upward Track Nicholas W. Jenny HIGHLIGHTS State tax revenue in the
BY THE NUMBERS 2016: Another Lackluster Year for State Tax Revenue
 BY THE NUMBERS 2016: Another Lackluster Year for State Tax Revenue Jim Malatras May 2017 Lucy Dadayan and Donald J. Boyd 2016: Another Lackluster Year for State Tax Revenue Lucy Dadayan and Donald J. Boyd
Child Care Assistance Spending and Participation in 2016
 Policy solutions that work for low-income people Child Care Assistance Spending and Participation in 2016 i Background The Child Care and Development Block Grant (CCDBG) is the primary federal funding
NEW FEDERAL LAW COULD WORSEN STATE BUDGET PROBLEMS States Can Protect Revenues by Decoupling By Nicholas Johnson
 820 First Street NE, Suite 510 Washington, DC 20002 Tel: 202-408-1080 Fax: 202-408-1056 center@cbpp.org www.cbpp.org Revised February 28, 2008 NEW FEDERAL LAW COULD WORSEN STATE BUDGET PROBLEMS States
USING INCOME TAXES TO ADDRESS STATE BUDGET SHORTFALLS. By Elizabeth C. McNichol
 820 First Street, NE, Suite 510, Washington, DC 20002 Tel: 202-408-1080 Fax: 202-408-1056 center@cbpp.org www.cbpp.org Revised June 13, 2003 USING INCOME TAXES TO ADDRESS STATE BUDGET SHORTFALLS By Elizabeth
CAPITOL research. States Face Medicaid Match Loss After Recovery Act Expires. health
 CAPITOL research MAR health States Face Medicaid Match Loss After Expires Summary Medicaid, the largest health insurance program in the nation, is jointly financed by state and federal governments. The
1084 FEDERAL RESERVE BULLETIN NOVEMBER 1937
 0 FEDERAL RESERVE BULLETIN NOVEMBER CHANGES IN THE NUMBER OF NATIONAL AND STATE BANKS - During the years - the number of national and State banks in operation decreased by,, from,0 at the beginning of
504 Loan Program Rural Initiative - Waiver of Limitation on Lending Authority
 This document is scheduled to be published in the Federal Register on 07/19/2018 and available online at https://federalregister.gov/d/2018-15312, and on govinfo.gov Billing Code: 8025-01 SMALL BUSINESS
The table below reflects state minimum wages in effect for 2014, as well as future increases. State Wage Tied to Federal Minimum Wage *
 State Minimum Wages The table below reflects state minimum wages in effect for 2014, as well as future increases. Summary: As of Jan. 1, 2014, 21 states and D.C. have minimum wages above the federal minimum
# of Credit Unions As of September 30, 2011
 # of Credit Unions # of Credit Unions # of Credit Unions As of September 30, 2011 8,400 8,200 8,000 7,800 7,600 7,400 7,200 8,332 8,065 7,794 7,556 7,325 7,000 6,800 9,000 8,000 7,000 6,000 5,000 4,000
Forecasting State and Local Government Spending: Model Re-estimation. January Equation
 Forecasting State and Local Government Spending: Model Re-estimation January 2015 Equation The REMI government spending estimation assumes that the state and local government demand is driven by the regional
MINIMUM WAGE WORKERS IN TEXAS 2016
 For release: Thursday, May 4, 2017 17-488-DAL SOUTHWEST INFORMATION OFFICE: Dallas, Texas Contact Information: (972) 850-4800 BLSInfoDallas@bls.gov www.bls.gov/regions/southwest MINIMUM WAGE WORKERS IN
February 2018 QUARTERLY CONSUMER CREDIT TRENDS. Public Records
 February 2018 QUARTERLY CONSUMER CREDIT TRENDS Public Records p Jasper Clarkberg p Michelle Kambara This is part of a series of quarterly reports on consumer credit trends produced by the Consumer Financial
Estimating the Number of People in Poverty for the Program Access Index: The American Community Survey vs. the Current Population Survey.
 Background Estimating the Number of People in Poverty for the Program Access Index: The American Community Survey vs. the Current Population Survey August 2006 The Program Access Index (PAI) is one of
FHA Manual Underwriting Exceeding 31% / 43% DTI Eligibility Quick Reference
 Credit Score/ Compensating Factor(s)* No Compensating Factor One Compensating Factor Two Compensating Factors No Discretionary Debt Maximum DTI 31% / 43% 37% / 47% 40% / 50% 40% / 40% *Acceptable compensating
STATE REVENUE AND SPENDING IN GOOD TIMES AND BAD 5
 STATE REVENUE AND SPENDING IN GOOD TIMES AND BAD 5 Part 2 Revenue States claim that the most immediate cause of strife in state budgets is current and anticipated drops in revenue. No doubt, a drop in
Federal Reserve Bank of Dallas. July 15, 2005 SUBJECT. Banking Agencies Issue Host State Loan-to-Deposit Ratios DETAILS
 Federal Reserve Bank of Dallas 2200 N. PEARL ST. DALLAS, TX 75201-2272 July 15, 2005 Notice 05-37 TO: The Chief Executive Officer of each financial institution and others concerned in the Eleventh Federal
Exhibit 57A. Approved Attorney Fees and Title Expenses
 Exhibit 57A Approved Attorney Fees and Title Expenses Written pre-approval from Freddie Mac is required before incurring any expense in excess of any of the below amounts. See Sections 9701.11 and 9701.15
EMPLOYMENT COST INDEX MARCH 2011
 Transmission of material in this release is embargoed until 8:30 a.m. (EDT) Friday, April 29, USDL-11-0586 Technical information: Media contact: (202) 691-6199 NCSinfo@bls.gov www.bls.gov/ect (202) 691-5902
HAC USDA RURAL DEVELOPMENT HOUSING ACTIVITY. Rural Research Report. Housing Assistance Council FISCAL YEAR 2017 YEAR-END REPORT
 USDA RURAL DEVELOPMENT HOUSING ACTIVITY FISCAL YEAR 217 YEAR-END REPORT HAC Rural Research Report Since the 195s. the United States Department of Agriculture has financed the construction, repair, and
Overview of Sales Tax Exemptions for Agricultural Producers in the United States
 Overview of Sales Tax Exemptions for Agricultural Producers in the United States Dr. Wayne P. Miller Tyler R. Knapp November 2017 Draft Not for publication or quotation The University of Arkansas System
STATE REVENUE REPORT SECOND QUARTER, 2017
 STATE REVENUE REPORT SECOND QUARTER, 2017 Volatility in Income Tax, Continued Weakness in Sales Tax, Slower Growth in Property Tax Jim Malatras December 2017 Report #109 Lucy Dadayan www.rockinst.org @rockefellerinst
Taxes and Economic Competitiveness. Dale Craymer President, Texas Taxpayers and Research Association (512)
") Taxes and Economic Competitiveness Dale Craymer President, Texas Taxpayers and Research Association (512) 472-8838 dcraymer@ttara.org www.ttara.org Presented to the Committee on Economic Competitiveness
Taxes and Economic Competitiveness Dale Craymer President, Texas Taxpayers and Research Association (512) 472-8838 dcraymer@ttara.org www.ttara.org Presented to the Committee on Economic Competitiveness
Fingerprint, Biographical Affidavit and Third-Party Verification Reports Requirements
 Updates to the State Specific Information Fingerprint, Biographical Affidavit and Third-Party Verification Reports Requirements State Requirements For Licensure Requirements After Licensure (Non-Domestic)
Required Training Completion Date. Asset Protection Reciprocity
 Completion Alabama Alaska Arizona Arkansas California State Certification: must complete initial 16 hours (8 hrs of general LTC CE and 8 hrs of classroom-only CE specifically on the CA for LTC prior to
CHAPTER 6. The Economic Contribution of Hospitals
 CHAPTER 6 The Economic Contribution of Hospitals Chart 6.1: National Health Expenditures as a Percentage of Gross Domestic Product and Breakdown of National Health Expenditures, 2014 U.S. GDP 2014 $3.03
If the foreign survivor of the merger is on the record what do you require?
 Topic: Question by: : Foreign Mergers Tracy M. Sebranek Maine Date: December 17, 2013 Manitoba Corporations Canada Alabama Alaska Arizona We require only a certified copy of the merger documents, as long
State Unemployment Insurance Tax Survey
 444 N. Capitol Street NW, Suite 142, Washington, DC 20001 202-434-8020 fax 202-434-8033 www.workforceatm.org State Unemployment Insurance Tax Survey NATIONAL ASSOCIATION OF STATE WORKFORCE AGENCIES April
Mutual Fund Tax Information
 Mutual Fund Tax Information We have provided this information as a service to our shareholders. Thornburg Investment Management cannot and does not give tax or accounting advice. If you have further questions
Employer-Funded Individual Health Insurance
 Employer-Funded Individual Health Insurance ANNUAL REPORT 2016 1 EXECUTIVE SUMMARY This 2016 Annual Report is intended to provide a detailed, nationwide profile of how employers and employees are using
PAY STATEMENT REQUIREMENTS
 PAY MENT 2017 PAY MENT Alabama Alaska Arizona Arkansas California Colorado Connecticut Delaware District of Columbia Florida Georgia No generally applicable wage payment law for private employers. Rate
Total state and local business taxes
 Total state and local business taxes State-by-state estimates for fiscal year 2017 November 2018 Executive summary This study presents detailed state-by-state estimates of the state and local taxes paid
Understanding Oregon s Throwback Rule for Apportioning Corporate Income
 Understanding Oregon s Throwback Rule for Apportioning Corporate Income Senate Interim Committee on Finance and Revenue January 12, 2018 2 Apportioning Corporate Income Apportionment is a method of dividing
2018 ABA Commercial Real Estate Survey Report. July 2018
 2018 ABA Commercial Real Estate Survey Report July 2018 Table of Contents Acknowledgements......3 Summary of Key Survey Findings.....4 Participant Profile....5 CRE Capital Concentrations.. 8 Market Characteristics.....
AUGUST MORTGAGE INSURANCE DATA AT A GLANCE
 AUGUST MORTGAGE INSURANCE DATA AT A GLANCE CONTENTS 4 OVERVIEW 32 PRITE-LABEL SECURITIES Mortgage Insurance Market Composition 6 AGENCY MORTGAGE MARKET Defaults : 90+ Days Delinquent Loss Severity GSE
DFA INVESTMENT DIMENSIONS GROUP INC. DIMENSIONAL INVESTMENT GROUP INC. Institutional Class Shares January 2018
 DFA INVESTMENT DIMENSIONS GROUP INC. DIMENSIONAL INVESTMENT GROUP INC. Institutional Class Shares January 2018 Supplementary Tax Information 2017 The following supplementary information may be useful in
Medicaid and State Budgets: Looking at the Facts Cindy Mann, Joan C. Alker and David Barish October 2007
 Medicaid and State Budgets: Looking at the Facts Cindy Mann, Joan C. Alker and David Barish Medicaid covered 60.9 million people in 2006, including 29.5 million children and 5.5 million people over 65.
JANUARY 30 DATA RELEASE WILL CAPTURE ONLY A PORTION OF THE JOBS CREATED OR SAVED BY THE RECOVERY ACT By Michael Leachman
 820 First Street NE, Suite 510 Washington, DC 20002 Tel: 202-408-1080 Fax: 202-408-1056 center@cbpp.org www.cbpp.org January 29, 2010 JANUARY 30 DATA RELEASE WILL CAPTURE ONLY A PORTION OF THE JOBS CREATED
Mapping the geography of retirement savings
 of savings A comparative analysis of retirement savings data by state based on information gathered from over 60,000 individuals who have used the VoyaCompareMe online tool. Mapping the geography of retirement
The Economic Impact of Spending for Operations and Construction in 2013 by AZA-Accredited Zoos and Aquariums
 The Economic Impact of Spending for Operations and Construction in 2013 by AZA-Accredited Zoos and Aquariums By Stephen S. Fuller, Ph.D. Dwight Schar Faculty Chair and University Professor Director, Center
Consumer Installment Loan Regulations - State
 Alabama Yes State of Alabama Banking Department Code 5-18-1 et seq http://www.bank.state.al.us/faq_regarding _licensing.htm Alaska Yes Department of Commerce, Community and Economic Development, Consumer
STATE EMPLOYMENT AND UNEMPLOYMENT JUNE 2018
 For release 10:00 a.m. (EDT) Friday, July 20, USDL-18-1183 Technical information: Employment: Unemployment: Media contact: (202) 691-6559 sminfo@bls.gov www.bls.gov/sae (202) 691-6392 lausinfo@bls.gov
How Would States Be Affected By Health Reform?
 How Would States Be Affected By Health Reform? Timely Analysis of Immediate Health Policy Issues January 2010 John Holahan and Linda Blumberg Summary The prospects of health reform were dealt a serious
STATE MINIMUM WAGES 2017 MINIMUM WAGE BY STATE
 STATE MINIMUM WAGES 2017 MINIMUM WAGE BY STATE The table below, created by the National Conference of State Legislatures (NCSL), reflects current state minimum wages in effect as of January 1, 2017, as
How Public Education Benefits from the Federal Income Tax Deduction for State and Local Taxes and Other Special Tax Provisions
 How Public Education Benefits from the Federal Income Tax Deduction for State and Local Taxes and Other Special Tax Provisions A Background Paper from the Center on Education Policy Introduction Discussions
Commonfund Higher Education Price Index Update
 Commonfund Higher Education Price Index 2017 Update Table of Contents EXECUTIVE SUMMARY 1 INTRODUCTION: THE HIGHER EDUCATION PRICE INDEX 1 About HEPI 1 The HEPI Tables 2 HIGHER EDUCATION PRICE INDEX ANALYSIS
Mutual Fund Tax Information
 2008 Mutual Fund Tax Information We have provided this information as a service to our shareholders. Thornburg Investment Management cannot and does not give tax or accounting advice. If you have further
Interest Table 01/04/2010
 The following table provides information on the interest charged by each of the 50 states and its territories: FOR THE UNITED S AND TERRITORIES Alabama Alaska Arizona Arkansas California Colorado Connecticut
Supporting innovation and economic growth. The broad impact of the R&D credit in Prepared by Ernst & Young LLP for the R&D Credit Coalition
 Supporting innovation and economic growth The broad impact of the R&D credit in 2005 Prepared by Ernst & Young LLP for the R&D Credit Coalition April 2008 Executive summary Companies of all sizes, in a
TA X FACTS NORTHERN FUNDS 2O17
 TA X FACTS 2O17 Northern Funds Tax Facts provides specific information about your Northern Funds investment income and capital gain distributions for 2017. If you have any questions about how to apply
2014 STATE AND FEDERAL MINIMUM WAGES HR COMPLIANCE CENTER
 2014 STATE AND FEDERAL MINIMUM WAGES HR COMPLIANCE CENTER The federal Fair Labor Standards Act (FLSA), which applies to most employers, establishes minimum wage and overtime requirements for the private
Documentation for Moffitt Welfare Benefits File (ben_data.txt) (2/22/02)
 (2/22/02)") ben_doc.pdf Documentation for Moffitt Welfare Benefits File (ben_data.txt) (2/22/02) The file ben_data.txt is a text file containing data on state-specific welfare benefit variables from 1960-1998. A few
ben_doc.pdf Documentation for Moffitt Welfare Benefits File (ben_data.txt) (2/22/02) The file ben_data.txt is a text file containing data on state-specific welfare benefit variables from 1960-1998. A few
Fingerprint and Biographical Affidavit Requirements
 Updates to the State-Specific Information Fingerprint and Biographical Affidavit Requirements State Requirements For Licensure Requirements After Licensure (Non-Domestic) Alabama NAIC biographical affidavit
State-Level Trends in Employer-Sponsored Health Insurance
 June 2011 State-Level Trends in Employer-Sponsored Health Insurance A STATE-BY-STATE ANALYSIS Executive Summary This report examines state-level trends in employer-sponsored insurance (ESI) and the factors
TANF FUNDS MAY BE USED TO CREATE OR EXPAND REFUNDABLE STATE CHILD CARE TAX CREDITS
 820 First Street, NE, Suite 510, Washington, DC 20002 Tel: 202-408-1080 Fax: 202-408-1056 center@cbpp.org http://www.cbpp.org October 11, 2000 TANF FUNDS MAY BE USED TO CREATE OR EXPAND REFUNDABLE STATE