Volume Title: Mortgage Lending Experience in Agriculture. Volume Author/Editor: Lawrence A. Jones and David Durand
|
|
|
- Peter Cameron
- 5 years ago
- Views:
Transcription
1 This PDF is a selection from an out-of-print volume from the National Bureau of Economic Research Volume Title: Mortgage Lending Experience in Agriculture Volume Author/Editor: Lawrence A. Jones and David Durand Volume Publisher: Princeton University Press/NBER Volume ISBN: X Volume URL: Publication Date: 1954 Chapter Title: Introduction: Historical Background Chapter Author: Lawrence A. Jones, David Durand Chapter URL: Chapter pages in book: (p. 1-22)
2 MORTGAGE LENDING EXPERIENCE IN AGRICULTURE
3
.")
4 INTRODUCTION: HISTORICAL BACKGROUND AMERICAN farmers have never known long periods of economic stability. The best available evidence of their changeable situation is the index of wholesale prices of farm products in the United States, which extends back to the end of the eighteenth century (Figure i). In addition to relatively minor price movements, which have followed each other in rapid succession, the farm price index shows four violent movements since 1798, each associated with a major war. And according to the Warren and Pearson wholesale price index, there was another such movement during the years of the Revolution.1 These disturbances are due, of course, to wartime inflation and increases in the demand for farm products, with a consequent rise in farm prices and incomes, and eventually in farm land values and debts. In the past, such periods of high prices and incomes have been short-lived, and the ensuing periods of depression have been severe and characterized by widespread farm mortgage distress. Whether the rise associated with World War II will have a like sequel remains to be seen. This introduction outlines the main features of the periods into which the last century and a half of agricultural history can be conveniently divided, with emphasis on trends affecting farm mortgage indebtedness and farmers' ability to carry such indebtedness. Nineteenth Century At the beginning of the nineteenth century the United States was recovering from the post-revolutionary-war deflation.2 As the Napoleonic Wars expanded the market for farm products, agricultural conditions improved, except for a brief period during which embargoes cut off exports, and agriculture entered a period of price inflation culminating in the boom that occurred during the War of Shortly after the peace the demand for American farm staples declined abruptly, and for 1 Historical Statistics of the United States, (Bureau of the Census), p Few statistics are available concerning American business conditions following the Revolutionary War, but the newspapers carried many bankruptcy notices, and some states passed "stay and tender" laws providing moratoria for certain debts, or permitting debtors to tender goods, cattle, or land in settlement of their obligations.
5 4 INTRODUCTION nearly a decade after the panic of agricultural prices were low. Land values shrank drastically, and the subsequent debt difficulties of farmers and others resulted in legislation to protect and advance the interests of debtors. A Senate committee reported that "landed property was daily sacrificed at Figure 1. Index of Wholesale Prices, Farm and Nonfarm Products, BLS and Warren and Pearson indexes as compiled by Bureau of Agricultural Economics = 100), revised (Through 1948 as in Agricultural Outlook Charts, 1950.) Nonfarm products include all commodities other than farm products and foods. sheriffs' sales for a half, a third, nay a quarter of its value, and hundreds of industrious farmers thereby deprived of their homes and the fruits of their labor. Merchandise, household goods, and farming stock, would not bring at forced sale onehalf the cost of production."s 8 John Bach McMaster, A History of the People of the United States from the Rez.'olution to the Civil War, Vol. 4 (1897), p. 495.
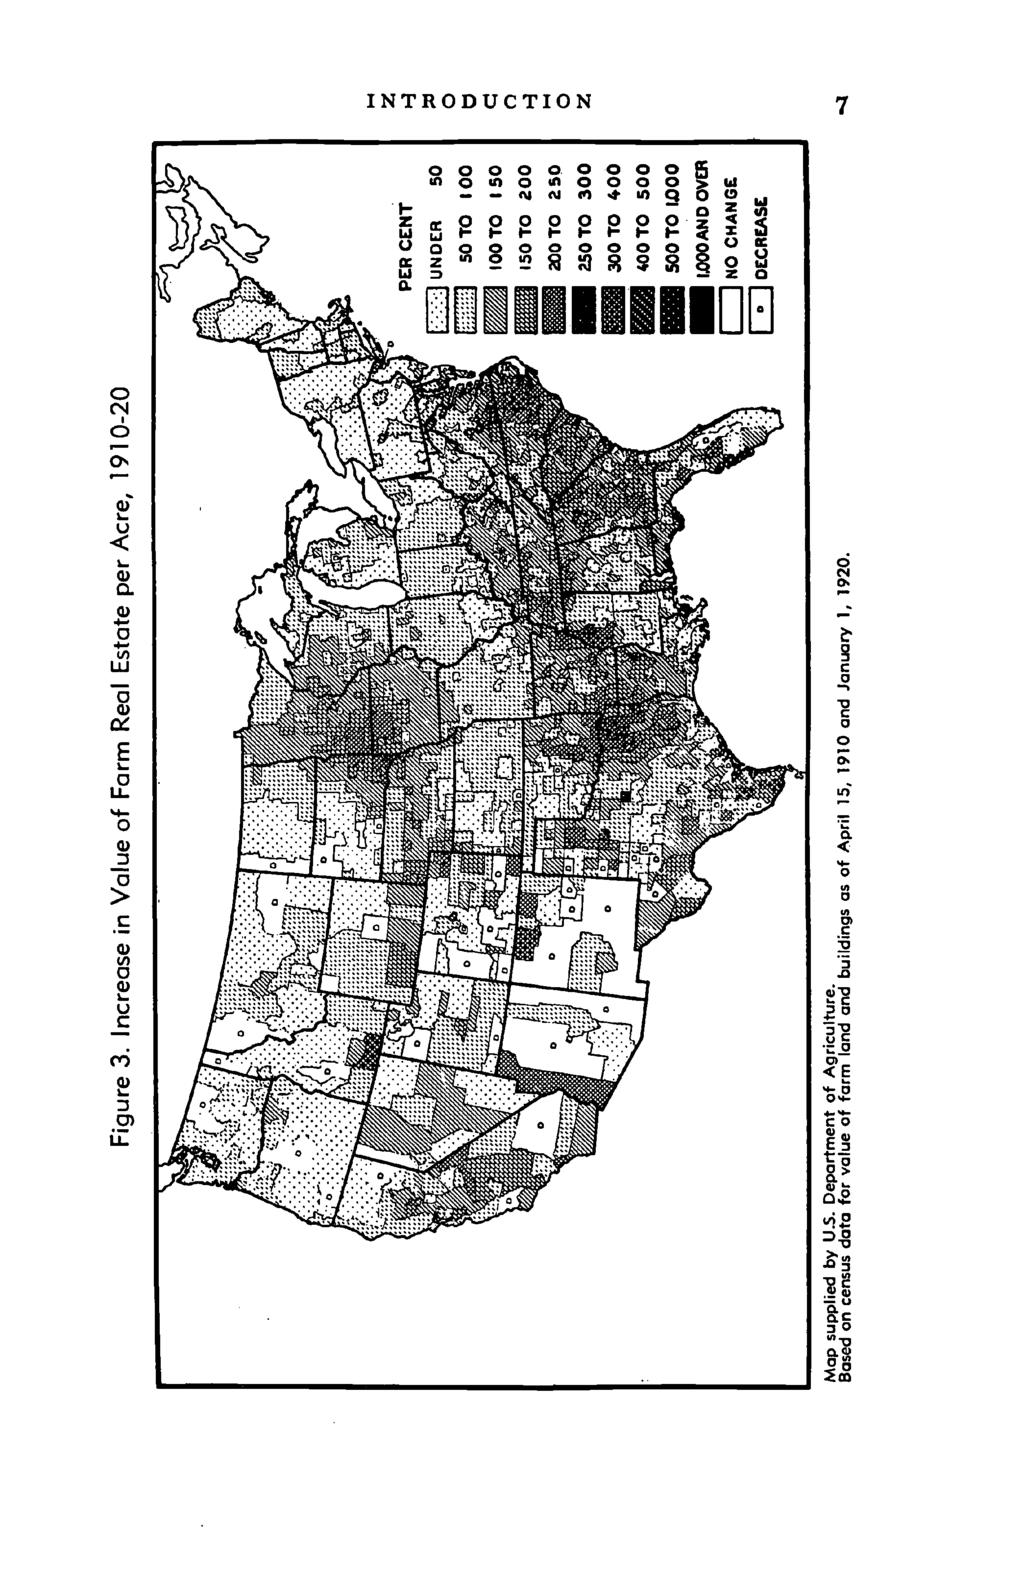
6 INTRODUCTION 5 In the 1830's there was a period of farm prosperity marked by heavy speculation in midwestern lands, followed by the panic of 1837 and generally distressed conditions. Agriculture and the rest of the economy suffered until Thereafter, except for a few years, agricultural prices were increasingly favorable until the end of the Civil War. During the Civil War years farm prices doubled, and agriculture prospered except in much of the South. With the return of peace, however, prices started downward, credit tightened, and lenders began to call loans. A long period of depression ensued, which reached its depth in the panic of Heavy debts, along with declining incomes, caused widespread suffering among farmers, particularly in the West. Twentieth Century through World War 1 Around the turn of the century agriculture again entered a prosperous period. Developments in the two decades of prosperity up to 1920 laid the groundwork for much of the farm mortgage distress occurring between 1920 and i94o the period with which our investigation is chiefly concerned. Prices of farm commodities rose steadily from their low point shortly before 1900 and by 1910 had nearly doubled. Between 1900 and 1910 the average value of farm real estate per acre doubled. Increases of 300 percent and more occurred in many counties in western Texas, the Great Plains, and the Mountain region. In those areas much new land had been brought under farming, including substantial acreages under irrigation. In the northeastern part of the nation land value increases were relatively small. From 1910 until World War I agricultural prices were relatively stable. During the war they increased rapidly and by early 1920 were more than two and one-half times their average for the prewar years ( ). Farm land values, whose movements for the country as a whole are shown in Figure 2, also increased, until at the peak in 1920 they were 73 percent above their prewar level. Although land value increases were general, they were largest, percentagewise, in the Southeast and in the northwestern part of the Corn Belt, and smallest in the northeastern states. Regional differences in the rise of land values for the entire decade are shown in Figure 3. The war years, and especially the postwar years 1919 and 1920, were characterized by a very active and speculative farm real
7 6 INTRODUCTION estate market. Foreclosures and forced transfers were relatively few. Profits were often invested in more land, livestock, and equipment. The feeling was widespread that prosperity would continue Many of the areas that were most pros- Figure 2. Distress Transfers, Voluntary Transfers, and Value of Farm Real Estate per Acre, Transfers Forms Land Value Adopted from a chart by the Bureau of Economics. value indexes ( = 100) refer to value of land and buildings as of March 1; transfer data refer to transactions from March 16 through March 15 of the following year. Distress transfers include assignments to avoid foreclosure, as well as foreclosures. perous and in which land speculation was greatest during this period were to suffer the most severe distress in the subsequent farm depression. Credit to finance both agricultural and industrial expansion was plentiful during World War I. Between 1915 and 1920 more than 3,ooo new banks were organized, most of them in
8

9 8 INTRODUCTION the Midwest. Farm debt rose rapidly. Mortgages increased from about billion in 1910 to $5 billion at the end of 1916 (Figure 4). By the end of 1920, farm mortgage loans had passed the $10 billion mark, which was twice the level of 1916 and over three times that of igio. Non-real-estate farm loans of commercial banks also increased, rising from $i.6 billion at the beginning of 1915 to a peak of billion at the end of This Figure 4. Farm Mortgage Debt Held by Major Lender Groups, January figures. Data for are from Form-Mortgage Credit Facilities in the United States, by Donald C. Horton, Harold C. Larsen, and Norman J. Wall (USDA, 1942 p. 12); for from Agricultural Statistics (USDA); for , from Agricultural Finance Review (BAE), Vol. 14, Supplement May 1952 (p. 2), rapid growth of debt resulted partly from the need to meet higher operating costs, to acquire new equipment and additional livestock, and to expand acreage, but above all it arose from the purchase of farms in a rising land market. The Southeast and some areas of the West, particularly the Mountain states, showed the greatest rise in farm mortgage debt,5 and in 4 Agricultural Finance Review (Bureau of Agricultural Economics), Vol. 14, Supplement May 1952, Table 19, p. 27. Ibid., Vol. 2, November Table 6, pp. goff.
' One important characteristic of the wartime mortgage debt expansion")
10 INTRODUCTION 9 those regions land values also increased greatly.6 In the Northeast, where the farm real estate market was relatively inactive, the rise in mortgage debt was comparatively small)' One important characteristic of the wartime mortgage debt expansion was the sharp increase in the average size of new farm mortgages recorded. In 1917, the first year for which estimates are available, the average new mortgage loan amounted to $2,640. In 1918 and 1919 the averages were $2,880 and $3,460, respectively. In 1920 the average new farm mortgage loan amounted to The increasing size of mortgage loans meant in many instances an increase in the ratio of debt to value, even at the higher level of farm land prices. The census reported that for owner-operated mortgaged farms in 1910 the debt amounted to 27.3 percent of the value; by 1920 the debt was 29.1 percent of value.9 Not only did the period give rise to larger loans, both in average size and relative to value, but the proportion of mortgaged farms went up. The census reported that 41.1 percent of all owner-operated farms were mortgaged in 1920, an increase from 33.6 percent in The Interwar Period The agricultural depression of the interwar period began with a spectacular collapse of agricultural prices in mid In May of that year the index of farm prices reached 237 ( = i oo). By June of the following year the index had dropped to iii. On the cost side, prices paid by farmers for commodities used in production (including interest, taxes, and wages) also dropped, but much less sharply, from an annual average of 214 ifl 1920 to 155 ifl The change in price relationships was in itself sufficient to produce a drastic shrinking of net farm incomes; and the situation was aggravated by droughts in several of the northwestern states. Naturally, the enormously expanded debt structure of agriculture was particularly vulnerable to such a shock. Credit began to tighten and many loans were called, 0 M. M. Regan and A. R. Johnson, The Farm Real Estate Situation, (U.S. Department of Agliculture, Circular No. 754), pp. 6 f. 7 Agricultural Finance Review, Vol. 2, November Table 6, pp. go if. 8 Average Size of Farm-Mortgage Recordings of Selected Lender Groups (Bureau of Agricultural Economics, mimeo., November 1940), p. 9 16th Census: 1940, Agriculture, Vol. Table 6, p Agricultural Finance Review, Vol. io, November 1947, Table i, p Indexes of prices received and paid by farmers are the revised series of the Bureau of Agricultural Economics with January 1910 through December 1914 as the base period, from Agricultural Outlook Charts, 1953 (October 1952), page g.
.")
11 10 INTRODUCTION beginning with short-term obligations. Many farmers were forced out of business, and others borrowed on their remaining real estate equity to repay their short-term loans. Refunding was largely responsible for the continued rise in farm mortgage debt, which reached its peak in 1923 (Figure 4). Although by 1923 agricultural prices had made a substantial recovery from the low point reached in 1921, the recovery was not sufficient to restore price-cost relationships to the favorable wartime level. Largely as a result, realized net income of farm operators averaged 30 percent lower during the years than during Throughout most of the twenties land values declined, reflecting adjustments to the lower level of farm incomes. These declines eliminated the equity of many farmers and often resulted in losses to lenders when foreclosure was necessary. Distress transfers (foreclosures, and assignments to avoid foreclosure) increased steadily after In that year they had occurred at the rate of 4 per thousand farms; by 1926 the rate of distress transfers was over i 8 per thousand farms (Figure 2). Banking operations are another indicator of economic conditions. Deposit withdrawals and the freezing of funds in unpaid loans were more severe in rural than in industrial areas. From 1921 through 1929, 5,411 state and national banks suspended operations; this was i8 percent of the number of banks active in Of the suspended banks 92 percent were in small cities and villages of less than io,ooo population. Bank closings were particularly heavy in the Southeast, the Great Plains, and the Mountain states predominantly farming regions. In the industrialized East and Northeast very few banks closed.'4 After difficulties in the twenties, agriculture faced catastrophe in the early thirties. Prices of farm products dropped from the onset of the depression in 1929 until by 1932 they were less than half their 1929 average and were below the prewar prices of Realized net income of farm operators, which had reached $9.3 billion in 1919 and averaged $5.7 billion during 12 The Farm Income Situation (Bureau of Agricultural Economics), December 1952 January 1953, Table i, p Banking and Monetary Statistics (Board of Governors of the Federal Reserve System, 1943), pp. 19 and Ibid., p Agricultural Outlook Charts, 1953 (Bureau of Agricultural Economics, Octoher 1952), p. 9.

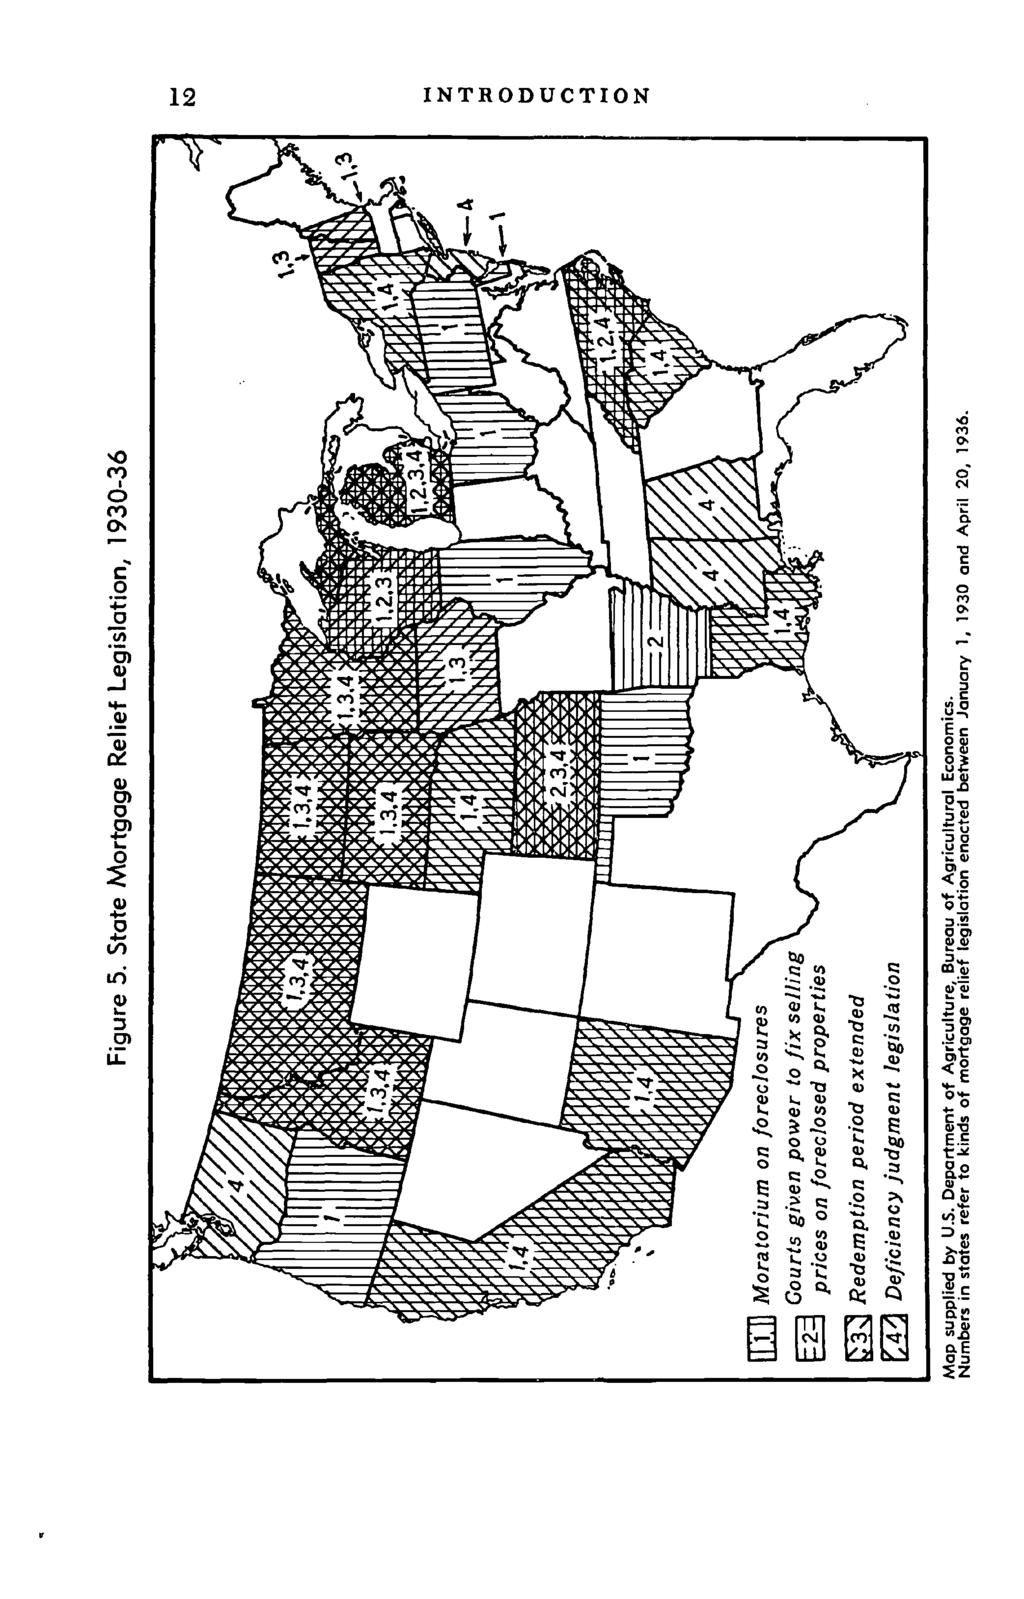
12 INTRODUCTION 11 the years , was estimated at only $1.9 billion for Farmers found it difficult or impossible to pay debts contracted at higher income levels. Many loans were foreclosed and many others were refinanced by federal agencies. For agriculture as a whole, foreclosures and assignments to creditors rose from 15.7 per thousand farms in 1929 to 38.8 per thousand in Thereafter the rate of distress transfers slowly declined, but remained throughout the thirties well above the low level existing before and during World War I, and did not subside that far until 1942 (Figure 2). In the early thirties economic conditions were so serious that several states passed laws that prohibited foreclosure, extended redemption periods, and eliminated deficiency judgments (Figure 5). Among the measures taken by the federal government were appropriation of additional funds for emergency crop and feed loans, establishment of regional agricultural credit corporations, bolstering the federal land banks with additional government capital, and the reorganization of the Federal Farm Loan System. Under the Farm Credit Act of 1933, direct government mortgage loans were provided for many farmers who did not qualify for regular federal land bank loans. Out of the troubled thirties developed a different economic and social philosophy involving more direct and comprehensive action by the federal government in combating deflation. In addition to the extensive pump priming expenditures there were devaluation of the dollar, new banking legislation, and revised tariff laws all devices intended to activate and strengthen the economy as a whole. For agriculture, the new legislation introduced acreage restrictions, marketing quotas, marketing agreements, price support loans, government purchases of commodities, parity payments, and the food stamp plan. These measures were intended to raise prices of farm products. There were also special programs aimed at improving the lot of the lower-income farmers and assisting tenants to become farm owners. In the last half of the decade realized net income of farm operators showed some improvement, averaging between $4 and $5 billion a year, more than doubling the low of billion in Nevertheless, it was below the to $6 billion level of the late twenties and substantially below the billion peak of The Farm Income Situation, December 1952_January 1953, Table i, p Ibid.
13
14 INTRODUCTION 13 World War 11 and the Early Postwar Years Agricultural prosperity increased rapidly during World War II. By i the level of agricultural prices was twice as high as that of 1940 (Table i). Agricultural production, stimulated by high prices and favorable weather, was at record volume. Production costs were increasing, but not so fast as farm prices. Realized net income of farm operators rose sharply and for 1945 totaled $12.3 billion, almost three times the 1940 amount.'8 Year TABLE 1 Index Numbers of Prices Received by Farmers, Prices Paid, Farm Production, and Realized Net Income of Farm Operators, = ioo) Prices received by farmers Prices paid by farmersa Farm production Realized net income of farm operators io b 231b b Based on Bureau of Agricultural Economics indexes. For prices received and paid by farmers, see Agricultural Outlook Charts, '95; (October 1952), page 9, and Agricultural Prices, December 1952, page 27. For farm production and realized net income, see The Farm Income Situation, July-September 1951, page and December 1952_January 1953, Tables i and ii, pages and i6. a Includes prices of commodities, interest, taxes, and wages. b Preliminary. After the end of the war in 1945, inflation continued in all segments of the economy. Agricultural prices continued to rise and the total realized net income of farm operators in the 18 Ibid.
15 14 INTRODUCTION United States reached an all-time high of $i6.8 billion in From then until the Korean outbreak the ratio of prices received by farmers to prices paid became less favorable, and net income of farm operators by 1949 had declined to $13.6 billion. Although agricultural prices increased during the last half of 1950, net income for the year declined further to $12.3 billion. Primarily as a result of increased defense activity, net income rose to $14.3 billion in 1951 and remained at that level for Naturally, the long period of wartime prosperity had a pronounced effect on the financial position of agriculture. The Balance Sheet of Agriculture, prepared by the Bureau of Agricultural Economics, valued total assets of agriculture as of January 1, 1952 at $168.7 billion, more than three times the comparable figure, $53.7 billion, for 1940 (Table 2). As of January 1953 farm assets have been tentatively estimated at about $165 billion. Much of the increase in the values of real TABLE 2 Balance Sheet of Agriculture, 1940 to 1953 (in billions> Assets Real estate $33.6 $6i.8 Livestock, equipment, $75.3 $93.7 crops Financial Total $53.7 $107.2 $136.7 $168.7 $165.4 Liabilities Real estate debt $6.6 $4.8 $5.6 $6.6 $7.1 Commodity Credit Corp., nonrecourse loans Other non-real-estate debt Proprietors' equities Total $53.7 $107.2 $136.7 $168.7 $165.4 From The Balance Sheet of Agriculture, 1953 (Bureau of Agricultural Economics, September 1953), page 2. Amounts are given as of January i. a Preliminary. b Includes deposits and currency, United States savings bonds, and investment in cooperatives.
16 INTRODUCTION 15 estate, livestock, and crops resulted from the wartime rise in market prices rather than from an increase in actual physical assets. Physical assets in machinery, however, increased substantially; even after adjustment for price changes, the total value of equipment in 1953 was more than double the 1940 figure. And, of course, the increase in financial assets from $5.0 to $21.9 billion reflected actual dollar additions to total assets. One outstanding feature of the war years, so far as the financial position of agriculture is concerned, has been the behavior of total farm mortgage debt in the United States. Credit was plentiful during and after World War II, with keen competition among lenders. Sales of farm land reached record volume, and there were signs of speculative activity in numerous resales following brief ownership. Farm real estate values rose steadily. By early 1946 the average value per acre was about 71 percent above the average for At the beginning of 1953 the average value was 154 percent above that of 1940 and 20 percent above the highest level of the World War I boom (Table 3 and Figure 2). Despite these developments, total farm mortgage debt declined from $6.6 billion as of January 1, 1940 to a low of $4.8 billion for 1946 (Table 4). Thereafter it increased to billion for This is in sharp contrast with developments during and after World War I, when farm mortgage debt increased steadily from billion in 1915 to a high of $io.8 billion in 1923 (Figure 4). Non-real-estate debt, however, reached a new high level after World War II. The volume of such debt owed to the principal lending institutions on January 1, 1953 was $4.2 billion, which compares with a previous record of billion in As would be expected, distress transfers of farms decreased steadily as the financial position of agriculture improved. During 1939 distress transfers occurred at a rate of 12.6 per thousand farms in the United States; during each of the years the rate was less than 2 per thousand farms (Figure 2). This is the lowest level for such transfers during the period for which estimates are available, which extends back to It contrasts sharply with the peak of 38.8 distress transfers per thousand farms reached in 1932 and a yearly average of about 17 per thousand farms during the two decades from 1920 to Agricultural Finance Review, Vol. 15, Supplement May ig5s, Table 23, p. 32.
17 16 INTRODUCTION TABLE 3 Index Numbers of Farm Real Estate Values per Acre, 1940, 1946, and 1953 ( = ioo) Region and Increase state The Northeast Maine % New Hampshire Vermont Massachusetts Rhode Island Connecticut 124 i New York New Jersey ii Pennsylvania Appalachian states Delaware 8g Maryland Virginia West Virginia North Carolina Kentucky Tennessee io Cotton Belt states South Carolina i8o Georgia Alabama Mississippi io Arkansas Louisiana ii8 Oklahoma Texas Florida Corn Belt states Ohio Indiana Illinois iso Iowa i Missouri i6i
18 INTRODUCTION 17 Region and Increase state Lake states Michigan 91 i % Wisconsin Minnesota Great Plains and Mountain states North Dakota i8i South Dakota ig8 Nebraska 58 g6 t6g 191 Kansas Montana 57 io Idaho 93 i Wyoming Colorado New Mexico Arizona Utah Nevada 65 ii Pacific Coast states Washington 7' 126 '35 90 Oregon California io United States From The Farm Real Estate Market (Bureau of Agricultural Economics), July 1953, pages 22 f.; data as of March i. Data for 1946 are from a September release by the BAE. Financial Position of Agriculture, 1953 While total farm debt had increased nearly ioo percent by early '953 from the low point reached in 1946, the amount of the debt was still less than 10 percent of the estimated value of total assets. As of January i, 1953 the financial assets of farmers (deposits and currency, United States savings bonds, and investment in cooperatives) were estimated at more than one and one-third times the total of farm debt, whereas in 1940 such
19 - 18 INTRODUCTION Region and state TABLE 4 Farm Mortgage Debt, 1946, and 1953, and Non-real-estate Debt, 1943 and 1953 (dollar figures in millions) Total farm mortgage debta Change b Non-real-estate debtc Change The Northeast Maine $24.8 $17., $22.6 $9.0 $ % New Hampshire 11.2 io io6 Vermont Massachusetts Rhode Island Connecticut New York New Jersey Pennsylvania Appalachian states Delaware 8.o 6.o i Virginia ig West Virginia 22.0 i8.o North Carolina Kentucky Tennessee Cotton Belt states South Carolina Georgia i.8 72 Alabama 8i.g 66.2 ioi Mississippi i.6 86 Arkansas o ii6.6 6i Louisiana Oklahoma io8.o Texas Florida Corn Belt states Ohio i8o Indiana Illinois Iowa Missouri i
20 INTRODUCTION 19 TABLE 4 (Concluded) Non-real-es- Region Total farm inortgage debta tate debtc and state Change 194o.53b Change b Lake states Michigan $174.3 $139.4 $ % $25.9 $ % Wisconsin Minnesota i Great Plains and Mountain states North Dakota South Dakota io6.o Nebraska i Kansas o Montana 66.i Idaho o Wyoming Colorado i6o New Mexico g.o Arizona Utah Nevada Pacific Coast states Washington Oregon California United States $6,586.4 $4,76o5 $7, % $1,672.5 $4, % Figures are given as of January 1. a Data for 1940 are from Harold T. Lingard's Farm-Mortgage Loans and Their Distribution by Lender Groups, (U.s. Department of Agriculture, Circular 812, August 1949), Table 30, page 49; data for 1946 and are from Agricultural Finance Review (Bureau of Agricultural Economics), Vol. 15, Supplement May 1953, pages 20 and 27. b Percentage changes were calculated before rounding debt figures to the nearest o.i million. c Non-real-estate debt includes that part held by banks and federal and federally sponsored agencies and excludes price support loans made or guaranteed by the Commodity Credit Corpora. tion. Data for 1943 were supplied by the Federal Deposit Insurance Corporation, the Farm Credit Administration, and the Farmers Home Administration; data for 1953 are from Agricult?.Lrat Finance Review, Vol. '5, Supplement May 1953, page 33. d Includes District of Columbia.

21 20 INTRODUCTION items had amounted to only one-half the farm debt (Table 2). Farm debt increased further during 1953 but continued low in relation to the amount of assets owned by farmers. Despite a relatively low total farm debt in the United States, however, substantial numbers of individual farmers are heavily indebted. In each year from March 1947 to March 1953 more than half of all farm sales involved credit financing.20 In these credit sales as a whole the debt has averaged more than half the purchase price, and in a fifth of them it has amounted to 75 percent or more of the purchase price. The average size of new farm mortgage loans recorded in 1952 was $5,630, which compares with $2,370 rn No doubt many of the recent loans have been for amounts exceeding the prewar value of the farm. Non-real-estate or short-term loans are another important part of the current farm debt picture. Such debt, excluding nonrecourse price support loans, increased from $2.9 to $7.6 billion between 1946 and '953 to exceed the total farm real estate debt (Table 2). In periods of declining farm income, short-term loans are often the first to be called and become a direct source of financial distress. If they cannot be repaid, they are likely to be refunded into long-term mortgages, as frequently happened in the early twenties. Accordingly, if farm incomes should decline in the years ahead, short-term debt might require considerable refunding and in that way it could swell the outstanding volume of long-term credit. As this is being written, in the fall of general economic activity remains high. But prices received by farmers for several important commodities have declined substantially from 1952 levels, and farm costs have decreased relatively little. Pricecost relationships are expected to continue less favorable in 1954, and the decline in agricultural prices currently is a subject of considerable concern to farm lenders. In some areas farmers are not repaying loans as quickly as expected and a few short-term loans have been refinanced with long-term farm mortgage loans. While the volume of actual debt distress is believed to be very small, the attitudes of both farmer and lender toward credit have become more cautious in recent months. 20 The Farm Real Estate Market (Bureau of Agricultural Economics), July 1951, p. 7, and July 1953, pp. 13 f. 21 Farm Mortgages Recorded, 1944 (Farm Credit Administration), Table jo, p. 14; and The Balance Sheet of Agriculture, 1953 (Bureau of Agricultural Eco-.nomics, Agr. ml. Bul. No. 115). p. 23.

22 INTRODUCTION 21 Scope of the Study The chapters that follow offer an analytical review of farm mortgage distress in the United States mainly during the interwar period. Extension of the analysis to earlier periods was virtually prohibited by the extreme sketchiness of the data prior to During World War II and the subsequent years there have been very few foreclosures or signs of farm financial distress. For that period the discussion will merely touch on the development of conditions that might lead to future distress. The introductory historical survey has dealt with trends of prices and farm prosperity mainly for agriculture as a whole. The over-all trends, of course, result from conditions in highly disparate segments of the farm economy. Farm incomes were far from uniformly depressed during the years In some parts of the country a combination of low prices for the principal products and crop failures due to bad weather or other production hazards created serious financial distress. Some other areas encountered comparatively little difficulty. And even within relatively small type-of-farming areas there were substantial variations in individual farm incomes and financial distress. Hereafter attention will be concentrated for the most part on these variations in farm mortgage distress both among geographical areas and among individual farms. Anyone familiar with agriculture is well aware that the factors associated with success and failure are many and varied. Some are based on the physical characteristics of a region and the economic characteristics of its principal products. Others are closely related to the individual farmer and his farm local soil conditions, size and organization of the farm business, extent of debt, and the capabilities of the farmer and his family. It has seemed desirable, therefore, from the standpoin.ts of both analysis and presentation to divide the book into two parts, the first entitled "The Economic Geography of Farm Mortgage Distress," and the second, "Farm Mortgage Distress and Individual Farm Organization." In Part I, which is concerned with geographical variations, the first task is to locate the conspicuous mortgage trouble spots of the interwar period as well as the principal areas where mortgage experience was substantially better than average. This is done mainly through maps showing state and county differences in the rate of distress transfers of farms and in the loan experi-
23 22 INTRODUCTION ence of land banks and insurance companies, with correlative information on land values, bank deposits, and other pertinent factors. Still more important than the location of the mortgage trouble spots is the identification of the basic economic and climatological factors that appear responsible. Most of Part I is devoted to analyzing causes of mortgage distress in such major farming areas as the Corn Belt, the Cotton Belt, and the Great Plains. Part II deals with variations among individual farm businesses within a single region or type-of-farming area and their relation to differences in debt carrying capacity and mortgage experience. Principal consideration is given to physical variations that affect farm productivity, and to financial variations in the organization of the farm business.
Kentucky , ,349 55,446 95,337 91,006 2,427 1, ,349, ,306,236 5,176,360 2,867,000 1,462
 TABLE B MEMBERSHIP AND BENEFIT OPERATIONS OF STATE-ADMINISTERED EMPLOYEE RETIREMENT SYSTEMS, LAST MONTH OF FISCAL YEAR: MARCH 2003 Beneficiaries receiving periodic benefit payments Periodic benefit payments
Union Members in New York and New Jersey 2018
 For Release: Friday, March 29, 2019 19-528-NEW NEW YORK NEW JERSEY INFORMATION OFFICE: New York City, N.Y. Technical information: (646) 264-3600 BLSinfoNY@bls.gov www.bls.gov/regions/new-york-new-jersey
Ability-to-Repay Statutes
 Ability-to-Repay Statutes FEDERAL ALABAMA ALASKA ARIZONA ARKANSAS CALIFORNIA STATUTE Truth in Lending, Regulation Z Consumer Credit Secure and Fair Enforcement for Bankers, Brokers, and Loan Originators
Nation s Uninsured Rate for Children Drops to Another Historic Low in 2016
 Nation s Rate for Children Drops to Another Historic Low in 2016 by Joan Alker and Olivia Pham The number of uninsured children nationwide dropped to another historic low in 2016 with approximately 250,000
State Corporate Income Tax Collections Decline Sharply
 Corporate Income Tax Collections Decline Sharply Nicholas W. Jenny and Donald J. Boyd The Rockefeller Institute Fiscal News: Vol. 1, No. 3 July 26, 2001 According to a report from the Congressional Budget
Income from U.S. Government Obligations
 Baird s ----------------------------------------------------------------------------------------------------------------------------- --------------- Enclosed is the 2017 Tax Form for your account with
State Individual Income Taxes: Personal Exemptions/Credits, 2011
 Individual Income Taxes: Personal Exemptions/s, 2011 Elderly Handicapped Blind Deaf Disabled FEDERAL Exemption $3,700 $7,400 $3,700 $7,400 $0 $3,700 $0 $0 $0 $0 Alabama Exemption $1,500 $3,000 $1,500 $3,000
Checkpoint Payroll Sources All Payroll Sources
 Checkpoint Payroll Sources All Payroll Sources Alabama Alaska Announcements Arizona Arkansas California Colorado Connecticut Source Foreign Account Tax Compliance Act ( FATCA ) Under Chapter 4 of the Code
Volume Title: Mortgage Lending Experience in Agriculture. Volume Author/Editor: Lawrence A. Jones and David Durand
 This PDF is a selection from an out-of-print volume from the National Bureau of Economic Research Volume Title: Mortgage Lending Experience in Agriculture Volume Author/Editor: Lawrence A. Jones and David
Q309 NATIONAL DELINQUENCY SURVEY FROM THE MORTGAGE BANKERS ASSOCIATION. Data as of September 30, 2009
 NATIONAL DELINQUENCY SURVEY FROM THE MORTGAGE BANKERS ASSOCIATION Q309 Data as of September 30, 2009 2009 Mortgage Bankers Association (MBA). All rights reserved, except as explicitly granted. Data are
Pay Frequency and Final Pay Provisions
 Pay Frequency and Final Pay Provisions State Pay Frequency Minimum Final Pay Resign Final Pay Terminated Alabama Bi-weekly or semi-monthly No Provision No Provision Alaska Semi-monthly or monthly Next
Annual Costs Cost of Care. Home Health Care
 2017 Cost of Care Home Health Care USA National $18,304 $47,934 $114,400 3% $18,304 $49,192 $125,748 3% Alaska $33,176 $59,488 $73,216 1% $36,608 $63,492 $73,216 2% Alabama $29,744 $38,553 $52,624 1% $29,744
MINIMUM WAGE WORKERS IN HAWAII 2013
 WEST INFORMATION OFFICE San Francisco, Calif. For release Wednesday, June 25, 2014 14-898-SAN Technical information: (415) 625-2282 BLSInfoSF@bls.gov www.bls.gov/ro9 Media contact: (415) 625-2270 MINIMUM
Q209 NATIONAL DELINQUENCY SURVEY FROM THE MORTGAGE BANKERS ASSOCIATION. Data as of June 30, 2009
 NATIONAL DELINQUENCY SURVEY FROM THE MORTGAGE BANKERS ASSOCIATION Q209 Data as of June 30, 2009 2009 Mortgage Bankers Association (MBA). All rights reserved, except as explicitly granted. Data are from
FAPRI Analysis of Dairy Policy Options for the 2002 Farm Bill Conference
 FAPRI Analysis of Dairy Policy Options for the 2002 Farm Bill Conference FAPRI-UMC Report #04-02 April 11, 2002 Food and Agricultural Policy Research Institute University of Missouri 101 South Fifth Street
The Costs and Benefits of Half a Loaf: The Economic Effects of Recent Regulation of Debit Card Interchange Fees. Robert J. Shapiro
 The Costs and Benefits of Half a Loaf: The Economic Effects of Recent Regulation of Debit Card Interchange Fees Robert J. Shapiro October 1, 2013 The Costs and Benefits of Half a Loaf: The Economic Effects
DATA AS OF SEPTEMBER 30, 2010
 NATIONAL DELINQUENCY SURVEY Q3 2010 DATA AS OF SEPTEMBER 30, 2010 2010 Mortgage Bankers Association (MBA). All rights reserved, except as explicitly granted. Data are from a proprietary paid subscription
Undocumented Immigrants are:
 Immigrants are: Current vs. Full Legal Status for All Immigrants Appendix 1: Detailed State and Local Tax Contributions of Total Immigrant Population Current vs. Full Legal Status for All Immigrants
Q Homeowner Confidence Survey Results. May 20, 2010
 Q1 2010 Homeowner Confidence Survey Results May 20, 2010 The Zillow Homeowner Confidence Survey is fielded quarterly to determine the confidence level of American homeowners when it comes to the value
EBRI Databook on Employee Benefits Chapter 6: Employment-Based Retirement Plan Participation
 EBRI Databook on Employee Benefits Chapter 6: Employment-Based Retirement Plan Participation UPDATED July 2014 This chapter looks at the percentage of American workers who work for an employer who sponsors
MINIMUM WAGE WORKERS IN TEXAS 2016
 For release: Thursday, May 4, 2017 17-488-DAL SOUTHWEST INFORMATION OFFICE: Dallas, Texas Contact Information: (972) 850-4800 BLSInfoDallas@bls.gov www.bls.gov/regions/southwest MINIMUM WAGE WORKERS IN
Overview of Sales Tax Exemptions for Agricultural Producers in the United States
 Overview of Sales Tax Exemptions for Agricultural Producers in the United States Dr. Wayne P. Miller Tyler R. Knapp November 2017 Draft Not for publication or quotation The University of Arkansas System
Federal Registry. NMLS Federal Registry Quarterly Report Quarter I
 Federal Registry NMLS Federal Registry Quarterly Report 2012 Quarter I Updated June 6, 2012 Conference of State Bank Supervisors 1129 20 th Street, NW, 9 th Floor Washington, D.C. 20036-4307 NMLS Federal
Providing Subprime Consumers with Access to Credit: Helpful or Harmful? James R. Barth Auburn University
 Providing Subprime Consumers with Access to Credit: Helpful or Harmful? James R. Barth Auburn University FICO Scores: Identifying Subprime Consumers Category FICO Score Range Super-prime 740 and Higher
Termination Final Pay Requirements
 State Involuntary Termination Voluntary Resignation Vacation Payout Requirement Alabama No specific regulations currently exist. No specific regulations currently exist. if the employer s policy provides
Residual Income Requirements
 Residual Income Requirements ytzhxrnmwlzh Ch. 4, 9-e: Item 44, Balance Available for Family Support (04/10/09) Enter the appropriate residual income amount from the following tables in the guideline box.
Sales Tax Return Filing Thresholds by State
 Thanks to R&M Consulting for assistance in putting this together Sales Tax Return Filing Thresholds by State State Alabama Alaska Arizona Arkansas California Colorado Connecticut Delaware Filing Thresholds
Impacts of Prepayment Penalties and Balloon Loans on Foreclosure Starts, in Selected States: Supplemental Tables
 THE UNIVERSITY NORTH CAROLINA at CHAPEL HILL T H E F R A N K H A W K I N S K E N A N I N S T I T U T E DR. MICHAEL A. STEGMAN, DIRECTOR T 919-962-8201 OF PRIVATE ENTERPRISE CENTER FOR COMMUNITY CAPITALISM
The Effect of the Federal Cigarette Tax Increase on State Revenue
 FISCAL April 2009 No. 166 FACT The Effect of the Federal Cigarette Tax Increase on State Revenue By Patrick Fleenor Today the federal cigarette tax will rise from 39 cents to $1.01 per pack. The proceeds
Volume URL: Chapter Title: Appendix D Tables On Consumer Debt. Chapter URL:
 This PDF is a selection from an out-of-print volume from the National Bureau of Economic Research Volume Title: The Pattern of Consumer Debt, 1935-36: A Statistical Analysis Volume Author/Editor: Blanche
Media Alert. First American CoreLogic Releases Q3 Negative Equity Data
 Contact Information Below Media Alert First American CoreLogic Releases Q3 Negative Equity Data First American CoreLogic, the first company to develop a national, state and city-level negative equity report,
ATHENE Performance Elite Series of Fixed Index Annuities
 Rates Effective August 8, 05 ATHE Performance Elite Series of Fixed Index Annuities State Availability Alabama Alaska Arizona Arkansas Product Montana Nebraska Nevada New Hampshire California PE New Jersey
AIG Benefit Solutions Producer Licensing and Appointment Requirements by State
 3600 Route 66, Mail Stop 4J, Neptune, NJ 07754 AIG Benefit Solutions Producer Licensing and Appointment Requirements by State As an industry leader in the group insurance benefits market, AIG is firmly
State Income Tax Tables
 ALABAMA 1 st $1,000... 2% Next 5,000... 4% Over 6,000... 5% ALASKA... 0% ARIZONA 1 1 st $10,000... 2.87% Next 15,000... 3.2% Next 25,000... 3.74% Next 100,000... 4.72% Over 150,000... 5.04% ARKANSAS 1
Mapping the geography of retirement savings
 of savings A comparative analysis of retirement savings data by state based on information gathered from over 60,000 individuals who have used the VoyaCompareMe online tool. Mapping the geography of retirement
MEDICAID BUY-IN PROGRAMS
 MEDICAID BUY-IN PROGRAMS Under federal law, states have the option of creating Medicaid buy-in programs that enable employed individuals with disabilities who make more than what is allowed under Section
BY THE NUMBERS 2016: Another Lackluster Year for State Tax Revenue
 BY THE NUMBERS 2016: Another Lackluster Year for State Tax Revenue Jim Malatras May 2017 Lucy Dadayan and Donald J. Boyd 2016: Another Lackluster Year for State Tax Revenue Lucy Dadayan and Donald J. Boyd
Federal Rates and Limits
 Federal s and Limits FICA Social Security (OASDI) Base $118,500 Medicare (HI) Base No Limit Social Security (OASDI) Percentage 6.20% Medicare (HI) Percentage Maximum Employee Social Security (OASDI) Withholding
The table below reflects state minimum wages in effect for 2014, as well as future increases. State Wage Tied to Federal Minimum Wage *
 State Minimum Wages The table below reflects state minimum wages in effect for 2014, as well as future increases. Summary: As of Jan. 1, 2014, 21 states and D.C. have minimum wages above the federal minimum
NOTICE TO MEMBERS CANADIAN DERIVATIVES CORPORATION CANADIENNE DE. Trading by U.S. Residents
 NOTICE TO MEMBERS CANADIAN DERIVATIVES CORPORATION CANADIENNE DE CLEARING CORPORATION COMPENSATION DE PRODUITS DÉRIVÉS NOTICE TO MEMBERS No. 2002-013 January 28, 2002 Trading by U.S. Residents This is
STATE REVENUE AND SPENDING IN GOOD TIMES AND BAD 5
 STATE REVENUE AND SPENDING IN GOOD TIMES AND BAD 5 Part 2 Revenue States claim that the most immediate cause of strife in state budgets is current and anticipated drops in revenue. No doubt, a drop in
FHA Manual Underwriting Exceeding 31% / 43% DTI Eligibility Quick Reference
 Credit Score/ Compensating Factor(s)* No Compensating Factor One Compensating Factor Two Compensating Factors No Discretionary Debt Maximum DTI 31% / 43% 37% / 47% 40% / 50% 40% / 40% *Acceptable compensating
CATTLEMEN S BEEF PROMOTION AND RESEARCH BOARD. Financial Statements. September 30, 2017 and (With Independent Auditors Report Thereon)
") Financial Statements (With Independent Auditors Report Thereon) CliftonLarsonAllen LLP CLAconnect.com INDEPENDENT AUDITORS REPORT Board of Directors Cattlemen's Beef Promotion and Research Board Centennial,
Financial Statements (With Independent Auditors Report Thereon) CliftonLarsonAllen LLP CLAconnect.com INDEPENDENT AUDITORS REPORT Board of Directors Cattlemen's Beef Promotion and Research Board Centennial,
Chapter D State and Local Governments
 Chapter D State and Local Governments State and Local Governments contains detailed information on the taxes, revenues, and expenditures of states and localities. The public finances of these two levels
State-Level Trends in Employer-Sponsored Health Insurance
 June 2011 State-Level Trends in Employer-Sponsored Health Insurance A STATE-BY-STATE ANALYSIS Executive Summary This report examines state-level trends in employer-sponsored insurance (ESI) and the factors
Motor Vehicle Sales/Use, Tax Reciprocity and Rate Chart-2005
 The following is a Motor Vehicle Sales/Use Tax Reciprocity and Rate Chart which you may find helpful in determining the Sales/Use Tax liability of your customers who either purchase vehicles outside of
STATE AND FEDERAL MINIMUM WAGES
 2017 STATE AND FEDERAL MINIMUM WAGES STATE AND FEDERAL MINIMUM WAGES The federal Fair Labor Standards Act (FLSA) establishes minimum wage and overtime requirements for most employers in the private sector
CAPITOL research. States Face Medicaid Match Loss After Recovery Act Expires. health
 CAPITOL research MAR health States Face Medicaid Match Loss After Expires Summary Medicaid, the largest health insurance program in the nation, is jointly financed by state and federal governments. The
EMPLOYMENT COST INDEX MARCH 2011
 Transmission of material in this release is embargoed until 8:30 a.m. (EDT) Friday, April 29, USDL-11-0586 Technical information: Media contact: (202) 691-6199 NCSinfo@bls.gov www.bls.gov/ect (202) 691-5902
CATTLEMEN S BEEF PROMOTION AND RESEARCH BOARD. Financial Statements. September 30, 2018 and (With Independent Auditors Report Thereon)
") Financial Statements (With Independent Auditors Report Thereon) CliftonLarsonAllen LLP CLAconnect.com INDEPENDENT AUDITORS REPORT Board of Directors Cattlemen's Beef Promotion and Research Board Centennial,
Financial Statements (With Independent Auditors Report Thereon) CliftonLarsonAllen LLP CLAconnect.com INDEPENDENT AUDITORS REPORT Board of Directors Cattlemen's Beef Promotion and Research Board Centennial,
Unionization Trends in Ohio and the U.S.
 February, 2011 Unionization Trends in Ohio and the U.S. Prepared by Felicia Bernardini, MPA,SPHR Maria L. Mone, JD, MPA The Ohio State University The John Glenn School of Public Affairs Management Development
Employer-Funded Individual Health Insurance
 Employer-Funded Individual Health Insurance ANNUAL REPORT 2016 1 EXECUTIVE SUMMARY This 2016 Annual Report is intended to provide a detailed, nationwide profile of how employers and employees are using
If the foreign survivor of the merger is on the record what do you require?
 Topic: Question by: : Foreign Mergers Tracy M. Sebranek Maine Date: December 17, 2013 Manitoba Corporations Canada Alabama Alaska Arizona We require only a certified copy of the merger documents, as long
CHAPTER 6. The Economic Contribution of Hospitals
 CHAPTER 6 The Economic Contribution of Hospitals Chart 6.1: National Health Expenditures as a Percentage of Gross Domestic Product and Breakdown of National Health Expenditures, 2014 U.S. GDP 2014 $3.03
TA X FACTS NORTHERN FUNDS 2O17
 TA X FACTS 2O17 Northern Funds Tax Facts provides specific information about your Northern Funds investment income and capital gain distributions for 2017. If you have any questions about how to apply
PAY STATEMENT REQUIREMENTS
 PAY MENT 2017 PAY MENT Alabama Alaska Arizona Arkansas California Colorado Connecticut Delaware District of Columbia Florida Georgia No generally applicable wage payment law for private employers. Rate
1I111~ 1I111~ 11111, 6 I""~ LA IIIII~ \\\\\1.8 ~ ~ _. W w!iii 122. "" W. ~ Ii IIIiiiI
 ~ -2.8 12.5 Ii IIIiiiI W w!iii 122. "" W ~ ~ 10112.0 u... 111_ IIIII~ \\\\\1.8 1I111~ 1I111~ 11111, 6 I""~.25 11111 LA 11111 1.6 MICROCOPY RESOLUT!ON TEST CHART.~"""'lIIIiIIIiiIillililillliliiiiiililiiiiii.r"
Aiming. Higher. Results from a Scorecard on State Health System Performance 2015 Edition. Douglas McCarthy, David C. Radley, and Susan L.
 Aiming Higher Results from a Scorecard on State Health System Performance Edition Douglas McCarthy, David C. Radley, and Susan L. Hayes December The COMMONWEALTH FUND overview On most of the indicators,
The 2017 CHP Salary Survey
 The 2017 CHP Salary Survey Gary Lauten, CHP, AAHP Niche Analyst Introduction The 2017 certified health physicist (CHP) survey data was collected by having CHPs submit their responses to survey questions
SECTION 109 HOST STATE LOAN-TO-DEPOSIT RATIOS. The Board of Governors of the Federal Reserve System, the Federal Deposit Insurance
 SECTION 109 HOST STATE LOAN-TO-DEPOSIT RATIOS The Board of Governors of the Federal Reserve System, the Federal Deposit Insurance Corporation, and the Office of the Comptroller of the Currency (the agencies)
Exhibit 57A. Approved Attorney Fees and Title Expenses
 Exhibit 57A Approved Attorney Fees and Title Expenses Written pre-approval from Freddie Mac is required before incurring any expense in excess of any of the below amounts. See Sections 9701.11 and 9701.15
Fingerprint, Biographical Affidavit and Third-Party Verification Reports Requirements
 Updates to the State Specific Information Fingerprint, Biographical Affidavit and Third-Party Verification Reports Requirements State Requirements For Licensure Requirements After Licensure (Non-Domestic)
HAC USDA RURAL DEVELOPMENT HOUSING ACTIVITY. Rural Research Report. Housing Assistance Council FISCAL YEAR 2017 YEAR-END REPORT
 USDA RURAL DEVELOPMENT HOUSING ACTIVITY FISCAL YEAR 217 YEAR-END REPORT HAC Rural Research Report Since the 195s. the United States Department of Agriculture has financed the construction, repair, and
Forecasting State and Local Government Spending: Model Re-estimation. January Equation
 Forecasting State and Local Government Spending: Model Re-estimation January 2015 Equation The REMI government spending estimation assumes that the state and local government demand is driven by the regional
Virginia Has Improved The Tax Treatment of Low-Income Families, And an EITC Modeled on The Federal EITC Would Go Further.
 Introduction 820 First Street, NE, Suite 510, Washington, DC 20002 Tel: 202-408-1080 Fax: 202-408-1056 center@cbpp.org http://www.cbpp.org Virginia Has Improved The Tax Treatment of Low-Income Families,
White Paper 2018 STATE AND FEDERAL MINIMUM WAGES
 White Paper STATE AND FEDERAL S White Paper STATE AND FEDERAL S The federal Fair Labor Standards Act (FLSA) establishes minimum wage and overtime requirements for most employers in the private sector and
# of Credit Unions As of March 31, 2011
 # of Credit Unions # of Credit Unins # of Credit Unions As of March 31, 2011 8,600 8,400 8,200 8,000 8,478 8,215 7,800 7,909 7,600 7,400 7,651 7,442 7,200 7,000 6,800 # of Credit Unions -Trend By Asset-Based
Minimum Wage Laws in the States - April 3, 2006
 1 of 15 Wage Laws in the States - April 3, 2006 Note: Where Federal and state law have different minimum wage rates, the higher standard applies. Wage and Overtime Standards Applicable to Nonsupervisory
Quarterly Banking Profile
 INSURED INSTITUTION PERFORMANCE Quarterly Net Income Rises to $43 Billion Higher Revenues, Lower Expenses Boost Earnings Loan Growth Remains Steady Only One Bank Fails in the Quarter Improving Earnings
Estimating the Number of People in Poverty for the Program Access Index: The American Community Survey vs. the Current Population Survey.
 Background Estimating the Number of People in Poverty for the Program Access Index: The American Community Survey vs. the Current Population Survey August 2006 The Program Access Index (PAI) is one of
Introduction... 1 Survey Methodology... 1 Industry Breakouts... 2 Organization Size Breakouts... 3 Geographic Breakouts
 Introduction... 1 Survey Methodology... 1 Industry Breakouts... 2 Organization Size Breakouts... 3 Geographic Breakouts... 3... 4... 8 148 282 414 536 662... 8 148 282 414 536 662... 8 148 282 414 536
Number of Pass-Through Businesses Tripled While Number of Corporations Declined
 September 2, 2013 No. 394 Fiscal Fact Individual Tax Rates Impact Business Activity Due to High Number of Pass-Throughs By Kyle Pomerleau Introduction Support for lowering the corporate tax rate now the
Understanding Oregon s Throwback Rule for Apportioning Corporate Income
 Understanding Oregon s Throwback Rule for Apportioning Corporate Income Senate Interim Committee on Finance and Revenue January 12, 2018 2 Apportioning Corporate Income Apportionment is a method of dividing
Essential Protection for Policyholders. State Rankings of Homeowners Insurance Protections: Consumer Remedies
 Essential Protection for Policyholders State Rankings of Homeowners Insurance Protections: Consumer Remedies A report from the Rutgers Center for Risk and Responsibility at Rutgers Law School in cooperation
kaiser medicaid and the uninsured commission on An Overview of Changes in the Federal Medical Assistance Percentages (FMAPs) for Medicaid July 2011
 for Medicaid July 2011") P O L I C Y B R I E F kaiser commission on medicaid and the uninsured July 2011 An Overview of Changes in the Federal Medical Assistance Percentages (FMAPs) for Medicaid Executive Summary Medicaid, which
P O L I C Y B R I E F kaiser commission on medicaid and the uninsured July 2011 An Overview of Changes in the Federal Medical Assistance Percentages (FMAPs) for Medicaid Executive Summary Medicaid, which
February 2018 QUARTERLY CONSUMER CREDIT TRENDS. Public Records
 February 2018 QUARTERLY CONSUMER CREDIT TRENDS Public Records p Jasper Clarkberg p Michelle Kambara This is part of a series of quarterly reports on consumer credit trends produced by the Consumer Financial
Commonfund Higher Education Price Index Update
 Commonfund Higher Education Price Index 2017 Update Table of Contents EXECUTIVE SUMMARY 1 INTRODUCTION: THE HIGHER EDUCATION PRICE INDEX 1 About HEPI 1 The HEPI Tables 2 HIGHER EDUCATION PRICE INDEX ANALYSIS
CLMS BRIEF 2 - Estimate of SUI Revenue, State-by-State
 CLMS BRIEF 2 - Estimate of SUI Revenue, State-by-State Estimating the Annual Amounts of Unemployment Insurance Tax Collections From Individual States for Financing Adult Basic Education/ Job Training Programs
Fingerprint and Biographical Affidavit Requirements
 Updates to the State-Specific Information Fingerprint and Biographical Affidavit Requirements State Requirements For Licensure Requirements After Licensure (Non-Domestic) Alabama NAIC biographical affidavit
Required Training Completion Date. Asset Protection Reciprocity
 Completion Alabama Alaska Arizona Arkansas California State Certification: must complete initial 16 hours (8 hrs of general LTC CE and 8 hrs of classroom-only CE specifically on the CA for LTC prior to
How Much Would a State Earned Income Tax Credit Cost in Fiscal Year 2018?
 820 First Street NE, Suite 510 Washington, DC 20002 Tel: 202-408-1080 Fax: 202-408-1056 center@cbpp.org www.cbpp.org Updated February 8, 2017 How Much Would a State Earned Income Tax Cost in Fiscal Year?
State Minimum Wage Chart (See below for Local/City Minimum Wage Chart)
") State Current Minimum Wage State Minimum Wage Chart (See below for Local/City Minimum Wage Chart) Maximum Tip Credit Allowed for Tipped Employees Federal $7.25 $5.12 $2.13 Minimum Cash Wage for Tipped
State Current Minimum Wage State Minimum Wage Chart (See below for Local/City Minimum Wage Chart) Maximum Tip Credit Allowed for Tipped Employees Federal $7.25 $5.12 $2.13 Minimum Cash Wage for Tipped
STATE BUDGET TROUBLES WORSEN By Elizabeth McNichol and Iris J. Lav
 820 First Street NE, Suite 510 Washington, DC 20002 Tel: 202-408-1080 Fax: 202-408-1056 center@cbpp.org www.cbpp.org Updated May 18, 2009 STATE BUDGET TROUBLES WORSEN By Elizabeth McNichol and Iris J.
DFA INVESTMENT DIMENSIONS GROUP INC. DIMENSIONAL INVESTMENT GROUP INC. Institutional Class Shares January 2018
 DFA INVESTMENT DIMENSIONS GROUP INC. DIMENSIONAL INVESTMENT GROUP INC. Institutional Class Shares January 2018 Supplementary Tax Information 2017 The following supplementary information may be useful in
JANUARY 30 DATA RELEASE WILL CAPTURE ONLY A PORTION OF THE JOBS CREATED OR SAVED BY THE RECOVERY ACT By Michael Leachman
 820 First Street NE, Suite 510 Washington, DC 20002 Tel: 202-408-1080 Fax: 202-408-1056 center@cbpp.org www.cbpp.org January 29, 2010 JANUARY 30 DATA RELEASE WILL CAPTURE ONLY A PORTION OF THE JOBS CREATED
SUMMARY ANALYSIS OF THE SENATE AGRICULTURE COMMITTEE NUTRITION TITLE By Dorothy Rosenbaum and Stacy Dean
 820 First Street NE, Suite 510 Washington, DC 20002 Tel: 202-408-1080 Fax: 202-408-1056 center@cbpp.org www.cbpp.org Revised November 2, 2007 SUMMARY ANALYSIS OF THE SENATE AGRICULTURE COMMITTEE NUTRITION
J.P. Morgan Funds 2018 Distribution Notice
 J.P. Morgan Funds 2018 Distribution Notice To assist you in preparing your 2018 Tax returns, we re pleased to provide this distribution notice for your J.P.Morgan Fund investment. If you are unclear about
THE STATE OF THE STATES IN DEVELOPMENTAL DISABILITIES
 THE STATE OF THE STATES IN DEVELOPMENTAL DISABILITIES Richard Hemp, Mary Kay Rizzolo, Shea Tanis, & David Braddock Universities of Colorado and Illinois-Chicago REINVENTING QUALITY CONFERENCE BALTIMORE,
Insurer Participation on ACA Marketplaces,
 November 2018 Issue Brief Insurer Participation on ACA Marketplaces, 2014-2019 Rachel Fehr, Cynthia Cox, Larry Levitt Since the Affordable Care Act health insurance marketplaces opened in 2014, there have
2014 STATE AND FEDERAL MINIMUM WAGES HR COMPLIANCE CENTER
 2014 STATE AND FEDERAL MINIMUM WAGES HR COMPLIANCE CENTER The federal Fair Labor Standards Act (FLSA), which applies to most employers, establishes minimum wage and overtime requirements for the private
Number of Estates Owing Federal Estate Taxes in 2006 and 2007 by State
 CTJ December 3, 2008 Citizens for Tax Justice Contact: Steve Wamhoff (202) 299-1066 x33 Latest State-by-State Data Show Why Obama Should Scale Back His Proposal to Cut the Federal Estate Tax New estate
Economic Impacts of Wait Times for Commercial Driver s Licenses Skills Tests
 Economic Impacts of Wait Times for Commercial Driver s Licenses Skills Tests Nam D. Pham, Ph.D. Mary Donovan January 2019 Economic Impact of Wait Times for Commercial Driver s Licenses Skills Tests Nam
What is your New Financing Statement Fee? What is your Amendment Fee (include termination fee if a different amount)?
?") Topic: UCC Filing Fee Information Question By: Tana Gormely Jurisdiction: Montana Date: 03 April 2012 Jurisdiction Alabama Alaska Arizona Arkansas California Question(s) What is your New Financing Statement
Topic: UCC Filing Fee Information Question By: Tana Gormely Jurisdiction: Montana Date: 03 April 2012 Jurisdiction Alabama Alaska Arizona Arkansas California Question(s) What is your New Financing Statement
Child Care Assistance Spending and Participation in 2016
 Policy solutions that work for low-income people Child Care Assistance Spending and Participation in 2016 i Background The Child Care and Development Block Grant (CCDBG) is the primary federal funding
Recourse for Employees Misclassified as Independent Contractors Department for Professional Employees, AFL-CIO
 Recourse for Employees Misclassified as Independent Contractors Department for Professional Employees, AFL-CIO State Relevant Agency Contact Information Online Resources Online Filing Alabama Department
STANDARD MANUALS EXEMPTIONS
 STANDARD MANUALS EXEMPTIONS The manual exemptions permits a security to be distributed in a particular state without being registered if the company issuing the security has a listing for that security
# of Credit Unions As of September 30, 2011
 # of Credit Unions # of Credit Unions # of Credit Unions As of September 30, 2011 8,400 8,200 8,000 7,800 7,600 7,400 7,200 8,332 8,065 7,794 7,556 7,325 7,000 6,800 9,000 8,000 7,000 6,000 5,000 4,000
Population in the U.S. Floodplains
 D ATA B R I E F D E C E M B E R 2 0 1 7 Population in the U.S. Floodplains Population in the U.S. Floodplains As sea levels rise due to climate change, planners and policymakers in flood-prone areas must
The Impact of Third-Party Debt Collection on the US National and State Economies in 2016
 The Impact of Third-Party Debt Collection on the US National and State Economies in 2016 Prepared for ACA International November 2017 The Impact of Third-Party Debt Collection on National and State Economies
Executive Summary. 204 N. First St., Suite C PO Box 7 Silverton, OR fax
 Executive Summary 204 N. First St., Suite C PO Box 7 Silverton, OR 97381 www.ocpp.org 503-873-1201 fax 503-873-1947 Growing Again: An Update on Oregon s Recovering Economy By Jeff Thompson February 26,