ARR/FTR Market Update: ATC Customer Meeting. August 20, 2009
|
|
|
- Jean Horton
- 5 years ago
- Views:
Transcription

1 ARR/FTR Market Update: ATC Customer Meeting August 20, 2009
2 Agenda ARR Allocation FTR Annual/Monthly Auction Challenge 2
3 Allocation Overview 101 Market Participants took part in the Annual ARR Allocation A total MWs were nominated over all eight cases in Stage 1 The total allocation was of MWs in Stage 1 82% of total nominated entitlements was allocated in Stage 1 Total Stage 2 allocation was MWs 3

4 2009 Seasonal Allocation Results Stages 1A + RES + 1B 4
5 Summary Overview 2009 Annual Allocation (Stage 1) Season Summer Fall Winter Spring Total TOU Off peak Peak Off peak Peak Off peak Peak Off peak Peak Stage 1 A Nominated Allocated Percent 65% 88% 83% 85% 90% 91% 81% 88% 84% Restoration Nominated Allocated Percent 94% 76% 60% 71% 70% 77% 90% 63% 78% Stage 1 B Nominated Allocated Percent 53% 48% 51% 38% 68% 65% 61% 66% 55% Total Nominated Allocated Percent 78% 78% 82% 76% 88% 86% 84% 86% 82% 5
6 ARR Restoration and Counter Flow Summary Season Summer Fall Winter Spring Total Period Off peak Peak Off peak Peak Off peak Peak Off peak Peak Restoration Nominated Allocated Percent 94% 76% 60% 71% 70% 77% 90% 63% 78% Counterflow Eligible Allocated Percent 25% 35% 19% 28% 10% 27% 20% 24% 40% 6

7 Registered NITS Peak by Allocation Period 7
8 Grandfathered Agreements (GFAs) Both Carve-Out and Option B GFA entitlements are fully nominated in Stage1A only Overall feasibility of GFA CO and OB was 86%, which is a 1% increase over 2008 allocation Compared to 2008, the 2009 registered Option B GFA entitlements increased while Carve-Out GFAs decreased 8
9 Expanded Congestion Cost Hedge (ECCH) Market Participants with load located in a Narrowly Constrained Area (NCA) served by resources external to the NCA may convert ARR Entitlements to ECCH Entitlements Available to restore full MW value of eligible CFTRs curtailed in the allocation process 5-yr transitional period ends in
10 Expanded Congestion Cost Hedge (ECCH) ECCH conversion requests in current allocation lower than levels in past allocations One Market Participant, one Path Up to 14 MWs total ECCH scheduling entitlements in each season and case MWs of ECCH treatment granted overall in 2009 (vs for 2008) 10

11 Stage 2 Allocation Stage 2 MWs are based on the difference between Stage 1 allocation amounts and Stage 1 nomination cap expressed as a percentage of Stage 2 Allocation across all Market Participants 11
12 Stage 2 Allocation Stage 2 dollar amounts are based on manual calculation. The Settlements system might calculate the residual slightly differently due to numerical adjustment Season TOU 2009 Stage 2 MWs Stage 2 Residual Dollars Summer Peak $ 17,742, Off Peak $ 14,506, Fall Peak $ 9,803, Off Peak $ 10,175, Winter Peak $ 4,333, Off Peak $ 5,505, Spring Peak $ 12,175, Off Peak $ 15,665, Total $ 89,910,
13 Infeasible ARRs Total sum of LTTRs was MWs Total Infeasible ARRs were MWs Of the total LTTRs, 3.8% were infeasible The uplift was covered by approximately 96% of Market Participants that were eligible for LTTRs Of the LTTR eligible MWs held by all Market Participants approximately 92% became LTTRs 13
14 Infeasible ARRs: Uplift Ratio Uplift associated with Infeasible ARRs across all seasons for 2009 ARR Allocation: Total Stage1A granted LTTRs: GW Total LTTR Payment: $165.9 M Total Infeasible Uplift: $13.7 M The ratio of total infeasible LTTR uplift costs over the total LTTR payments from Stage 1A: 8.30% 14
15 The Fundamentals Guiding Principles of the Midwest ISO FTR Markets Provides efficiently priced congestion hedges to Market Participants that serve load within the Midwest ISO region or otherwise transact through the Midwest ISO market Preserves incentives to participate in the security constrained economic dispatch Allows the region s transmission system to be efficiently priced and its value to be conveyed to the Midwest ISO transmission customers Provides incentives for efficient investments in new transmission capability 15
16 The Fundamentals FTR Auction The Midwest ISO s Intended Purpose FTR Auctions are established as a mechanism to: Provide FTR holders an opportunity to liquidate congestion hedge positions Provide LSEs (ARR holders), suppliers, marketers and traders, as well as any other market participant a means to purchases congestion hedges to manage market risks Provide a source of revenues that help to fund the full congestion costs to FTR holders 16
17 The Fundamentals FTR Auction - Objective The efficiency and value of the transmission system are conveyed to all Market Participants in FTR Auctions through Social Welfare maximization Buy Bids ( Bid Price *MW) ( Offer Price*MW) Cleared (buy) bid prices are higher or equal to the clearing price Cleared (sell) offer prices are lower or equal to the clearing price Subject to simultaneous feasibility with n-1 security MW limits on all monitored elements Sell Offers 17
18 The Fundamentals FTR Auction Summary ARRs/FTRs are financial instruments, not physical rights FTRs: Entitle Market Participants to stream of DA congestion revenues for hedging or non-hedging purposes ARRs: Entitle the firm historical transmission users to a share of the revenue in annual FTR auction or charges FTR Auctions are established as a social welfare maximization mechanism to provide efficiently priced congestion hedges to market participants 18
19 The Midwest ISO FTR Auction Statistics and Observations Participation Bids/Offers (counts, awarded MWs) Prices ($/MWh) for bids and offers ARR value and funding Liquidity indices Social welfare The Midwest ISO FTR Auction evolution 19
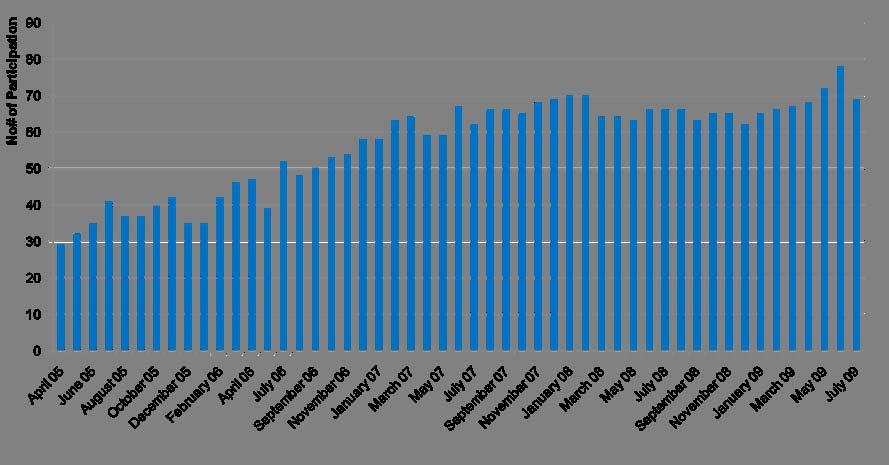
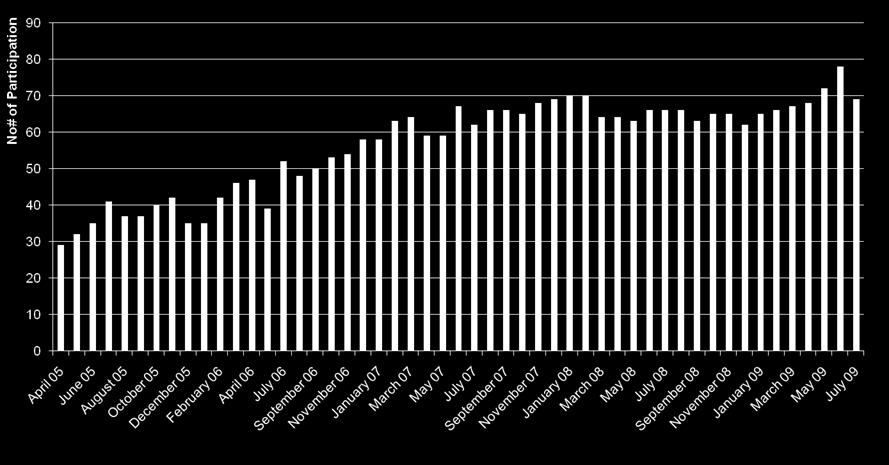
20 Participation in Monthly Apr 05 - July 09 20
21 Participation in Annual Fall 05 - Spring 10 21
22 Bid/Offer Counts Monthly (Apr 05 - July 09) 22
23 Bid/Offer/Self-Schedule Counts Annual (Fall 05 - Spring 10) 23
24 Observations Participation and Trading Counts Participation and trading counts in both annual and monthly auctions has demonstrated a steady growth and sustenance since market started in
25 Bid/Offer Award Monthly Auction (Apr 05 - July 09) 25
26 Bid/Offer/Self-schedule Award Annual Auction (Fall 05 - Spring 10) 26
27 Observations Awarded Trades Awarded trades in the monthly FTR auctions experienced steady growth since market start in April 2005 Possible drivers resulting in low volume of awarded trades in some periods: In general, less awarded trades in summer season monthly auctions observed, but not the submitted trades, indicating less transmission capacity since they are close to annual auctions Months in Sum 06-Win06: Introduction of tier 5 FTR allocation in allocation period for short term network resources 27
28 Observations Awarded Trades (cont d) The volume of annual trades awarded (bids/offers) increased steadily at the rate of 80 GW per annual from to allocation period Diminishing of Self-Schedule: The volume of selfschedule in annual decreased roughly by 20% from allocation period to allocation period, whereas, the volume of buy bids increased by 22% 28
29 Self-schedule and net ARRs Annual Auction (Y Y2009) 29
30 Observations ARR Value, Funding and Prices ARRs were 100% revenue adequate during the and the allocation periods ARR holders received credits valued at $175 million (with self-schedule ARRs) during the allocation period, with an average ARRs credit of $0.37/MWh, compared to $363 million in total and $0.71/MWh in the allocation period ARR holders received net credits valued at $47 million during the allocation period, with an average ARRs credit of $0.33/MWh, compared to $12 million in total and $0.11/MWh in the allocation period 30
31 Indices Notations Max/Sum: The ratio of maximum index among all market participants over the sum of indices from all market participants ROI: Return on Investment - the ratio of profit relative to the FTR premium 31


32 Indices Total Collateral 32
33 Indices Collateral (Max/Sum) 33
34 Observations Collateral Index Total Collateral has demonstrated a steady growth and sustenance since market started in 2005 * A trend of decrease in collateral index has been observed * Three-round annual auction was implemented at first time in FTR Annual Auction. 34
35 Indices ROI 35
36 Observation ROI The graph in the previous slide demonstrates the changes of Simple Return and Excess Return over time The averages of Simple Return and Excess Return during the year 2007 were 13.54% and 13.17%, during the first eleven months of 2008 were 11.26% and 11.14%, and during the entire study period of January 2007 to November 2008 were 12.45% and 12.2% These numbers suggest to some extent the stability and maturity of the FTR monthly auction market Note: Refer to the detailed the Midwest ISO document on FTR profitability located at 7c940a48324a 36
37 Summary The FTR auctions in the Midwest ISO is serving the intended purpose by: Attracting market participation Promoting maximum value of public good Encouraging competition and demonstrating market liquidity Demonstrating stakeholder confidence in terms of investing and expanding FTR products Allowing market valuation of FTRs that is consistent with the most efficient user of such financial instruments 37
38 Challenges The Midwest ISO is continuously challenged with the funding levels (congestion rent payments) of the FTR market The FTR funding volatility in the Midwest ISO is due to the unpredictable and non-chronic nature of the congestion This means that the primary drivers of congestion tend to be transmission outages and loop flow increases due to regional weather patterns EUCI 2009 Conference on FTRs: Where are we now? 38 38
39 FTR Funding EUCI 2009 Conference on FTRs: Where are we now? % 90.0% 80.0% 70.0% 60.0% 50.0% 40.0% 30.0% 20.0% 10.0% 0.0% Millions Dec-05 Jan-06 Feb-06 Mar-06 Apr-06 May-06 Jun-06 Jul-06 Aug-06 Sep-06 Oct-06 Nov-06 Dec-06 Jan-07 Feb-07 Mar-07 Apr-07 May-07 Jun-07 Jul-07 Aug-07 Sep-07 Oct-07 Nov-07 Dec-07 Jan-08 Feb-08 Mar-08 Apr-08 May-08 Jun-08 Jul-08 Aug-08 Sep-08 Oct-08 Nov-08 Dec-08 Jan-09 Feb-09 Mar-09 Apr-09 May-09 Jun-09 Jul-09 FTR Target HR + MF Monthly FTR %
ARRs and FTRs MISO Training
 MISO Training Level 200 Auction Revenue Rights and Financial Transmission Rights Last material update: 07/09/2015 Course Content and Disclaimer 2 Course Description 1 2 3 4 This is a Level 200 overview
FTR Alignment. Joint Stakeholder Meeting June 6, 2008
 FTR Alignment Joint Stakeholder Meeting June 6, 2008 Introduction Joint Common Market Initiative As part of the of the Midwest ISO and PJM Joint and Common Market (JCM) process, the Midwest ISO stakeholders
FTR Credit Requirements Mark-to-Auction (MTA)
") FTR Credit Requirements Mark-to-Auction (MTA) Bridgid Cummings Credit Market Implementation Committee November 7, 2018 FTR Mark-to-Auction Market value decline can be an indicator of increasing FTR risk
FTR Credit Requirements Mark-to-Auction (MTA) Bridgid Cummings Credit Market Implementation Committee November 7, 2018 FTR Mark-to-Auction Market value decline can be an indicator of increasing FTR risk
REPORT TO THE PUBLIC UTILITIES BOARD
 REPORT TO THE PUBLIC UTILITIES BOARD CURTAILABLE RATE PROGRAM APRIL 1, 2011 MARCH 31, 2012 JULY 2012 TABLE OF CONTENTS Page No. SUMMARY... 1 BACKGROUND... 1 PERFORMANCE FOR 2011/12... 3 Curtailment Options...3
LSE Perspective on FTR and ARR Surplus Funds. Jeff Whitehead Direct Energy
 LSE Perspective on FTR and ARR Surplus Funds Jeff Whitehead Direct Energy Congestion Revenue Entitlement Transmission Customers paid and continue to pay the embedded cost of the transmission system Transmission
2011 Budget Initial Stakeholder Call
 2011 Budget Initial Stakeholder Call Michael Epstein Director of Financial Planning June 23, 2010 Agenda TOPIC PRESENTER Introduction Steve Berberich Budget principles & strategic initiatives Steve Berberich
ATLANTIC CITY ELECTRIC COMPANY BPU NJ
 Attachment 1 Attachment 1 Page 1 of 3 ATLANTIC CITY ELECTRIC COMPANY BPU NJ No. 11 Electric Service - Section IV Revised Sheet Replaces Revised Sheet No. 60 RIDER (BGS) Basic Generation Service (BGS) Basic
WHITE PAPER. Financial Transmission Rights (FTR)/ Congestion Revenue Rights (CRR) Analysis Get ahead with ABB Ability PROMOD
/ Congestion Revenue Rights (CRR) Analysis Get ahead with ABB Ability PROMOD") WHITE PAPER Financial Transmission Rights (FTR)/ Congestion Revenue Rights (CRR) Analysis Get ahead with ABB Ability PROMOD 2 W H I T E PA P E R F T R / C R R A N A LY S I S Market participants and system
WHITE PAPER Financial Transmission Rights (FTR)/ Congestion Revenue Rights (CRR) Analysis Get ahead with ABB Ability PROMOD 2 W H I T E PA P E R F T R / C R R A N A LY S I S Market participants and system
ITC Midwest 2014 Attachment O True-Up Presentation. Presenter: David Grover Manager, Transmission Pricing July 8, 2015
 2014 Attachment O True-Up Presentation Presenter: David Grover Manager, Transmission Pricing July 8, 2015 Presentation Purpose Discuss the 2014 Annual True-Up posting Walk through the timeline and mechanics
Historical Pricing PJM COMED, Around the Clock. Cal '15 Cal '16 Cal '17 Cal '18 Cal '19 Cal '20 Cal '21 Cal '22
 $50 Historical Pricing PJM COMED, Around the Clock $48 $46 $44 $42 $40 $38 $36 $34 $32 $30 $28 $26 Cal '15 Cal '16 Cal '17 Cal '18 Cal '19 Cal '20 Cal '21 Cal '22 The information presented above was gathered
Long Term FTR Market Education
 Long Term FTR Market Education February 7, 2018 Jointly developed and supported by Exelon, DC Energy, and Vitol Agenda Forward Markets Commercial Usage of Long Term FTRs Indications of a Healthy Long Term
Balance-of-Period TCC Auction
 Balance-of-Period TCC Auction Proposed Credit Policy Sheri Prevratil Manager, Corporate Credit New York Independent System Operator Credit Policy Working Group May 29, 2015 2000-2015 New York Independent
Transmission Congestion Contacts
 Transmission Congestion Contacts Horace Horton Senior Market Trainer, Market Training, NYISO New York Market Orientation Course (NYMOC) March 20-23, 2018 Rensselaer, NY 12144 1 Transmission Congestion
Historical Pricing PJM PSEG, Around the Clock. Cal '15 Cal '16 Cal '17 Cal '18 Cal '19 Cal '20 Cal '21 Cal '22
 $70 Historical Pricing PJM PSEG, Around the Clock $65 $60 $55 $50 $45 $40 $35 $30 $25 Cal '15 Cal '16 Cal '17 Cal '18 Cal '19 Cal '20 Cal '21 Cal '22 The information presented above was gathered and compiled
PJM FTR Center Users Guide
 PJM 2016 FTR Center Users Guide Disclaimer The PJM FTR Center Users Guide is intended to provide Market Participants and other interested parties with introductory information about the bidding and administrative
Memorandum. This memorandum does not require Board action. EXECUTIVE SUMMARY
 California Independent System Operator Corporation Memorandum To: ISO Board of Governors From: Eric Hildebrandt, Executive Director, Market Monitoring Date: November 7, 2018 Re: Department of Market Monitoring
FTRs and Congestion. August 27, 2014
 FTRs and Congestion FTRSTF August 27, 2014 Howard Haas Congestion Discussion Total congestion is total congestion related charges minus total congestion related credits. Total Congestion = Total Day Ahead
Financial Transmission and Auction Revenue Rights
 Section 13 FTRs and ARRs Financial Transmission and Auction Revenue Rights In an LMP market, the lowest cost generation is dispatched to meet the load, subject to the ability of the transmission system
Installed Capacity (ICAP) Market
 Market") Installed Capacity (ICAP) Market Amanda Carney Associate Market Design Specialist, Capacity Market Design, NYISO New York Market Orientation Course (NYMOC) October 16-19, 2018 Rensselaer, NY 1 ICAP Market
Installed Capacity (ICAP) Market Amanda Carney Associate Market Design Specialist, Capacity Market Design, NYISO New York Market Orientation Course (NYMOC) October 16-19, 2018 Rensselaer, NY 1 ICAP Market
Financial Transmission Rights (FTRs), Auction Revenue Rights (ARRs) & Qualified Upgrade Awards (QUAs)
, Auction Revenue Rights (ARRs) & Qualified Upgrade Awards (QUAs)") Financial Transmission Rights (FTRs), Auction Revenue Rights (ARRs) & Qualified Upgrade Awards (QUAs) John Lally, Senior Engineer Market Administration Agenda FTR Basics FTR Auction FTR Settlement ARRs
Financial Transmission Rights (FTRs), Auction Revenue Rights (ARRs) & Qualified Upgrade Awards (QUAs) John Lally, Senior Engineer Market Administration Agenda FTR Basics FTR Auction FTR Settlement ARRs
California ISO October 1, 2002 Market Design Elements
 California October 1, 2002 Market Design Elements California Board of Governors Meeting April 25, 2002 Presented by Keith Casey Manager of Market Analysis and Mitigation Department of Market Analysis 1
Financial Transmission and Auction Revenue Rights
 Section 13 FTRs and ARRs Financial Transmission and Auction Revenue Rights In an LMP market, the lowest cost generation is dispatched to meet the load, subject to the ability of the transmission system
Financial Transmission and Auction Revenue Rights
 Section 13 FTRs and ARRs Financial Transmission and Auction Revenue Rights In an LMP market, the lowest cost generation is dispatched to meet the load, subject to the ability of the transmission system
NEAS ENERGY - Route to Market
 NEAS ENERGY - Route to Market Overview Wholesale Power Market developments Revenue Profiles Secured and Unsecured FIT CFD v ROC PPA Key terms and conditions PPA Backstop PPA Cash flows for CfD and ROC
Market Settlements - Advanced
 Market Settlements - Advanced FTR/ARR Module PJM State & Member Training Dept. PJM 2017 Agenda FTR/ARR Hedging Congestion FTR and ARR Billing Examples PJM 2017 2 Hedging Transmission Congestion PJM 2017
Financial Transmission and Auction Revenue Rights
 Section 13 FTRs and ARRs Financial Transmission and Auction Revenue Rights In an LMP market, the lowest cost generation is dispatched to meet the load, subject to the ability of the transmission system
Department of Market Monitoring White Paper. Potential Impacts of Lower Bid Price Floor and Contracts on Dispatch Flexibility from PIRP Resources
 Department of Market Monitoring White Paper Potential Impacts of Lower Bid Price Floor and Contracts on Dispatch Flexibility from PIRP Resources Revised: November 21, 2011 Table of Contents 1 Executive
Financial Transmission and Auction Revenue Rights
 Section 13 FTRs and ARRs Financial Transmission and Auction Revenue Rights In an LMP market, the lowest cost generation is dispatched to meet the load, subject to the ability of the transmission system
Technical Conference. August 3, 2009
 Technical Conference August 3, 2009 1 2 Agenda Welcome Background and Overview Considerations for Participation by Third- Party Sellers Survey Results Next Steps 3 Background and Overview 4 Background
MISO PJM IPSAC. August 26, PJM IPSAC Meeting, August 26,
 MISO PJM IPSAC August 26, 2016 1 Agenda 2 Targeted Market Efficiency Project (TMEP) Study TMEP Proposed JOA Language FERC EL13-88 Filings IPSAC Work Schedule 2 3 Targeted Market Efficiency Project Study
MARKET PARTICIPANT GUIDE: SPP 2016 CONGESTION HEDGING
 MARKET PARTICIPANT GUIDE: SPP 2016 CONGESTION HEDGING Published: December 16, 2015 By: Congestion Hedging Team; TCR Markets REVISION HISTORY VERSION NUMBER AUTHOR CHANGE DESCRIPTION COMMENTS 1.0 Congestion
CRR Prices and Pay Outs: Are CRR Auctions Valuing CRRs as Hedges or as Risky Financial instruments?
 CRR Prices and Pay Outs: Are CRR Auctions Valuing CRRs as Hedges or as Risky Financial instruments? Scott Harvey Member: California ISO Market Surveillance Committee Market Surveillance Committee Meeting
DECEMBER KPI REPORT. Service Provider SLA Performance Core and Non-Core Settlement Systems Core and Non-Core BSC Systems. Supplier Performance
 1.% 99.5% 99.% 98.5% 98.% 97.5% 97.% Core and Non-Core Settlement Systems Core and Non-Core BSC Systems In December, Core Settlement was affected by Service Desk metrics of less than 1%. Please see below
XML Publisher Balance Sheet Vision Operations (USA) Feb-02
 Feb-02") Page:1 Apr-01 May-01 Jun-01 Jul-01 ASSETS Current Assets Cash and Short Term Investments 15,862,304 51,998,607 9,198,226 Accounts Receivable - Net of Allowance 2,560,786
Page:1 Apr-01 May-01 Jun-01 Jul-01 ASSETS Current Assets Cash and Short Term Investments 15,862,304 51,998,607 9,198,226 Accounts Receivable - Net of Allowance 2,560,786
D. RSCP SUPPLIER PAYMENTS AND CUSTOMER RATES
 32 RSCP SUPPLIER PAYMENTS AND CUSTOMER RATES D. RSCP SUPPLIER PAYMENTS AND CUSTOMER RATES This summary is provided for bidder convenience only. Any statements herein describing BGS- RSCP rates or supplier
Operating Reserves Educational Session Part B
 Operating Reserves Educational Session Part B Energy Market Uplift Senior Task Force September 17, 2013 Joseph Bowring Joel Romero Luna Operating Reserves Operating reserves can be grouped into five categories:
TABLE OF CONTENTS. Executive Summary... ES-1 1. Market Structure and Design Changes General Market Conditions
 TABLE OF CONTENTS Executive Summary... ES-1 1. Market Structure and Design Changes... 1-1 1.1 Introduction/Background...1-1 1.2 Market Design Changes...1-1 1.2.1 Real Time Market Application (RTMA)...1-1
2003 Annual Report on Market Issues and Performance
 2003 Annual Report on Market Issues and Performance Board of Governors Meeting April 22, 2004 Greg Cook Manager of Market Monitoring Issues in 2003-04 CALIFORNIA ISO and FERC: Continue to work through
SmallBizU WORKSHEET 1: REQUIRED START-UP FUNDS. Online elearning Classroom. Item Required Amount ($) Fixed Assets. 1 -Buildings $ 2 -Land $
 Fixed Assets. 1 -Buildings $ 2 -Land $") WORKSHEET 1: REQUIRED START-UP FUNDS Item Required Amount () Fixed Assets 1 -Buildings 2 -Land 3 -Initial Inventory 4 -Equipment 5 -Furniture and Fixtures 6 -Vehicles 7 Total Fixed Assets Working Capital
WORKSHEET 1: REQUIRED START-UP FUNDS Item Required Amount () Fixed Assets 1 -Buildings 2 -Land 3 -Initial Inventory 4 -Equipment 5 -Furniture and Fixtures 6 -Vehicles 7 Total Fixed Assets Working Capital
Financial Transmission and Auction Revenue Rights
 Section 13 FTRs and ARRs Financial Transmission and Auction Revenue Rights In an LMP market, the lowest cost generation is dispatched to meet the load, subject to the ability of the transmission system
CRR Auction Analysis Report
 Report November 21, 2017 Prepared by: MQRI California Independent System Operator The following ISO staff contributed to this report: Danielle Tavel Abhishek Hundiwale Jie Duan Nongchao Guo Jim McClain
MRTU. CRR Settlements. CRR Educational Class #10
 MRTU CRR Settlements CRR Educational Class #10 Contents Why is CRR Settlements process important to understand Definition of LMP and CRR Types of CRRs: Obligation vs Option Point to Point and Multi Point
Spheria Australian Smaller Companies Fund
 29-Jun-18 $ 2.7686 $ 2.7603 $ 2.7520 28-Jun-18 $ 2.7764 $ 2.7681 $ 2.7598 27-Jun-18 $ 2.7804 $ 2.7721 $ 2.7638 26-Jun-18 $ 2.7857 $ 2.7774 $ 2.7690 25-Jun-18 $ 2.7931 $ 2.7848 $ 2.7764 22-Jun-18 $ 2.7771
EIM market monitoring and market issues/performance
 EIM market monitoring and market issues/performance Energy Imbalance Market Regional Issues Forum April 6, 2016 Eric Hildebrandt, Director Department of Market Monitoring EIM Market Monitoring Page 2 Mission
QUESTION 2. QUESTION 3 Which one of the following is most indicative of a flexible short-term financial policy?
 QUESTION 1 Compute the cash cycle based on the following information: Average Collection Period = 47 Accounts Payable Period = 40 Average Age of Inventory = 55 QUESTION 2 Jan 41,700 July 39,182 Feb 18,921
Power Accountants Association Annual Meeting Potential Impacts from Oct 2015 Rate Change
 Power Accountants Association Annual Meeting Potential Impacts from Oct 2015 Rate Change Material Provided by: Chris Mitchell Chris Mitchell Management Consultants (CMMC) mail@chrismitchellmc.com 5/14/2015
QUARTERLY FINANCIAL REPORT June 30, 2017
 California Independent System Operator QUARTERLY FINANCIAL REPORT June 30, 2017 250 Outcropping Way Folsom, CA 95630 (916) 351-4000 CALIFORNIA INDEPENDENT SYSTEM OPERATOR CORPORATION QUARTERLY FINANCIAL
Potential FTR Liquidation Process Alternatives
 Items in red font on slides 5 10 reflect information updated or added since the August 10 th MRC Special Session. Potential FTR Liquidation Process Alternatives Suzanne Daugherty Markets and Reliability
Performance Report October 2018
 Structured Investments Indicative Report October 2018 This report illustrates the indicative performance of all Structured Investment Strategies from inception to 31 October 2018 Matured Investment Strategies
CRR Conference Call Meeting Minutes June 20, 2018
 CRR Conference Call Meeting Minutes June 20, 2018 The California Independent System Operator hosts a bi-weekly Congestion Revenue Rights (CRR) conference call on Wednesdays at 11AM. This is an opportunity
SHARETHIS FINANCE STUDY
 SHARETHIS FINANCE STUDY EVERY MONTH, 32 MILLION USERS GENERATE 68 MILLION SOCIAL ACTIONS RELATED TO FINANCE. 32 Million Finance Sharers SHARETHIS SOCIAL INTELLIGENCE PLATFORM 53 Billion Webpage Views 3.1
The Australian national electricity market
 The Australian national electricity market Are you managing your risks? AusIMM Technical presentation John Bartlett and Patrick Booth 26 April 2017 john.bartlett@energetics.com.au and patrick.booth@energetics.com.au
HUD NSP-1 Reporting Apr 2010 Grantee Report - New Mexico State Program
 HUD NSP-1 Reporting Apr 2010 Grantee Report - State Program State Program NSP-1 Grant Amount is $19,600,000 $9,355,381 (47.7%) has been committed $4,010,874 (20.5%) has been expended Grant Number HUD Region
Standard Market Design
 Standard Market Design Dynegy s Perspective Characteristics of the Standard Market Design - SMD RTO provides all transmission service and takes on many if not all control area functions. RTO operates an
Electric Avoided Cost Meeting. 1:30-3:30 p.m. May 12, 2017
 Electric Avoided Cost Meeting 1:30-3:30 p.m. May 12, 2017 Agenda Introduction OPUC Energy Trust Schedule for updates Overview of Process to Update Avoided Costs Proposed Updates for 2017 Possible Future
5.2 Transmission Congestion Credit Calculation Eligibility.
 5.2 Transmission Congestion Credit Calculation. 5.2.1 Eligibility. (a) Except as provided in Section 5.2.1(b), each FTR Holder shall receive as a Transmission Congestion Credit a proportional share of
Informational Filing of Midwest Independent Transmission System Operator, Inc. s Independent Market Monitor
 Potomac Economics, Ltd. 9990 Fairfax Boulevard, Suite 560 Telephone: 703-383-0720 Fairfax, Virginia 22030 Facsimile: 703-383-0796 Honorable Kimberly D. Bose, Secretary Federal Energy Regulatory Commission
This report summarizes key market conditions, developments, and trends for November 2001.
 California Independent System Operator Memorandum To: ISO Board of Governors From: Anjali Sheffrin, Director of Market Analysis CC: ISO Officers, ISO Board Assistants Date: February 1, 22 Re: Market Analysis
Large Commercial Rate Simplification
 Large Commercial Rate Simplification Presented to: Key Account Luncheon Red Lion Hotel Presented by: Mark Haddad Assistant Director/CFO October 19, 2017 Most Important Information First There is no rate
Integrated Marketplace: TCR Bid Activity
 The information, practices, processes and procedures outlined and contained in this publication are the intellectual property of Southwest Power Pool, Inc. ( SPP ) and are protected by law. SPP provides
2019 Integrated Resource Plan (IRP) Public Input Meeting January 24, 2019
 Public Input Meeting January 24, 2019") 1 2019 Integrated Resource Plan (IRP) Public Input Meeting January 24, 2019 Agenda January 24 9:00am-9:30am pacific Capacity-Contribution Values for Energy-Limited Resources 9:30am-11:30am pacific Coal
1 2019 Integrated Resource Plan (IRP) Public Input Meeting January 24, 2019 Agenda January 24 9:00am-9:30am pacific Capacity-Contribution Values for Energy-Limited Resources 9:30am-11:30am pacific Coal
California ISO. Q Report on Market Issues and Performance. August 22, Prepared by: Department of Market Monitoring
 California Independent System Operator Corporation California ISO Q2 2016 Report on Market Issues and Performance August 22, 2016 Prepared by: Department of Market Monitoring TABLE OF CONTENTS Executive
ICAP Demand Curve. Zachary T. Smith Supervisor, ICAP Market Operations, NYISO. Intermediate ICAP Course. November 7-8, 2017 Rensselaer, NY 12144
 ICAP Demand Curve Zachary T. Smith Supervisor, ICAP Market Operations, NYISO Intermediate ICAP Course November 7-8, 2017 Rensselaer, NY 12144 1 Objectives Upon the completion of this module, trainees should
Price Inconsistency Market Enhancements. Revised Straw Proposal
 Price Inconsistency Market Enhancements Revised Straw Proposal August 2, 2012 Price Inconsistency Market Enhancements Table of Contents 1 Introduction... 3 2 Plan for Stakeholder Engagement... 3 3 Background...
QUARTERLY FINANCIAL REPORT December 31, 2017
 California Independent System Operator QUARTERLY FINANCIAL REPORT December 31, 2017 Preliminary and Unaudited 250 Outcropping Way Folsom, CA 95630 (916) 351-4000 CALIFORNIA INDEPENDENT SYSTEM OPERATOR
2019 Budget and Grid Management Charge Initial Stakeholder Meeting
 2019 Budget and Grid Management Charge Initial Stakeholder Meeting July 24, 2018 Agenda Topic: Welcome and Introductions Presenter: Kristina Osborne 2019 Budget Process & GMC Rate Outlook April Gordon
QUARTERLY FINANCIAL REPORT March 31, 2018
 California Independent System Operator QUARTERLY FINANCIAL REPORT March 31, 2018 250 Outcropping Way Folsom, CA 95630 (916) 351-4000 CALIFORNIA INDEPENDENT SYSTEM OPERATOR CORPORATION QUARTERLY FINANCIAL
Updates & Milestones re: Peak Demand Reduction. EEAC Consultants (with PA contributions) (Revised, 3/13/17)
 (Revised, 3/13/17)") Updates & Milestones re: Peak Demand Reduction EEAC Consultants (with PA contributions) (Revised, 3/13/17) Key Work Streams in 2016-2018 Following the Analytical Framework Cost-Effectiveness Framework
Updates & Milestones re: Peak Demand Reduction EEAC Consultants (with PA contributions) (Revised, 3/13/17) Key Work Streams in 2016-2018 Following the Analytical Framework Cost-Effectiveness Framework
Two-Tier Allocation of Bid Cost Recovery
 Two-Tier Allocation of Bid Cost Recovery Jordan Curry Market Design & Regulatory Policy Developer December 21, 2015 Agenda Time Topic Presenter 1:00 1:05 Introduction Kim Perez 1:05 2:00 Purpose and Background
5.2 Transmission Congestion Credit Calculation Eligibility.
 5.2 Transmission Congestion culation. 5.2.1 Eligibility. (a) Except as provided in Section 5.2.1(b), each FTR Holder shall receive as a Transmission Congestion Credit a proportional share of the total
FDD FIRM STORAGE SERVICE NORTHERN NATURAL GAS COMPANY
 FDD FIRM STORAGE SERVICE NORTHERN NATURAL GAS COMPANY FIRM STORAGE SERVICE OPTIONS Northern s firm storage service is provided pursuant to the FDD Rate Schedule located in Northern s FERC Gas Tariff. The
Cost Estimation of a Manufacturing Company
 Cost Estimation of a Manufacturing Company Name: Business: Date: Economics of One Unit: Manufacturing Company (Only complete if you are making a product, such as a bracelet or beauty product) Economics
Development of Economy and Financial Markets of Kazakhstan
 Development of Economy and Financial Markets of Kazakhstan National Bank of Kazakhstan Macroeconomic development GDP, real growth, % 116 112 18 14 1 113,5 11,7 216,7223,8226,5 19,8 19,8 19,3 19,619,7 199,
1st Qua u r a ter e M e M e e t e in i g 2nd Qua u r a ter e M e M e e t e in i g
 2012 SERTP Welcome SERTP 2012 First RPSG Meeting & Interactive Training Session 1 2012 SERTP The SERTP process is a transmission planning process. Please contact the respective transmission provider for
Organization of MISO States Response to the Midwest ISO October Hot Topic on Pricing
 Organization of MISO States Response to the Midwest ISO October Hot Topic on Pricing I. Day Ahead and Real Time Energy and Ancillary Services Pricing Prices that Accurately Reflect the Marginal Cost of
Review of Registered Charites Compliance Rates with Annual Reporting Requirements 2016
 Review of Registered Charites Compliance Rates with Annual Reporting Requirements 2016 October 2017 The Charities Regulator, in accordance with the provisions of section 14 of the Charities Act 2009, carried
LOAN MARKET DATA AND ANALYTICS BY THOMSON REUTERS LPC
 LOAN MARKET DATA AND ANALYTICS BY THOMSON REUTERS LPC GLOBAL LOAN MARKET DATA AND ANALYTICS BY THOMSON REUTERS LPC Secondary Market Bid Levels: Europe Slide 2 European CLO New Issue Volume Monthly Slide
Financial Analysis Shows Conowingo Revenues Insufficient to Fund Additional Sediment Mitigation
 Exelon Generation Media Statement Information Contact: Deena O Brien, Exelon Regional Communications Manager, 610-765-5331 Financial Analysis Shows Conowingo Revenues Insufficient to Fund Additional Sediment
Factor Leave Accruals. Accruing Vacation and Sick Leave
 Factor Leave Accruals Accruing Vacation and Sick Leave Factor Leave Accruals As part of the transition of non-exempt employees to biweekly pay, the UC Office of the President also requires standardization
Illinois Job Index Note: BLS revised its estimates for the number of jobs and seasonal adjustment method at the beginning of 2010.
 Illinois Job Index Release Data Issue 4/21/2010 Jan 1990 / Mar 2010 Note: BLS revised its estimates for the number of jobs and seasonal adjustment method at the beginning of 2010. For April Illinois Job
PHOENIX ENERGY MARKETING CONSULTANTS INC. HISTORICAL NATURAL GAS & CRUDE OIL PRICES UPDATED TO July, 2018
 Jan-01 $12.9112 $10.4754 $9.7870 $1.5032 $29.2595 $275.39 $43.78 $159.32 $25.33 Feb-01 $10.4670 $7.8378 $6.9397 $1.5218 $29.6447 $279.78 $44.48 $165.68 $26.34 Mar-01 $7.6303 $7.3271 $5.0903 $1.5585 $27.2714
Electric Price Outlook for Indiana High Load Factor (HLF) customers December 2016
 customers December 2016") Electric Price Outlook for Indiana High Load Factor (HLF) customers December 2016 Price projection We project our prices for High Load Factor customers to increase 4 to 6 percent in 2017 compared to 2016.
Electric Price Outlook for Indiana High Load Factor (HLF) customers December 2016 Price projection We project our prices for High Load Factor customers to increase 4 to 6 percent in 2017 compared to 2016.
OTHER DEPOSITS FINANCIAL INSTITUTIONS DEPOSIT BARKAT SAVING ACCOUNT
 WEIGHTAGES JAN FEB MAR APR MAY JUN JUL AUG SEPT OCT NOV DEC ANNOUNCEMENT DATE 19.Dez.14 27.Jän.15 24.Feb.15 26.Mär.15 27.Apr.15 26.Mai.15 25.Jun.15 28.Jul.15 26.Aug.15 23.Sep.15 27.Okt.15 25.Nov.15 MUDARIB
May 3, Dear Ms. Bordelon:
 Entergy Services, Inc. 639 Loyola Avenue (70113) P.O. Box 61000 New Orleans, LA 70161-1000 Tel 504 576 4122 Fax 504 576 5579 Michael J. Plaisance Senior Counsel Legal Services - Regulatory May 3, 2018
ATTACHMENT Q PJM CREDIT POLICY
 ATTACHMENT Q PJM CREDIT POLICY C. Financial Transmission Right Auctions Credit requirements described herein for FTR activity are applied separately for each customer account of a Market Participant. FTR
Fiscal Year 2018 Project 1 Annual Budget
 Fiscal Year 2018 Project 1 Annual Budget Table of Contents Table Page Summary 3 Summary of Costs Table 1 4 Treasury Related Expenses Table 2 5 Summary of Full Time Equivalent Table 3 6 Positions Cost-to-Cash
The introduction of new methods for price observations in the Consumer Price Index (CPI) New methods for airline tickets and package holidays
 New methods for airline tickets and package holidays") Statistics Netherlands Economics, Enterprises and NA Government Finance and Consumer Prices P.O.Box 24500 2490 HA Den Haag The Netherlands The introduction of new methods for price observations in the
Statistics Netherlands Economics, Enterprises and NA Government Finance and Consumer Prices P.O.Box 24500 2490 HA Den Haag The Netherlands The introduction of new methods for price observations in the
CPA Australia Plan Your Own Enterprise Competition
 Financial Plan Your financial plan should include: 1. A list of Start-Up Costs and how these will be paid for (eg from savings, bank loan or family loan) 2. A Breakeven Analysis, which includes: a list
VALLEY CLEAN ENERGY ALLIANCE. Staff Report Item 12. Mitch Sears, Interim General Manager Gary Lawson, Sacramento Municipal Utility District (SMUD)
") VALLEY CLEAN ENERGY ALLIANCE Staff Report Item 12 TO: FROM: SUBJECT: Valley Clean Energy Alliance Board Mitch Sears, Interim General Manager Gary Lawson, Sacramento Municipal Utility District (SMUD) Procurement
VALLEY CLEAN ENERGY ALLIANCE Staff Report Item 12 TO: FROM: SUBJECT: Valley Clean Energy Alliance Board Mitch Sears, Interim General Manager Gary Lawson, Sacramento Municipal Utility District (SMUD) Procurement
Enhancements to Bidding Requirement
 ICAP Spot Market Auction Enhancements to Bidding Requirement Sheri Prevratil Manager, Corporate Credit New York Independent System Operator Credit Policy Working Group March 16, 2012 KCC Conference Center
1.2 The purpose of the Finance Committee is to assist the Board in fulfilling its oversight responsibilities related to:
 Category: BOARD PROCESS Title: Terms of Reference for the Finance Committee Reference Number: AB-331 Last Approved: February 22, 2018 Last Reviewed: February 22, 2018 1. PURPOSE 1.1 Primary responsibility
PRESS RELEASE. Securities issued by Hungarian residents and breakdown by holding sectors. October 2018
 PRESS RELEASE 10 December 2018 Securities issued by Hungarian residents and breakdown by holding sectors October 2018 According to securities statistics, the amount outstanding of equity securities and
Long-Term Reliability Assessment
 Long-Term Reliability Assessment Key Findings and Long-Term Issues John Moura, Director of Reliability Assessment Topics Covered Today Background on NERC s Long-Term Reliability Assessment Emerging and
Uplift Charges, FTR Underfunding and Overallocation
 Uplift Charges, FTR Underfunding and Overallocation Solutions in PJM Getting to Yes on Uplift Allocation Fixing FTR Funding Abram W. Klein 9 October 2014 Platts Nodal Trader Conference New York City Discussion
California ISO Report. Regional Marginal Losses Surplus Allocation Impact Study
 California ISO Report Regional Surplus Allocation Impact Study October 6, 2010 Regional Surplus Allocation Impact Study Table of Contents Executive Summary... 3 1 Issue and Background... 3 2 Study Framework...
FUEL PRICE RISK MANAGEMENT POLICY REPORT "FUEL HEDGE"
 FUEL PRICE RISK MANAGEMENT POLICY REPORT "FUEL HEDGE" Sep-18 FUEL PRICE RISK MANAGEMENT POLICY REPORT Sep-18 (Office of Management and Budget 09/30/2018) The Fuel Price Risk Management Policy approved
FERC EL Settlement Agreement
 FERC EL05-121-009 Settlement Agreement Ray Fernandez Manager, Market Settlements Development Market Settlements Subcommittee June 14, 2018 Settlement Agreement Details Settlement Agreement Details FERC
U.S. Natural Gas Storage Charts
 U.S. Natural Gas Storage Charts BMO Capital Markets Commodity Products Group November 26, 214 Total U.S. Natural Gas in Storage 5, Total Stocks This Week 3432 4, 3, 2, 1, Reported On: November 26, 214
Executive Summary. July 17, 2015
 Executive Summary July 17, 2015 The Revenue Estimating Conference adopted interest rates for use in the state budgeting process. The adopted interest rates take into consideration current benchmark rates
Electric Price Outlook for Indiana High Load Factor (HLF) customers September 2015
 customers September 2015") Electric Price Outlook for Indiana High Load Factor (HLF) customers September 2015 Price projection Duke Energy Indiana s prices continue to drop for the fourth quarter of 2015. Depending on your total
Electric Price Outlook for Indiana High Load Factor (HLF) customers September 2015 Price projection Duke Energy Indiana s prices continue to drop for the fourth quarter of 2015. Depending on your total