The Agricultural Workforce
|
|
|
- Joleen Cross
- 5 years ago
- Views:
Transcription
1
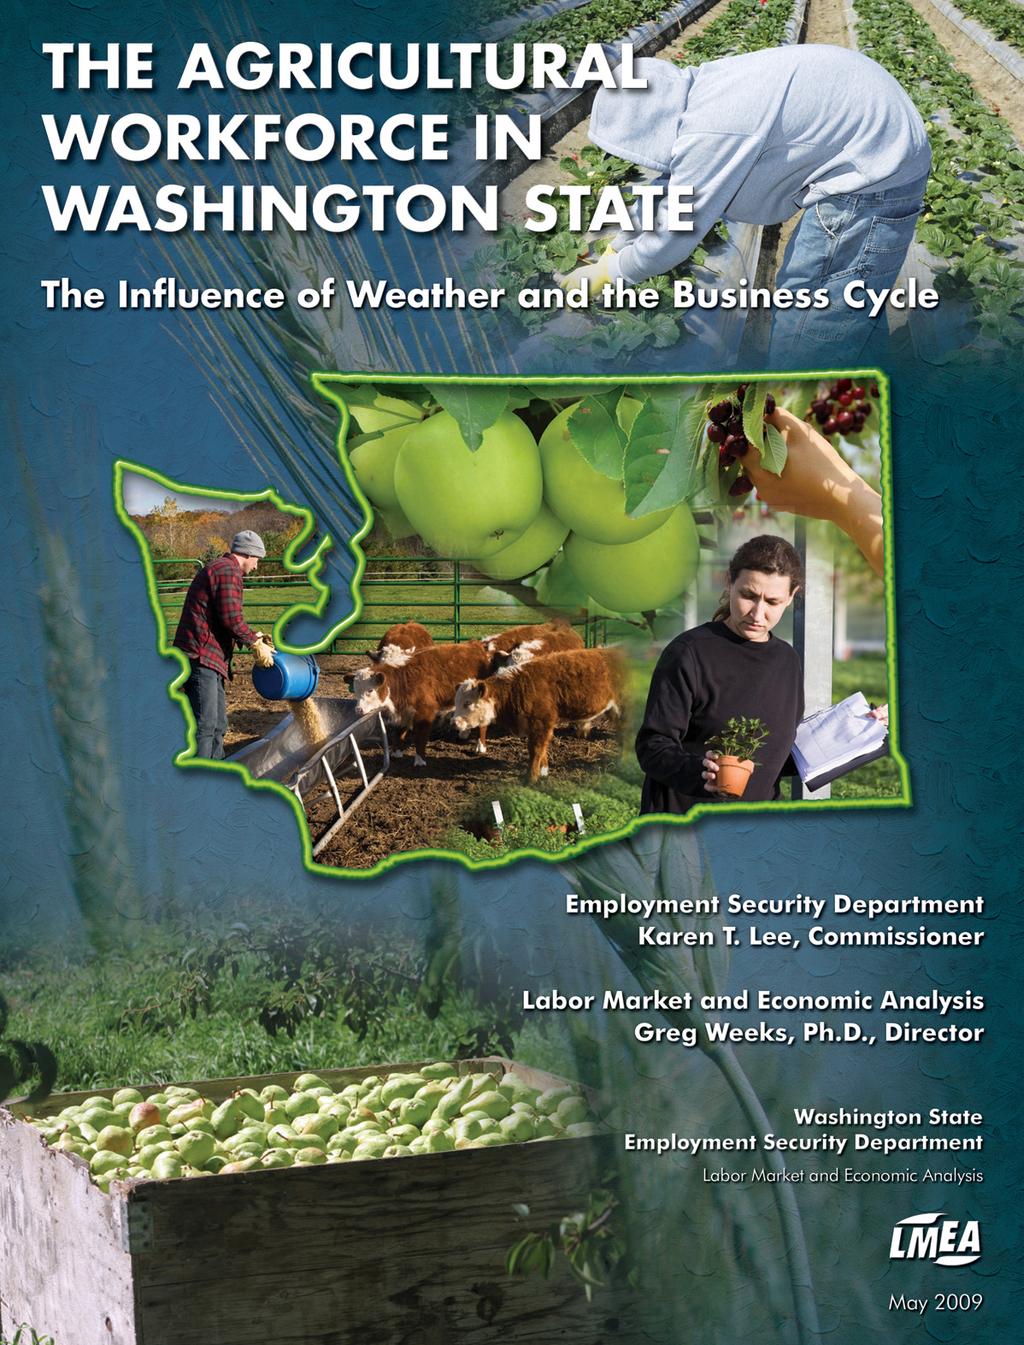
2 The Agricultural Workforce in Washington State The Influence of Weather and the Business Cycle Washington State Employment Security Department Karen T. Lee, Commissioner Labor Market and Economic Analysis (LMEA) Greg Weeks, Ph.D., Director By Ernst W. Stromsdorfer, Ph.D., Economist John H. Wines, Economic Analyst Presented at: The Conference on Immigration Reform: Implications for Farmers, Farm Workers, and Communities University of California Davis Department of Agriculture and Resource Economics University of California D.C. Center Washington, D.C. May 21 and 22, 2009
3 Foreword This study is based on Chapters 3 and 4 of the report on the 2008 Agricultural Workforce in Washington State. It has been prepared in accordance with RCW The full report will be available July 2009 online at the following web address: The authors would like to acknowledge the significant support and advice they have received in the preparation of this report. David Wallace, Economist, LMEA, in particular gave significant advice and guidance to the authors. But we owe sincere thanks to many other colleagues in LMEA as well. The authors are responsible for the analysis and any conclusions there from. These conclusions do not reflect the policy of the Labor Market and Economic Analysis branch of the Washington State Employment Security Department. i
4 Contents Introduction... 1 The Seasonal Agricultural Labor Shortage Situation in Plan of the Paper... 2 Weather... 2 The State Economy... 3 Employment... 3 Nonseasonal and Seasonal Agricultural Employment in Washington State... 3 Seasonal Agricultural Employment by Region and Crop... 4 The State... 4 Agricultural Areas... 4 Crops... 5 Average Weekly Hours Worked... 5 Hours Worked per Week Regional Comparisons... 5 Unemployment... 5 Agricultural County, MSA, and MD Unemployment Rates, 2008 versus Estimates of Unemployed Workers Available for Work... 7 Total Employment Levels and Seasonal Changes... 8 Job Vacancies... 9 Job Vacancies Economy-wide... 9 Job Vacancies Statewide, April 2008 versus Job Vacancies Statewide, October 2008 versus Job Vacancies by Industry Statewide Job Vacancies in Direct Production Agriculture H-2A Certifications: United States Compared to Washington State The National Picture The State Picture ii
5 Contents Unemployment Compensation Claimants: Agriculture Compared to Nonagriculture Continued Claimants by Selected Agricultural Sub-Sectors Continued Claimants Compared to Seasonal Agricultural Employment Average Hourly Earnings and Wage Rates Summary Average Hourly Earnings at the Regional Level Change in Average Hourly Earnings, Apples, Cherries, and Pears, Washington State, 2007 to Cumulative Percent Change in Average Hourly Earnings Current Dollar Cumulative Percent Change Constant Dollar Cumulative Percent Change Average Hourly Wage Rate Changes Summary and Conclusions Endnotes Bibliography Appendices Appendix Figure 1: Total Agricultural Employment by MSA, MD, and by County, Washington State, Calendar Year Appendix Figure 2: Continued Claimants for Unemployment Compensation, Agriculture and Nonagriculture Industries, Monthly Data Unduplicated by Individual, Washington State, 2005 to Appendix Figure 3: Paired Year-by-Year Comparisons of Current Dollar Average Hourly Wage Rate Increases for Seasonal Agricultural Labor, Washington State, 2003 to Appendix Figure 4: Paired Year-by-Year Comparisons of Constant Dollar Average Hourly Wage Rate Increases for Seasonal Agricultural Labor, 2000 = 100, Washington State, 2003 to iii
6
7 The Agricultural Workforce in Washington State: The Influence of Weather and the Business Cycle Introduction Washington state s agricultural producers operate in a world of severe risk and uncertainty. Due to the narrow windows for performing various agricultural operations, particularly the harvest of crops like sweet cherries, they are perennially concerned about the potential shortage of labor. 1 This anxiety is enhanced by the daily vagaries of weather and concern over the direction of federal policy on immigration. Articles in the various journals that report on the state s agricultural industry bear this out. In any given year there may be a dozen or more articles expressing concern over the available seasonal and migrant labor supply, as occurred in 2005, to just one or two articles, as occurred in A review of the 2005 and 2006 news articles revealed that there was no clear, consistent understanding as to the cause and extent of this shortage. Is the shortage frictional in nature, leading to spot shortages in labor across regions in the state and among a relatively small number of employers? Did the employers raise the real wage offer and still experience a shortage? If not, what did they mean by shortage? Or, is the shortage long run in nature, a function of federal and state immigration policy and enforcement, plus other long-term economic conditions in the United States and countries that are sources of agricultural labor for the United States? However, as of 2007 there appeared an increasing awareness among certain leaders in the agricultural industry of the distinction between a frictional, spot shortage and a long-term, secular shortage. Since 2005, concern in the industry has shifted to the latter issue, especially due to the heated national policy debate on unauthorized workers and illegal immigration. In 2008, there was no general concern about frictional labor shortage. One article appeared that reported on a serious concern about the direction of federal immigration policy with respect to on-site inspections of work sites. No such inspections were reported in 2008 statewide. One inspection occurred early this winter 2009 in a food processing firm, having been scheduled during the Bush Administration. No more have been conducted. The Seasonal Agricultural Labor Shortage Situation in 2008 Figure 1 shows the grower perceptions of spot shortage during the 2007 and 2008 growing and harvest season in Washington state. This figure sets the context for the discussion in this paper. These data are based on a monthly survey of agricultural producers in Washington state. As can be seen, perceived monthly frictional, spot shortages were at a minimum. Figure 1 Seasonal Agricultural Employment Shortage, in Percent, Weighted by Labor Force Size of Employer Reporting Washington State, 2007 and 2008 Source: LMEA/ESD, Monthly Agricultural Labor Employment and Wage Survey 7.0% 6.0% 5.0% 4.0% 3.0% 2.0% 1.0% 0.0% Jan Feb Mar Apr May Jun Jul Aug Sep Oct Nov Dec

8 The major surge in the demand for seasonal workers in Washington typically begins in the late spring to early summer. It slacks off in August and picks up sharply in September through October, petering out in November. With this pattern of demand in mind, note that the situation of perceived shortage in 2008 was much different from that in In 2007, the perceived shortage in June was reported as 6.6 percent employers report having 6.6 percent fewer workers than they desired. In June 2008, the shortage was reported as 2.0 percent. In September 2007, the shortage was reported as 6.4 percent, but for September 2008, the perceived shortage was 1.3 percent. The data for both 2007 and 2008 indicate that there were frictional spot shortages but no general shortage of seasonal agricultural labor. The data for the 2008 surge period represent extremely low spot shortages. The remainder of this paper discusses the possible reasons for this change in the agricultural labor market supply conditions for 2008 relative to Plan of the Paper We first discuss the conditions affecting the agricultural economy in the state the weather and the business cycle. We then report on the detailed aspect of employment and unemployment in the state. Workers employed, hours worked, and average hourly earnings are analyzed to show the impact of the worsening economy and the weather on the equilibrium quantities of supply, demand, and average hourly earnings for agricultural labor. Conclusions follow. land wheat, pea, and lentil farming, to tree farming, nursery and greenhouse products, to harvesting hops, apples, raspberries, cranberries, mushrooms and sweet corn, to list only a few. Poor weather can affect the output of the capital-intensive and land-extensive crops like wheat and dry peas, but the weather s impact on labor supply and demand for these crops is minimal across the state relative to total seasonal migrant labor supply and demand. In terms of its impact on the demand for seasonal migrant labor, weather has its greatest influence on the more labor-intensive crops that have narrow windows for pollination and harvesting. The dominant users of seasonal, migrant labor are the growers of apples, pears, and cherries. Of these, apples create the largest surge in seasonal migrant labor demand. Cherries, a highly profitable crop, are very sensitive to the weather. Sharp surges or drop offs in demand for the cherry harvest due to weather have been common in the past several years. It turns out that 2008 was a bad year for cherries and pears and excellent for apples. A mid-april frost and cool, wet spring weather affected pollination of cherries and pears. June was cold and wet. In the spring it was feared that the apple crop would also be seriously damaged. However, this concern over the apple harvest did not materialize. The fall apple harvest and late growing season turned out to be close to ideal, yielding the largest crop in Washington history. Demand for labor dropped off in cherries and pears and increased and was sustained late in the fall for apples. Apparently, all or nearly all of the marketable crops for all apple varieties were successfully harvested. Weather Weather dominates the concerns of agricultural producers in Washington. The weather s effects differ by crop, which then affect the demand for seasonal, migrant labor. There is an extremely broad range of production in the state, ranging from dry 2

9 The Influence of Weather and the Business Cycle The State Economy Both nonseasonal and seasonal employment show a bi-modal surge over the calendar year. This surge starts initially in May for nonseasonal workers and in June for seasonal workers. It peaks for both types of labor in July. Employment then falls off for both in August. Finally, the second phase of the surge begins in September for both types of labor. The current business cycle began in 2007 Q Q1 for the national economy. The impact of the business cycle in Washington became noticeable by the end of the second quarter of For example, employment in residential construction began trending down in January 2008, but it did not trend down in non-residential construction until July For January 2008, there were 177,691 unemployed workers in the state. This rose to 248,535 workers by December From March 2008 through February 2009, construction and manufacturing accounted for 39.6 percent of new Unemployment Insurance (UI) beneficiaries. Exhaustion rates on UI benefits, after trending down through all of 2007, began trending up in February There is much wider variation over the growing and harvest season in seasonal than in nonseasonal labor. For seasonal workers, the maximum difference in labor demanded each month varies from its lowest point of 11,832 workers in January to 62,047 in July a surge of 50,215 workers. This was an increase by a factor of percent, if you will. In contrast, the surge in nonseasonal workers varies from its low of 34,609 in April to a high of 51,280 in July a surge of 16,671 workers and a percentage surge of 48.2 percent. The total surge in July of unduplicated workers was 59,959 workers for Employment Nonseasonal and Seasonal Agricultural Employment in Washington State Figure 2 displays total nonseasonal and seasonal agricultural employment for calendar year 2008 based on data from the Quarterly Census of Employment and Wages (QCEW). These QCEW data are population counts that relate only to workers eligible to receive state Unemployment Insurance benefits. Even if these workers have multiple agricultural employers, they are counted only once in the totals for employment over the measurement period.2 Figure 2 Total, Nonseasonal and Seasonal Agricultural Employment Washington State, 2008 by Month Source: QCEW Agricultural Employment January February March April May June July August September October November December Average Total 53,368 59,456 66,417 56,672 68,060 91, ,327 91, ,136 99,933 61,635 NonSeasonal 41,536 45,873 48,424 34,609 44,025 46,025 51,280 43,577 50,639 44,218 41,214 Seasonal 11,832 13,583 17,993 22,063 24,035 45,847 62,047 48,079 53,497 55,715 20,421 Note: Total agricultural employment includes ES-QCEW UI-covered employment only. 3 52,923 40,063 12,860 76,621 44,290 32,331
10 Thus, one can understand the concern of growers each season as they experience changing weather that affects the inexorable timing of field work and harvesting, plus their concern over other factors affecting their needed supply of labor, such as the business cycle and federal immigration policy. Seasonal Agricultural Employment by Region and Crop 3 Seasonal agricultural employment by region and crop is displayed in Figure 3. A three-year history is provided. Figure 3 Seasonal Agricultural Employment by Region and Crop Washington State, 2008 Compared to 2007 and 2006 Source: LMEA/ESD, Agricultural Labor Employment and Wages Survey The State For the state economy as a whole, seasonal agricultural employment, in terms of average annual worker-months, is holding at about 32,000 workers. Employment in 2008 was 1.4 percent higher than employment in 2006 and 1.9 percent higher than Agricultural Areas Seasonal employment in the North Central Area showed a downward retreat from the historically early, large sweet cherry crop in Seasonal employment there is returning to recent historical levels. Seasonal employment over this three-year period was consistently trending up in the South Central, Columbia Basin, and South Eastern Areas Annual Average Annual Average Annual Average Seasonal Seasonal Seasonal Employment Employment Employment Change Percent Change Change Percent Change State Totals 32,014 31,842 32, % % Area Totals Western Area 4,071 3,730 3, % % South Central Area 9,314 9,437 9, % % North Central Area 8,510 8,435 7, % % Columbia Basin Area 4,606 4,735 4, % % South Eastern Area 5,118 5,150 5, % % Eastern Area % % Crop Totals Apples 15,478 14,697 18,741 3, % 4, % Cherries 5,902 5,044 3,392-2, % -1, % Pears 1,091 1, % % Other Tree Fruit 699 1, % % Grapes 1,183 1,342 1, % % Blueberries % % Raspberries 1, % % Strawberries % % Bulbs* * * 69 * * * * Hops , % % Nurseries* 1, , % % Wheat/Grain % % Asparagus 1, % % Cucumbers % % Onions % % Potatoes 1,186 1,268 1, % % Miscellaneous Vegetables % % Other Seasonal Crops 1,073 1,779 2,274 1, % % Note: *The conversion from Standard Industrial Classification (SIC) to North American Industry Classification System (NAICS) industry codes placed bulb growers into the nursery sector. 4

11 Crops Apple and Cherry production account for the bulk of the seasonal surge in agricultural employment. Apple production was up for 2008 relative to historical standards. Thus, 2008 seasonal employment was 17.4 percent above 2006 and 27.5 percent above The apple harvest extended into November during Seasonal employment in cherries continued to decline in 2007 and 2008 compared to the historically large sweet cherry crop in Pears also showed a steady decline over the 2006 to 2008 period. Crops that showed a steady increase over the three-year period were: grapes, blueberries, wheat/grain, potatoes, and other seasonal crops. Average Weekly Hours Worked Hours Worked per Week Regional Comparisons Figure 4 reports average weekly hours worked for the Pacific Region, California, and the United States except Alaska. 4 Over the past three years, even while total agricultural employment has been falling nationwide, average hours worked in the last three quarters of 2006, 2007, and 2008 hovered around 41 hours a week nationally. For this to happen, labor productivity in agriculture has to have been rising. 5 In California, average hours worked per week hovered around 45 hours, based on an average of the last three quarters of each year. In contrast, for the Pacific Region, average hours worked per week in the last three quarters of the year rose in 2008 compared to Again, weather is the most likely explanation. The apple harvest in Washington was late and a significant amount of the apple crop was picked in October, with the harvest finally ending in the first ten days of November. Figure 4 Average Weekly Hours Worked by Farm Labor Workers Pacific Region, California, and United States, 2006 to 2008 Source: U.S. Department of Agriculture, National Agricultural Statistics Service. cornell.edu/usda/nass/farmlabo//2000s/2008/farm- Labo txt and related sites. Average Weekly Hours Worked Pacific Region United States Washington and Oregon California Except Alaska 2006 January April July October Average Last 3 Quarters January n.a. n.a. n.a. April July October Average Last 3 Quarters January April July October Average Last 3 Quarters Note: n.a. = The January 2007 Farm Labor Survey was not conducted. Unemployment Agricultural County, MSA, and MD Unemployment Rates, 2008 versus 2007 Figure 5 shows the estimated monthly unemployment rates in key agricultural counties and selected metropolitan statistical areas (MSAs) and met- 5
12 ropolitan divisions (MDs) during peak growing and harvesting months. The data in this figure are estimated values, not sample statistics. Therefore, we take as strong evidence of change a difference in the estimated unemployment rate of at least onehalf (0.5) of one percent. Next, we are interested primarily in the direction of change, rather than the absolute value of any given estimate. A focus on the direction of change gives one some idea of the supply and demand direction in which labor markets are moving. Finally, we contrast the key growing counties with the official statistical areas, since the official statistical areas represent large regional labor markets and will draw labor from rural areas during periods of economic expansion. There are 84 month-by-year comparisons in Figure 5. Only three of these show an estimated increase in unemployment between 2007 and 2008 that is less than 0.5 percent. These are Benton County, for July, and Seattle MD for May and June. Fifty-nine of the month-by-year pairs show an increase in the estimated unemployment rate of 1.0 percent or better. Yakima MSA, a heavily agricultural region, suffered an increase in unemployment greater than 1.0 percent in all six month-to-year comparisons. In two months, June and August, the estimated unemployment rate for Yakima jumped 2.0 percent or more between the two years. This central portion of the state is where the surge in seasonal and migrant labor demand is concentrated. In sum, while these labor markets tightened for the same month-to-year comparisons for 2006 and 2007, they loosened considerably between 2007 and Figure 5 Comparison of Selected Unemployment Rates by Season, Selected Counties, MSAs, and MDs Washington State, 2007 and 2008 Source: Labor Market and Economic Analysis, Employment Security Department, Resident Civilian Labor Force and Employment, Benchmark: First Quarter Unemployment Rate May June July August September October County, MD or MSA Key Agricultural Counties Benton Franklin Grant Okanogan Skagit Walla Walla MD/MSA 1 Bellingham MSA Bremerton MSA Olympia MSA Seattle MD Spokane MSA Tacoma MSA Wenatchee MSA Yakima MSA Notes: 1 MD = Metropolitian Division; MSA = Metropolitan Statistical Area. 2 Bellingham, Wenatchee, and Yakima MSAs are significant agricultural labor markets. 6
13 Estimates of Unemployed Workers Available for Work The unemployment rate provides a common metric by which to compare different regions, industries, and time periods, while the number of unemployed individuals provides a picture of the workers available and willing to work at current wage rates. Figure 6 shows the unemployed workers available for work, when comparing January with the peak employment month for selected key agricultural counties, MDs, and MSAs, for 2007 and Take, for example, Benton County. In 2007, January unemployment was estimated to be 5,320 workers. By the peak month in 2007 of employment for that county, unemployed workers declined to 3,570, for a net drop in the unemployed of 1,750. These 1,750, and undoubtedly some other entrants to the labor force over that time period, were absorbed into the employed labor force. However, the picture for Benton County was considerably different in While January 2008 unemployment declined to 5,090 compared to 5,320 in 2007, by the 2008 peak month, only an additional 240 unemployed workers were absorbed into the employed labor force. An estimated 4,850 were still unemployed and available for work! This picture is consistent among all of the key agricultural counties, MDs, and MSAs. Indeed, in some cases, the number of unemployed increased between January and the peak employment months, indicating a very loose labor market in those areas. All in all, for the key agricultural counties in 2007 there were 11,240 unemployed workers in the peak employment months while for 2008, there were 15,760. For the MDs and MSAs, there were 109,180 unemployed workers in This number was 136,070 in the peak employment months for Figure 6 Total Unemployed Workers Available for Work, January versus Peak Employment Month Washington State, Selected Counties, MSAs, and MDs, 2007 and 2008 Source: LMEA/ESD, Resident Civilian Labor Force and Employment, Benchmark: First Quarter Difference: Difference: Increase or Increase or Peak Decrease in Peak Decrease in January Employment Months Unemployment January Employment Months Unemployment Key Agricultural Counties Benton 5,320 3,570-1,750 5,090 4, Franklin 2,990 1,410-1,580 2,670 2, Grant 3,570 1,710-1,860 3,380 2,250-1,130 Okanogan 1, ,480 1, Skagit 3,360 2, ,350 3, Walla Walla 1,870 1, ,760 1, Total 18,910 11,240-7,670 17,730 15,760-1,970 MD/MSA 1 Bellingham MSA 2 5,340 3,960-1,380 5,290 6, Bremerton MSA 6,140 5,000-1,140 5,860 6,900 1,040 Olympia MSA 6,400 5,160-1,240 7,060 7, Seattle MD 59,020 48,270-10,750 64,520 62,490-2,030 Spokane MSA 13,750 9,430-4,320 14,310 15,440 1,130 Tacoma MSA 20,690 16,820-3,870 23,990 26,810 2,820 Wenatchee MSA 2 3,980 2,290-1,690 4,030 3, Yakima MSA 2 10,300 5,320-4,980 9,010 7,200-1,810 Total 142, ,180-33, , ,070 2,000 Notes: 1 MD = Metropolitian Division; MSA = Metropolitan Statistical Area. 2 Bellingham, Wenatchee, and Yakima MSAs are significant agricultural labor markets. 7
14 Unemployment increased between 2007 and 2008 in all of the key labor markets from which agricultural producers could draw their labor force. Total Employment Levels and Seasonal Changes To complete the labor market picture for the state, Figure 7 compares the employed labor force for the 2008 seasonal surge with the surge in Again, take Benton County as an example. January 2008 employment in Benton County was 81,660 workers. It rose to 89,330 workers by the peak month of June 2008, for an increase in employment of 7,670 workers. But, for the same period comparison in 2007, the employment gain was 11,110 workers. The surge in 2007 was 14.4 percent while the surge was only 9.4 percent in The same picture holds between the two years for all key agricultural counties except Walla Walla. It holds for all MDs and MSAs. For all key agricultural counties in 2007 the average surge was a 15.9 percent increase in employment. This average surge fell to 12.2 percent in For all MDs and MSAs, the surge in employment was 5.1 percent in 2007 and only 1.8 percent in Again, this evidence points to a general loosening of the labor market between 2007 and Figure 7 Total Employment, January to Peak Employment Month Seasonal Surge Washington State, Selected Counties, MSAs, and MDs, 2007 and 2008 Source: Labor Market and Economic Analysis, Employment Security Department, Resident Civilian Labor Force and Employment, Benchmark: First Quarter Key Agricultural Counties Calendar Year Compared to 2007 Peak Percent Percent January Employment Peak Employment Employment Difference Employment Employment Employment Month Employment Gain 2008 Gain Gain 2007 Gain 2008 Benton 81, ,330 7,670 11,110-3, % 9.4% Franklin 29, ,720 2,720 3,940-1, % 9.4% Grant 34, ,240 6,260 8,600-2, % 17.9% Okanogan 16, ,160 8,650 8, % 52.4% Skagit 55, ,870 1,480 2,490-1, % 2.7% Walla Walla 26, ,740 2,930 2, % 10.9% Total 244, ,060 29,710 37,380-7, % 12.2% MD/MSA 1 Bellingham MSA 2 103, ,650 2,120 5,230-3, % 2.0% Bremerton MSA 118, ,670 1,000 3,540-2, % 1.0% Olympia MSA 124, ,990 3,040 4,850-1, % 2.4% Seattle MD 1,404, ,403, ,730-48, % 0.0% Spokane MSA 223, ,240 4,720 9,150-4, % 2.1% Tacoma MSA 376, ,720 5,590 17,220-11, % 1.5% Wenatchee MSA 2 53, ,500 16,700 19,350-2, % 31.0% Yakima MSA 2 106, ,640 13,820 16,530-2, % 13.0% Total 2,512,030 2,558,230 46, ,600-77, % 1.8% Notes: 1 MD = Metropolitian Division; MSA = Metropolitan Statistical Area. 2 Bellingham, Wenatchee, and Yakima MSAs are significant agricultural labor markets. 8
15 Job Vacancies Reported job vacancies are another indicator of how loose or tight the labor market is. The greater the number of vacancies, the tighter the labor market. As vacancies dry up, the labor market loosens. We show first the state economy-wide situation; then the situation for statewide agriculture. 6 Job Vacancies Economy-wide Figures 8 and 9 show economy-wide job vacancy estimates for the state in April and October, 2007 and Vacancies by Workforce Development Areas (WDAs) are shown in Figure 8. The job vacancy survey is conducted twice a calendar year, in April and October. We compare job vacancies in 2008 with those reported in 2007, for each of the two months. Figure 8 Job Vacancy Data, Agriculture plus Nonagricultural Production Sectors, Workforce Development Areas (WDAs) Washington State, April 2007 and 2008 Source: Labor Market and Economic Analysis, Employment Security Department, Job Vacancy Survey Job Vacancies Statewide, April 2008 versus 2007 Statewide, vacancies fell by 12,703 vacancies for April between the two years a 14.5 percent drop. Nine of the 12 Workforce Development Areas recorded a drop in vacancies over the oneyear time period. Pacific Mountain WDA, Southwest Washington WDA, South Central Washington WDA, and the Benton-Franklin WDA showed increases in vacancies especially Benton-Franklin, a key agricultural area. Job Vacancies Statewide, October 2008 versus 2007 Six months later, in October, the situation changed considerably. Statewide vacancies are down 22,587 between 2008 and 2007 a 30.9 percent drop. For October, all WDAs showed a drop in reported job vacancies, from a high of 41.9 percent for Eastern Washington WDA to a low of 2.5 percent for the Spokane WDA (see Figure 9). This is further evidence of a general loosening of the state s labor market. April 2007 April 2008 Percent Difference in Drop in Percent Percent Percent Percent Percent Percent Vacancies Vacancies WDA Vacancies Full Time Permanent New Vacancies Full Time Permanent New Olympic 3,594 61% 79% 18% 3, % 86.3% 1.7% % Pacific Mountain 3,610 60% 79% 7% 4, % 88.9% 2.9% % NW Washington 5,517 59% 76% 8% 3, % 73.2% 3.6% -1, % Snohomish Co 6,686 65% 91% 5% 5, % 90.8% 4.2% % Seattle-King Co 40,158 75% 90% 7% 30, % 90.6% 3.2% -9, % Tacoma-Pierce Co 7,970 63% 85% 8% 6, % 93.2% 2.9% -1, % SW Washington 3,950 65% 87% 6% 4, % 93.0% 2.0% % N Central Washington 4,290 48% 41% 36% 3, % 58.1% 6.6% % S Central Washington 2,173 70% 85% 7% 2, % 78.1% 2.2% % Eastern Washington 2,044 62% 79% 22% 1, % 81.7% 6.2% % Benton-Franklin Co s 1,779 71% 85% 5% 3, % 46.4% 1.2% 1, % Spokane 5,600 68% 87% 7% 5, % 84.8% 3.4% % Statewide 87,447 68% 84% 9% 74, % 85.2% 3.2% -12, % Note: Percentages may not equal 100 due to rounding. 9

16 Figure 9 Job Vacancy Data, Agricultural plus Nonagricultural Production Sectors, Workforce Development Areas (WDAs) Washington State, October 2007 and 2008 Source: Labor Market and Economic Analysis, Employment Security Department, Job Vacancy Survey October 2007 October 2008 Percent Difference in Drop in Percent Percent Percent Percent Percent Percent Vacancies Vacancies WDA Vacancies Full Time Permanent New Vacancies Full Time Permanent New Olympic 2,564 60% 93% 6% 1,628 58% 83% 5% % Pacific Mountain 3,547 53% 81% 6% 2,832 51% 76% 4% % NW Washington 3,922 65% 88% 9% 2,493 62% 76% 9% -1, % Snohomish Co 5,971 69% 84% 4% 4,569 52% 86% 9% -1, % Seattle-King Co 33,212 73% 90% 5% 20,084 75% 88% 7% -13, % Tacoma-Pierce Co 7,704 67% 91% 3% 5,539 60% 79% 4% -2, % SW Washington 3,185 55% 82% 4% 2,345 62% 85% 11% % N Central Washington 2,724 50% 68% 11% 1,891 66% 70% 5% % S Central Washington 2,337 64% 82% 6% 1,421 61% 93% 10% % Eastern Washington 1,769 43% 67% 5% 1,043 63% 69% 16% % Benton-Franklin Co s 1,641 64% 90% 2% 1,270 56% 77% 13% % Spokane 4,588 60% 85% 10% 4,474 59% 92% 7% % Statewide - October 73,180 67% 87% 5% 50,593 65% 85% 7% -22, % Note: Percentages may not equal 100 due to rounding. Job Vacancies by Industry Statewide Statewide vacancies by industry are shown in Figure 10. Agriculture, forestry, fishing and hunting showed a vacancy drop of 64.1 percent for October 2008 compared to October 2007! Construction, an industry that agricultural workers migrate to over time, showed a job vacancy drop of 59.0 percent between the two years. Manufacturing, another industry sector to which agricultural workers tend to migrate, showed a drop in vacancies of 46.2 percent. Finally, accommodation and food services showed a drop of 30.5 percent. Thus, based on these employer survey data, we again can determine that the statewide labor market has loosened considerably between 2007 and These four industry sectors that are known to hire a considerable portion of unauthorized workers nationwide 7 accounted for a total drop in job vacancies between the two years of 7,406 openings. This combined industry sector drop was 32.8 percent of the total drop in statewide job vacancies between the two years. 10

17 Figure 10 Job Vacancies by Industry Washington State, October 2007 and 2008 Source: Labor Market and Economic Analysis, Employment Security Department, Job Vacancy Survey October 2007 October 2008 Percent Percent Percent Difference in Drop in Full Percent Percent Full Percent Percent Vacancies Vacancies Industry Vacancies Time Permanent New Vacancies Time Permanent New Agri., Forestry, Fishing and Hunting 1,648 30% 21% 21% % 17% 2% -1, % Mining 33 93% 100% 0% Less than 25 87% 100% 37% Less than 8 More than -24.2% Utilities % 100% 3% % 100% 5% % Construction 3,126 95% 94% 12% 1,283 83% 79% 11% -1, % Manufacturing 4,725 96% 91% 6% 2,541 96% 95% 20% -2, % Wholesale Trade 2,207 95% 98% 8% 1,413 89% 96% 17% % Retail Trade 12,230 36% 62% 9% 7,231 38% 52% 3% -4, % Transportation and Warehousing 1,399 88% 91% 3% 1,201 74% 68% 8% % Information 3,777 94% 98% 3% 2,765 93% 92% 6% -1, % Finance and Insurance 2,868 88% 99% 3% 1,607 85% 100% 7% -1, % Real Estate and Rental and Leasing % 99% 11% % 82% 4% % Professional and Technical Services 7,202 85% 94% 4% 3,925 85% 88% 17% -3, % Mgmt. of Companies and Enterprises 1,048 76% 99% 1% % 92% 3% % Administrative and Waste Services 3,012 81% 87% 4% 2,072 84% 93% 11% % Educational Services 3,320 53% 81% 0% 2,978 27% 69% 3% % Health Care and Social Assistance 14,479 63% 94% 3% 14,409 70% 97% 4% % Arts, Entertainment, and Recreation 1,700 61% 92% 0% % 93% 0% -1, % Accommodation and Food Services 7,605 47% 97% 3% 5,282 40% 90% 6% -2, % Other Services, except Public Admin. 2,040 73% 94% 6% 1,301 67% 97% 10% % Statewide - October 73,180 67% 87% 5% 50,593 65% 85% 7% -22, % Note: Percentages may not equal 100 due to rounding. Job Vacancies in Direct Production Agriculture Figure 11 displays job vacancy data for the direct agricultural production sector. Survey estimates for April 2008 reported a total of 3,986 vacancies in agricultural jobs statewide. This is an increase of 1,241 vacancies over April 2007 a 45.2 percent increase. In contrast, survey estimates for October 2007 report a total of 1,648 vacancies for the sample period (see Figure 12). The number of vacancies reported in October 2008 is estimated at 592. This represents a drop by a factor of 2.78, or 278 percent. Only 2 percent of the job openings reported in October 2008 are classified as new jobs, in contrast to 21 percent of the vacancies reported as new jobs in October Thus, the agricultural labor market is loosening, based on these vacancy estimates. 11
18 Figure 11 Job Vacancy Data for the Direct Production Agriculture Industry (NAICS 11), by Workforce Development Areas (WDAs) Washington State, April 2007 and Source: Labor Market and Economic Analysis, Employment Security Department, Job Vacancy Survey April 2007 April 2008 Difference in Percent Percent Percent Percent Percent Percent Vacancies WDA Vacancies Full Time Permanent New Vacancies Full Time Permanent New Olympic % 50% 50% 8 0.0% 0.0% 0.0% -7 Pacific Mountain % 75% 0% % 33.3% 2.6% 64 NW Washington % 8% 3% % 3.1% 0.0% -84 Snohomish Co 47 44% 28% 6% % 96.8% 0.0% 22 Seattle-King Co % 75% 0% % 0.8% 3.6% 325 Tacoma-Pierce Co * * * * % 83.3% 34.0% * SW Washington % 60% 0% % 88.9% 5.1% 2 N Central Washington 1,983 26% 5% 70% 1, % 31.2% 0.2% -766 S Central Washington % 8% 8% % 6.6% 0.0% 55 Eastern Washington 2 100% 100% 100% % 2.4% 9.7% 111 Benton-Franklin Co s 68 53% 53% 16% * 0.0% 0.0% 0.0% * Spokane 35 67% 27% 7% % 9.1% 0.0% -16 Statewide - April 2,745 30% 9% 52% 3, % 13.4% 1.0% 1,241 Notes: 1 These job vacancy estimates are based on a scientific sample of all industries in the state. Agriculture is a relatively small industry sector. Therefore, weighted estimates of job vacancies statewide are more reliable than those estimates for the WDAs. Percentages may not equal 100 due to rounding. * = Insufficient data to project a WDA estimate of vacancy. Figure 12 Job Vacancy Data for the Direct Production Agriculture Industry (NAICS 11), by Workforce Development Areas (WDAs) Washington State, October 2007 and Source: Labor Market and Economic Analysis, Employment Security Department, Job Vacancy Survey October 2007 October 2008 Difference in Percent Percent Percent Percent Percent Percent Vacancies WDA Vacancies Full Time Permanent New Vacancies Full Time Permanent New Olympic 4 100% 100% 0% * * * * * Pacific Mountain * * * * 63 14% 32% 9% * NW Washington % 100% 100% <25 0% 0% 0% * Snohomish Co % 100% 100% <25 100% 100% 0% Up to -12 Seattle-King Co % 71% 71% <25 25% 50% 0% Up to Tacoma-Pierce Co 4 100% 100% 100% * * * * * SW Washington % 100% 100% <25 100% 100% 0% * N Central Washington % 13% 13% 296 7% 6% 1% -331 S Central Washington % 20% 20% 61 17% 70% 0% -184 Eastern Washington 520 2% 2% 2% 112 2% 0% 0% -408 Benton-Franklin Co s 22 83% 83% 83% <25 33% 67% 33% * Spokane * * * * <25 60% 100% 40% * Statewide - October 1,648 30% 21% 21% % 17% 2% Notes: 1 These job vacancy estimates are based on a scientific sample of all industries in the state. Agriculture is a relatively small industry sector. Therefore, weighted estimates of job vacancies statewide are more reliable than those estimates for the WDAs. Percentages may not equal 100 due to rounding. * = Insufficient data to project a WDA estimate of vacancy. 12

19 H-2A Certifications: United States Compared to Washington State The National Picture The number of H-2A certified workers is beginning to matter in the overall agricultural employment picture. In 2008, as in 2007, there were increased threats of shutting down the border between Mexico and the United States along with threats of increased prosecution of employers who knowingly hire unauthorized workers. This has resulted in increased H-2A requests for foreign agricultural workers even though the effective wage rate for these workers is well above the median wage rate in Washington state agriculture. 8 See Figure 13. Figure 13 H-2A Certifications United States, Fiscal Years 2004 to 2008 Source: United States Department of Labor, H-2A Certification, and the Office of Foreign Labor Certification for 2008 Data Percent Change Percent Change Year Employers Year-toYear Workers Year-toYear ,691 44, , , , , , , , , Employer requests increased sharply in 2007, with an increase of 14.4 percent in employer certifications. This increase continued in 2008, with 7,943 employers being certified, an increase of 6.0 percent over The request for workers began accelerating in 2006, with a 22.2 percent increase in certified workers over Calendar year 2007 saw the number of certified workers increase by 30.0 percent over Calendar year 2008 sees the number of certified workers increasing by 22.9 percent over The number of certified foreign workers stood at 94,445 in The National Agricultural Statistics Service (NASS) estimated the agricultural labor force at 996,000 in Thus, certified workers now comprise 9.5 percent of the hired and contract labor in agriculture nationwide. This is beginning to become a very relevant proportion in terms of national migrant labor policy. In addition, a conservative estimate is that at least 50 percent of the above labor force is unauthorized 498,000 workers. Certified workers represent 19 percent of that estimate an even more policyrelevant proportion. The State Picture There are dramatic proportional shifts for Washington state as well. In 2007 growers were certified to hire 1,525 foreign workers. In 2008, growers requested 3,257 workers (as of October 2008) and 2,568 of these were certified. This is an increase of 68.4 percent in one year. However, just 2,094 of these workers worked exclusively in Washington a 37.3 percent increase relative to These numbers are still small relative to the summer surge in employment which ranges up to 60,000 worker-months in mid-summer compared to January employment. And, not all of that surge of 70,000 workers can support the Adverse Economic Wage Rate and attendant labor costs. 13
20 Unemployment Compensation Claimants: Agriculture Compared to Nonagriculture A final approach to view the issue of the changing demand for labor and the labor market s ability to respond to potential labor shortage is to compare the unduplicated claims for unemployment compensation benefits in direct production agriculture with those claims in the nonagricultural sector of the Washington economy. Figures 14 and 15 display the historical picture from the 2005 to 2008 calendar year. Figure 14 shows the year-by-year comparison of continued claimants for agriculture. The state labor market began tightening between 2003 and This pattern continued for 2005 through Note that the line graphs for each respective year are lower as we move from 2005 to There are fewer continuing claims, suggesting that employer demand is soaking up some of the agricultural workers who have been collecting unemployment compensation. Figure 14 Continued Claimants for Unemployment Compensation, Agriculture, Monthly Data Unduplicated by Individual Washington State, 2005 to 2008 by Month Source: LMEA/ESD, UI Data Warehouse, Appendix 2 Number of Continued Claimants 7,500 6,500 5,500 4,500 3,500 2,500 1, Jan Feb Mar Apr May Jun Jul Aug Sep Oct Nov Dec The picture changes for 2008, but not by much. As we near the end of 2008 and the recession starts hitting the state economy, we see continued claims for 2008 higher than those for 2007, but equal to or lower than those for 2006 and 2005, respectively. Appendix Figure 2 shows an annual monthly average of 3,143 continued claimants in agriculture for This average rises to just 3,368 for Figure 15 shows the year-by-year comparison of continued claimants for the nonagricultural sector of the economy. On average, after dropping steadily from 2005 to 2007, in 2008 continued claimants rose to an annual average of 88,496 a 37.7 percent increase over 2007! Viewing the situation another way, in January 2008, continued claimants were 89,849; in December 2008, continued claimants were 149,278. This is an absolute increase of 59,429 workers. Over the same period, continued claimants in agriculture rose from 5,044 to 5,672 just 628 workers! Figure 15 Continued Claimants for Unemployment Compensation, Nonagriculture, Monthly Data Unduplicated by Individual Washington State, 2005 to 2008 by Month Source: LMEA/ESD, UI Data Warehouse, Appendix 2 Number of Continued Claimants 150, , , , , ,000 90,000 80,000 70,000 60,000 50,000 Jan Feb Mar Apr May Jun Jul Aug Sep Oct Nov Dec In summary, continued claimants are rising in agriculture, suggesting an annual drop off in demand for agricultural workers of a small amount. At the same time, the available workers in the nonagricultural sector have increased by more than 59,000. Some of these can move over to agricultural employment. 14

21 Continued Claimants by Selected Agricultural Sub-Sectors Figure 16 displays the changes in continued claimants by selected agricultural sectors. From calendar year 2005 to 2007, continued claimants dropped consistently for all sectors displayed except crop preparation services, farm management services, and animal specialty services. In short, the labor market was generally tightening over this three-year period. Between 2007 and 2008 calendar years the labor market continued to tighten by a small amount for deciduous tree fruits; continued claimants dropped by 160, or 3.4 percent. However, the labor market loosened up for all other reported sectors in 2008 except vegetables and melons, potatoes, wheat, farm management services, and dairy farms. In sum, this picture of the agricultural industry showed a consistent loosening of its labor market across most sub-sectors between 2007 and Continued Claimants Compared to Seasonal Agricultural Employment Figure 17 displays the relationship between continued claimants and seasonal employment, monthly, for the 2005 to 2008 period. The data reveal a tightening of the state agricultural labor market year-by-year for the first six months from 2005 to August and September also show a tightening of the market over that period. On average for the year, continued claimants dropped from 12.9 percent of the seasonal labor force in 2005 to 10.7 percent and then to 9.9 percent for Figure 16 Continued Claimants by Selected Agricultural Industry, Annual Data Grouped by Industry, then Unduplicated by Individual Selected Industries Reflect Those with the Highest Four-Year Total Washington State, 2005 to 2008 Source: Labor Market and Economic Analysis, Employment Security, UI Data Warehouse, Continued Claims Table Continued Continued Annual Change Continued Annual Change Continued Annual Change Industry Claimants Claimants 2006/2005 Claimants 2007/2006 Claimants 2008/2007 Deciduous Tree Fruits 6,436 5, % 4, % 4, % Crop Preparation Services 3,256 3, % 3, % 3, % Field Crops 1,174 1, % 1, % 1, % Ornamental Floriculture % % % General Farms % % % Grapes % % % Vegetables and Melons % % % Potatoes % % % Wheat % % % Berry Crops % % % Farm Management Services % % % Farm Labor Contractors % % % Animal Specialty Services % % % Dairy Farms % % % 15
22 Figure 17 Seasonal Pattern of Continued Claimants 1 in Agriculture Compared to the Seasonal Component of Employment in Agriculture 2 Washington State, 2005, 2006, 2007, and 2008 Source: Continued Claimants UI Unduplicated Continued Claimant Data, Labor Market and Economic Analysis, Employment Security Department, Data Warehouse Seasonal Employment, Agricultural Labor Employment and Wage Trends Survey Continued Continued Continued Continued Claimants as Claimants as Claimants as Claimants as a Percent of a Percent of a Percent of a Percent of Cont. Seasonal Seasonal Cont. Seasonal Seasonal Cont. Seasonal Seasonal Cont. Seasonal Seasonal Month Claimants Empl. Employment Claimants Empl. Employment Claimants Empl. Employment Claimants Empl. Employment January 6,982 9, % 6,187 12, % 5,494 11, % 5,044 11, % February 4,618 14, % 4,144 15, % 4,006 15, % 4,197 13, % March 3,868 17, % 3,555 19, % 3,398 19, % 3,131 17, % April 4,057 20, % 3,788 22, % 3,447 24, % 3,465 22, % May 3,668 22, % 2,958 24, % 2,987 23, % 3,230 24, % June 2,282 58, % 2,396 51, % 2,259 53, % 3,202 45, % July 2,602 52, % 1,816 67, % 1,760 63, % 2,012 62, % August 3,631 39, % 3,156 42, % 2,821 41, % 3,396 48, % September 1,542 50, % 1,407 49, % 1,127 54, % 1,637 53, % October 1,976 46, % 1,449 49, % 1,479 47, % 1,282 55, % November 4,933 14, % 4,465 16, % 3,965 13, % 4,150 20, % December 5,977 10, % 5,658 12, % 4,970 11, % 5,672 14, % Monthly 3,845 29, % 3,415 32, % 3,143 31, % 3,368 32, % Average Notes: 1 Unduplicated continued claimants are individuals who have filed at least one UI claim. They are an unduplicated count of persons legally eligible to register for waiting period credit or requesting benefit payment(s) for one or more weeks of unemployment. This is the single most comprehensive measure of individuals in the UI system at any one point in time. 2 Agricultural employment is defined as workers attached to NAICS 111, Crop Production; 112, Animal Production; 1151 Support Activities for Crop Production; and, 1152 Support Activities for Animal Production and 2007, respectively. In contrast, for 2008, continued claimants as a percent of the estimated seasonal agricultural employment increased for the year overall, rising to 10.4 percent compared to 9.9 percent in Average Hourly Earnings and Wage Rates Summary Year-to-year changes in the level of constant dollar average hourly earnings are the best evidence of a shift in demand, a shift in supply, or both, for agricultural labor. In our case, we know that equilibrium levels of agricultural labor supplied have increased by a small amount for the past three calendar years. And, average hours worked per week have apparently increased in 2008 relative to As we will see, constant dollar average hourly earnings, estimated from highly accurate UI Wage File data 9, have dropped somewhat for apples, cherries, and pears. For this to happen, while the overall equilibrium quantity of labor supplied and demanded increases by only a small amount, demand for labor has to have remained stable, or almost so, while the supply of labor has to have increased. Figure 18 depicts this hypothetical situation in the Washington agricultural labor market. 16
23 u The Influence of Weather and the Business Cycle Figure 18 Hypothetical Supply and Demand, Seasonal Agricultural Workers, 2008 Compared to 2007 Average Hourly Earnings, Constant Dollars W 2007 W 2008 O p Q ,842 Average Hourly Earnings at the Regional Level u Q ,453 Figure 19 compares current dollar average hourly earnings of agricultural field workers by region over the period July 2006 to July At the national level, current dollar average hourly earnings rose by 4.3 percent between July 2006 and July Consumer prices, measured by the CPI-W series, rose 2.9 percent during that time. So, the constant dollar or real agricultural average hourly earnings rose by 4.3 percent minus 2.9 percent, or 1.4 percent. For the period from July 2007 to July 2008, the current dollar average hourly earnings p S 2007 S 2008 D L 2007, 2008 u Quantity of Labor Supplied and Demanded for agricultural field workers rose by 3.8 percent. But the CPI-W rose by 4.0 percent, so real average hourly earnings of agricultural field workers actually fell between the two contrasting periods. For the Pacific Region, based on these survey data, the current dollar average hourly earnings rose by 1.5 percent between July 2006 and July 2007 and by 2.2 percent between July 2007 and July However, with inflation running at 2.9 percent and 4.0 percent, respectively, for the two pairs of comparison periods, the real or constant dollar average hourly earnings of agricultural field workers in Oregon and Washington actually fell based on this inspection. 10 California average earnings for agricultural field workers fluctuate more than do those for the Pacific Region. However, a comparison of average hourly earnings in July 2006 with those of July 2008 yielded a current dollar increase of 10.4 percent. Inflation over that period increased by 7.0 percent, so the real or constant dollar earnings increase was 10.4 percent minus 7.0 percent, or 3.4 percent. Over the three-year period, real or constant dollar agricultural field worker average hourly earnings rose in California and fell in the Pacific Region. Figure 19 Average Hourly Earnings of Hired Field Workers by Region, Current Dollars Selected Areas, July 2006 to July 2008 Sources: National Agricultural Statistics Service, U.S. Department of Agriculture and related sites. Average Hourly Earnings of Field Workers Excluding Agricultural Service Workers Current Dollars Percent Change in Current Dollars Area July 2006 July 2007 July 2008 July 2006 to July 2007 July 2007 to July 2008 United States Excluding Alaska Pacific Washington and Oregon California Mountain I Idaho, Montana, Wyoming Mountain II Colorado, Nevada, Utah Mountain III Arizona, New Mexico Note: A hired field worker is anyone, other than an agricultural service worker, who was paid for at least one hour of work on a farm spent planting, tending, and harvesting crops, including the operation of farm machinery on crop farms. The data reflect all ways that farm workers are paid, e.g., hourly, piece work, or any combination of the two. Average hourly earnings are calculated based on total earnings paid divided by total hours worked during the survey week. 17

24 Finally, over the three-year period, real average hourly earnings for agricultural field workers rose in the three Mountain Regions. This is true even for Mountain Region III, Arizona, and New Mexico, which are on the U.S.-Mexico border. Earnings levels are particularly high in Mountain Regions I and II. Other things equal, this fact will bid workers away from California, Oregon, and Washington. Change in Average Hourly Earnings, Apples, Cherries, and Pears, Washington State, 2007 to 2008 Given our knowledge about the current business cycle and harvest patterns in Washington state, what has been the picture with respect to average hourly earnings changes between 2007 and 2008? Figure 20 shows the harvest patterns over the period 2006 to Apple production rose sharply between 2007 and 2008 to its highest historical level of output. This increase in production was due in part to a late harvest season with favorable weather. The harvest season did not end until early in November. Sweet cherry production dropped sharply between 2007 and 2008 due to April freezes and cool spring weather that hampered pollination. Due to the same weather patterns that affected cherries, Bartlett pear production dropped by a small amount between 2007 and 2008, but other pear production dropped considerably more. Based on these data alone, one would expect employment demand to drop for sweet cherries and pears. The demand for labor to harvest apples would be expected to increase and then continue at a high employment level until late in the fall. 11 Earnings data should reflect these harvest conditions, other things equal. The one major factor which is not equal is the business cycle. An increase in the available labor supply for seasonal harvest work should have the effect, other things equal, of putting downward pressure on the wage rate. The data in Figure 19 show the combined effects of the harvest season and the business cycle in Figure 20 Harvest Production, Apples, Cherries, and Pears Washington State, 2006 to 2008 Source: U.S. Department of Agriculture, National Agricultural Statistics Service, Washington Field Office. AGRI-FACTS. Posted online January 27, 2009 Crop Utilized Production Fresh Market Processed Market and Year in Tons in Tons in Tons Apples ,775,000 2,175, , ,600,000 2,175, ,000 a a ,050,000 Sweet Cherries , ,000 45, , ,000 28,000\ ,000 85,000 15,000 Tart Cherries , , , Barlett Pears b ,000 54, , ,000 66,000 97, ,000 63,000 95,000 Other Pears c , , ,000 Notes: a Data to be published July 8, b Processed mostly canned, but includes small quantities dried and other uses not published separately to avoid disclosure of individual operations. c Processed mostly juice, but includes small quantities canned and other uses not published separately to avoid disclosure of individual operations. 18
25 The data in Figure 21 are consistent with the previous facts. Regardless of whether one compares current dollar average hourly earnings or constant dollar average hourly earnings, average hourly earnings fell between 2007 and 2008 for apples, cherries and pears. Figure 21 Comparison of Average Hourly Earnings, Apples, Cherries and Pears, Current and Constant Dollars, 2000 = 100, CPI-W, Two-tailed t-test Washington State, 2007 and 2008 Source: LMEA/ESD, Unemployment Insurance Wage Records Average Hourly Earnings Apples Cherries Pears Year 4th Quarter 3rd Quarter 4th Quarter Current Constant Notes: All pairs of yearly comparisons are statistically significantly different from each other at a probability greater than That is, the chances are less than one out of one thousand that the paired means are actually the same. Cumulative Percent Change in Average Hourly Earnings Figures 22, 23, and 24 display the cumulative percentage increases (decreases) in average hourly earnings for the three major tree fruits in Washington: apples (all varieties) cherries (sweet and tart combined), and pears (all varieties). Current Dollar Cumulative Percent Change Since 1994, average hourly earnings in cherries have increased steadily in current or nominal terms, with the exception of a drop in the percent increase between 2001 and After 2002, average hourly earnings rose steadily until 2005 at which time they increased sharply in current dollar terms until 2008, when they again decreased, as shown in Figure 23. It is important to remember that these data are average hourly earnings they are not average hourly wage rates. 12 It is entirely possible for a grower to pay a higher piece rate in order to induce pickers to stay in a lightly producing orchard, while the pickers earn less per hour due to the fact that they can pick fewer lugs of cherries in a given hour. In contrast, apples show a steady increase in current dollar average hourly earnings throughout the 15-year time series. Average hourly earnings in current dollars began to rise sharply between 2005 and 2006 and continued this increase into However, in 2008 average hourly earnings dropped by a few cents. The small drop was statistically significant. See Figure 22. Pears show a steady climb in percentage terms up to 2006 whereupon average hourly earnings rise sharply between 2006 and Current dollar average hourly earnings then drop between 2007 and Figure 22 Cumulative Percent Change in Average Hourly Earnings, Apples, Fourth Quarter Data, Current and Constant Dollars, Base Year = 2000, CPI-W Washington State, 1994 to 2008 Source: LMEA/ESD, Unemployment Insurance Wage Records Percent Change Apples % Change Current $ Apples % Change Constant $ 19

26 Figure 23 Cumulative Percent Change in Average Hourly Earnings, Cherries, Third Quarter Data, Current and Constant Dollars, Base Year = 2000, CPI-W Washington State, 1994 to 2008 Source: LMEA/ESD, Unemployment Insurance Wage Records Percent Change Figure 24 Cumulative Percent Change in Average Hourly Earnings, Pears, Fourth Quarter Data, Current and Constant Dollars, Base Year = 2000, CPI-W Washington State, 1994 to 2008 Source: LMEA/ESD, Unemployment Insurance Wage Records Percent Change Cherries % Change Current $ Cherries % Change Constant $ A dramatic change occurred in 2006, with good pollination weather linked to a later, extended harvest season. In constant dollar terms, average hourly earnings rose sharply in This sharp rate of increase was substantially repeated in Then, in 2008, adverse weather resulted in a relatively light crop while the available supply of labor increased. Thus, average hourly earnings dropped in real terms. Apples, too, showed no long-term positive increase in constant dollar average hourly earnings until about Then, real average hourly earnings rose a modest percentage in 2006, and 2007, and then dropped in Pears also showed no consistent increase in constant dollar average hourly earnings from 1994 through Then, real earnings rose for 2006 and increased sharply for 2007, whereupon they dropped in constant dollar terms for Average Hourly Wage Rate Changes We have limited information on the percent changes in current and constant dollar average hourly wage rates. These estimates are based on the ESD/ LMEA Agricultural Labor Employment and Wages survey conducted monthly over the calendar year. The time trend in constant dollars for the most recent six years is shown in Figure 25. Statistical detail on these average hourly wage rate estimates is shown in Appendix Figures 3 and 4. Pears % Change Current $ Pears % Change Constant $ Constant Dollar Cumulative Percent Change Constant dollar estimates of the percent change in average hourly earnings for cherries show no significant, consistent upward trend from 1994 to 20
Employment and Earnings in Agriculture and Industries with a High Concentration of Undocumented Workers Washington State, 2002 to 2009
 Employment and Earnings in and Industries with a High Concentration of Undocumented Workers Washington State, 2002 to 2009 Washington State Employment Security Department Labor Market and Economic Analysis
MARKET AREA UPDATE Report as of: 1Q 2Q 3Q 4Q
 Market Area (City, State):Greater Seattle, WA MARKET AREA UPDATE Report as of: 1Q 2Q 3Q 4Q Year:2012 Provided by (Company / Companies):Coldwell Banker Bain, Windermere, Prudential NW, John L. Scott What
Monthly Employment Report
 Washington 5.6% United States 5.0% Seasonally adjusted Employment estimates in this report are generated by the U.S. Bureau of Labor Statistics (BLS). Monthly employment estimates are subject to revision
Monthly Employment Report
 Washington 5.8% United States 4.9% Seasonally adjusted Employment estimates in this report are generated by the U.S. Bureau of Labor Statistics (BLS). Monthly employment estimates are subject to revision
NEW ORLEANS REGIONAL COUNCIL FOR BUSINESS ECONOMICS
 Monthly Non-Farm Employment Jan. 2008 Apr Jul Jan.2009 Jan. 2010 Jan.2011 Jan.2012 Jan.2013 Jan.2014 Jan. 2015 Jan. 2016 Jan.2017 2017 THE NEW ORLEANS REGIONAL ECONOMIC INDEX NEW ORLEANS REGIONAL COUNCIL
Monthly Employment Report
 Washington 4.5% United States 4.1% Seasonally adjusted Employment estimates in this report are generated by the U.S. Bureau of Labor Statistics (BLS). Monthly employment estimates are subject to revision
James K. Polk United States President ( ) Mecklenburg County NC
 Mecklenburg County NC") february 2006 James K. Polk United States President (1845-1849) Mecklenburg County NC http://www.whitehouse.gov/history/presidents/jp11.html January Highlights The Unemployment Rate (Seasonally Adjusted)
february 2006 James K. Polk United States President (1845-1849) Mecklenburg County NC http://www.whitehouse.gov/history/presidents/jp11.html January Highlights The Unemployment Rate (Seasonally Adjusted)
Monthly Employment Report
 Washington 4.5% United States 4.4% Seasonally adjusted Employment estimates in this report are generated by the U.S. Bureau of Labor Statistics (BLS). Monthly employment estimates are subject to revision
State of Ohio Workforce. 2 nd Quarter
 To Strengthen Ohio s Families through the Delivery of Integrated Solutions to Temporary Challenges State of Ohio Workforce 2 nd Quarter 2 0 1 2 Quarterly Report on the State of Ohio s Workforce Reference
Monthly Employment Report
 Washington 4.7% United States 4.1% Seasonally adjusted Employment estimates in this report are generated by the U.S. Bureau of Labor Statistics (BLS). Monthly employment estimates are subject to revision
Monthly Employment Report
 Washington 4.5% United States 4.1% Seasonally adjusted Employment estimates in this report are generated by the U.S. Bureau of Labor Statistics (BLS). Monthly employment estimates are subject to revision
Monthly Employment Report
 Washington 4.5% United States 4.0% Seasonally adjusted Monthly Employment Report January 2019 Employment estimates in this report are generated by the U.S. Bureau of Labor Statistics (BLS). Monthly employment
DEPARTMENT OF LABOR AND INDUSTRIAL RELATIONS. HAWAII'S UNEMPLOYMENT RATE AT 2.2 PERCENT IN SEPTEMBER Jobs Increase 11,600 Over the Year
 DEPARTMENT OF LABOR AND INDUSTRIAL RELATIONS FOR IMMEDIATE RELEASE October, 20 DAVID Y. IGE GOVERNOR LEONARD HOSHIJO DIRECTOR HAWAII'S UNEMPLOYMENT RATE AT 2.2 PERCENT IN SEPTEMBER Jobs Increase 11,600
DEPARTMENT OF LABOR AND INDUSTRIAL RELATIONS HAWAII'S UNEMPLOYMENT RATE AT NEW RECORD 2.0 PERCENT IN NOVEMBER
 DEPARTMENT OF LABOR AND INDUSTRIAL RELATIONS FOR IMMEDIATE RELEASE December 21, 20 D A V I D Y. I G E G O V E R N O R L E O N A R D H O S H I J O A C T I N G D I R E C T O R HAWAII'S UNEMPLOYMENT RATE
Monthly Employment Report
 Seasonally adjusted Washington 4.3% United States 3.7% Monthly Employment Report November 2018 Employment estimates in this report are generated by the U.S. Bureau of Labor Statistics (BLS). Monthly employment
Key Labor Market and Economic Metrics
 Key Labor Market and Economic Metrics May Update Incorporates Data Available on May 27 th, 2016 This reference is the result of a collaboration between the Bureau of Labor Market Information and Strategic
Monthly Employment Report
 Seasonally adjusted Washington 4.3% United States 3.9% Monthly Employment Report December 2018 Employment estimates in this report are generated by the U.S. Bureau of Labor Statistics (BLS). Monthly employment
A Labor Market Information Publication FOURTH QUARTER 2002
 A Labor Market Information Publication FOURTH QUARTER THE IOWA LABOR MARKET IN : AN ELUSIVE RECOVERY IN GENERAL, ECONOMIC CONDITIONS SHOWED SOME IMPROVEMENT IN, but the recovery that was expected to take
Indicators of the Kansas Economy
 Governor s Council of Economic Advisors Indicators of the Kansas Economy A Review of Economic Trends and the Kansas Economy 1000 S.W. Jackson St. Suite 100 Topeka, KS 66612-1354 Phone: (785) 296-0967 Fax:
Metro Area Unemployment Rates All Decline; Las Vegas Accounts for the Bulk of the Job Growth Over the Month
 SEPTEMBER SUB-STATE PRESS RELEASE For Immediate Release October 23, 2018 Metro Area Unemployment Rates All Decline; Las Vegas Accounts for the Bulk of the Job Growth Over the Month CARSON CITY, NV According
Monthly Labour Force Survey Statistics December 2018
 800 Monthly Labour Force Survey Statistics CALGARY CMA Table 282-0135 Labour force survey estimates (LFS), by census metropolitan area based on 2011 census boundaries, 3-month moving average, seasonally
Monthly Labour Force Survey Statistics November 2018
 800 Monthly Labour Force Survey Statistics CALGARY CMA Table 282-0135 Labour force survey estimates (LFS), by census metropolitan area based on 2011 census boundaries, 3-month moving average, seasonally
Nevada s Metro Areas Experience Drop in Unemployment in December
 For Immediate Release January 24, 2017 Nevada s Metro Areas Experience Drop in Unemployment in December CARSON CITY, NV The jobless rate in Las Vegas declined to 5 percent in December, down 0.2 percentage
NEW ORLEANS REGIONAL COUNCIL FOR BUSINESS ECONOMICS
 Monthly Non-Farm Job Additions THE NEW ORLEANS REGIONAL ECONOMIC INDEX NEW ORLEANS REGIONAL COUNCIL FOR BUSINESS ECONOMICS This report is the property of the New Orleans Regional Council for Business Economics
Unemployment Rates Declined in the Metro Areas in August
 For Immediate Release Sept.18, 2017 Unemployment Rates Declined in the Metro Areas in August CARSON CITY, NV Unemployment rates were down in all of the state s major population centers, both on a monthover-month
nc today october 2006 Photo courtesy of NC Division of Tourism, Film and Sports development. Linn Cove Viaduct, Blue Ridge Parkway, NC
 nc today october 2006 Photo courtesy of NC Division of Tourism, Film and Sports development. Linn Cove Viaduct, Blue Ridge Parkway, NC September Highlights North Carolina Unemployment Rate (Seasonally
LABOR SITUATION Office of Research
 Sharon Palmer Commissioner LABOR SITUATION Office of Research FOR IMMEDIATE RELEASE May 2013 Data CT Unemployment Rate = 8.0% US Unemployment Rate = 7.6% Nonfarm jobs rise 1,000 in May but the unemployment
South Georgia Business Outlook
 South Business Outlook Center for Business and Economic Research Langdale College of Business Valdosta State University Volume 4, Number 4 Fourth Quarter 28 The South Business Outlook is a quarterly publication
Nevada Adds 2,800 Jobs in September to 1,394,100 While Unemployment Remains Unchanged at 4.5%
 For Immediate Release October 17, 2018 SEPTEMBER STATEWIDE LABOR MARKET RELEASE Nevada Adds 2,800 Jobs in September to 1,394,100 While Unemployment Remains Unchanged at 4.5% CARSON CITY, NV - The state
NEVADA SUB-STATE LABOR MARKET OVERVIEW. October 2018
 RESEARCH AND ANALYSIS BUREAU BRIAN SANDOVAL GOVERNOR DON SODERBERG DIRECTOR DAVID SCHMIDT CHIEF ECONOMIST NEVADA SUB-STATE LABOR MARKET OVERVIEW October 2018 Statewide, seasonally adjusted employment increased
The State of Working Florida 2011
 The State of Working Florida 2011 Labor Day, September 5, 2011 By Emily Eisenhauer and Carlos A. Sanchez Contact: Emily Eisenhauer Center for Labor Research and Studies Florida International University
Allegan County Disaster Declaration Michigan SURE Disaster Payments Farm Bill
 2008 Farm Bill CROP INSURANCE and DISASTER Programs The New SURE Program Roger Betz District Extension Farm Management SW Michigan 2008 Michigan SURE Disaster Payments Many farmers have qualified for 2008
Annual Evaluation of the Hawaii Unemployment Compensation Fund
 Annual Evaluation of the Hawaii Unemployment Compensation Fund State of Hawaii Department of Labor and Industrial Relations December 2005 STATE OF HAWAII Linda Lingle, Governor DEPARTMENT OF LABOR AND
Metro Areas Show Moderate Employment Growth Over the Month with Trends Remaining Strong Over the Year
 AUGUST SUB-STATE PRESS RELEASE For Immediate Release September 25, 2018 Metro Areas Show Moderate Employment Growth Over the Month with Trends Remaining Strong Over the Year CARSON CITY, NV Statewide,
The Unemployment Rates Decline in September in Nevada s Metro Areas
 For Immediate Release October 25, 2016 The Unemployment Rates Decline in September in Nevada s Metro Areas CARSON CITY, NV In September, unemployment rates in all three of the Silver State s major population
USDA Risk Management Blueberry MPCI & Expansion Approval Canby, OR. January 17, 2013
 USDA Risk Management 2013 Blueberry MPCI & Expansion Approval Canby, OR January 17, 2013 USDA Risk Management Agency Formerly known as Federal Crop Insurance Corporation (FCIC) Spokane Regional Office
Annual Evaluation of the Hawaii Unemployment Compensation Fund
 Annual Evaluation of the Hawaii Unemployment Compensation Fund State of Hawaii Department of Labor & Industrial Relations December 2006 STATE OF HAWAII Linda Lingle, Governor DEPARTMENT OF LABOR AND INDUSTRIAL
SUMMARY OF SELECTED ECONOMIC INDICATORS
 SUMMARY OF SELECTED ECONOMIC INDICATORS RECENT DATA GRAPHS HISTORICAL DATA GRAPHS P.E.I. CONSUMER PRICE INDEX P.E.I. LABOUR FORCE STATISTICS CANADA/P.E.I. GROSS DOMESTIC PRODUCT, INCOME-BASED CANADA /
My name is Don Meseck, Regional Labor Economist, assigned to the Labor Market and Performance Analysis Branch (LMPA), Washington State Employment
, Washington State Employment") My name is Don Meseck, Regional Labor Economist, assigned to the Labor Market and Performance Analysis Branch (LMPA), Washington State Employment Security Department. I provide economic analysis services
My name is Don Meseck, Regional Labor Economist, assigned to the Labor Market and Performance Analysis Branch (LMPA), Washington State Employment Security Department. I provide economic analysis services
April 2019 VOLUME XIII NUMBER 4
 Southwest Florida Regional Economic Indicators April 2019 VOLUME XIII NUMBER 4 Regional Economic Research Institute Lutgert College Of Business 10501 FGCU Blvd. South Fort Myers, FL 33965 Phone 239-590-7090
Nevada s Unemployment Rate Down to 7.9 Percent in May
 For Immediate Release June 20, 2014 Nevada s Unemployment Rate Down to 7.9 Percent in May Carson City, NV Nevada s unemployment rate fell to a seasonally adjusted 7.9 percent in May, the lowest it has
Monthly Employment Report for June 2018
 Washington 4.7% United States 4.0% Seasonally adjusted Employment estimates in this report are generated by the U.S. Bureau of Labor Statistics (BLS). Monthly employment estimates are subject to revision
North Carolina s June Employment Figures Released
 For Immediate Release: July 22, For More Information, Contact: Kim Genardo/919.814.4610 North Carolina s Employment Figures Released RALEIGH The state s seasonally adjusted unemployment rate was 4.9 percent,
Washington State Employment Security Department Labor Market and Economic Analysis Branch. Released: March Washington State Employment Security
 Washington State Employment Security Department Labor Market and Economic Analysis Branch Released: Washington State Employment Security 2003 Employee Benefits Survey Released: Prepared by Carolyn Cummins,
Unemployment Rate Edges Lower to 5.0 Percent Employment Down in December
 Media Contact 609-984-2841 EMAIL: MediaCalls@dol.state.nj.us Unemployment Rate Edges Lower to 5.0 Percent Employment Down in December TRENTON, January 18, 2018 Preliminary monthly estimates released by
EMPLOYMENT AND EARNINGS
 L2- EMPLOYMENT AND EARNINGS U.S. Department of Labor Bureau of Labor Statistics October 997 In this issue: Third quarter 997 averages for household survey data Monthly Household Data Historical A-. Employment
North Carolina s April Employment Figures Released
 For Immediate Release: May 18, For More Information, Contact: Beth Gargan/919.814.4610 North Carolina s April Employment Figures Released RALEIGH The state s seasonally adjusted April unemployment rate
Nevada s Unemployment Rate Falls in October to 6.6 Percent Outlook is Positive for Holiday Hiring
 For Immediate Release Nov. 18, 2015 Nevada s Unemployment Rate Falls in October to 6.6 Percent Outlook is Positive for Holiday Hiring CARSON CITY, NV Nevada s unemployment rate dipped to a seasonally adjusted
South Central Alabama Comprehensive Economic Development Strategy
 South Central Alabama Comprehensive Economic Development Strategy August 2012 2013 Updated Excerpt CGI Group, Inc. in Troy Hyundai Motor Manufacturing Alabama in Montgomery Acknowledgements: Funding for
January 2014 Non-Manufacturing ISM Report On Business
 FOR RELEASE: February 5, 2014 Contact: Kristina Cahill Report On Business Analyst ISM, ROB Media Relations Tempe, Arizona 800/888-6276, Ext. 3015 E-mail: kcahill@ism.ws January 2014 Non-Manufacturing ISM
A LOOK AT CONNECTICUT S OLDER WORKERS
 BY NICHOLAS A. JOLLY, ECONOMIST, DOL H IGHLIGHTS AGING OF THE POPULATION The number of Connecticut residents who are 65 and older is projected to increase by 72% between 2005 and 2030, whereas those from
Nevada s Unemployment Rate Falls to 10.2 Percent in December
 For Immediate Release January 18, 2013 Nevada s Unemployment Rate Falls to 10.2 Percent in December For the month of December, Nevada saw a decline in its unemployment rate from 10.8 percent in November
HOUSTON-THE WOODLANDS-SUGAR LAND METROPOLITAN STATISTICAL AREA (H-W-S MSA) Visit our website at
 Visit our website at") Labor Market Information DECEMBER 2015 Employment Data HOUSTON-THE WOODLANDS-SUGAR LAND METROPOLITAN STATISTICAL AREA () Visit our website at www.wrksolutions.com The Houston-The Woodlands-Sugar Land Metropolitan
Labor Market Information DECEMBER 2015 Employment Data HOUSTON-THE WOODLANDS-SUGAR LAND METROPOLITAN STATISTICAL AREA () Visit our website at www.wrksolutions.com The Houston-The Woodlands-Sugar Land Metropolitan
Nevada s Metropolitan Areas Unemployment Rates Down Year over Year
 For Immediate Release August 25, 2015 Nevada s Metropolitan Areas Unemployment Rates Down Year over Year CARSON CITY, NV Nevada s metropolitan area unemployment rates all decreased year over year in July.
North Carolina s June Employment Figures Released
 For Immediate Release: July 20, For More Information, Contact: Beth Gargan/919.814.4610 North Carolina s Employment Figures Released RALEIGH The state s seasonally adjusted unemployment rate was 4.2 percent,
Nevada s Unemployment Rate Drops to 9 Percent
 For Immediate Release December 20, 2013 Nevada s Unemployment Rate Drops to 9 Percent Carson City, NV Nevada s unemployment rate fell to 9 percent in November, down from 9.3 percent in October, making
Business Optimism Survey Report Summer 2017
 Center for Economic and Business Research Business Optimism Survey Report Summer 2017 July 24, 2017 Student Author(s) Elena Rodriguez In Collaboration With Contents Executive Summary..3 Clarifying Notes
Michigan s January Unemployment Rate Moves Up Seasonally
 Labor Market News Michigan s March 2016 Vol. 72, Issue No. 1 Percent Michigan s January Unemployment Rate Moves Up Seasonally Michigan s unemployment rate (not seasonally adjusted) increased by 0.6 of
THE EMPLOYMENT SITUATION: MAY 2002
 Technical information: Household data: (202) 691-6378 USDL 02-332 http://www.bls.gov/cps/ Establishment data: 691-6555 Transmission of material in this release is http://www.bls.gov/ces/ embargoed until
Nevada Closes Out 2017 on a Strong Note; Unemployment Down Throughout the State
 DECEMBER SUB-STATE PRESS RELEASE January 23 rd, 2018 Nevada Closes Out 2017 on a Strong Note; Unemployment Down Throughout the State Statement from Bill Anderson, Chief Economist, Department of Employment,
2017 Annual Alberta Regional Labour Market Review
 2017 Annual Alberta Regional Labour Market Review Wood Buffalo-Cold Lake. Lethbridge-Medicine Hat Banff-Jasper-Rocky Mountain House and Athabasca-Grande Prairie-Peace River Edmonton. Red Deer. Calgary.
Nonfarm jobs slip 1,700 in December; unemployment rate declines to 4.4%
 Lincoln.dyer@ct.gov appears Office of Research Scott D. Jackson, Commissioner FOR IMMEDIATE RELEASE December 2016 Data CT Unemployment Rate = 4.4% US Unemployment Rate = 4.7% Nonfarm jobs slip 1,700 in
Table 1: Major Indicators of Labor Market Activity for New Jersey Seasonally Adjusted 2016 Benchmark Labor Force Data (resident)
") Table 1: Major Indicators of Labor Market Activity for New Jersey Seasonally Adjusted Benchmark Labor Force Data (resident) Current Month Previous Month One Year Ago Net Change Net Change Dec. 17 (P) Nov.
Table 1: Major Indicators of Labor Market Activity for New Jersey Seasonally Adjusted Benchmark Labor Force Data (resident) Current Month Previous Month One Year Ago Net Change Net Change Dec. 17 (P) Nov.
Nonfarm jobs fall by 2,000 in March; unemployment rate at 4.5%
 Lincoln.dyer@ct.gov appears Office of Research Scott D. Jackson, Commissioner FOR IMMEDIATE RELEASE March 2018 Data CT Unemployment Rate = 4.5% US Unemployment Rate = 4.1% Nonfarm jobs fall by 2,000 in
A. INTRODUCTION B. METHODOLOGY
 Chapter 14: Economic Conditions A. INTRODUCTION This chapter evaluates potential effects that the Proposed Project may have on economic conditions. The chapter provides a profile of the current population
2002 Washington State Labor Market and Economic Report. The Right Connection for Labor Market Information
 2002 Washington State Labor Market and Economic Report The Right Connection for Labor Market Information This report has been prepared in accordance with RCW 50.38.040 State of Washington Washington State
Athabasca Grande Prairie. Banff - Jasper - Rocky Mountain House. Edmonton. Calgary
 Athabasca Grande Prairie Wood Buffalo - Cold Lake Banff - Jasper - Rocky Mountain House Edmonton Calgary Lethbridge - Medicine Hat Highlights I. Alberta: Overview Alberta had the lowest unemployment rate
Employment Data (establishment)
") Table 1: Major Indicators of Labor Market Activity for New Jersey Seasonally Adjusted (thousands) Benchmark Labor Force Data (resident) Current Month Previous Month One Year Ago Net Change Net Change May
Table 1: Major Indicators of Labor Market Activity for New Jersey Seasonally Adjusted (thousands) Benchmark Labor Force Data (resident) Current Month Previous Month One Year Ago Net Change Net Change May
Positive Hourly Wage Rate Effects for California s Agricultural Workers from Increases of the State s Minimum Wage Don Villarejo, Ph.D.
 Positive Hourly Wage Rate Effects for California s Agricultural Workers from Increases of the State s Minimum Wage Don Villarejo, Ph.D. July 12, 2018 Policy discourse concerning changes of the minimum
SOUTHEASTERN LOUISIANA UNIVERSITY Economic Reporter
 SOUTHEASTERN LOUISIANA UNIVERSITY Promoting Economic Development in Southeast Louisiana NATIONAL U.S. Economy STATE Louisiana Economy Louisiana GDP Growth REGIONAL Employment Retail Sales Building Permits
State of California January 22, 2010 EMPLOYMENT DEVELOPMENT DEPARTMENT S. Bascom Ave. (408) Campbell, CA 95008
 Campbell, CA 95008") State of California EMPLOYMENT DEVELOPMENT DEPARTMENT Contact: Janice Shriver 2450 S. Bascom Ave. (408) 558-0689 Campbell, CA 95008 OAKLAND-FREMONT-HAYWARD METROPOLITAN DIVISION (MD) (ALAMEDA AND CONTRA
State of California EMPLOYMENT DEVELOPMENT DEPARTMENT Contact: Janice Shriver 2450 S. Bascom Ave. (408) 558-0689 Campbell, CA 95008 OAKLAND-FREMONT-HAYWARD METROPOLITAN DIVISION (MD) (ALAMEDA AND CONTRA
Mesa county Economic Update
 Mesa county Economic Update Provided by the Business Department of Colorado Mesa University Second Quarter 1 Economic Summary Contents The Mesa County economy is performing well with a 3.% unemployment
Economic Indicator Movement Status (Favorable/Unfavorable)
") Economic Indicator Movement Status (Favorable/Unfavorable) Monthly Unemployment Rate Weekly Job Advertisements Monthly Online Job Advertisements Monthly Domestic Building Activity Monthly Non-Domestic
Economic Indicator Movement Status (Favorable/Unfavorable) Monthly Unemployment Rate Weekly Job Advertisements Monthly Online Job Advertisements Monthly Domestic Building Activity Monthly Non-Domestic
Nonfarm jobs fall by 400 in February; unemployment rate unchanged at 3.8%
 Lincoln.dyer@ct.gov appears Office of Research Kurt Westby, Commissioner FOR IMMEDIATE RELEASE February 2019 Data CT Unemployment Rate = 3.8% US Unemployment Rate = 3.8% Nonfarm jobs fall by 400 in February;
Michigan s July Unemployment Rate Moves Up Seasonally
 Labor Market News Michigan s September 2016 Vol. 72, Issue No. 7 Percent Michigan s July Unemployment Rate Moves Up Seasonally Michigan s unemployment rate (not seasonally adjusted) increased by 0.5 of
FOLLOWING UNEMPLOYMENT INSURANCE CLAIMANTS THROUGH CONNECTICUT S THE RECESSION OCCASIONAL PAPER SERIES. Manisha Srivastava Economist, DOL OCTOBER
 FOLLOWING CONNECTICUT S UNEMPLOYMENT INSURANCE CLAIMANTS THROUGH THE RECESSION OCCASIONAL PAPER SERIES PREPARED BY Manisha Srivastava Economist, DOL Connecticut Department of Labor 200 Folly Brook Blvd.
Central Minnesota Economic and Business Conditions Report Second Quarter 2018
 Central Minnesota Economic and Business Conditions Report Second Quarter This issue is part of a series for the six planning areas of Minnesota Central, Northeast, Northwest, Southeast, Southwest, and
Investment Company Institute PERSPECTIVE
 Investment Company Institute PERSPECTIVE Volume 2, Number 2 March 1996 MUTUAL FUND SHAREHOLDER ACTIVITY DURING U.S. STOCK MARKET CYCLES, 1944-95 by John Rea and Richard Marcis* Summary Do stock mutual
Unemployment Rate Falls to 6.9 Percent in June
 For Immediate Release July 15, 2015 Unemployment Rate Falls to 6.9 Percent in June Carson City, NV Nevada unemployment rate fell to 6.9 percent in June, down from 7 percent in May and 7.8 percent a year
JANUARY 2019 VOLUME XIII NUMBER 1
 Southwest Florida Regional Economic Indicators JANUARY 2019 VOLUME XIII NUMBER 1 Regional Economic Research Institute Lutgert College Of Business 10501 FGCU Blvd. South Fort Myers, FL 33965 Phone 239-590-7090
NMI at 56% Business Activity Index at 61.5% New Orders Index at 58.3% Employment Index at 52.7%
 FOR RELEASE: 10:00 A.M. ET July 6, 2015 Contact: Kristina Cahill Report On Business Analyst ISM, ROB/Research Tempe, Arizona 800/888-6276, Ext. 3015 E-mail: kcahill@instituteforsupplymanagement.org DO
Slight Employment Increase Persists in Nevada Metro Areas as State s Industry Growth Continues
 APRIL SUB-STATE PRESS RELEASE For Immediate Release May 22, 2018 Slight Employment Increase Persists in Nevada Metro Areas as State s Industry Growth Continues CARSON CITY, NV According to the Department
Leading Economic Indicator Nebraska
 Nebraska Monthly Economic Indicators: August 19, 2016 Prepared by the UNL College of Business Administration, Department of Economics Authors: Dr. Eric Thompson, Dr. William Walstad Leading Economic Indicator...1
2010 Economic Forecast: U.S. and State Conditions
 2010 Economic Forecast: U.S. and State Conditions Russell R. Evans Director and Research Economist Center for Applied Economic Research Oklahoma State University Stillwater russell.evans@okstate.edu http://www.spears.okstate.edu/caer
Pendleton County Labor Market Summary Update November 2006
 1 Labor Market Summary Update November 26 Copyright 26 WVU Research Corporation College of Business and Economics West Virginia University www.bber.wvu.edu by George W. Hammond, Ph.D. Anthony Gregory This
Basics of Economic Data
 Basics of Economic Data Between the Decennial Census Years Community and Regional Planning 511: Mar. 2006 Kevin Kargacin University of New Mexico Bureau of Business and Economic Research kargacin@unm.edu
Grant County Labor Market Summary Update November 2006
 County Labor Market Summary Update November 26 Copyright 26 WVU Research Corporation College of Business and Economics West Virginia University www.bber.wvu.edu by George W. Hammond, Ph.D. Anthony Gregory
The Economic Base of Quay County, NM. PREPARED BY: The Office of Policy Analysis at Arrowhead Center, New Mexico State University.
 The Economic Base of Quay County, NM PREPARED BY: The Office of Policy Analysis at Arrowhead Center, New Mexico State University DATE: July 2015 The Economic Base of Quay County, New Mexico Introduction
Central Minnesota Economic and Business Conditions Report Fourth Quarter 2017
 St. Cloud State University therepository at St. Cloud State Central Minnesota Economic and Business Conditions Report Minnesota Regional Economic and Business Conditions Report 4-2018 Central Minnesota
Central Minnesota Economic and Business Conditions Report - Second Quarter 2017
 St. Cloud State University therepository at St. Cloud State Central Minnesota Economic and Business Conditions Report Minnesota Regional Economic and Business Conditions Report 10- Central Minnesota Economic
4 Scottish labour market
 4 Scottish labour market Andrew Ross, Fraser of Allander Institute This section provides an overview of key labour market data in Scotland and contrasts these with both UK performance and changes over
City of Modesto Economic Indicators December 2014 Edition
 City of Modesto Economic Indicators December 2014 Edition Steve Christensen City of Modesto Economic Outlook: City of Modesto The City of Modesto continues to slowly recover from the Great Recession. Some
SPOTSYLVANIA SOLAR ENERGY CENTER
 FEBRUARY 13, 2019 SPOTSYLVANIA SOLAR ENERGY CENTER ECONOMIC AND FISCAL CONTRIBUTION TO SPOTSYLVANIA COUNTY 4201 DOMINION BOULEVARD, SUITE 114 GLEN ALLEN, VIRGINIA 23060 804-346-8446 MANGUMECONOMICS.COM
North Carolina s January Employment Figures Released
 For Immediate Release: March 13, For More Information, Contact: Beth Gargan/919.814.4610 North Carolina s January Employment Figures Released RALEIGH The state s seasonally adjusted January unemployment
Central Minnesota Economic and Business Conditions Report - First Quarter 2017
 St. Cloud State University therepository at St. Cloud State Central Minnesota Economic and Business Conditions Report Minnesota Regional Economic and Business Conditions Report 7-2017 Central Minnesota
Nonfarm jobs fall by 500 in September; unemployment rate falls to 4.2%
 Lincoln.dyer@ct.gov appears Office of Research Kurt Westby, Commissioner FOR IMMEDIATE RELEASE September 2018 Data CT Unemployment Rate = 4.2% US Unemployment Rate = 3.7% Nonfarm jobs fall by 500 in September;
Oregon s Unemployment Rate Was Essentially Unchanged at 8.4 Percent in January, as Payroll Employment Grew by 4,200. Millions
 NEWS 875 Union Street NE Salem, Oregon 97311 PH: 503.947.1394 TTY-TDD 711 www.qualityinfo.org FOR IMMEDIATE RELEASE: March 5, 2013 PRESS CONFERENCE PRESENTER: Nick Beleiciks, State Employment Economist
VECTRA BANK 23 RD ANNUAL ECONOMIC FORECAST BREAKFAST START SMART IN 2016! Member FDIC VectraBank.com
 VECTRA BANK 23 RD ANNUAL ECONOMIC FORECAST BREAKFAST START SMART IN 2016! Member FDIC VectraBank.com Economic Presentation April 26, 2016 Tatiana Bailey, Ph.D. Director, UCCS Economic Forum A Little Humor
Florida: An Economic Overview
 Florida: An Economic Overview December 26, 2018 Presented by: The Florida Legislature Office of Economic and Demographic Research 850.487.1402 http://edr.state.fl.us Shifting in Key Economic Variables
Minnesota Minimum-Wage Report, 2015
 This document is made available electronically by the Minnesota Legislative Reference Library as part of an ongoing digital archiving project. http://www.leg.state.mn.us/lrl/lrl.asp Minnesota Minimum-Wage